Embed Size (px)
Citation preview

1
Strategy and the Capital Budgeting Decision
Lecture 3.1 Fall 2009
Advanced Corporate Finance
Ronald F. Singer
Financial Serenity Prayer
Grant me the Serenity to accept the things I cannot change,the Courage to change the things I canand the Wisdom to know the difference
• Grant me the Serenity to accept projects with positive NPV’s, the Courage to reject negative NPV projects, and the Wisdom to know the difference.
Topics Covered
• Look First To Market Values: Unless you think you are better than the market in using assets, assume the value of any asset to you is what the market will pay (i.e. have a zero NPV)
• Projects having positive NPV’s are projects that generate economic rents which come about because of your competitive advantage relative to the rest of the market
• If you cannot identify your competitive advantage, it is unlikely you can generate positive NPV from a project.
Market Values
• The reason for organizations called firms is that they are designed to generate and take advantage of competitive advantage: What are these advantages:– Special marketing advantage – Special distribution advantage – Special skills and patents– Superior organization
Market Values• Firms calculate project NPVs by discounting forecasted
cash flows, and ask:
• Are the (PV of) the benefits greater than the (PV of) the costs?
• But one must be careful not to generate positive NPV’s simply because of errors in judgment, overly optimistic expectations, etc.
• Projects may appear to have positive NPVs because of forecasting errors
Market Values
• Positive NPVs stem from a competitive advantage
• Strategic decision-making identifies this competitive advantage;
Market Values
• Consider alternatives as an on going decision.
• Start with the market price of the asset and ask whether it is worth more to you than to others.
• If you can’t identify why it would be worth more to you than others: Fahgettaboudit !
Market Values
• Don’t assume that other firms will watch passively.
Ask --How long a lead do I have over my rivals? What will happen to prices when that lead disappears
In the meantime how will rivals react to my move? Will they cut prices or imitate my product?
Pizza Hut
• Include in your analysis the opportunity cost of utilizing assets even if there is no explicit cash flow generated by the asset.
• The economic life of an asset may not be the same as the physical life of the asset.
Pizza Hut!!!
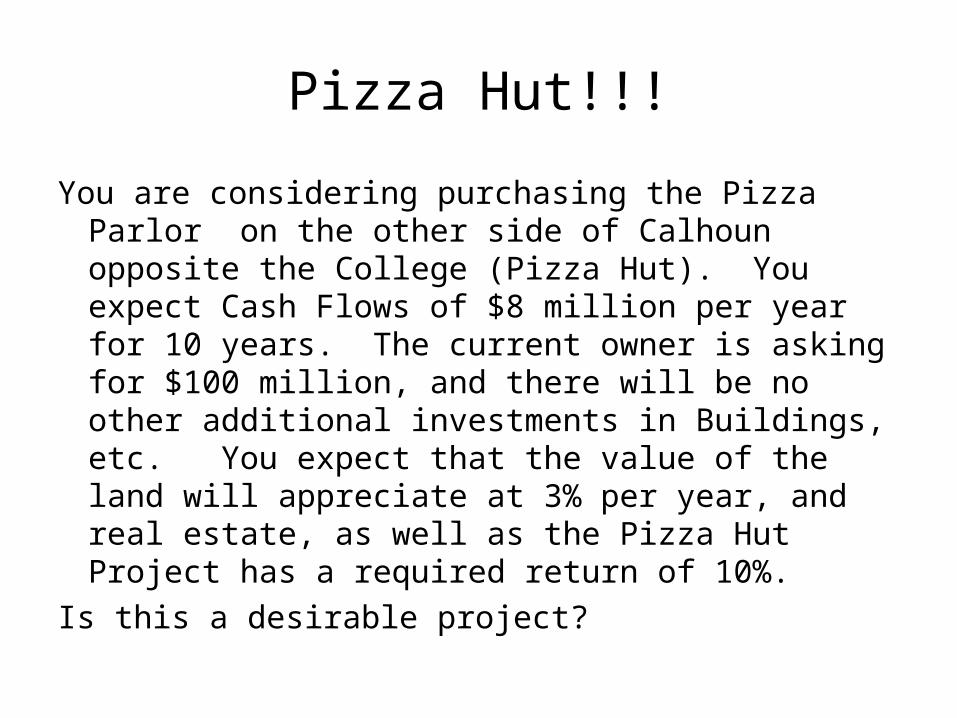
You are considering purchasing the Pizza Parlor on the other side of Calhoun opposite the College (Pizza Hut). You expect Cash Flows of $8 million per year for 10 years. The current owner is asking for $100 million, and there will be no other additional investments in Buildings, etc. You expect that the value of the land will appreciate at 3% per year, and real estate, as well as the Pizza Hut Project has a required return of 10%.
Is this a desirable project?
Pizza Hut
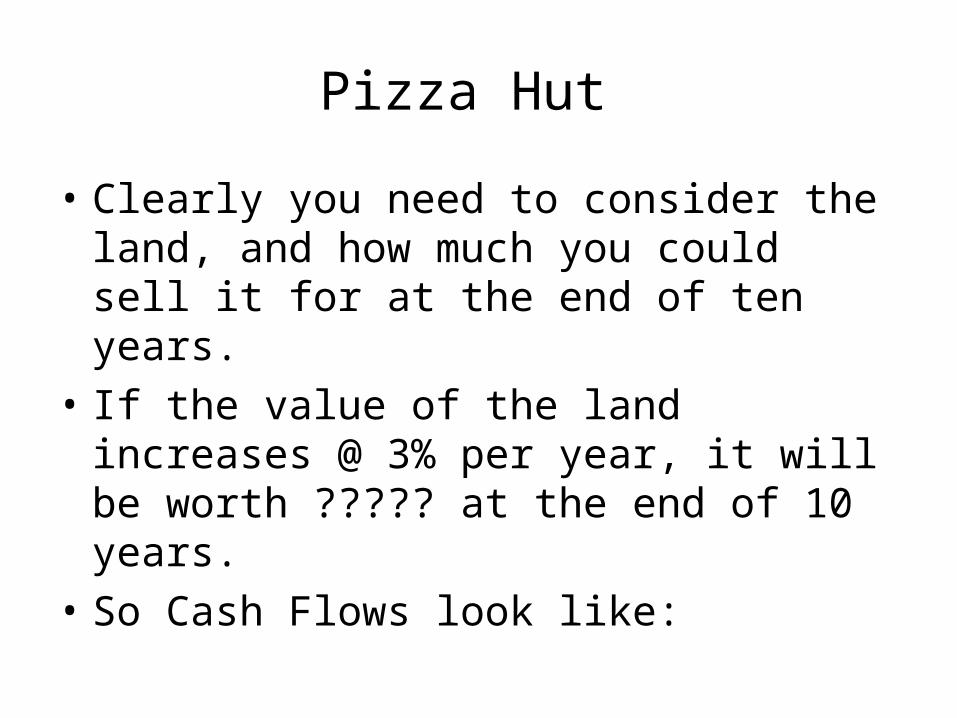
• Clearly you need to consider the land, and how much you could sell it for at the end of ten years.
• If the value of the land increases @ 3% per year, it will be worth ????? at the end of 10 years.
• So Cash Flows look like:
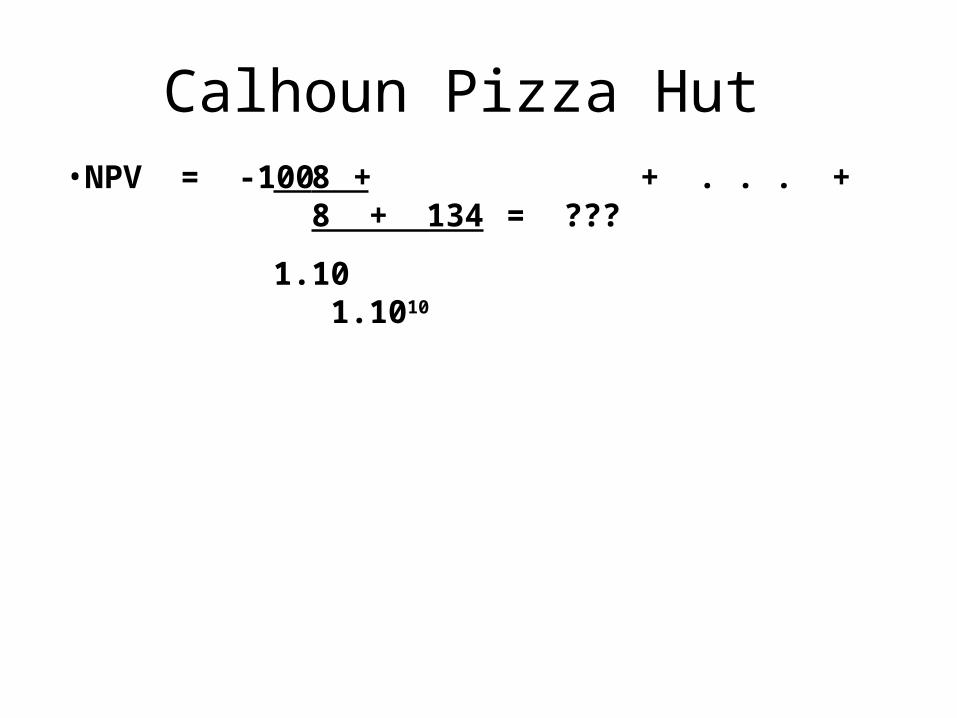
Calhoun Pizza Hut •NPV = -100 + + . . . + = ??? 8 8 + 134
1.10 1.1010
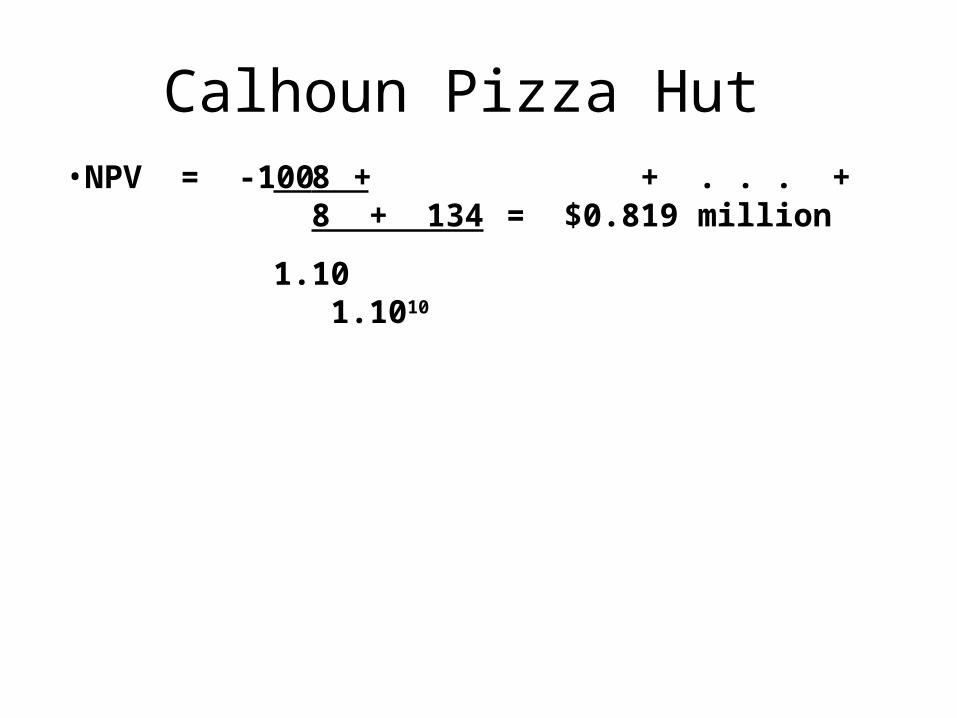
Calhoun Pizza Hut •NPV = -100 + + . . . + = $0.819 million 8 8 + 134
1.10 1.1010
Pizza Hut
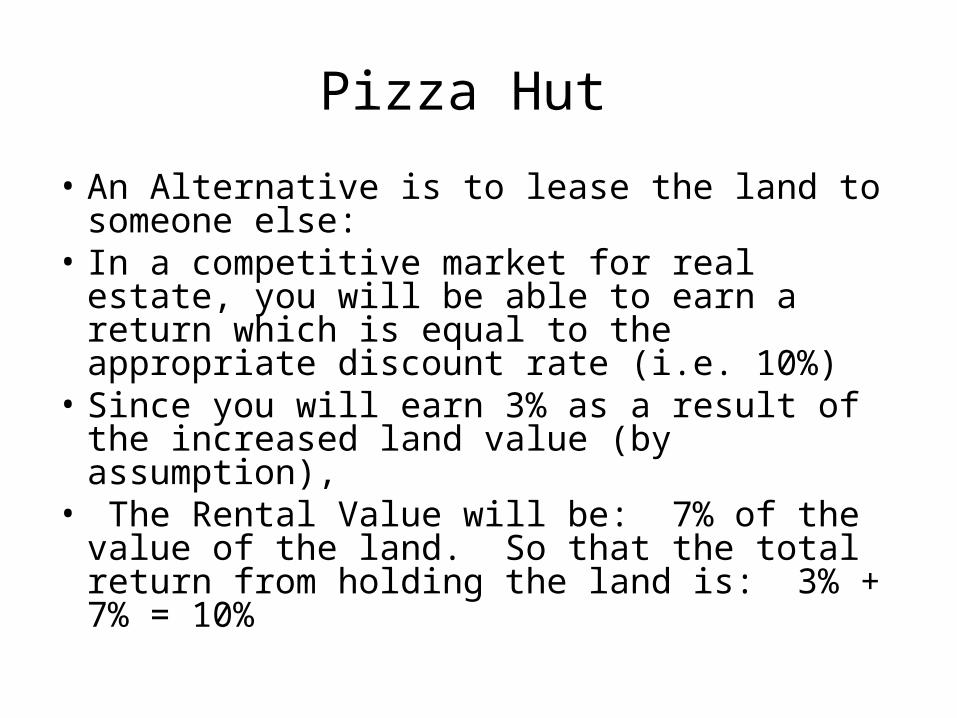
• An Alternative is to lease the land to someone else:
• In a competitive market for real estate, you will be able to earn a return which is equal to the appropriate discount rate (i.e. 10%)
• Since you will earn 3% as a result of the increased land value (by assumption),
• The Rental Value will be: 7% of the value of the land. So that the total return from holding the land is: 3% + 7% = 10%
Pizza Hut
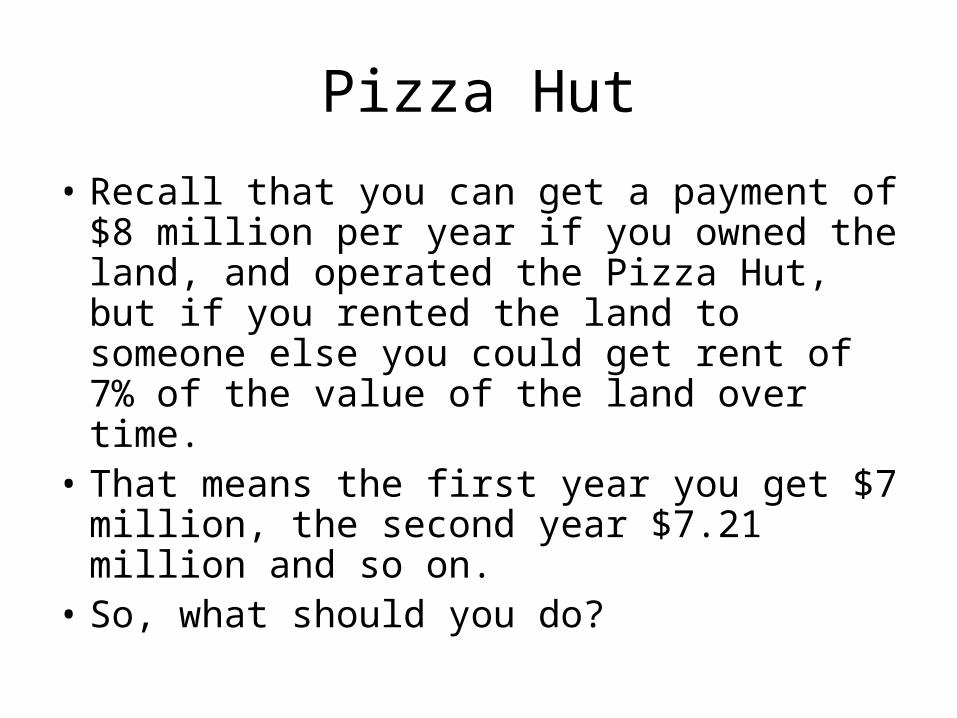
• Recall that you can get a payment of $8 million per year if you owned the land, and operated the Pizza Hut, but if you rented the land to someone else you could get rent of 7% of the value of the land over time.
• That means the first year you get $7 million, the second year $7.21 million and so on.
• So, what should you do?
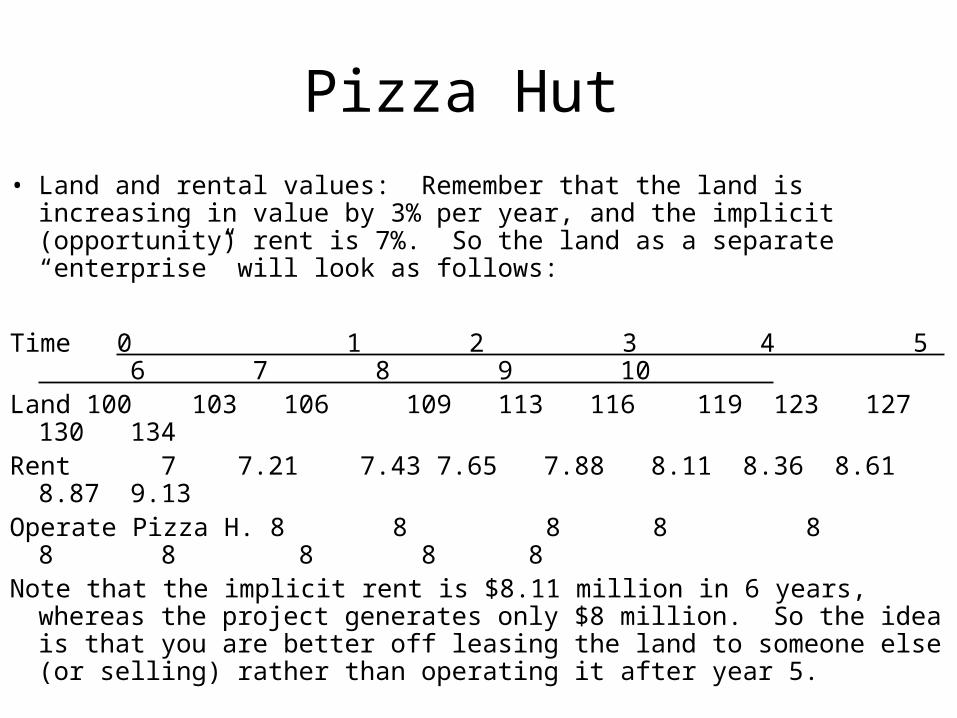
Pizza Hut • Land and rental values: Remember that the land is increasing in
value by 3% per year, and the implicit (opportunity) rent is 7%. So the land as a separate “enterprise” will look as follows:
Time 0 1 2 3 4 5 6 7 8 9 10
Land 100 103 106 109 113 116 119 123 127 130 134Rent 7 7.21 7.43 7.65 7.88 8.11 8.36 8.61 8.87 9.13Operate Pizza H. 8 8 8 8 8 8 8 8 8 8Note that the implicit rent is $8.11 million in 6 years, whereas the
project generates only $8 million. So the idea is that you are better off leasing the land to someone else (or selling) rather than operating it after year 5.
Pizza Hut
• The problem is, you are not acting strategically. You have assumed that the Economic Life of the project is 10 years. This may be the physical life of the building, but not necessarily the economic life.
• Remember, that you will be able to sell the asset sometime in the future, or rent it out to someone else. These are the alternatives and it is an ongoing problem.
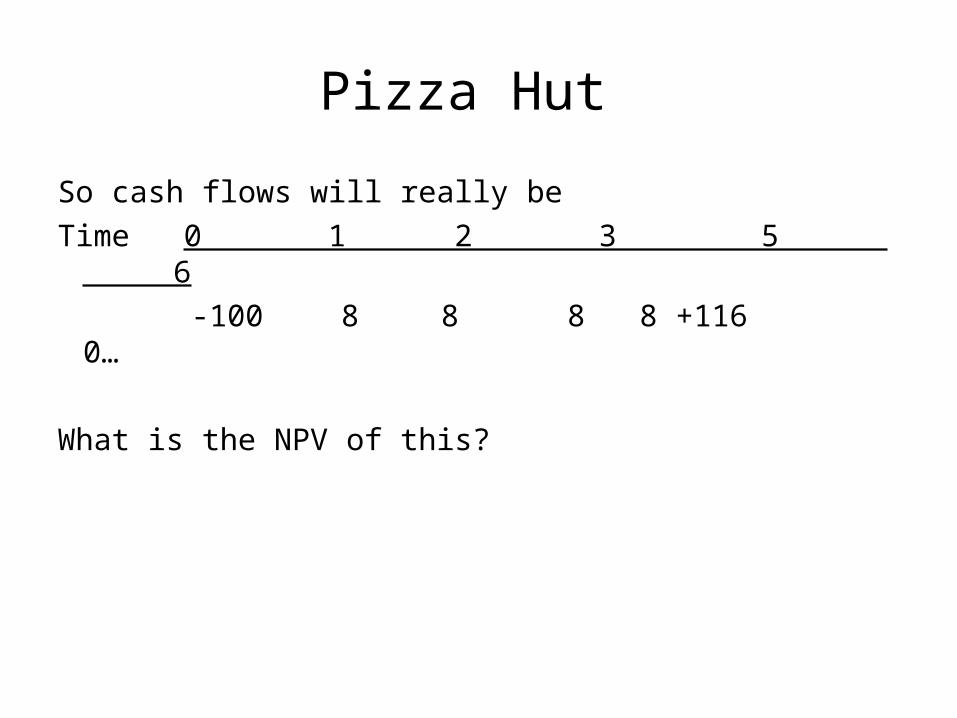
Pizza Hut
So cash flows will really beTime 0 1 2 3 5 6
-100 8 8 8 8 +116 0…
What is the NPV of this?
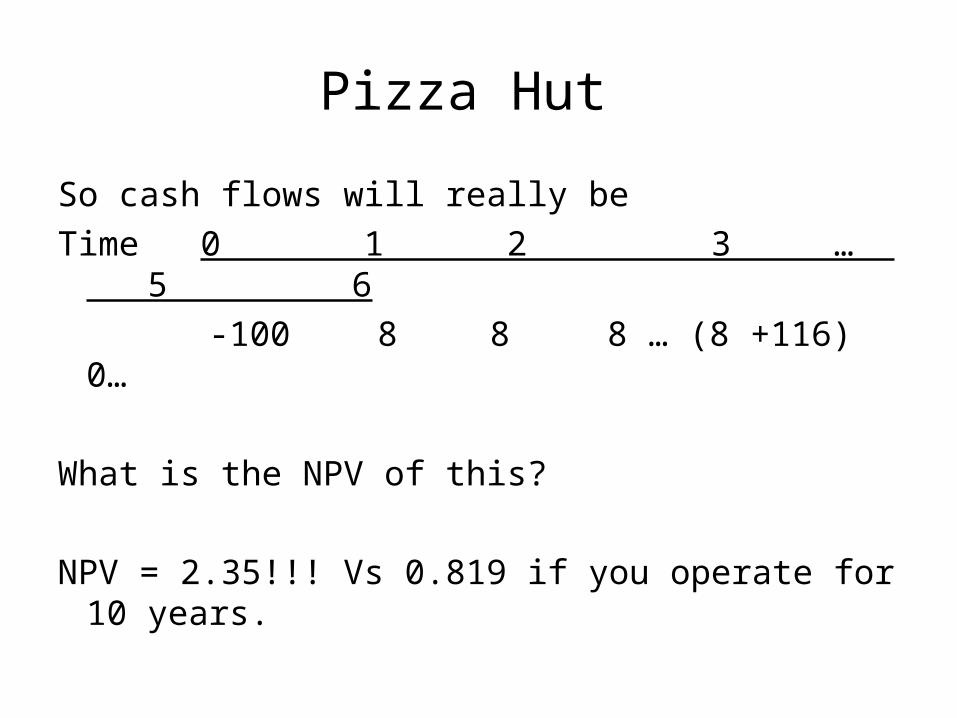
Pizza Hut
So cash flows will really beTime 0 1 2 3 … 5 6
-100 8 8 8 … (8 +116) 0…
What is the NPV of this?
NPV = 2.35!!! Vs 0.819 if you operate for 10 years.
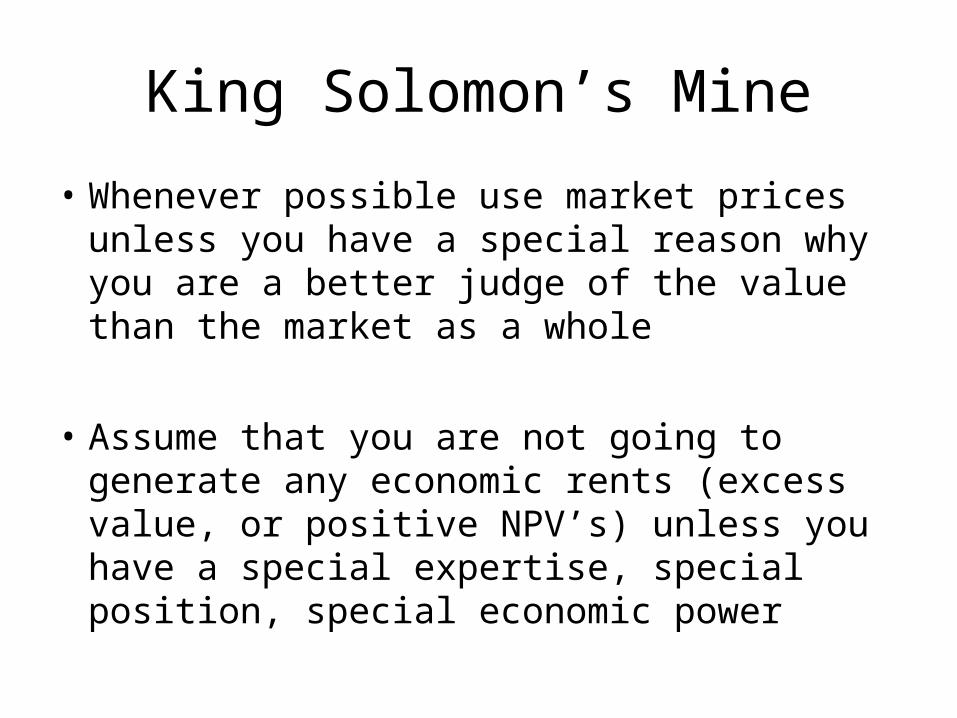
King Solomon’s Mine
• Whenever possible use market prices unless you have a special reason why you are a better judge of the value than the market as a whole
• Assume that you are not going to generate any economic rents (excess value, or positive NPV’s) unless you have a special expertise, special position, special economic power
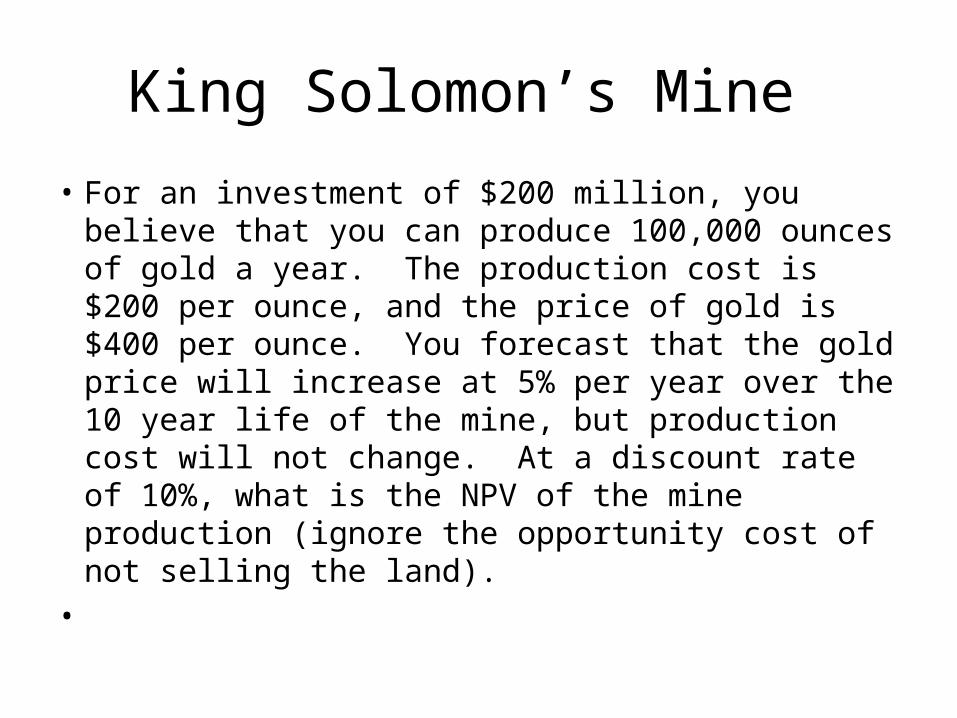
King Solomon’s Mine
• For an investment of $200 million, you believe that you can produce 100,000 ounces of gold a year. The production cost is $200 per ounce, and the price of gold is $400 per ounce. You forecast that the gold price will increase at 5% per year over the 10 year life of the mine, but production cost will not change. At a discount rate of 10%, what is the NPV of the mine production (ignore the opportunity cost of not selling the land).
•
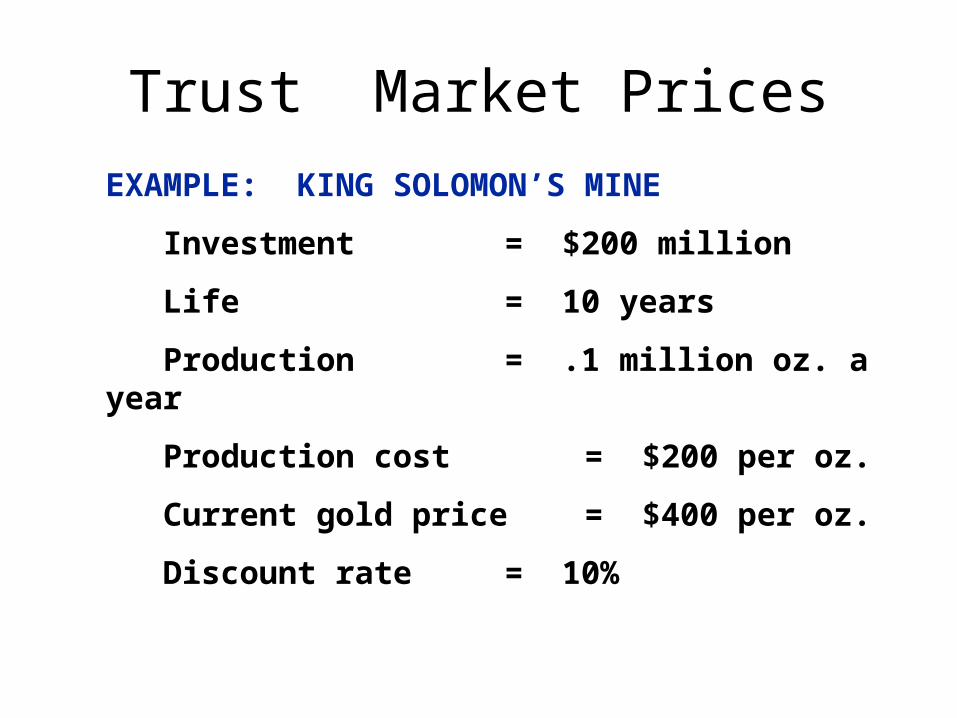
EXAMPLE: KING SOLOMON’S MINE
Investment = $200 million
Life = 10 years
Production = .1 million oz. a year
Production cost = $200 per oz.
Current gold price = $400 per oz.
Discount rate = 10%
Trust Market Prices
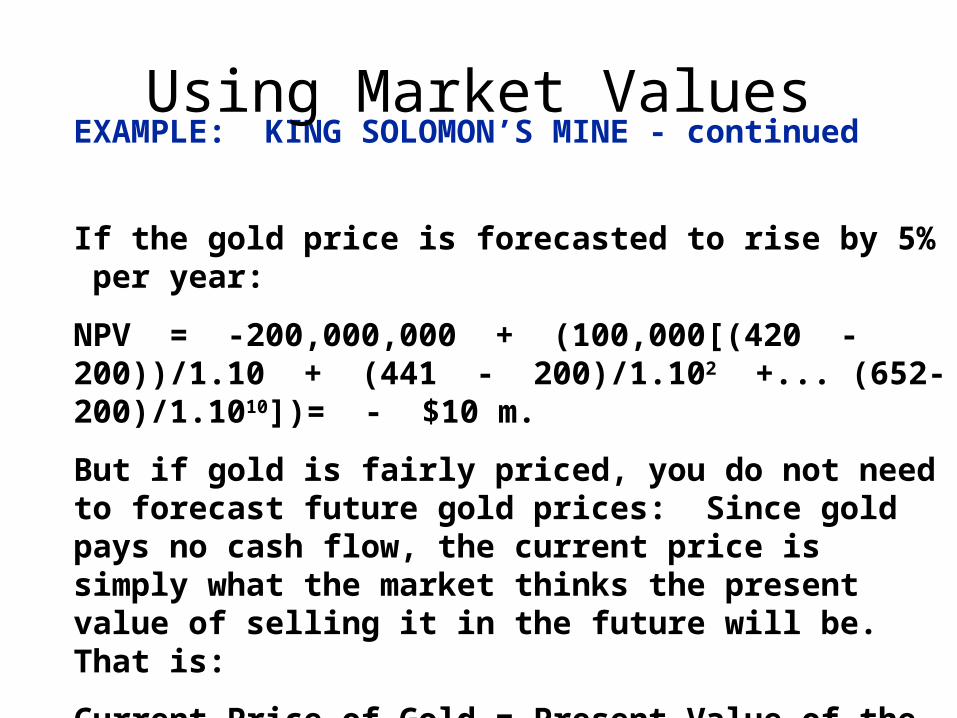
EXAMPLE: KING SOLOMON’S MINE - continued
If the gold price is forecasted to rise by 5% per year:
NPV = -200,000,000 + (100,000[(420 - 200))/1.10 + (441 - 200)/1.102 +... (652-200)/1.1010])= - $10 m.
But if gold is fairly priced, you do not need to forecast future gold prices: Since gold pays no cash flow, the current price is simply what the market thinks the present value of selling it in the future will be. That is:
Current Price of Gold = Present Value of the Price of Gold at any time t in the future.
By forecasting 5% increase, you assume you are better at forecasting gold prices than the market.
Using Market Values
King Solomon’sMine
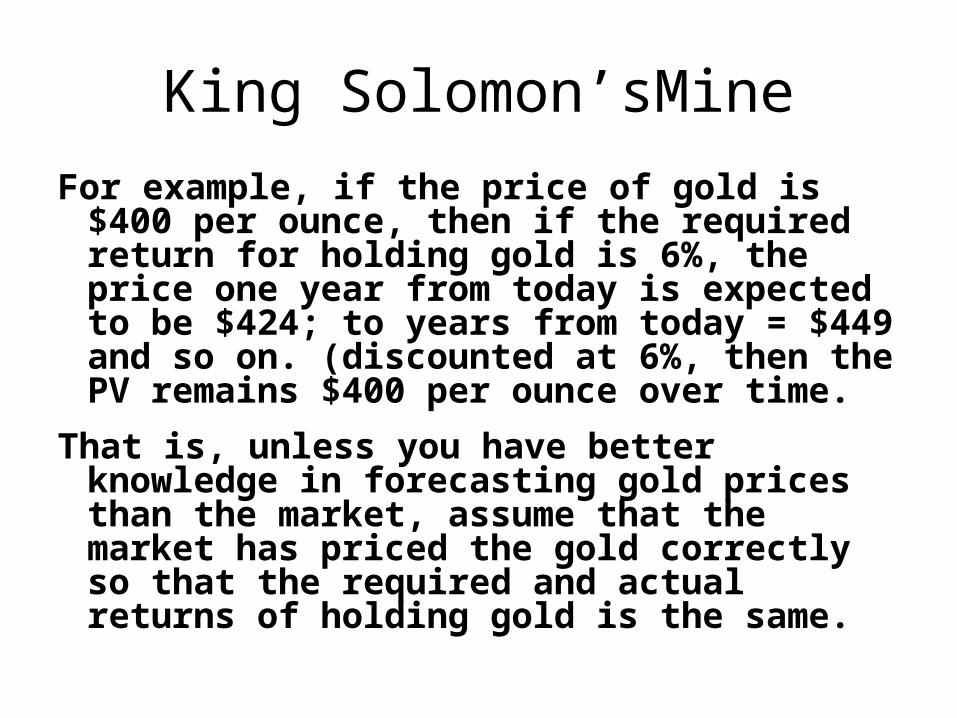
For example, if the price of gold is $400 per ounce, then if the required return for holding gold is 6%, the price one year from today is expected to be $424; to years from today = $449 and so on. (discounted at 6%, then the PV remains $400 per ounce over time.
That is, unless you have better knowledge in forecasting gold prices than the market, assume that the market has priced the gold correctly so that the required and actual returns of holding gold is the same.
King Solomon’s Mine
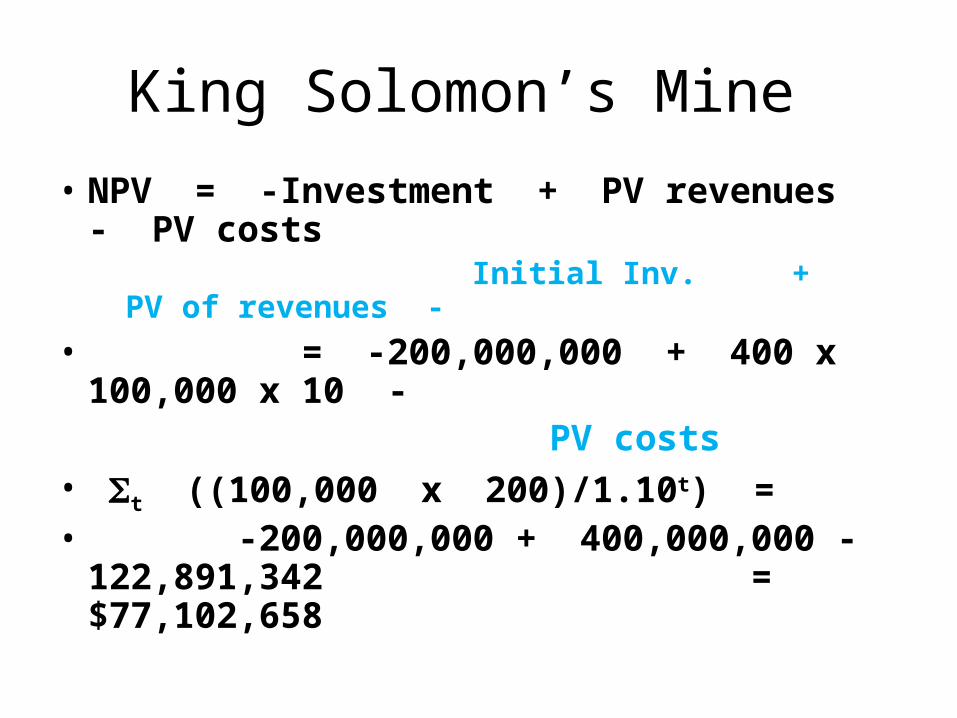
• NPV = -Investment + PV revenues - PV costs
Initial Inv. + PV of revenues -• = -200,000,000 + 400 x 100,000 x 10 - PV costs • t ((100,000 x 200)/1.10t) =• -200,000,000 + 400,000,000 -122,891,342
= $77,102,658
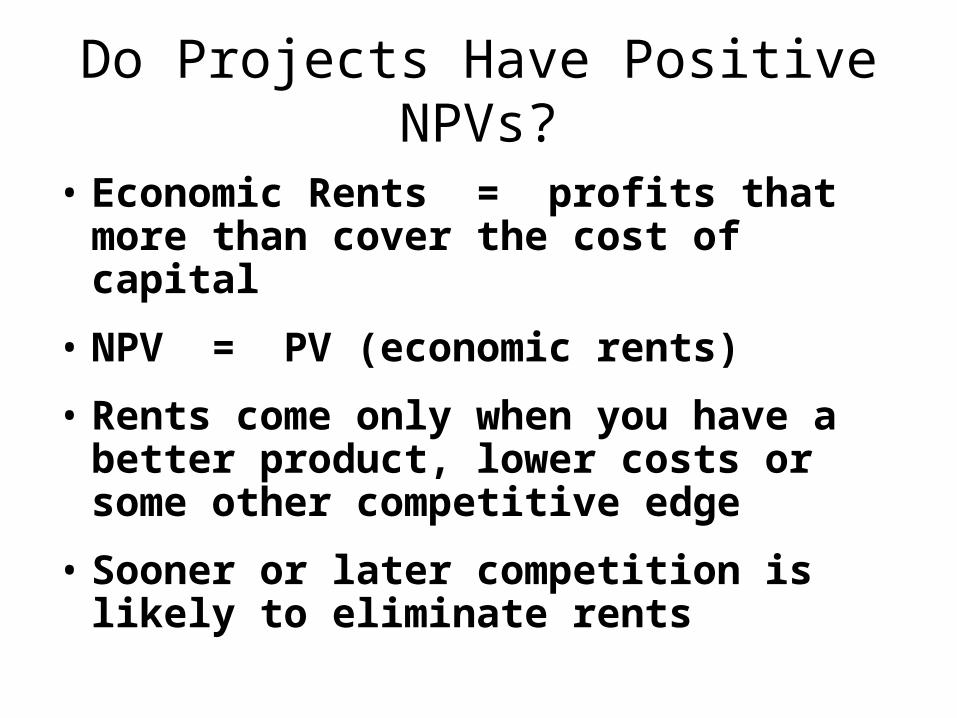
Do Projects Have Positive NPVs?
• Economic Rents = profits that more than cover the cost of capital
• NPV = PV (economic rents)
• Rents come only when you have a better product, lower costs or some other competitive edge
• Sooner or later competition is likely to eliminate rents
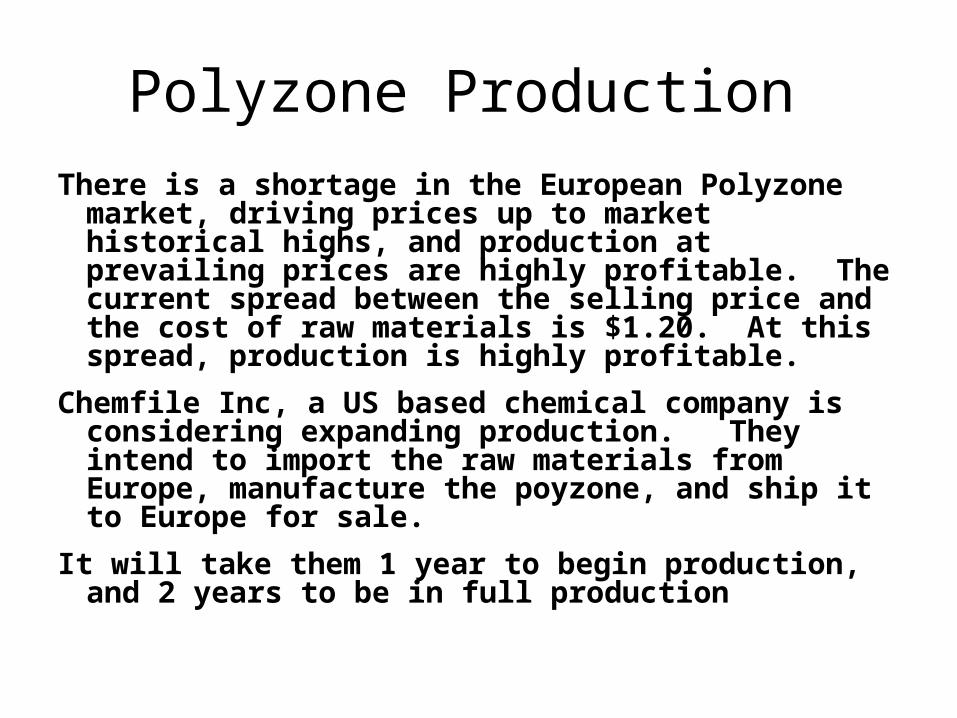
Polyzone Production There is a shortage in the European Polyzone market,
driving prices up to market historical highs, and production at prevailing prices are highly profitable. The current spread between the selling price and the cost of raw materials is $1.20. At this spread, production is highly profitable.
Chemfile Inc, a US based chemical company is considering expanding production. They intend to import the raw materials from Europe, manufacture the poyzone, and ship it to Europe for sale.
It will take them 1 year to begin production, and 2 years to be in full production

Polyzone Production
• Raw materials were commodity chemicals imported from Europe
• Finished product was exported to Europe
• Does this sound like a good idea to you?
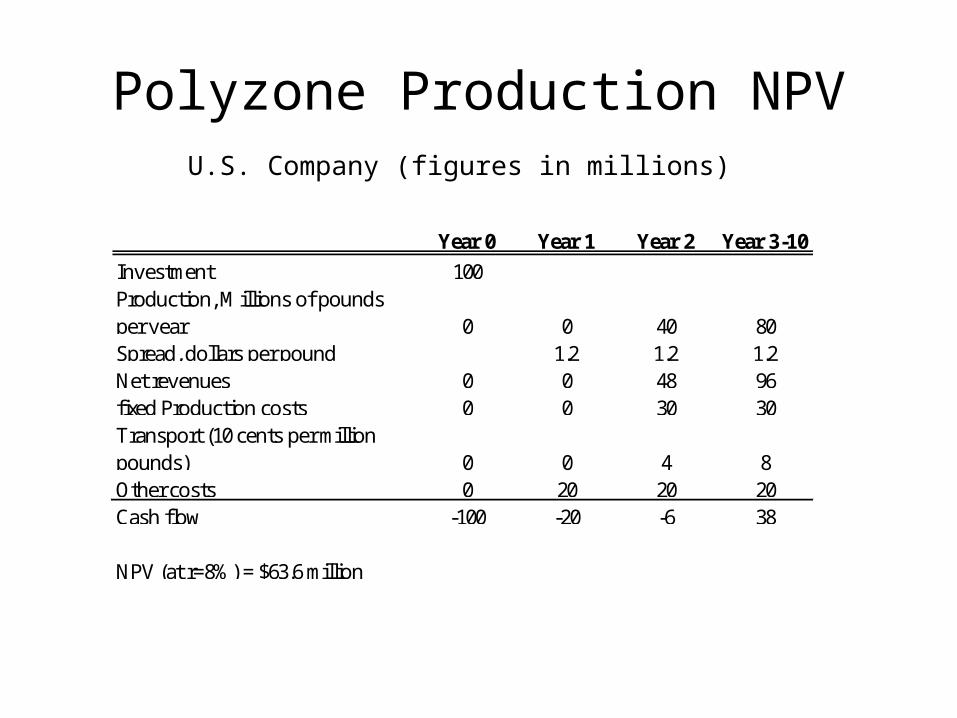
Polyzone Production NPV
Year 0 Year 1 Year 2 Year 3-10
Investment 100Production, Millions of pounds per year 0 0 40 80Spread, dollars per pound 1.2 1.2 1.2Net revenues 0 0 48 96fixed Production costs 0 0 30 30Transport (10 cents per million pounds) 0 0 4 8Other costs 0 20 20 20Cash flow -100 -20 -6 38
NPV (at r=8%) = $63.6 million
U.S. Company (figures in millions)
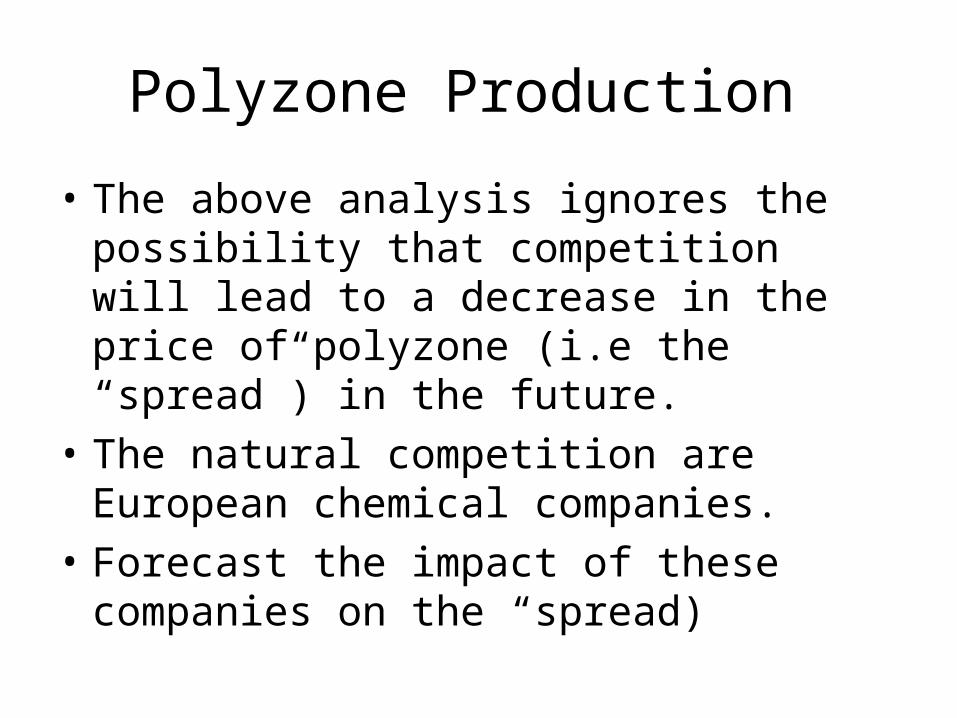
Polyzone Production
• The above analysis ignores the possibility that competition will lead to a decrease in the price of polyzone (i.e the “spread”) in the future.
• The natural competition are European chemical companies.
• Forecast the impact of these companies on the “spread)
Polyzone Production
• We have to ask: if European companies can compete, what will be the minimum spread that these companies need to make the production worthwhile.
• That is, what spread drives the NPV of the European companies to zero?
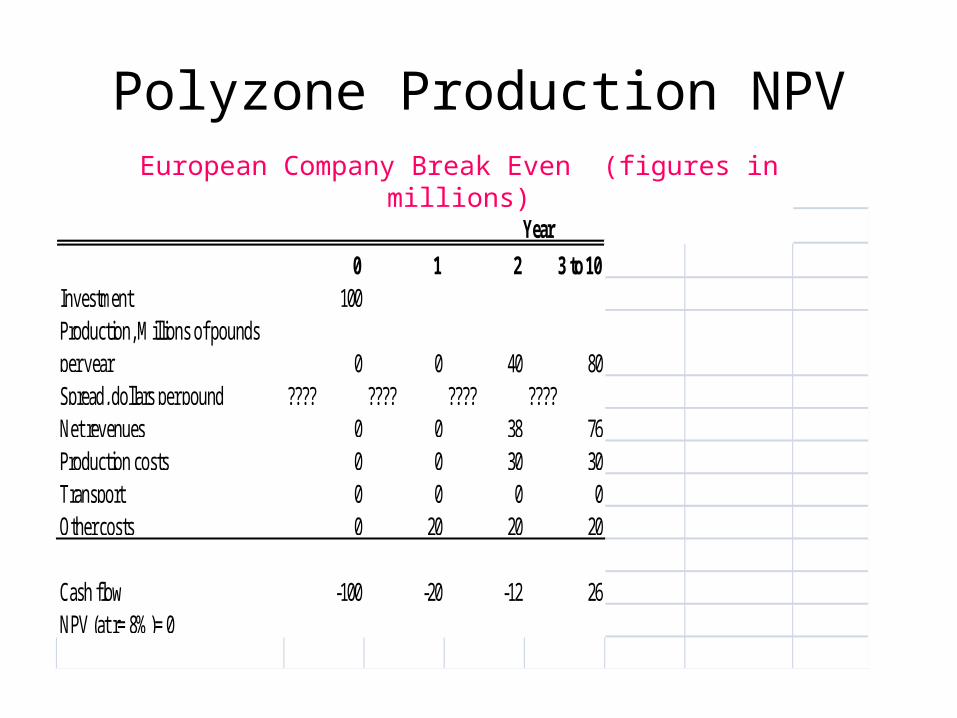
Polyzone Production NPV
0 1 2 3 to 10Investment 100Production, Millions of pounds per year 0 0 40 80Spread, dollars per pound ???? ???? ???? ????Net revenues 0 0 38 76Production costs 0 0 30 30Transport 0 0 0 0Other costs 0 20 20 20
Cash flow -100 -20 -12 26NPV (at r= 8%)= 0
Year
European Company Break Even (figures in millions)
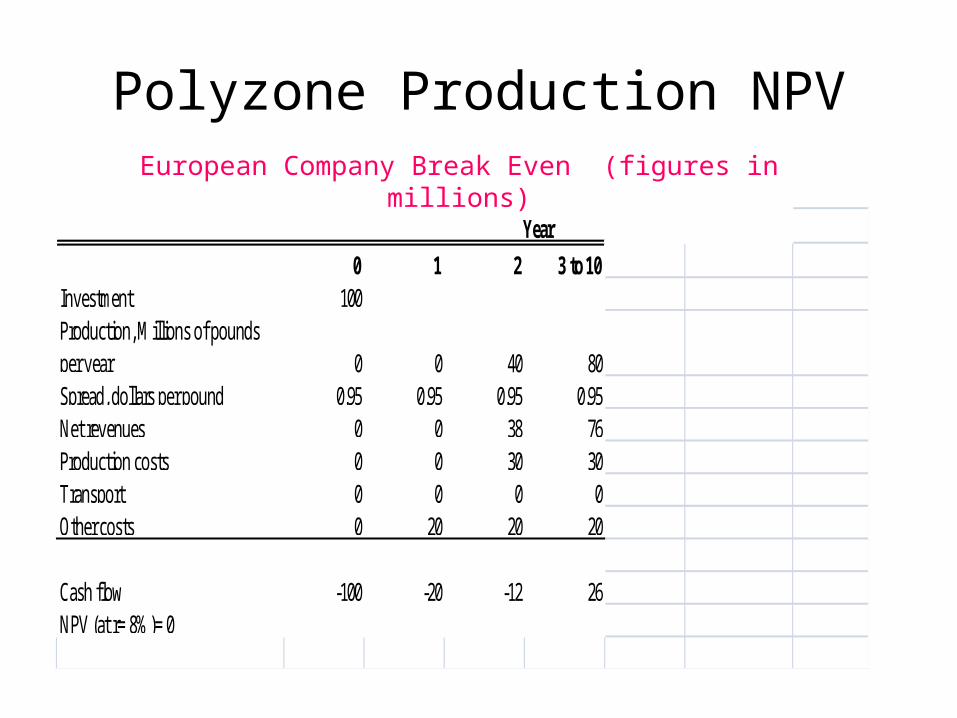
Polyzone Production NPV
0 1 2 3 to 10Investment 100Production, Millions of pounds per year 0 0 40 80Spread, dollars per pound 0.95 0.95 0.95 0.95Net revenues 0 0 38 76Production costs 0 0 30 30Transport 0 0 0 0Other costs 0 20 20 20
Cash flow -100 -20 -12 26NPV (at r= 8%)= 0
Year
European Company Break Even (figures in millions)
Polyzone Production
• So eventually competition will drive the spread per pound of polyzone to $0.95.
• So the question is when?
• Forecast that increased European competition will drive spreads to 1.1 in 4 years, and then to 0.95 in 5 years
• Modified cash flow estimates are as follows:
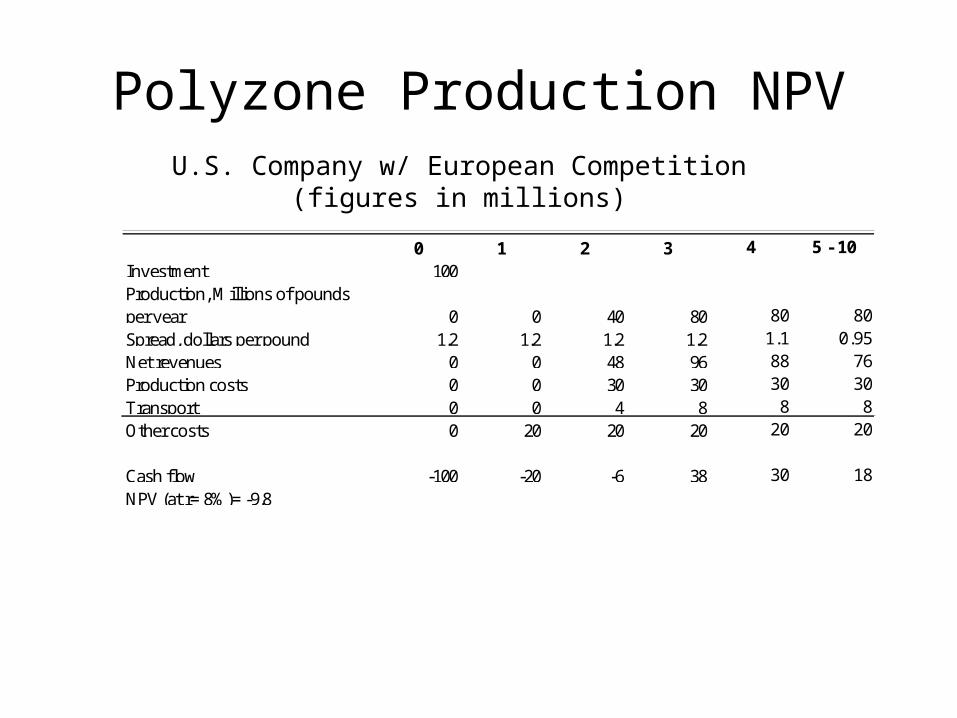
Polyzone Production NPV
0 1 2 3 4 5 - 10Investment 100Production, Millions of pounds per year 0 0 40 80 80 80Spread, dollars per pound 1.2 1.2 1.2 1.2 1.1 0.95Net revenues 0 0 48 96 88 76Production costs 0 0 30 30 30 30Transport 0 0 4 8 8 8Other costs 0 20 20 20 20 20
Cash flow -100 -20 -6 38 30 18NPV (at r= 8%)= -9.8
U.S. Company w/ European Competition (figures in millions)
Marvin Enterprises
The best drink in existence is the Pan Galactic Gargle Blaster. The effect of a Pan Galactic Gargle Blaster is like having your brains smashed out by a slice of lemon wrapped round a large gold brick.
Source: The Hitchhiker's Guide to the Galaxy
Marvin enterprises
• Although Marvin is a really complicated case, it is worth spending some time on doing this by yourself so that you understand the factors that must be considered in a dynamic setting for an investment project.
• The project is affected by new technology, competition and price changes which lead to changes in production, capacity and so on.
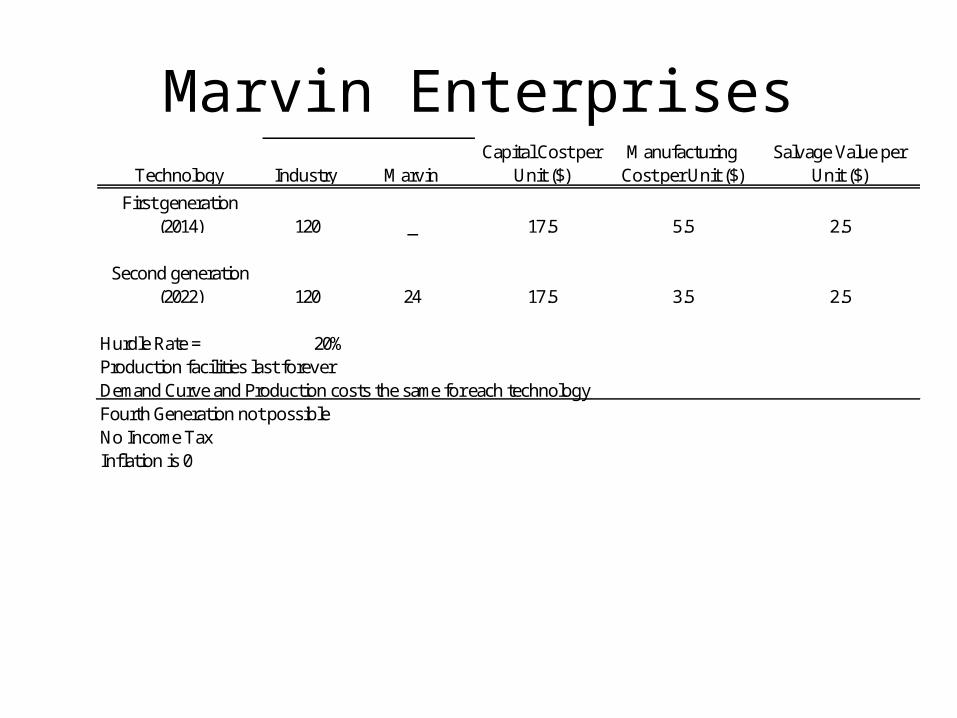
Marvin EnterprisesTechnology Industry Marvin
Capital Cost per Unit ($)
Manufacturing Cost per Unit ($)
Salvage Value per Unit ($)
First generation (2014) 120 _ 17.5 5.5 2.5
Second generation (2022) 120 24 17.5 3.5 2.5
Hurdle Rate = 20%Production facilities last foreverDemand Curve and Production costs the same for each technologyFourth Generation not possible No Income TaxInflation is 0
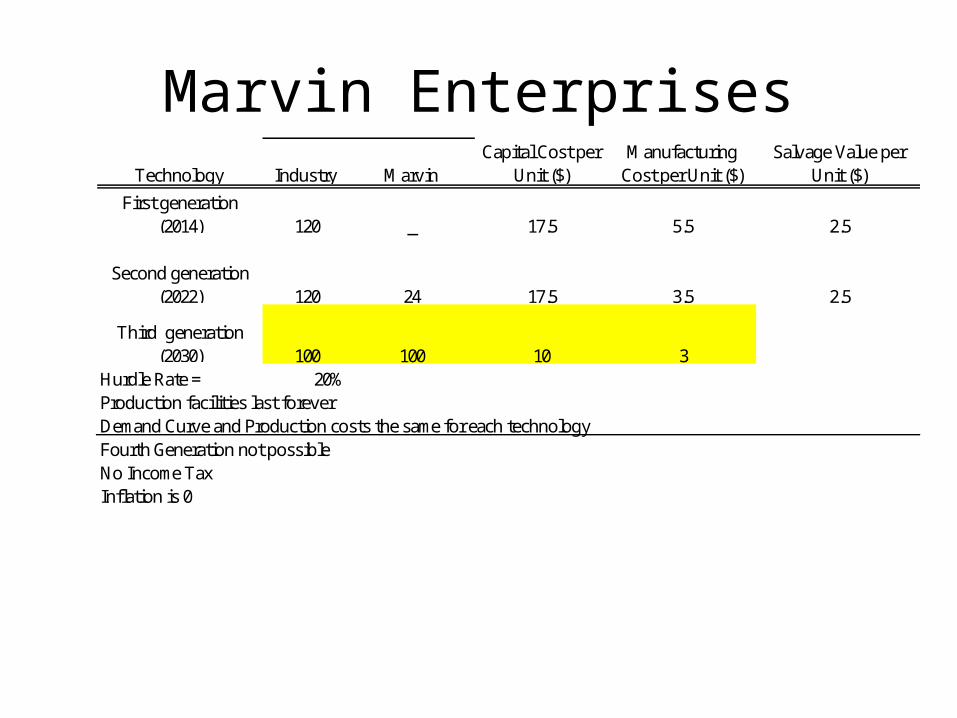
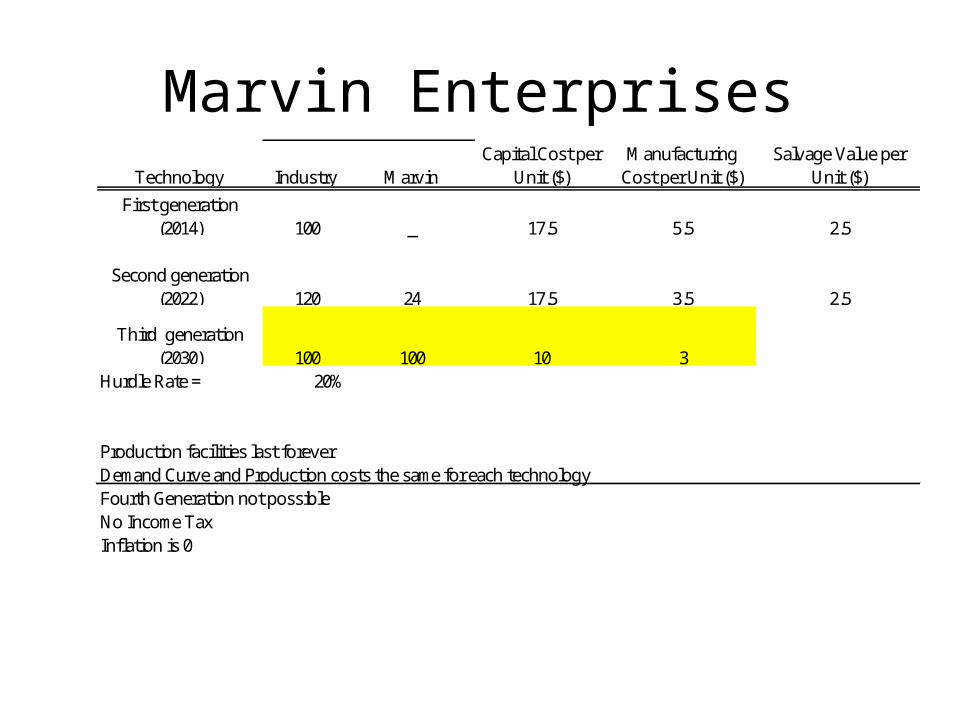
Marvin EnterprisesTechnology Industry Marvin
Capital Cost per Unit ($)
Manufacturing Cost per Unit ($)
Salvage Value per Unit ($)
First generation (2014) 120 _ 17.5 5.5 2.5
Second generation (2022) 120 24 17.5 3.5 2.5
Third generation (2030) 100 100 10 3
Hurdle Rate = 20%Production facilities last foreverDemand Curve and Production costs the same for each technologyFourth Generation not possible No Income TaxInflation is 0
Marvin Enterprises
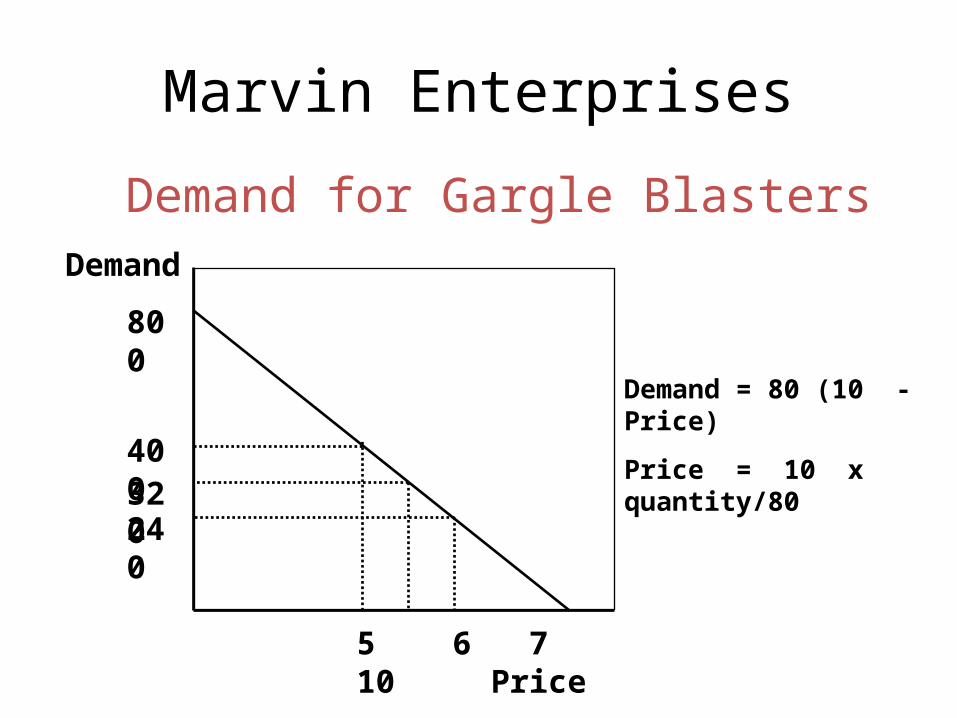
5 6 7 10 Price
800
400 320 240
Demand
Demand = 80 (10 - Price)
Price = 10 x quantity/80
Demand for Gargle Blasters
Marvin Enterprises
• Steps in Analysis – What is the impact of the new technology on the
Current Price – What will this change in price do to the existing
(older) technologies?– Immediate (equilibrium) Price Impact– What and when will be the impact on newer
technologies?– What will be the impact on the profitability of
Marvin’s older technology?
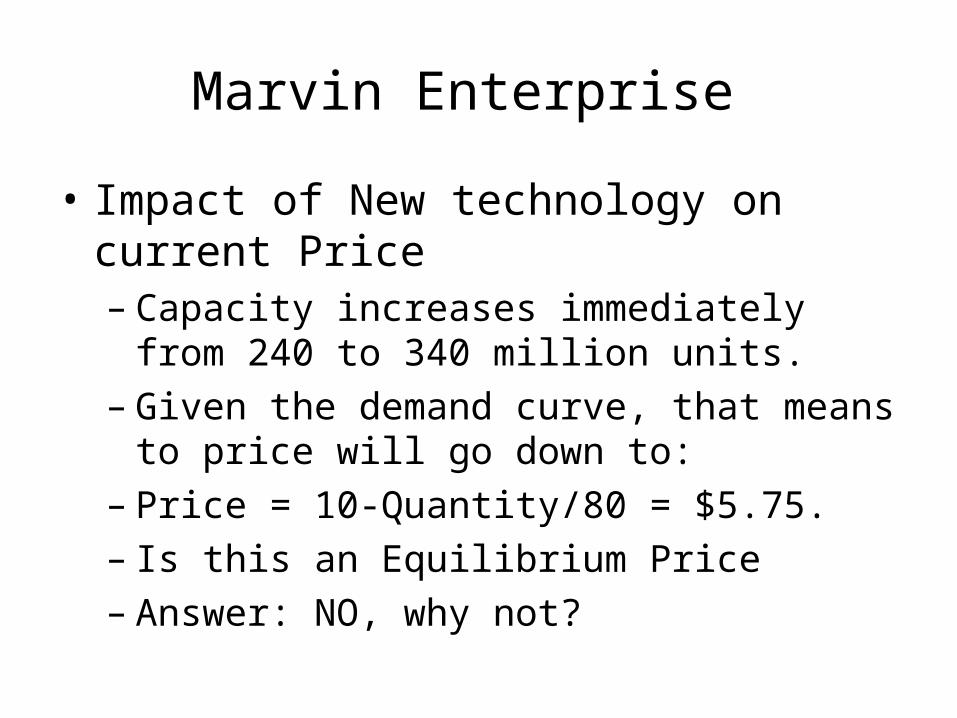
Marvin Enterprise
• Impact of New technology on current Price – Capacity increases immediately from 240 to 340
million units. – Given the demand curve, that means to price will
go down to:
Marvin Enterprise
• Impact of New technology on current Price – Capacity increases immediately from 240 to 340
million units. – Given the demand curve, that means to price will
go down to:– Price = 10-Quantity/80 = $5.75.– Is this an Equilibrium Price – Answer: NO, why not?
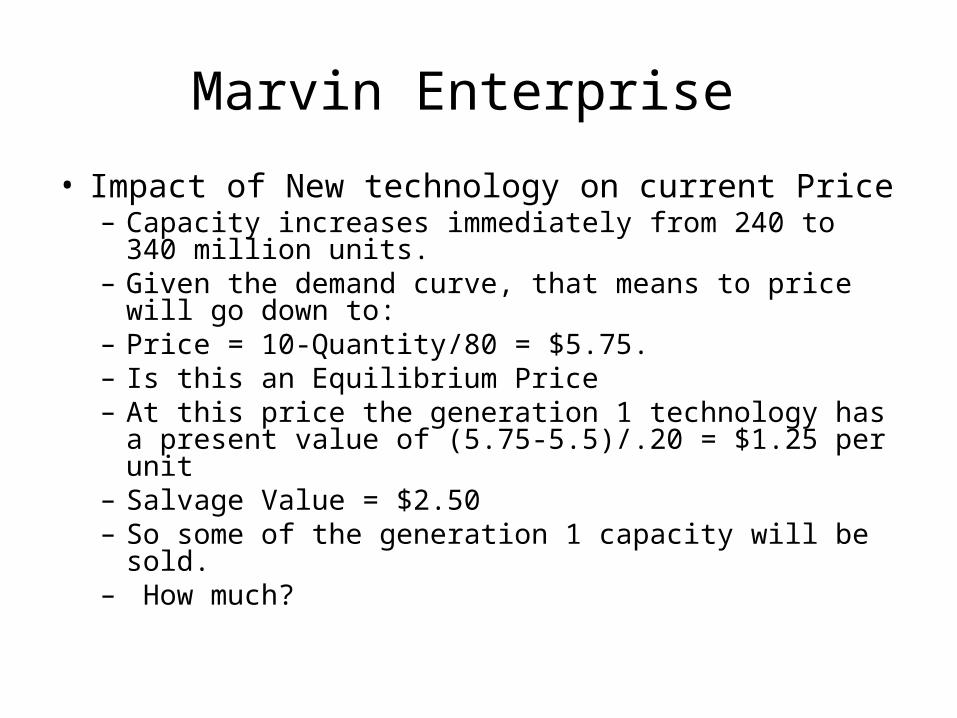
Marvin Enterprise
• Impact of New technology on current Price – Capacity increases immediately from 240 to 340 million
units. – Given the demand curve, that means to price will go down
to:– Price = 10-Quantity/80 = $5.75.– Is this an Equilibrium Price – At this price the generation 1 technology has a present
value of (5.75-5.5)/.20 = $1.25 per unit – Salvage Value = $2.50– So some of the generation 1 capacity will be sold. – How much?
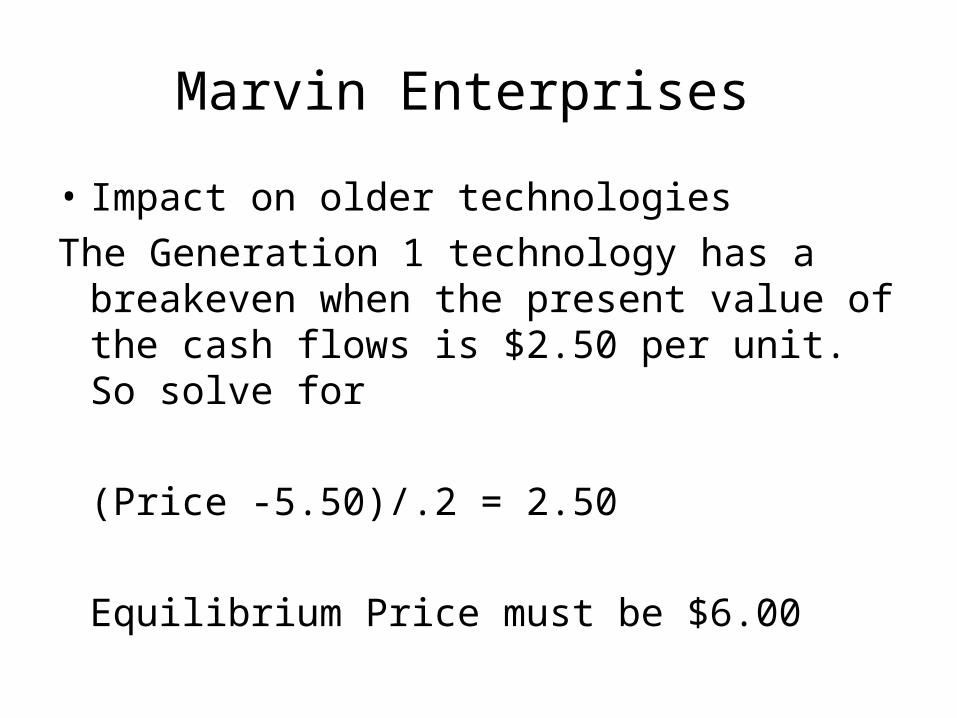
Marvin Enterprises
• Impact on older technologies The Generation 1 technology has a breakeven
when the present value of the cash flows is $2.50 per unit. So solve for
(Price -5.50)/.2 = 2.50
Equilibrium Price must be $6.00
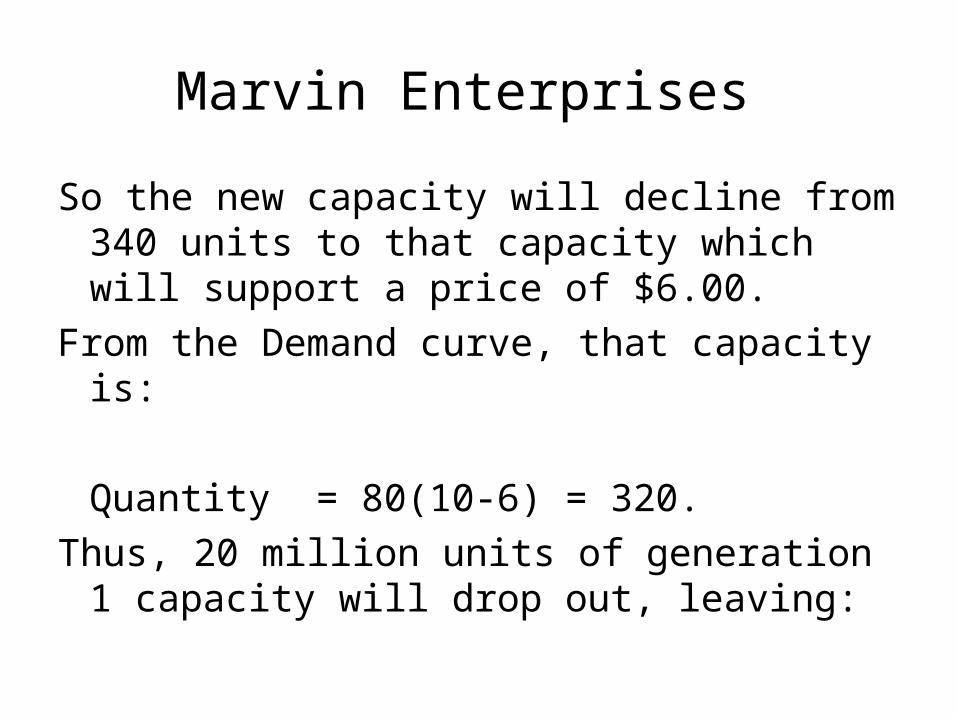
Marvin Enterprises
So the new capacity will decline from 340 units to that capacity which will support a price of $6.00.
From the Demand curve, that capacity is:
Quantity = 80(10-6) = 320.Thus, 20 million units of generation 1 capacity
will drop out, leaving:
Marvin EnterprisesTechnology Industry Marvin
Capital Cost per Unit ($)
Manufacturing Cost per Unit ($)
Salvage Value per Unit ($)
First generation (2014) 100 _ 17.5 5.5 2.5
Second generation (2022) 120 24 17.5 3.5 2.5
Third generation (2030) 100 100 10 3
Hurdle Rate = 20%
Production facilities last foreverDemand Curve and Production costs the same for each technologyFourth Generation not possible No Income TaxInflation is 0
Marvin Enterprises
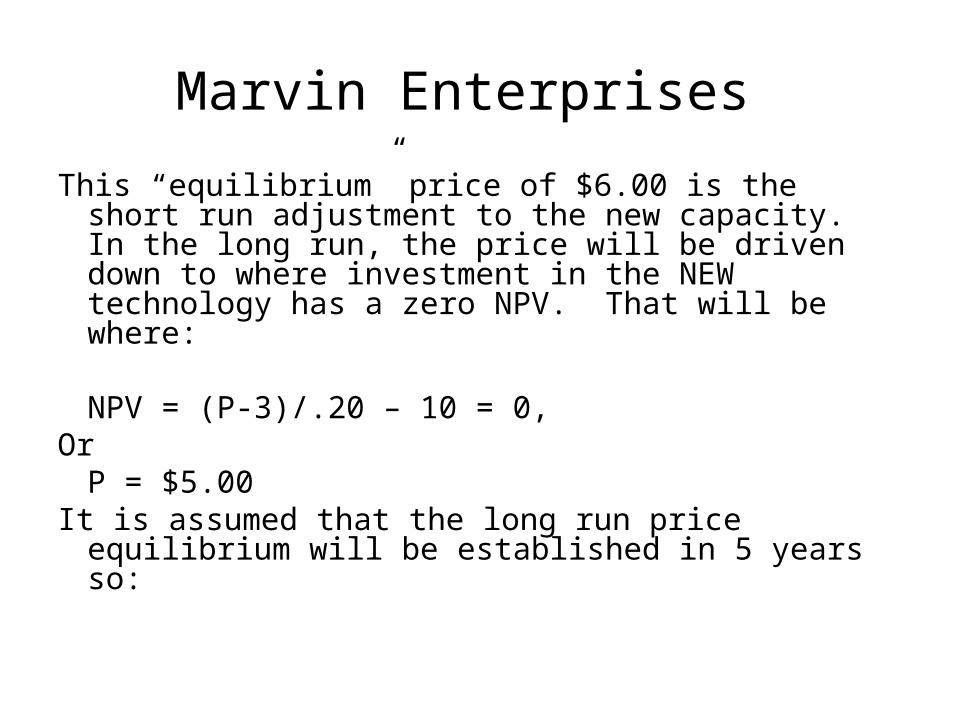
This “equilibrium” price of $6.00 is the short run adjustment to the new capacity. In the long run, the price will be driven down to where investment in the NEW technology has a zero NPV. That will be where:
NPV = (P-3)/.20 – 10 = 0,Or
P = $5.00It is assumed that the long run price equilibrium will be
established in 5 years so:
Marvin Enterprise
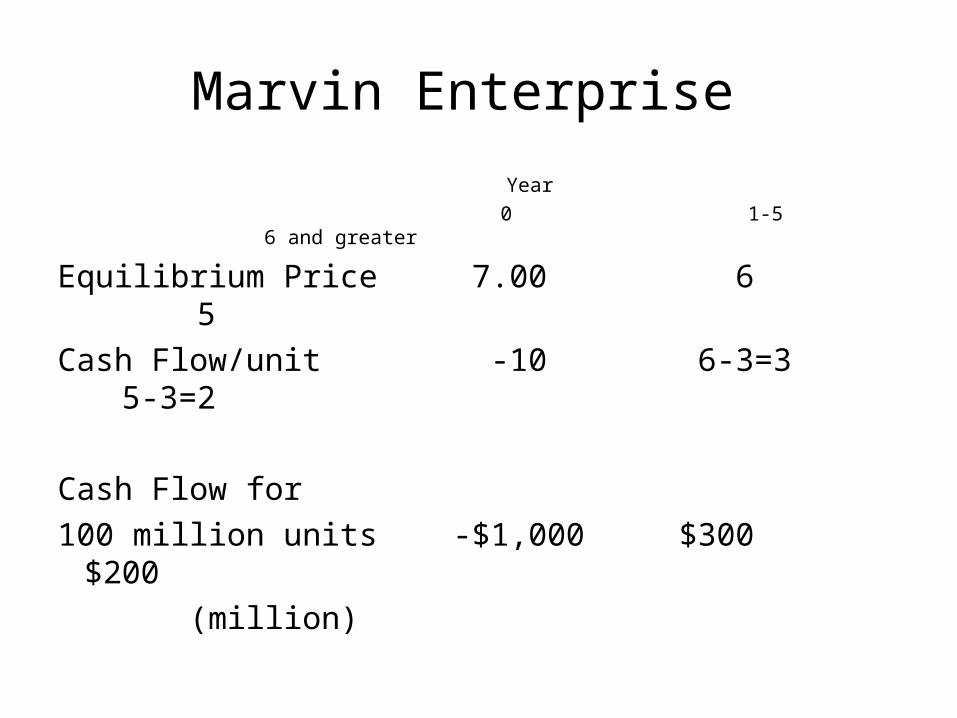
Year 0 1-5 6 and greater
Equilibrium Price 7.00 6 5Cash Flow/unit -10 6-3=3 5-3=2
Cash Flow for 100 million units -$1,000 $300 $200 (million)
Marvin Enterprises
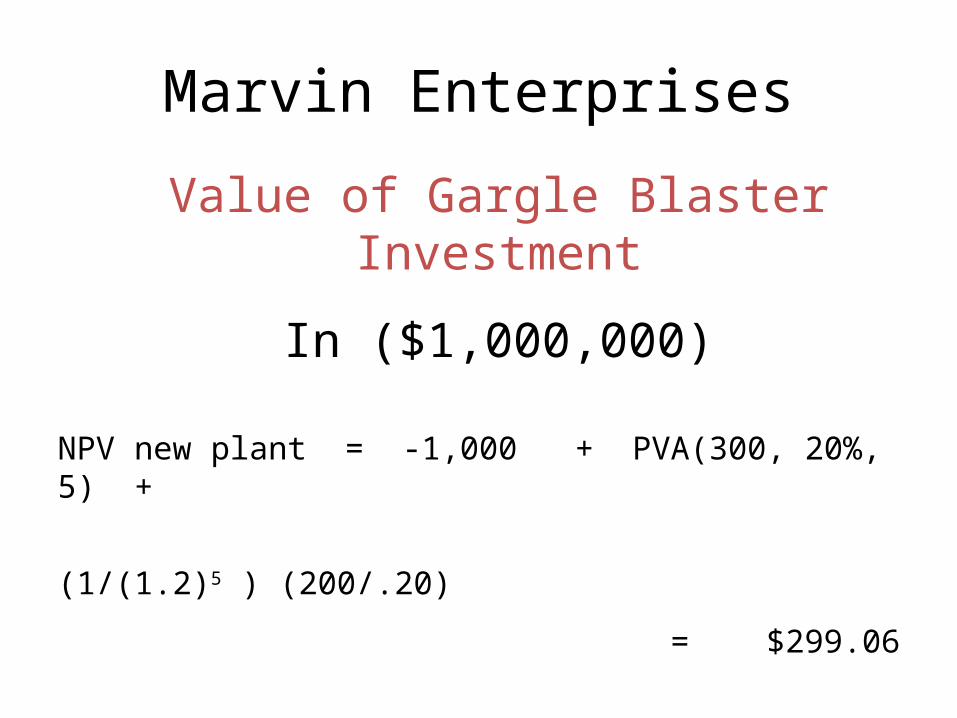
NPV new plant = -1,000 + PVA(300, 20%, 5) +
(1/(1.2)5 ) (200/.20)
= $299.06
Value of Gargle Blaster Investment
In ($1,000,000)
Marvin Enterprise
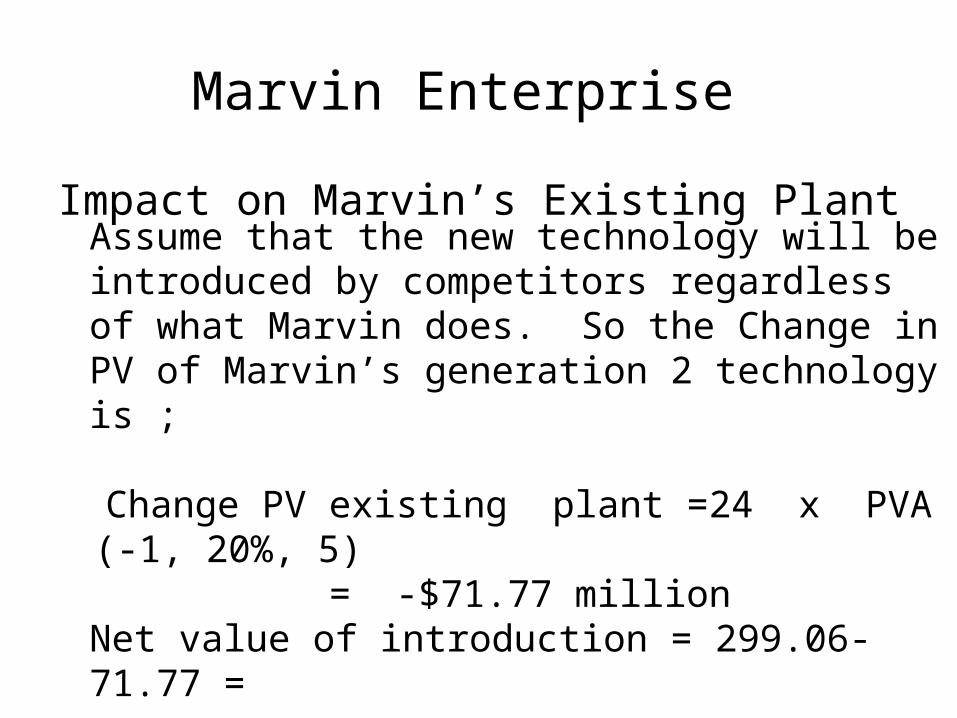
Impact on Marvin’s Existing Plant Assume that the new technology will be introduced by competitors regardless of what Marvin does. So the Change in PV of Marvin’s generation 2 technology is ;
Change PV existing plant =24 x PVA (-1, 20%, 5) = -$71.77 million
Net value of introduction = 299.06- 71.77 =
$227.29 million
Marvin Enterprises
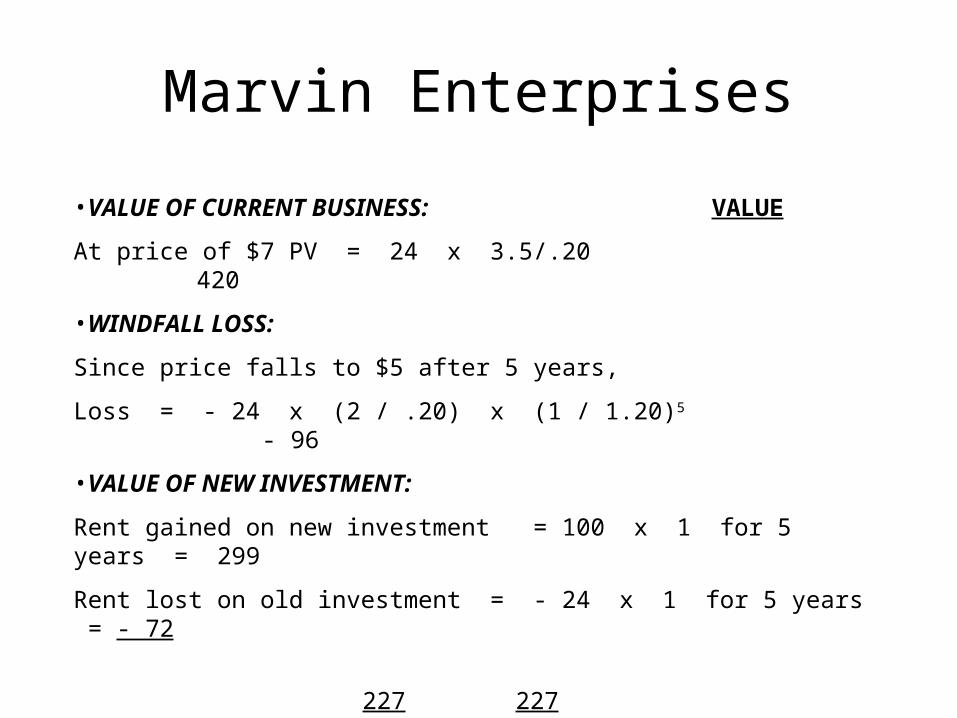
•VALUE OF CURRENT BUSINESS: VALUE
At price of $7 PV = 24 x 3.5/.20 420
•WINDFALL LOSS:
Since price falls to $5 after 5 years,
Loss = - 24 x (2 / .20) x (1 / 1.20)5 - 96
•VALUE OF NEW INVESTMENT:
Rent gained on new investment = 100 x 1 for 5 years = 299
Rent lost on old investment = - 24 x 1 for 5 years = - 72
227 227
TOTAL VALUE: 551
CURRENT MARKET PRICE: 460
Marvin Enterprises
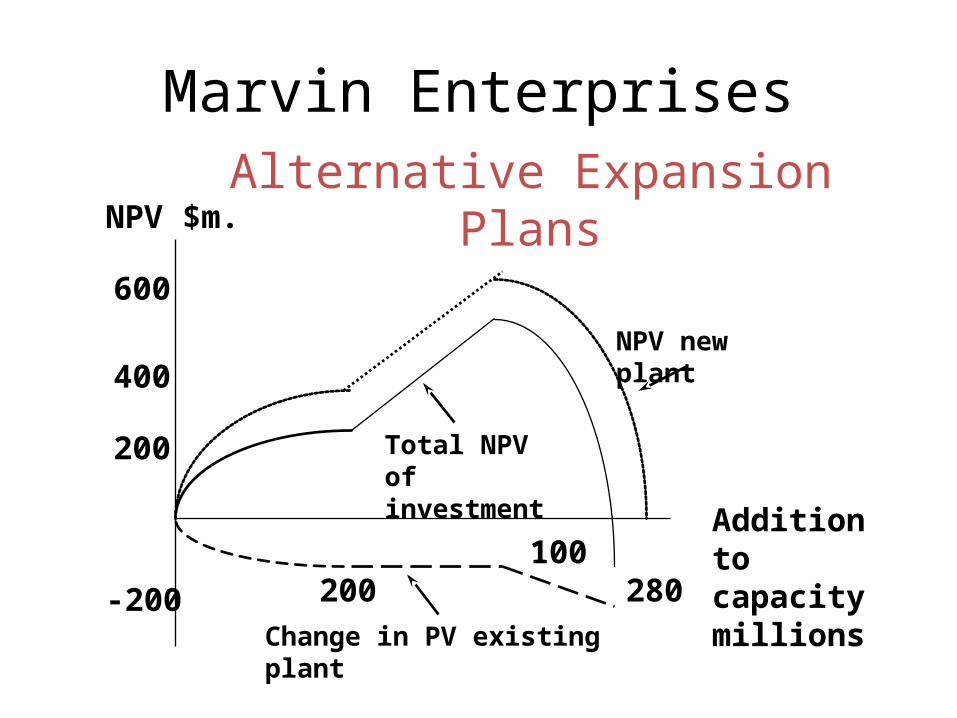
100 200 280
NPV new plant
Change in PV existing plant
Total NPV of investment
400
600
200
-200
NPV $m.
Addition to capacity millions
Alternative Expansion Plans