Embed Size (px)
Citation preview

JAPAN INTERNATIONAL COOPERATION AGENCY (JICA)
ELECTRICITY OF VIETNAM (EVN)
THE SOCIALIST REPUBLIC OF VIETNAM
MASTER PLAN STUDY
ON
PUMPED STORAGE POWER PROJECT
AND OPTIMIZATION
FOR PEAKING POWER GENERATION
IN
VIETNAM
FINAL REPORT
SUMMARY REPORT
JUNE 2004
THE TOKYO ELECTRIC POWER CO., INC.
TOKYO ELECTRIC POWER SERVICES CO., LTD.
E D
J R
04-004

Location of the Socialist Republic of Vietnam

-i-
MASTER PLAN STUDY ON PUMPED STORAGE POWER PROJECT
AND OPTIMIZATION FOR PEAKING POWER GENERATION
IN VIETNAM
FINAL REPORT SUMMARY REPORT
Contents
Page
Vietnam Map Acronyms/Abbreviations and Unit Chapter 1 Introduction
1.1 Background ・・・・・・・・・・・・・・・・・・・・・・・・・・・・・・・・・・・・・・・・・・・・・・・・・・・・・・・・・・・・・・・・・・・・・・・・・1-1 1.2 Objectives and Scope of the Study・・・・・・・・・・・・・・・・・・・・・・・・・・・・・・・・・・・・・・・・・・・・・・・・・・・・・1-1 1.3 Methodologies of the Study ・・・・・・・・・・・・・・・・・・・・・・・・・・・・・・・・・・・・・・・・・・・・・・・・・・・・・・・・・・・1-3
Chapter 2 Current Situations of Power Development 2.1 Energy Sector・・・・・・・・・・・・・・・・・・・・・・・・・・・・・・・・・・・・・・・・・・・・・・・・・・・・・・・・・・・・・・・・・・・・・・・・2-1 2.2 Power Development ・・・・・・・・・・・・・・・・・・・・・・・・・・・・・・・・・・・・・・・・・・・・・・・・・・・・・・・・・ 2-6 2.3 Environmental Considerations in Vietnam ・・・・・・・・・・・・・・・・・・・・・・・・・・・・・・・・・・・・・・・ 2-12
Chapter 3 Current Situations and Evaluation of Power Sources Development Plan (Revised 5th M/P)
3.1 Evaluation of Demand Forecasts・・・・・・・・・・・・・・・・・・・・・・・・・・・・・・・・・・・・・・・・・・・・・・・・・・・・・・・3-1 3.2 Power Sources Development Plan (Revised 5th M/P) ・・・・・・・・・・・・・・・・・・・・・・・・・・・・・・・・・・・・3-3 3.3 Current Situations and Review of Transmission System Development・・・・・・・・・・・・・・・・・・・・・3-6
Chapter 4 Possibility of Installation of Pumped Storage Power Plant 4.1 Roles and Functions of PSPP・・・・・・・・・・・・・・・・・・・・・・・・・・・・・・・・・・・・・・・・・・・・・・・・・・・・・・・・・・4-1 4.2 Project Finding of PSPP ・・・・・・・・・・・・・・・・・・・・・・・・・・・・・・・・・・・・・・・・・・・・・・・・・・・・・・・・・・・・・・4-1 4.3 Preliminary Structural Design of the First Priority PSPP ・・・・・・・・・・・・・・・・・・・・・・・・・・・・ 4-7
Chapter 5 Feasibility of Development Peaking Power Supply
5.1 Feasibility of Developing Conventional Hydropower for Peaking Power Supply・・・・・・・・・・ 5-1 5.2 Other Power Sources ・・・・・・・・・・・・・・・・・・・・・・・・・・・・・・・・・・・・・・・・・・・・・・・・・・・・・・・・ 5-4
-ii-
Chapter 6 Master Plan on Optimization for Peaking Power Supply 6.1 Preliminary Study of Optimization of Peaking Power Supply・・・・・・・・・・・・・・・・・・・・・・・・・・・・・6-1 6.2 Study on the Optimal Composition of Power Development Focusing on Peaking
Supply ・・・・・・・・・・・・・・・・・・・・・・・・・・・・・・・・・・・・・・・・・・・・・・・・・・・・・・・・・・・・・・・・・・・・・・・・・・・・・・6-6 6.3 Study of System Reliability ・・・・・・・・・・・・・・・・・・・・・・・・・・・・・・・・・・・・・・・・・・・・・・・・・・・・・・・・・・・6-18
Chapter 7 Financial Evaluation 7.1 Past Financial Situation ・・・・・・・・・・・・・・・・・・・・・・・・・・・・・・・・・・・・・・・・・・・・・・・・・・・・・・ 7-1 7.2 EVN Financial Projection ・・・・・・・・・・・・・・・・・・・・・・・・・・・・・・・・・・・・・・・・・・・・・・・・・・・・ 7-3 7.3 Financial Projection based on Long Term Investment Plan・・・・・・・・・・・・・・・・・・・・・・・・・・・ 7-5
Chapter 8 Environmental Considerations for the Project from the Global Perspective 8.1 Environmental Considerations on Power Development ・・・・・・・・・・・・・・・・・・・・・・・・・・・・・・・・・・8-1 8.2 Demand Side Management (DSM)・・・・・・・・・・・・・・・・・・・・・・・・・・・・・・・・・・・・・・・・・・・・・・・・・・・・・8-6
Chapter 9 Recommendations 9.1 Recommendations from View Point of Power Development Plans・・・・・・・・・・・・・・・・・・・・・ 9-1 9.2 Recommendations from Financial Perspective ・・・・・・・・・・・・・・・・・・・・・・・・・・・・・・・・・・・・ 9-4 9.3 Recommendations on Power Development from the View Point of Environmental
Considerations ・・・・・・・・・・・・・・・・・・・・・・・・・・・・・・・・・・・・・・・・・・・・・・・・・・・・・・・・・・・・・ 9-4

ACRONYMS / ABBREVIATIONS
ABB : Asea Brow BoveriACSR : Alumunum Conductor Steel ReinforcedADB : Asian Development BankAFC : Automatic Frequency ControlASEAN : Association of Southeast Asian NationsBOD : Board of DirectorsBOM : Board of ManagementBOT : Build -Operate-TransferCC : Combined CycleCDM : Clean Development MechanismC/P : CounterpartDO : Diesel OilDSCR : Debt Service Coverage RatioDSM : Demand Side ManagementDSS : Daily Start and StopDWT : Dead Weight TonnageEGAT : Electricity Generating Authority of ThailandEIA : Environmental Impact AssessmentEL : ElevationEVN : Elctricity of VietnamFO : Furnace OilFPD : Forest Protection DepartmentF/S : Feasibility StudyGDP : Gross Domestic ProductGMS : Greater Mekong SulregaionGT : Gas TurbineHPC : Hydro Power StationIE : Institute of EnergyIGA : Inter Goverment Agreement
IMPACT : Integrated & Multi-purpose Package of Advanced Computational Toolsfor power system engineering
IPP : Independent Power ProducerJBIC : Japan Bank for International CooperationJETRO Japan External Trade Organization JICA : Japan International Cooperation AgencyLOLE : Loss-of-Load ExpectationM/P, MP : Master PlanMARD : Ministry of Agriculture and Rural DevelopmentMOI : Ministry of IndustryMOF : Ministry of FinanceMONRE : Ministry of Natural Resources and EnvironmentMOSTE : Ministry of Science Technology and EnvironmentMPI : Ministry of Planning and InvestmentNCMPC : Ho Chi Minh Power CompanyNEDO : New Energy and Industrial Technology Development Organization
NGO(s) : Non-Government Organization(s)NLDC : National Load Dispatching CentersNTFP : Non-Timber Forest Products
- 1/2 -

ACRONYMS / ABBREVIATIONS
ODA : Official Development AssistanceOE : Oil EquivalentOECF : The Overseas Economic CooperationOJT : On the Job TrainingPre-F/S : Preliminary Feasibility StudyP/S : Power StationPDPATⅡ : Power Development Planning Assist ToolPECC1 : Power Engineering Counsulting Company 1PLN : Perusahaan Umum Listrik NegaraPP : Power PurchasePSPP : Pumped Storage Power PlantPSS/E : Power System Simulator for EngineeringRETICS : Reliability Evaluation Tool for Inter-Connected SystemSCADA : Supervisory Control and Data AcquisitionSEA : Strategic Enviromental AssessmentSFR : Self Financing RatioSon La PMB : Son La Hydropower Project Management BoardS/S : SubstationST : Steam TurbineTA : Technical AsistanceTEPCO : Tokyo Electric Power CompanyTEPSCO : Tokyo Electric Power Services Co., Ltd.T/L : Transmission LineVEEA : Vietnam Electricity Engineering AssociationWASP : Wien Automatic System Planning PackageWB : The World BankWSS : Weekly Start and Stop WWF : World Wide Fund for Nature
- 2/2 -
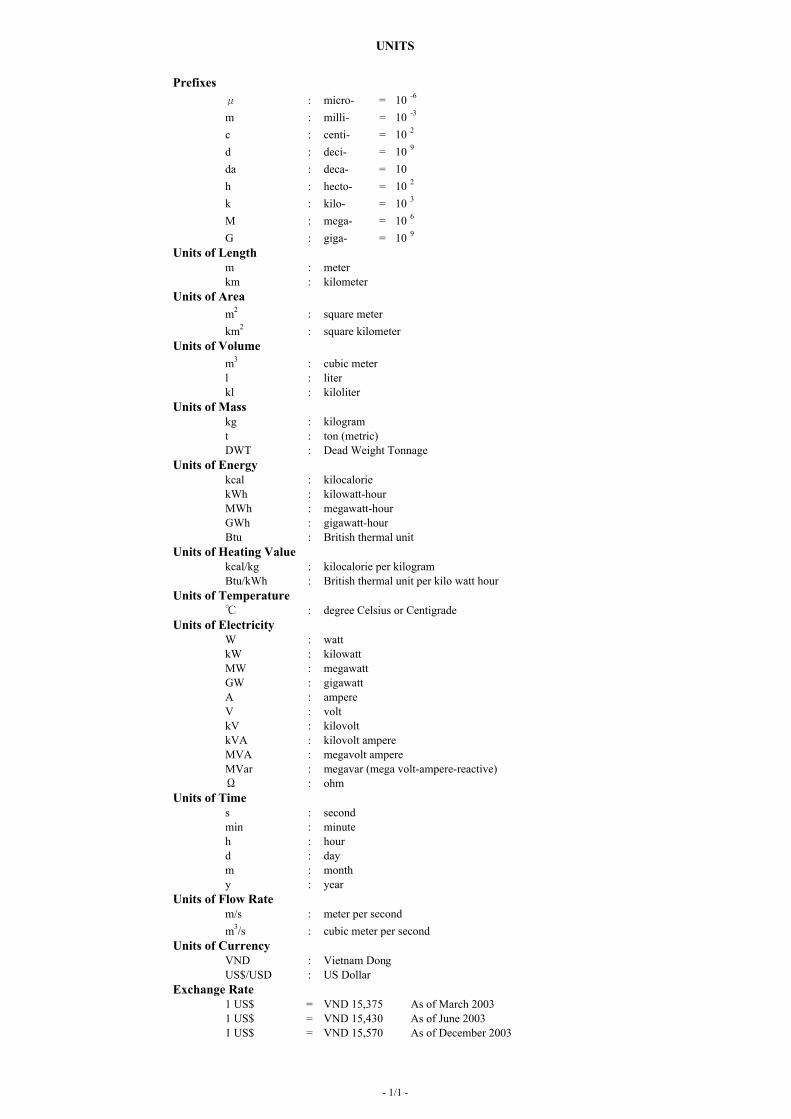
UNITS
Prefixesμ : micro- = 10 -6
m : milli- = 10 -3
c : centi- = 10 2
d : deci- = 10 9
da : deca- = 10h : hecto- = 10 2
k : kilo- = 10 3
M : mega- = 10 6
G : giga- = 10 9
Units of Length m : meterkm : kilometer
Units of Aream2 : square meterkm2 : square kilometer
Units of Volumem3 : cubic meterl : literkl : kiloliter
Units of Masskg : kilogramt : ton (metric)DWT : Dead Weight Tonnage
Units of Energykcal : kilocaloriekWh : kilowatt-hourMWh : megawatt-hourGWh : gigawatt-hourBtu : British thermal unit
Units of Heating Valuekcal/kg : kilocalorie per kilogramBtu/kWh : British thermal unit per kilo watt hour
Units of Temperature℃ : degree Celsius or Centigrade
Units of ElectricityW : wattkW : kilowattMW : megawattGW : gigawattA : ampereV : voltkV : kilovoltkVA : kilovolt ampereMVA : megavolt ampereMVar : megavar (mega volt-ampere-reactive)Ω : ohm
Units of Times : secondmin : minuteh : hourd : daym : monthy : year
Units of Flow Ratem/s : meter per secondm3/s : cubic meter per second
Units of CurrencyVND : Vietnam DongUS$/USD : US Dollar
Exchange Rate1 US$ = VND 15,375 As of March 20031 US$ = VND 15,430 As of June 20031 US$ = VND 15,570 As of December 2003
- 1/1 -

Master Plan Study on PSPP and Optimization for Peaking Power Generation, Summary Report
- 1-1 -
Chapter 1. Introduction
1.1 Background
Both electric power consumption and maximum demand in the Socialist Republic of Viet Nam
(hereinafter referred to as “Vietnam”) have shown high growth rates of 13% per year for the last 10
years. Therefore, the development of power sources and transmission systems has been an
important issue for Vietnam. In addition, daily electricity demand fluctuates significantly: the daily
maximum demand occurs at 6pm to 7pm is more than double the lowest demand late in the middle
of the night. Thus, the annual load factor in Vietnam is as low as 65%, while that of other Southeast
Asian countries reaches approximately 70%.
Nevertheless, measures to increase peaking supply capacity have not been taken but demand
side management (DSM) has been promoted by just placing different electricity tariffs between
peak hours and off-peak hours.
Under the situation, in March 2001, Electricity of Viet Nam (EVN) requested the Government
of JAPAN to carry out a development study to increase power system reliability and peaking supply
capacity. Accordingly, a basic study mission for project formulation was dispatched in January
2002 and discussed the requested development study with the Government of Vietnam.
Based on the discussion, preliminary study mission was dispatched in July 2002 and the S/W
of the Master Plan Study on PSPP and Optimization for Peaking Power Generation (hereinafter
referred to as “the Study”) was agreed upon with EVN, which was named as a counterpart of the
Study.
1.2 Objectives and Scope of the Study
(1) Objectives
Objectives of this study are as follows.
1) To study, based on supply and demand projections, the optimization of peaking power source
development through examination of optimal power sources composition.
2) To formulate a master plan of peaking power sources development by confirming system
reliability in consideration of domestic and international power exchange and international
power purchases.
3) To contribute to balance future electricity demand and supply in Vietnam.

Master Plan Study on PSPP and Optimization for Peaking Power Generation, Summary Report
- 1-2 -
(2) Geographical Scope
The Study covers the whole country of Vietnam.
(3) Scope of the Study
According to the S/W and M/M signed between EVN and JICA on July 16, 2002, the study
will be carried out in the following three (3) stages.
Stage 1: Preliminary Assessment
・ Related data and information are collected and analyzed to understand the existing
systems of power supply.
・ Demand forecasts and power development plans up to the year 2020 are reviewed and
data for examining peaking power sources development are prepared.
・ Especially demand forecast of every region (North, Center, South) and the expansion plan
of interconnected transmission lines are reviewed.
Stage 2: Project Identification
・ Criteria for selection of pumped storage potential sites are prepared.
・ The pumped storage candidate sites selected by Vietnam are reviewed, and fresh candidate
sites are selected and identified.
・ Priority sites are narrowed down from the candidate sites.
Stage 3: System Optimization
・ Economic viability of alternatives of peaking supply power other than pumped storage
hydropower is examined.
・ Master plan of peaking power sources development up to the year 2020 is proposed
through examination of the optimal power sources composition.

Master Plan Study on PSPP and Optimization for Peaking Power Generation, Summary Report
- 1-3 -
1.3 Methodologies of the Study
The Study Team can be divided into two groups and four fields as shown in Figure 1-1. The
studies in each field are closely coordinated to compile the master plan of power development. In
order to reflect comments of related organizations, W/S is held in each study stage.
Figure 1-1 Study Flow
Environmental surveyProject design and site surveyFinancial evaluationPower planning & analysis
Identification of criteria for selecting pumped storage potential sites
Selection of the tools for analysis
Study of peaking power sources other than pumped
storage Selection of the potential sites
Evaluation and selection (into about 5 sites)
The 2nd site survey of potential site (technical and environmental survey)
Preparation of concept design of priority sites and financing plan
Collection of data and analysis・energy policy, generation and
transmission development plan・load curve, demand forecasts・related policies
Preliminary study of optimization of peaking power sources
Collection of data and analysis
・financial data・future financial plan
Study of peaking power sources
Financial evaluation・current financial standing・future financial plan・assessment of projects
Establish the financing plan for priority pumped storage site
Collection of data and analysis
・operation of existing hydropower・operation of other power sources・power source plan for peaking
Collection of data and analysis
・Acts related environment・regulation of the nature park ・refuge area or world heritages・case of existing project・related information
Study of environmental issues
Collection of environmental information about potential sites
The 1st site survey of potential site (technical and environmental survey)
Evaluation and selection
Formulation of Master Plan
・power source development・master plan・technology transfer of
planning tools
W/S 1Jan 2003W/S 1
Jan 2003
W/S 2Aug 2003
W/S 2Aug 2003
W/S 3Feb2004W/S 3
Feb2004
Power planning, analysis and evaluation group Project investigation group

Master Plan Study on PSPP and Optimization for Peaking Power Generation, Summary Report
- 2-1 -
Chapter 2. Current Situations of Power Development
2.1 Energy Sector
(1) Energy Resources
a. Hydropower
Theoretical hydropower potential of the whole country is estimated at about 300 TWh per year.
The North possesses the biggest reserve with 180 TWh (60%), the Center 78 TWh (26%) and the
South 44 TWh (14%). The feasible hydropower resource amount is 82 TWh while installed
capacity is 17.7 GW. By the end of 2002, there are eight over-100MW existing power plants with
total installed capacity of 3,945MW, which is merely 22% of feasible hydropower potential.
b. Oil, Gas
The Vietnam continental shelf contains an abundant reserve of hydrocarbon. In 1986
Vietsovpetro, in a joint venture of Vietnam and the former Soviet Union, the two companies began
to exploit crude oil in the Bach Ho field of Cuu Long Basin, 120 km south west of Vung Tau.
After that, through investments from Western countries, more oil and gas have been explored and
exploited in Rong, Dai Hung, Rang Dong and Ruby fields of Cuu Long Basin as shown in Table
2-1. In addition to these fields, several big-reserve fields have been discovered such as Malay-Tho
Chu basin in southwest offshore; Nam Con Son Basin 200 km south east offshore from Cuu Long
Basin; and Song Hong Basin in the North region as well. The feasible gas potential is 328 BCM at
this stage.
According to the 5th Master Plan of Vietnam Power Development, hydrocarbon reserves,
which were inferred so far, were 390 million tons of oil and 617 billion m3 of gas.
c. Coal
Vietnam’s coal reserves lie principally in Hon Gai graben in Quang Ninh, which extends about
125km from Uong Bi in the west to Cai Bau in the east. Though the coal deposits are geologically
young, intense tectonic pressure had changed bituminous coal to semi-anthracite or anthracite. In
2002, coal reserves of 300m below the surface were estimated at 3.8 billion tons as shown in Table
2-2, most of which are anthracite with high calorific value and low sulfur content (semi-anthracite
and anthracite account for 85%, lignite 5% and peat 10%). The ratio of open-pit and underground
mines is 2:8.
Moreover, significant coal deposits have been discovered in the Red river basin. According to
Master Plan Study on PSPP and Optimization for Peaking Power Generation, Summary Report
- 2-2 -
2P AnnualReserves Supply(BCM) Capability
9-1 (Bach Ho) Associated Gas underproduction
9-1 (Rong)01,02 (Ruby, Emerald) Petronas Carigali/ PVEP 25.5 1 Expected first gas in 2005
15-2 (Rang Dong) JVPC/ Conoco/ PVEP 9 0.5 Associated Gas underproduction
06-1(Lan Tay, Lan Do) ONGC (India),BP 57 2.7
Phu My 1Phu My 2-2Phu My 3Phu My 4
First gas planned 2003
11-2 Rong Doi, Rong DoiTay, Rong vi dai KNOC (Korea), Mobil 30 1.3 Phu My 2-2 Under development
05-3 (Moc Tinh) BP/Conoco 20 1.3 No plan Under projection
05-2 (Hai Thach) BP 47 1-2 No plan Under appraisal &development
B, 48/95, 52/97UnocalMOECOPV (PVSC)
90 2-4 Under appraisal &development
PM-3 CAA Petrronas, PV-Co owners(50:50) 50%*52 50%*2.5 First gas to VN by the end
2005
Song Hong Thai binh (Tra Ly River),D14, Tien Hai C
Maural & Prom (France),Petro Vietnam 4 0.08 Operation partially
Total 328.5 12.6-15.6
Basin Block Developer Supply &Development Plan Remark
Local Industry
Nam Con Son
Malay-ThoChu
(Southwestoffshore)
PM 2-1, Ba ria, LPGCuu Long
Depending on gasmarket
20 1.5Vietsovpetro JV(PetroVietnam 50%, Nestro 50%)
Power & Fertilizercomplex in Ca Mau
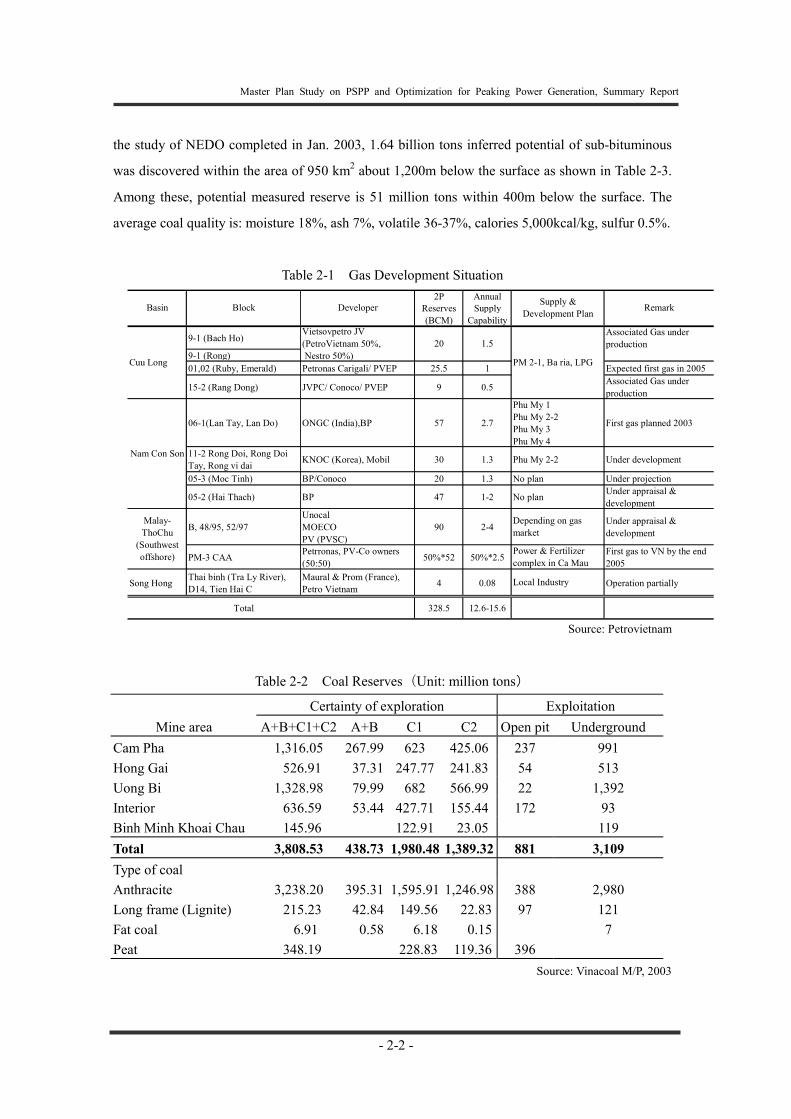
the study of NEDO completed in Jan. 2003, 1.64 billion tons inferred potential of sub-bituminous
was discovered within the area of 950 km2 about 1,200m below the surface as shown in Table 2-3.
Among these, potential measured reserve is 51 million tons within 400m below the surface. The
average coal quality is: moisture 18%, ash 7%, volatile 36-37%, calories 5,000kcal/kg, sulfur 0.5%.
Table 2-1 Gas Development Situation
Source: Petrovietnam
Table 2-2 Coal Reserves(Unit: million tons)
Certainty of exploration Exploitation Mine area A+B+C1+C2 A+B C1 C2 Open pit Underground
Cam Pha 1,316.05 267.99 623 425.06 237 991 Hong Gai 526.91 37.31 247.77 241.83 54 513 Uong Bi 1,328.98 79.99 682 566.99 22 1,392 Interior 636.59 53.44 427.71 155.44 172 93 Binh Minh Khoai Chau 145.96 122.91 23.05 119 Total 3,808.53 438.73 1,980.48 1,389.32 881 3,109 Type of coal Anthracite 3,238.20 395.31 1,595.91 1,246.98 388 2,980 Long frame (Lignite) 215.23 42.84 149.56 22.83 97 121 Fat coal 6.91 0.58 6.18 0.15 7 Peat 348.19 228.83 119.36 396
Source: Vinacoal M/P, 2003

Master Plan Study on PSPP and Optimization for Peaking Power Generation, Summary Report
- 2-3 -
Table 2-3 Red River Coal Reserves(Unit: 1000 ton)
Source: Red River Delta Project, January 2003, NEDO
(2) Energy Development Plan
a. Hydropower
Hydropower is a clean and renewable energy resource. Though sizeable up-front costs are
needed for development, once operated this energy is cheap and stable for more than one hundred
years and out of influence of the exchange rate fluctuation because fuel costs are zero. Therefore,
EVN should properly develop hydropower plants, which have economic rationale.
According to the latest power development plan, a total of 12,135MW hydropower is
developed from 2003 to 2020, of which the north region cover 54%, the central 29%, and the south
17%. This results in developing 91% of the feasible hydropower potential of 16,080MW by 2020.
b. Oil, Gas
Table 2-4 shows the exploitation plan of the oil and gas sector indicated in the 5th M/P. As of
the end of 2002, the total capacity of oil thermal power plants excluding IPP was only 198MW,
which is total of the capacity of Thu Duc Power Plant (165MW) and Can Tho Power Plant (33MW),
both of which have to import FO for operation. The only planned oil thermal plant is O Mon TPP
No.1 with the capacity of 600MW. However, gas will be used on completion of the pipeline from
the gas potential in southeast offshore to O Mon in 2010.
On the other hand, along with the rapid increase of gas production, a total of 10,483MW gas
thermal power plant is under planning between 2003 and 2020. Excluding Quang Tri power plant
F.K.Fault - K.SSyncline
Binh NinhAnticline.-
BinhWest East
Measured Indicated Inferred Inferred Inferred< 400m 400-800m 800-1200m < 1200m < 1200m
V17 38,520 86,697 72,734 197,951 15,756 8,789 222,496
V15 52,369 94,889 64,671 211,929 17,573 20,030 249,532
V14 88,664 131,867 73,434 293,965 34,216 19,738 347,919
V4 88,055 86,563 53,516 228,134 14,874 21,042 264,050
V3 243,602 164,478 81,222 489,302 42,123 23,826 555,251
Gross Total 511,210 564,494 345,577 1,421,281 124,542 93,425 1,639,248
K.S Syncline - Binh Ninh Anticline
MiddleSeam Gross Total
Total

Master Plan Study on PSPP and Optimization for Peaking Power Generation, Summary Report
- 2-4 -
(720MW) in the central region, all the planned gas thermal power plants are located in the south
region, and none is proposed in the north region. The current of gas supply price is approximately
US$1.8/mmbtu at the platform, excluding transfer costs through pipelines.
Table 2-4 Petroleum Exploitation Plan (Unit: million m3 OE)
2000 2005 2010 2020
Oil Production 16.5 17.6-18 20.6-21.6 11-18
Gas Production 1.5 6.7 11.5-13.5 14-18
Source: Institute of Energy, 2003
c. Coal
The latest coal exploitation plan is shown in Table 2-5. The average coal price (ex-works
price) is VND319/kg and the price for generation is as low as VND305 to 332/kg. In addition, the
coal sector is a completely domestic industry, so that coal price is set up in local currency and
stable out of influence of exchange rate fluctuation. Since coal is mainly used for the power and
cement sectors, exhaustion of coal resources is not as much of a concern as the possibility of
exhaustion of gas. Therefore, the coal thermal power plant is given high priority to develop as a base power source; plans for a total of 5,800MW of coal plants is underway from
2003 to 2020.
Due to the location of reserves, all the existing coal power plants are in the northern region.
However, considering the abundant potential and stable price, the latest power development plan
proposes to develop a coal thermal power plant in the south region utilizing imported and/or
domestic coal. Vinacoal estimates that, with a tanker of 4,000 to 6,000 tons, the price of coal
transferred to the south region is about US$5/ton to Nui Xuoc, $7/ton to HCM City, $10/ton to
Kien Giang.
Table 2-5 Coal Exploitation Plan (Unit: 106 ton)
2000 2005 2010 2015 2020
10.5-11.0 12-13 14-15 - 15-20 Coal Production
10.5-11.0 16 24 27 30
Source: Upper: 5th Master Plan of Electric Power Development in Vietnam, Jun. 2001
Lower: Vinacoal M/P, 2003

Master Plan Study on PSPP and Optimization for Peaking Power Generation, Summary Report
- 2-5 -
(3) Demand-and-Supply Plan of Primary Energy
Table 2-6 shows demand-and-supply plan of primary energy proposed in the 5th M/P. Primary
energy demand is expected to increase at the AAGR of 8.2% from 2000 to 2020. Primary energy
supply continues to exceed its demand by 2010. Meanwhile, due to the reduction of the rate of
increase of coal and oil production, the supply is expected to fall below the demand by
approximately 28% in 2020.
Table 2-6 Primary Energy Demand-and-Supply Forecasts (Base Scenario)
2000 2005 2010 2020 KTOE KTOE KTOE KTOE
Energy Demand 18,131 27,878 44,360 88,228Domestic Supply
27,766 37,426 50,086
63,324
Coal (mil. ton) 11.6 6,501 16.2 9,053 22.8 12,772 30.1 16,846Oil (mil. ton) 16.3 16,564 20.0 20,324 21.6 21,989 18.0 18,324Gas (bil. m3) 1.6 1,440 4.5 4,050 8.8 7,939 18.0 16,200Other (TWh) 14.6 3,261 17.9 3,999 35.1 7,386 58.4 11,954
Surplus/Shortage +9,635 +9,548 +5,726 -24,904Source: Institute of Energy, 2003
(4) National Energy Security
Though Vietnam is endowed with abundant energy resources, the future energy security
balance is estimated as shown in Table 2-7 based on the above each primary energy potential and
exploitation plan.
If the fossil fuel consumption increases at this rate, gas can be supplied from the proven gas
reserve until no longer than 2030, meanwhile coal can be supplied from the proven coal reserves
until 2120. In other words, it is necessary to explore and prove more gas reserves of 300BCM so as
to supply gas to the planned and existing gas thermal power plants during their service life of 25
years.
Table 2-7 Security Balance of Fossil Fuel (Base Scenario)
Potential (upper: :measured)(lower: inferred)
Exploitation Volume (2000-2020)
Residual Quantity Exploitable years after
2020 4,500 4,075 ≧100
Coal (mil. tons) 10,000
435*9,575 ≧200
330 168 ≦ 10 Gas (bil. m3)
617162
455 ≦ 30 *:Based on the exploitation plan of Vinacoal

Master Plan Study on PSPP and Optimization for Peaking Power Generation, Summary Report
- 2-6 -
2.2 Power Development
(1) Electricity Consumption, Peak Demand, and Characteristics of Consumption
Records of climate, economic situation, electricity consumption, peak demand, and
characteristics of consumption pattern of the system are reviewed and analyzed.
a. Climate
Vietnam belongs to the Asia Monsoon Zone. The climate is quite different between the north
with subtropical climate and the south with tropical climate. The north has four seasons and the
temperature varies with each season. Summer begins in May with an average temperature of over
25 degrees. In June and July the weather gets hotter and sultry. July and August usually come with
storms and heavy rain. Winter lasts from the end of December to the end of March, when it drizzles
constantly and temperature is low and sometimes drops to around 10 degrees. Meanwhile the South
has 2 seasons, a rainy season in May-October, and a dry season in November-April. The average
temperature does not change much throughout the year (Figure 2-1).
(a) Temperature (b) Humidity
Figure 2-1 Regional climate change by month
Source: Hydro-Meteorological Data Center, Hanoi
b. Economy
Table 2-8 shows the population, real GDP, consumer price index, and commercial energy
consumption of the country since 1990. The Vietnam economy has maintained steady growth with
an annual average growth rate (AAGR) of 7.5% between 1990 and 2000. During the period, GDP
per capita increased from US$206 to 356. The change of consumer price index is relatively stable,
having the AAGR of 3.7% for 5 years from 1995. The AAGR of energy consumption remains 0.5%
during 1990 to 2000.
10
15
20
25
30
35
Jan Feb Mar Apr May Jun Jul Aug Sep Oct Nov Dec
Tem
pera
ture
(deg
)
North Central South
50
60
70
80
90
100
Jan Feb Mar Apr May Jun Jul Aug Sep Oct Nov Dec
Hum
idity
(%)
North Central South

Master Plan Study on PSPP and Optimization for Peaking Power Generation, Summary Report
- 2-7 -
Table 2-8 Historical Macro-Economic Index
Index Unit 1990 1992 1994 1996 1998 2000
Population (106) - 66.20 68.99 71.68 74.30 76.52 78.52
GDP (109) 1995 US$ 13.61 15.67 18.44 22.08 25.27 27.93
GDP per capita 1995 US$ 205.65 227.17 257.19 297.18 330.17 355.74
CPI 1995=100 na na na 105.68 116.99 119.72
Energy Use 103 KTOE 24.69 25.82 28.02 32.09 34.26 na
Energy Use per capita KGOE 372.96 374.26 390.87 431.92 447.73 372.96
Source: World Development Indicators, WB
c. Electric Power Demand1
1) Yearly Demand
As shown in Figure 2-2, electricity consumption rapidly increased at AAGR by 15% between
1995 and 2002. As a result, the elasticity of consumption on GDP for 6 years since 1995 exceeded
2.0, whereas neighboring countries generally were at 1.0 to 1.5. Regarding the sector share of
consumption, household and industry cover about 50% and 40% respectively.
(a) Consumption (b) Sector share
Figure 2-2 Historical electricity consumption by sector
2) Yearly Peak Demand
Figure 2-3 shows historical changes of yearly peak demand and annual load factor. From 1995
to 2002, peak demand rapidly increased at the AAGR of 14%. It reached 6,554MW in 2002, which
is more than double of the demand in 1995.
Annual load factors for the last 3 years have clear regional differences: about 55% in north and
central region, and 69% in the south region.
1 Historical demand data in this section are based on data from IE and NLDC.
0
5,000
10,000
15,000
20,000
25,000
30,000
35,000
1995 1996 1997 1998 1999 2000 2001 2002
Cons
umpt
ion
(GW
h)
0
5
10
15
20
25
30
35
Gro
wth
rate
(%)
Industry Household Service Agriculture Others
0%
20%
40%
60%
80%
100%
1995 1996 1997 1998 1999 2000 2001 2002
Cons
umpt
ion
by T
ype
Industry Household Service Agriculture Others

Master Plan Study on PSPP and Optimization for Peaking Power Generation, Summary Report
- 2-8 -
(a) Yearly peak demand (b) Annual load factor
Figure 2-3 Historical Changes of Yearly Peak Demand and Annual Load Factor
3) Monthly Peak Demand
Figure 2-4 shows historical monthly peak demand of the whole country and regional results in
2002. Monthly peak demand of the country reaches its maximum in the year-end. This is a typical
phenomena observed in rapidly developing countries where the trend in continuous demand growth
masks monthly fluctuation caused by seasonal factors. In addition, it is assumed that the reduction
of monthly peak demand in June and July is the result of planned outage due to the decrease in
supply capability in the flood season. Regional monthly peak demand shows a similar trend with
the whole country.
(a) Whole Country (b) Regional (2002)
Figure 2-4 Historical Monthly Peak Demand
40%
45%
50%
55%
60%
65%
70%
75%
1995 1996 1997 1998 1999 2000 2001 2002
Annu
al Lo
ad F
acto
r
Whole Country North Central South
0
1,000
2,000
3,000
4,000
5,000
6,000
7,000
1995 1996 1997 1998 1999 2000 2001 2002
Peak
Dem
and
(MW
)
0
3
6
9
12
15
18
21
Grow
th ra
te (%
)
North Central South
0
1000
2000
3000
4000
5000
6000
7000
Jan Feb Mar Apr May Jun Jul Aug Sep Oct Nov Dec
Peak
Dem
and
(MW
)
1996 1997 1998 19992000 2001 2002
0
500
1000
1500
2000
2500
3000
3500
Jan Feb Mar Apr May Jun Jul Aug Sep Oct Nov Dec
Peak
Dem
and
(MW
)
North Central South

Master Plan Study on PSPP and Optimization for Peaking Power Generation, Summary Report
- 2-9 -
4) Daily Demand
Figure 2-5 illustrates changes in daily load curve (annual average) of the country and regions.
The daily load curve in Vietnam currently has two peaks: daytime peak at around 11am due to
industrial demand and nighttime peak at 7pm caused mainly by household use. Differences in daily
maximum and minimum demand are approximately 50% in the country, 60% in the north and
central, and 40% in the south region. In every region, nighttime peak exceeds daytime peak.
However, a distinctive trend is that the difference between them is continuously decreasing due to
the rapid growth of day peak. Particularly in the south region, where daily fluctuation is relatively
small, the recent daytime peak is almost equal with the nighttime peak.
(a) The whole country (b) The north region
(c) The central region (d) The south region
Figure 2-5 Changes in Daily Load Curve (Annual average)
(2) Existing Power Facilities
a. Existing Power Plants
The composition of the total installed capacity of 8,505MW is: hydropower 48%, gas thermal
27%, coal thermal 15%, and others 10%. Regional power source composition is significantly
different due to the locations of energy resources. The north region, which has abundant hydro and
coal potential, is composed of hydropower (62%) and coal thermal (38%). Most of the coal thermal
power plants in the north region were constructed in the 1970s through the early 1980s.
0
1000
2000
3000
4000
5000
6000
1 3 5 7 9 11 13 15 17 19 21 23
Dem
and
(MW
)
1996
1997
1998
1999
2000
2001
2002
0
500
1000
1500
2000
2500
1 3 5 7 9 11 13 15 17 19 21 23
Dem
and
(MW
)
1996
1997
1998
1999
2000
2001
2002
0
100
200
300
400
500
600
700
1 3 5 7 9 11 13 15 17 19 21 23
Dem
and
(MW
)
1996
1997
1998
1999
2000
2001
2002
0
500
1000
1500
2000
2500
3000
1 3 5 7 9 11 13 15 17 19 21 23
Dem
and
(MW
)
1996
1997
1998
1999
2000
2001
2002
Master Plan Study on PSPP and Optimization for Peaking Power Generation, Summary Report
- 2-10 -
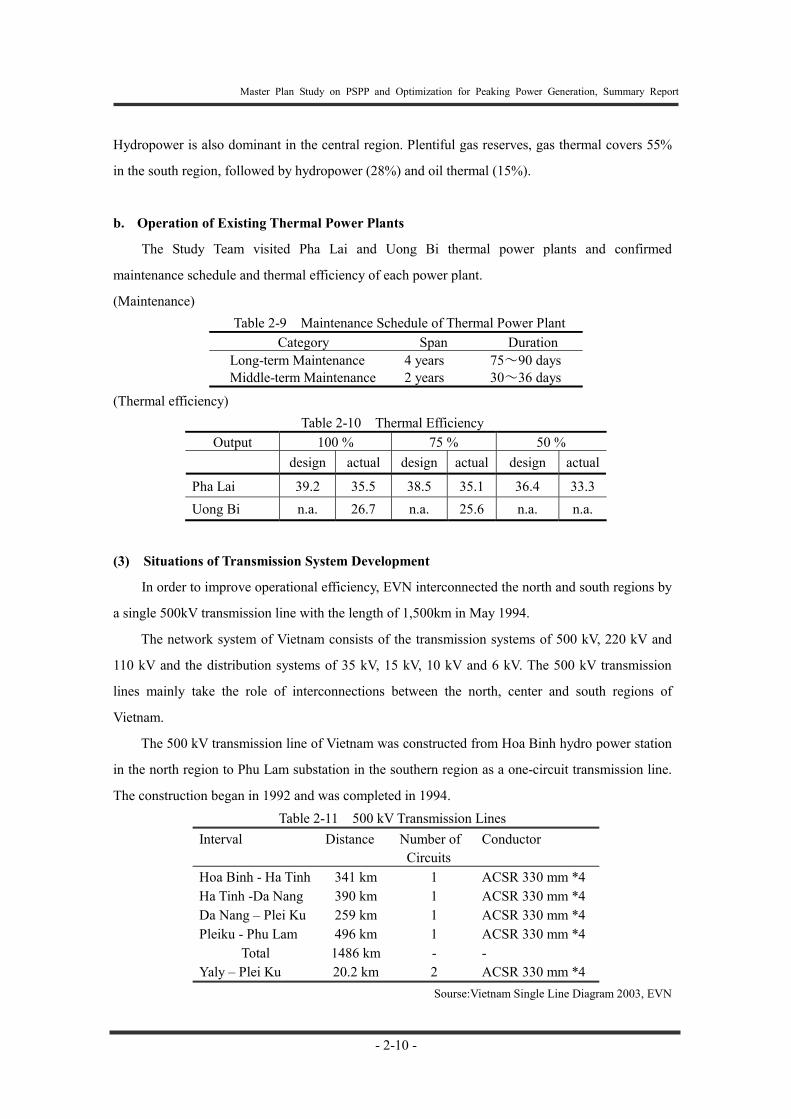
Hydropower is also dominant in the central region. Plentiful gas reserves, gas thermal covers 55%
in the south region, followed by hydropower (28%) and oil thermal (15%).
b. Operation of Existing Thermal Power Plants
The Study Team visited Pha Lai and Uong Bi thermal power plants and confirmed
maintenance schedule and thermal efficiency of each power plant.
(Maintenance) Table 2-9 Maintenance Schedule of Thermal Power Plant
Category Span Duration Long-term Maintenance 4 years 75~90 days Middle-term Maintenance 2 years 30~36 days
(Thermal efficiency) Table 2-10 Thermal Efficiency
Output 100 % 75 % 50 % design actual design actual design actual
Pha Lai 39.2 35.5 38.5 35.1 36.4 33.3 Uong Bi n.a. 26.7 n.a. 25.6 n.a. n.a.
(3) Situations of Transmission System Development
In order to improve operational efficiency, EVN interconnected the north and south regions by
a single 500kV transmission line with the length of 1,500km in May 1994.
The network system of Vietnam consists of the transmission systems of 500 kV, 220 kV and
110 kV and the distribution systems of 35 kV, 15 kV, 10 kV and 6 kV. The 500 kV transmission
lines mainly take the role of interconnections between the north, center and south regions of
Vietnam.
The 500 kV transmission line of Vietnam was constructed from Hoa Binh hydro power station
in the north region to Phu Lam substation in the southern region as a one-circuit transmission line.
The construction began in 1992 and was completed in 1994. Table 2-11 500 kV Transmission Lines
Interval Distance Number of Circuits
Conductor
Hoa Binh - Ha Tinh 341 km 1 ACSR 330 mm *4 Ha Tinh -Da Nang 390 km 1 ACSR 330 mm *4 Da Nang – Plei Ku 259 km 1 ACSR 330 mm *4 Pleiku - Phu Lam 496 km 1 ACSR 330 mm *4
Total 1486 km - - Yaly – Plei Ku 20.2 km 2 ACSR 330 mm *4
Sourse:Vietnam Single Line Diagram 2003, EVN

Master Plan Study on PSPP and Optimization for Peaking Power Generation, Summary Report
- 2-11 -
(4) Transmission System and SCADA System Operation
Figure 2-6 shows the load dispatching structure of EVN. Located in Hanoi, NLDC operates
large-scale generators and 500kV transmission lines, and the controls frequency of the whole
system. NLDC also manually changes the position of transformer taps and orders to operate shunt
reactors. Under NLDC, regional load dispatching centers in the north, central and south region
operate 200kV and lower voltage transmission systems as well as regional shunt reactors.
Furthermore, regional supply centers operate 110-66kV transmission systems under the regional
load dispatching centers.
Figure 2-6 Load Dispatching Structure of EVN
(5) Electricity Tariff System
EVN adopts a nationwide uniform tariff system based on power use.
The tariff system is comprised of two prices, for Vietnamese and for foreigners. Foreigner
price is set higher than twice the level of Vietnamese price.
In terms of household use, electricity expense is charged according to the amount of electricity
consumed. For other users, three tariff rates are applied: peak, normal, and off-peak hours.
Plans to revise the tariff has been discussed and changed many times in the past. The current
electricity tariff was revised in October 2002 and the average tariff was raised to 5.6 cents/kWh.
The tariff schedule used in EVN financial projections, which the mission obtained from the
Finance and Accounting Division, plans to achieve 7.0 cents/kWh in April 2006. Based on this
schedule, EVN has already requested to the government to raise the tariff to 5.9 cents/kWh in April
2004.
NLDC
North region LDC
(Hanoi)
Central region LDC (DaNang)
- operation of large generators - operation of 500 kV transmission lines - frequency control
- operation of small/medium generators- operation of 220/110/66 kV lines - operation of regional shunt reactors
North region supply center
Central region supply
center
South region supply center
- operation of 110/66 kV transmission lines
South region LDC
(HCMC)

Master Plan Study on PSPP and Optimization for Peaking Power Generation, Summary Report
- 2-12 -
2.3 Environmental Considerations in Vietnam
The current conditions and contents of the following items will be reviewed, and based on the
results, appropriate and adequate evaluation of the Project will be enacted.
Environmental considerations conducted in the previous water resource developments of
which purposes are power development and flood control
System of the Environmental Impact Assessment (EIA) in Vietnam
Protected area system in Vietnam
Policies and measures for conserving important fauna / flora and ecosystems
Interviews have been conducted with Yaly HPP and the relevant governmental organizations /
institutes on the environmental issues. The followings summarize points of interviews and
discussions.
(1) Ministry of Natural Resources and Environment (MONRE)
・MOSTE was divided into MOST (Ministry of Science and Technology) and MONRE (Ministry
of Natural Resources and Environment) in December 2002.
・Regarding to nature conservation in Vietnam, MONRE closely works together with MRAD
(Ministry of Agriculture and Rural Development) which is in charge of the protected area
system.
・Regarding to an EIA for the Study, a preliminary EIA should be conducted for a whole study and
a report should be submitted to MONRE. After approval from MONRE, a detailed EIA should be
conducted at each PSPP site at a feasibility study stage.
・The following references were collected.
Documents of setting up a report on EIA
Circular letter of guidance on setting up & reviewing
(2) Ministry of Agriculture and Rural Development (MARD)
・There are 14 national parks in Vietnam.
・There are 94 protected areas and there is a plan to increase them to 120 in the future.
・There is an approved plan by the government that, by 2010, the area under protection will be
increased to 2,000,000 ha (target figure). This figure has already been mentioned by the current
plan of expansion of the protected area system. This plan is expected to be reviewed and to be
approved by the end of this year.
・There are three categories of protected areas, namely National Parks, Nature Reserves and
Cultural, Historical and Environmental Sites. Currently, there is an idea to categorize nature

Master Plan Study on PSPP and Optimization for Peaking Power Generation, Summary Report
- 2-13 -
reserve into Nature Reserve and Species and Habitat Protected Area.
・Regarding a map with a boundary of each protected area, maps of national parks should be held
by FPD or FIPI (Forest Inventory and Planning Institute). Maps of the other protected areas are
not well prepared yet. About half of the protected areas have this kind of map. FIPI or
institutions of provincial governments should also have these maps.
・Each protected area has an Investment Plan, and detailed information on each protected area
should be described in the Investment Plan.
・Although a provincial government may establish a buffer zone for a protected area, there is no
legal base for establishing a buffer zone.

Master Plan Study on PSPP and Optimization for Peaking Power Generation, Summary Report
- 3-1 -
Chapter 3. Current Situations and Evaluation of Power Sources Development Plan (Revised 5th M/P)
3.1 Evaluation of Demand Forecasts
(1) Confirmation of Demand Forecasts
Focusing on this trend, the consumption forecasts of EVN are examined in this section,
referring to the historical growth process of neighboring countries. In other words, regression
analysis is conducted to estimate the electricity intensity from the GDP per capita, incorporating
data of neighboring countries. Accordingly, future electricity consumption is estimated with the
identified regression function and compared with EVN forecasts.
Figure 3-1 compares consumption forecasts of EVN and the Study Team. EVN forecasts
appear slightly higher than the Study Team. The difference, however, is within 10% and both
forecasts generally show good accordance.
Based on the discussion above, it is confirmed that EVN consummation forecasts are consistent
with the historical experience of neighboring countries. In other words, the trend of the slowing
down of economic development, and of the growth of electricity intensity is appropriately
considered in the demand forecasts of EVN.
(a) Base Case (b) High Case
Figure 3-1 Comparison of Consumption Forecasts
(2) Forecasts of Daily Load Curve
As described before, the current daily load curve in Vietnam is the night-peak type, showing
the daytime peak at about 11am followed by a higher nighttime peak at 7pm. In line with the
increase of industrial demand, however, increase of daytime peak tends to exceed that of the
0
50
100
150
200
250
1995
1998
2001
2004
2007
2010
2013
2016
2019
Con
sum
ptio
n (T
Wh)
JICA StudyIE High Case
0
50
100
150
200
250
1995
1998
2001
2004
2007
2010
2013
2016
2019
Con
sum
ptio
n (T
Wh)
JICA StudyIE Base Case

Master Plan Study on PSPP and Optimization for Peaking Power Generation, Summary Report
- 3-2 -
nighttime peak, resulting in a decreasing trend in the difference between the daytime and nighttime
peak. Neighboring countries like Malaysia and Thailand also experienced a shift from night-peak to
day-peak type along with economic development. Thus, it is likely that demand of Vietnam also
will shift to day-peak type in the future.
Accordingly, from the view of projecting an example of possible changes based on specific
assumptions, this section tries to forecast future changes of load curves and provide the results to
optimization analysis of peaking power sources. The forecasts apply the trend analysis method
which is conducted by each region, considering clear regional differences in a daily load profile.
The results of forecasts are shown in the following figures.
Figure 3-2 Annual Average Load Curve Forecast (Regional)
(a) Yearly Generation (b) Yearly Peak Demand
(c) Annual Load Factor (d) Monthly Generation/Peak Demand (2020)
Figure 3-3 Forecasts of Generation/Peak Demand and Load Factor (Whole Country)
0
5000
10000
15000
20000
25000
30000
35000
1 2 3 4 5 6 7 8 9 10 11 12 13 14 15 16 17 18 19 20 21 22 23 24
Dem
and
(MW
)
1996199820002002200420062008201020122014201620182020
0%
20%
40%
60%
80%
100%
120%
1 2 3 4 5 6 7 8 9 10 11 12 13 14 15 16 17 18 19 20 21 22 23 24
Dem
and
1996199820002002200420062008201020122014201620182020
0
5,000
10,000
15,000
20,000
25,000
30,000
35,000
2003
2005
2007
2009
2011
2013
2015
2017
2019
Pmax
(MW
)
JICAIE-Base
0
50,000
100,000
150,000
200,000
250,000
2003
2005
2007
2009
2011
2013
2015
2017
2019
Dem
and
(GW
h)
JICAIE-Base
404550556065707580
2003
2005
2007
2009
2011
2013
2015
2017
2019
Load
Fac
tor (
%)
JICAIE-Base
02000400060008000
100001200014000160001800020000
Jan
Feb
Mar
Apr
May Jun Jul
Aug Sep
Oct
Nov
Dec
Gen
erat
ion
(GW
h)
0500010000150002000025000300003500040000
Peak
Dem
and
(MW
)
Generation (GWh) Pmax (MW)

Master Plan Study on PSPP and Optimization for Peaking Power Generation, Summary Report
- 3-3 -
Major conclusions identified through the daily load curve forecasts are:
• Every region maintains the historical trend that daytime peak grows faster than the
nighttime peak, resulting in a shifting toward day-peak type by 2008.
• With the growth of the daytime peak at around 11am, demand from 2 to 4pm also
rapidly increases, showing daytime peaks before and after the lunch break as widely
observed in advanced countries.
• Load curves by type keep similar differences (Peak Day: Weekday, Peak Day: Holiday).
• Annual generation and peak demand demonstrate similar results with EVN forecasts
except the south region, which becomes greater after 2015.
• Annual load factors also show comparable results with ENV forecasts, leveling off at
67% in north, 65% in central, 70% in the south region after 2010.
• Following historical trends, monthly peak demand increases toward the year-end, and
monthly generation fluctuates along with changes in monthly temperature.
3.2 Power Sources Development Plan (Revised 5th M/P)
(1) Power Sources Development Plan
The Updated power sources development plan (base case), based on the revised 5th Master
Plan, has been obtained from IE. According to the revised plan, Figure 3-4 summarizes power
sources development in terms of fuels and regions up to year 2020.
The figure indicates that, new power sources totaling 34.8GW, including power purchases
from neighboring countries, will be developed between 2003 and 2020. Among this 34.8GW,
hydropower and gas thermal power cover 35% (12.1GW) and 31% (10.5MW). From the view of
power sources composition, the composition of gas thermal (24%->29%) and coal thermal
(15%->16%) increases whereas that of hydropower (48%->37%) and oil thermal (10%->3%)
decreases.
The Whole Country
0 5
10 15 20 25 30 35 40 45 50
2002 2005 2010 2015 2020
Inst
alle
d Ca
paci
ty (G
W)
Nuclear Import Diesel Oil Gas Coal Hydro
0% 10% 20% 30% 40% 50% 60% 70% 80% 90%
100%
2002 2005 2010 2015 2020
Inst
alle
d C
apac
ity (G
W)
Nuclear Import Diesel Oil Gas Coal Hydro
Figure 3-4 Power Sources Development Plan (Revised 5th M/P, Base Case)

Master Plan Study on PSPP and Optimization for Peaking Power Generation, Summary Report
- 3-4 -
(2) Supply and Demand Balance
Based on the revised 5 Master Plan, dividing Vietnam power system into two systems, North
region and Centre & South region, each demand supply balance in June is shown in Figure 3-5.
Total supply capability in June is the lowest in the year because water levels of large reservoirs
such as Hoa Binh are lowered for flood control. Here, every supply capability of planned power
plant is counted in the following commissioning year in the revised 5th Master Plan, since every
planned power plant will be sure put into operation by the end of the year.
Crucial issues as follows can be figured out in this demand supply balance.
- Since development of power sources can not catch up with the recent power demand growth,
the reserve margin in the whole country will be below 10% until 2006.
- Supply capability in the North has been less than power demand since 2001. The North
System relies on transmitted power from the Centre & South System during peak time.
Moreover, the supply capability in the North will fall short especially from 2004 to 2006.
The reserve margin will be almost zero even if the full capacity power of the existing
North-South 500kV transmission line is transmitted from the Centre & South System to the
North. With consideration of deterioration of the existing coal thermal power plants and the
high rate of accident on the North-South interconnection line, it is highly likely that the
North will experience a serious power shortage.
The following two countermeasures are contemplated in order to avoid the above power crisis
in the North.
To accelerate construction of the second North-South 500kV transmission line. : However, it
seems difficult to put into operation before June 2005 in view of the present progress of the
project.
To move the GT plants which can use diesel oil form the South to the North: It seems likely
that these power plants can be put into operation until June 2005 and the reserve margin in
the North System will increase about 5%, if the construction can be carried out promptly.

Master Plan Study on PSPP and Optimization for Peaking Power Generation, Summary Report
- 3-5 -
Source : Revised No.5 MP, IE
Figure 3-5 Demand Supply Balance (kW)(Revised No.5 Master Plan; Base Case)
Whole Country
05,000
10,00015,00020,00025,00030,00035,00040,000
1995
1997
1999
2001
2003
2005
2007
2009
2011
2013
2015
2017
2019
Pow
er (M
W)
-20.0%-10.0%0.0%10.0%20.0%30.0%40.0%50.0%60.0%70.0%80.0%
Res
erve
Mar
gin
(%)
Peak Load Supply Capability Reserve Margin (%)
North Region
0
5,000
10,000
15,000
20,000
25,000
1995
1997
1999
2001
2003
2005
2007
2009
2011
2013
2015
2017
2019
Pow
er (M
W)
-20.0%-10.0%0.0%10.0%20.0%30.0%40.0%50.0%60.0%70.0%80.0%
Res
erve
Mar
gin
(%)
Central & South Region
0
5,000
10,000
15,000
20,000
25,000
1995
1997
1999
2001
2003
2005
2007
2009
2011
2013
2015
2017
2019
Pow
er (M
W)
-20.0%-10.0%0.0%10.0%20.0%30.0%40.0%50.0%60.0%70.0%80.0%
Res
erve
Mar
gin
(%)

Master Plan Study on PSPP and Optimization for Peaking Power Generation, Summary Report
- 3-6 -
3.3 Current Situations and Review of Transmission System Development
(1) Development Plan for Transmission System
The outline of the plan for development of 500kV transmission lines proposed by IE is as
follows:
- The north-south transmission line is doubled and series capacitors is upgraded to 2,000
MW
- In the north areas (Son La, Viet Tri, Soc Son, eastern seaside areas) and the south areas
(Ho Chi Minh city areas, O Mon, Ca Mao, Nha Trang), 500kV transmission lines will be
constructed in a net-shaped structure
- The transmission lines will be extended to the power station areas in Laos and Cambodia
Figure 3-6 shows the 500kV transmission lines of Vietnam according to the plan of IE up to
2020.
(2) Review of Transmission System Development Plan
a. Problems of Installation of Series Capacitors
It was discovered that there is a possibility of a series resonance with series capacitors on the
500 kV transmission lines up to 2020 according to the study for the technical transfers. The zero
apparent reactance in the low frequency range causes the series resonance. Especially, if the series
resonance frequency matches the resonance frequency of shaft distortion such as of nuclear power
generators with long shafts, there are possibilities of causing shaft vibration and stopping
generators. Not installing series capacitors or applying the thyristor-controlled devices to eliminate
the resonance can be considered as the countermeasures against such phenomena.
b. Capacity of 500 kV Transmission Lines
The thermal capacity of the north– south 500 kV transmission systems up to 2020 is estimated
to be about 2,200 MW per one circuit. The capacity of the intervals with double circuits of the
north – south 500 kV transmission systems should be 2,200 MW by applying N-1 criteria.
Upper limits of power flows through 500 kV lines between the areas can be set as shown in
Table 3-1 according to the transmission system planning in year 2020.
Table 3-1 Upper Limits of Power Flows through 500 kV Lines (Transmission Planning in 2020)
North-Center Center – South South – Center Center – North 2,000 – 2,200 MW 1,400 – 2,000 MW 0 – 1,700 MW 1,100 – 1,900 MW

Master Plan Study on PSPP and Optimization for Peaking Power Generation, Summary Report
- 3-7 -
c. Criteria for Power Development and Transmission Planning of EVN
In general, loss of load probability and reserved capacity are set as the criteria for power
development planning. EVN sets those values as the following:
Loss of load expectation: 24 hours/year
Reserved margin: 20%
The criteria are not in a written form for network planning in Vietnam. In the future however,
the N-1 criteria will be applied for the main transmission system by doubling circuits or adding
500/220 kV transformers. The permissible fault current level is set to be 45 kA.

Master Plan Study on PSPP and Optimization for Peaking Power Generation, Summary Report
- 3-8 -
Source: IE
Figure 3-6 Transmission System in 2020
Hua Na
Cua Dat Than Hoa
Bim Son
Nghi Son
Hoa Lu Trinh Xuyen Ban Uon
HOA BINHHoa Lac
Son Tay
VIET TRISOC SON
Pha Lai
SON LA Yen Bai
NHO QUANNinh Binh
Quang Lang Son
Na Duong
Ban Lat
NAM THUEN 2
QUANG TRI
Hoa Khanh
Doc Soi
PLEI KU
Vung Ang HA TINH
Thach Khe
Ba Don
Dong Ha
Hue
DA NANG
A Vuong
DUNG QUAT
Tam Ky
Song Tranh
Quynh Luu
Vinh
Than Hoa
Tuan GiaoHuoi Quang
Xuan Mai
Phu Tho Bac Giang
Nam DinhThai Binh
Long Boi
Hai Duong
Trang Bach
QUANG NINH
Cam Pha
Dong Hoi
Thac BaThai Nguyen
THUONG
Th Kontum
Quang Ngai
YALY Kon Tum
Se San 3Se San 4A
Se San 4An Khe
Quy Nhon Vinh Son
Dak Drinh
Song Hinh
Ha Song Ba Tuy Hoa
Serepok Krong Buk
Buon Kuop
NHA TRANG
Cam RanhDa Nhim
Da Lat
Duc TrongThap Cham Dai Ninh
Bloc+Bac
Dien Nguyentu
Phan Thiet
DI LINH
Bao Loc
Ham Thuan
SONG MAY
PHU MYBa Ria Cao LanhCai Lay
Vinh Long
Tra Noc
Long XuenKien Luong
Rach GiaThot Not
Chau Doc
Ben Tre
My Tho NHABE
PHU LAMHOC MAN
TANDINH
SAM BOR
Thac Mo
Tri An
Tay Ninh
Vung TauLong An
Can Don
SP Mien
Dong Nai
Da Mi
Dak Min4
BAN PAAM
Luu Xa
Ha Nam
Hai PhongDo Son
Plei Krong
THU DUC
LAOS
CANBODIA
500 kV Thermal P/S
500 kV S/S 220 kV S/S
500 kV T/L
220 kV T/LExisting
500 kV Hydro P/S
Legend
Planning