Embed Size (px)
Citation preview
University of Michigan Post-Launch Assessment ReviewProject Wolverine:
Butterfly Valve Drag Variation for Mile High Apogee
2011-2012University Student Launch Initiative
Department of Aerospace Engineering
University of Michigan3012 Francois-Xavier Bagnoud Building
1320 Beal AvenueAnn Arbor, MI 48109-2140
Table of Contents
1. Summary......................................................................................................................................31.1 Team Name and Location......................................................................................................3
1.3.1 Vehicle Size....................................................................................................................31.3.2 Motor Choice..................................................................................................................3
1.4 Science Experiment...............................................................................................................31.5 Altitude Reached...................................................................................................................3
2. Vehicle.........................................................................................................................................42.1 Vehicle Summary..................................................................................................................42.2 Data Analysis and Results of Vehicle...................................................................................4
3. Experiment...................................................................................................................................83.1 Experiment Summary............................................................................................................83.2 Scientific Value.....................................................................................................................83.3 Data Analysis and Results.....................................................................................................83.4 Visual Data Observed..........................................................................................................10
4. Lessons Learned and Experience...............................................................................................115. Educational Engagement...........................................................................................................126. Budget........................................................................................................................................13
6.1 Budget Overview.................................................................................................................136.2 Project Budget Details.........................................................................................................14
1. Summary1.1 Team Name and LocationThe University of Michigan Rocket Engineering Association (MREA) from Ann Arbor, Michigan proposes Project Wolverine.
1.3.1 Vehicle SizeOuter diameter: 5.52”Inner diameter: 5.36”Total length: 114.00”Mass with Motor: 40 lbs
1.3.2 Motor ChoiceThe motor type for the vehicle is a Cesaroni L-1395 motor (75mm diameter) with 4,895 N-s of total impulse. This determination was made based on Rocksim simulations, hand calculations, and multiple test launches.
1.4 Science ExperimentThe projected experiment for MREA’s Project Wolverine is two butterfly valves (separated 180 degrees) that vary pressure drag. During the ascent, the butterfly valves will be actuated based on real time data from GPS and flight computers to vary the pressure drag on the rocket. The goal of this experiment is to put a high impulse motor in the rocket that ensures the rocket will reach at least one mile at apogee, yet have the rocket only reach one mile at apogee due to the increased drag from the butterfly valves.
1.5 Altitude Reached5549 ft
2. Vehicle
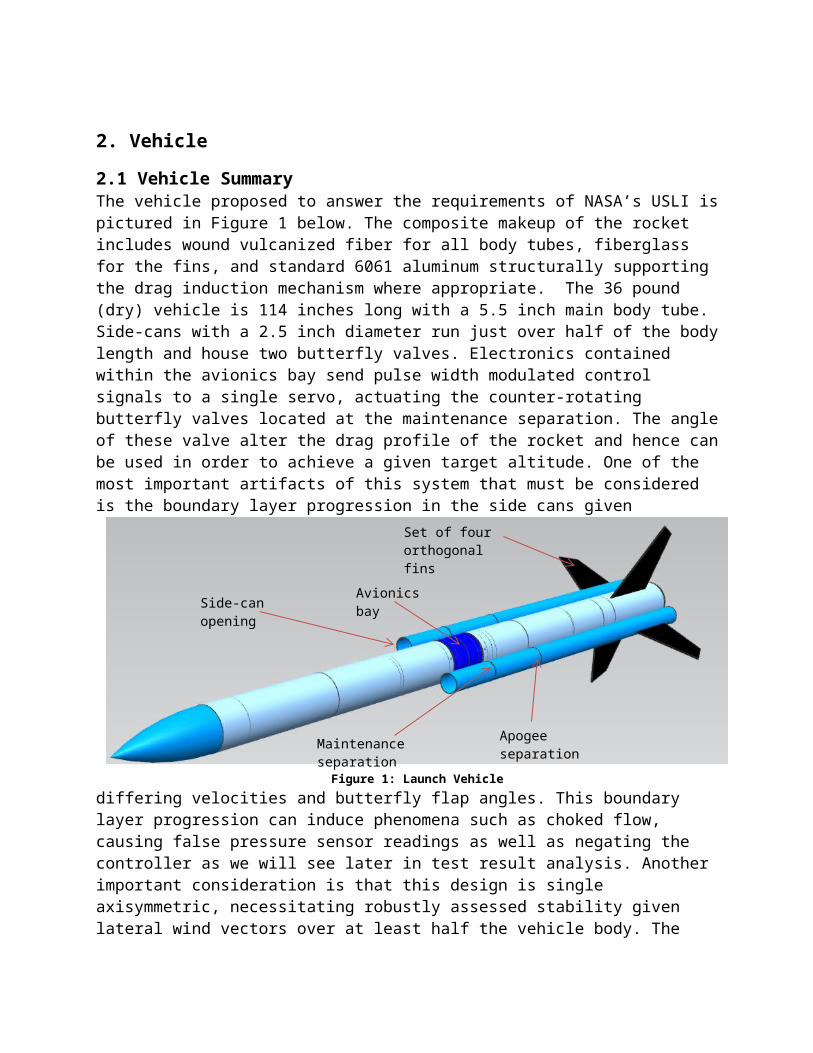
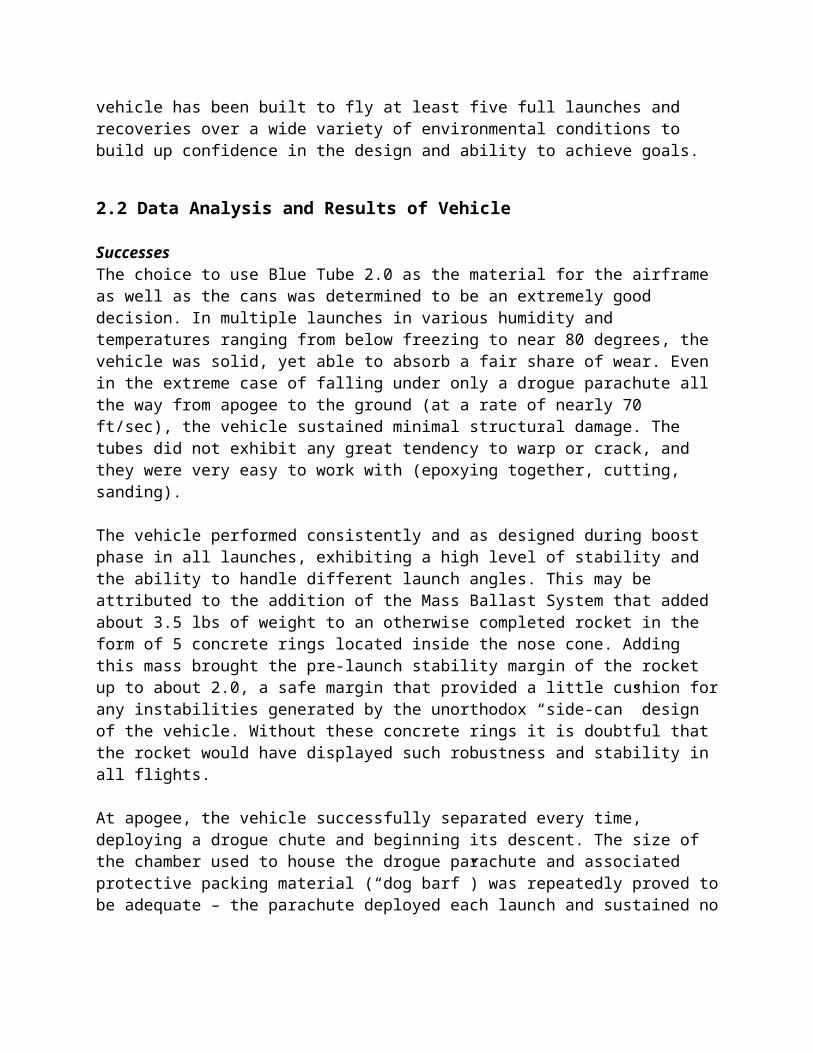
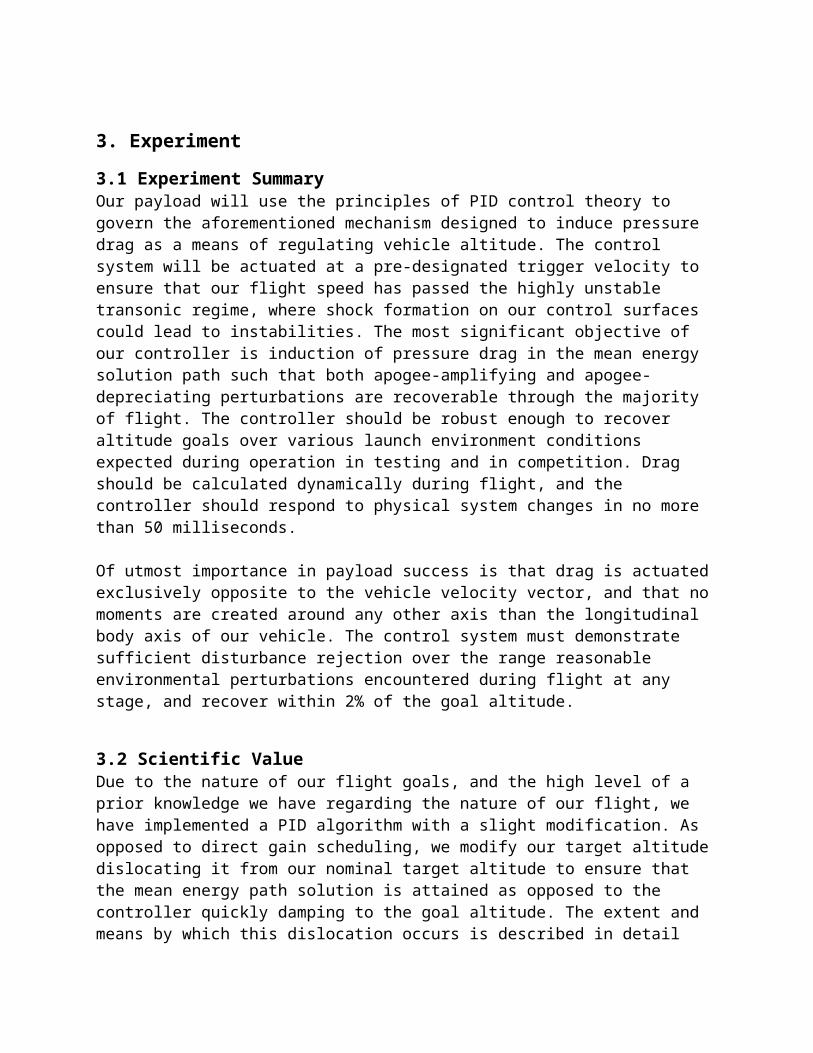
2.1 Vehicle SummaryThe vehicle proposed to answer the requirements of NASA’s USLI is pictured in Figure 1 below. The composite makeup of the rocket includes wound vulcanized fiber for all body tubes, fiberglass for the fins, and standard 6061 aluminum structurally supporting the drag induction mechanism where appropriate. The 36 pound (dry) vehicle is 114 inches long with a 5.5 inch main body tube. Side-cans with a 2.5 inch diameter run just over half of the body length and house two butterfly valves. Electronics contained within the avionics bay send pulse width modulated control signals to a single servo, actuating the counter-rotating butterfly valves located at the maintenance separation. The angle of these valve alter the drag profile of the rocket and hence can be used in order to achieve a given target altitude. One of the most important artifacts of this system that must be considered is the boundary layer progression in the side cans given differing velocities and butterfly flap angles. This boundary layer progression can induce phenomena such as choked flow, causing false pressure sensor readings as well as negating the controller as we will see later in test result analysis. Another important consideration is that this design is single axisymmetric, necessitating robustly assessed stability given lateral wind vectors over at least half the vehicle body. The vehicle has been built to fly at least five full launches and recoveries over a wide variety of environmental conditions to build up confidence in the design and ability to achieve goals.
2.2 Data Analysis and Results of Vehicle
SuccessesThe choice to use Blue Tube 2.0 as the material for the airframe as well as the cans was determined to be an extremely good decision. In multiple launches in various humidity and temperatures ranging from below freezing to near 80 degrees, the vehicle was solid, yet able to absorb a fair share of wear. Even in the extreme case of falling under only a drogue parachute all the way from apogee to the ground (at a rate of nearly 70 ft/sec), the vehicle sustained minimal
Set of four orthogonal fins
Apogee separationMaintenance separation
Avionics baySide-can opening
Figure 1: Launch Vehicle
structural damage. The tubes did not exhibit any great tendency to warp or crack, and they were very easy to work with (epoxying together, cutting, sanding).
The vehicle performed consistently and as designed during boost phase in all launches, exhibiting a high level of stability and the ability to handle different launch angles. This may be attributed to the addition of the Mass Ballast System that added about 3.5 lbs of weight to an otherwise completed rocket in the form of 5 concrete rings located inside the nose cone. Adding this mass brought the pre-launch stability margin of the rocket up to about 2.0, a safe margin that provided a little cushion for any instabilities generated by the unorthodox “side-can” design of the vehicle. Without these concrete rings it is doubtful that the rocket would have displayed such robustness and stability in all flights.
At apogee, the vehicle successfully separated every time, deploying a drogue chute and beginning its descent. The size of the chamber used to house the drogue parachute and associated protective packing material (“dog barf”) was repeatedly proved to be adequate – the parachute deployed each launch and sustained no major scorching or other damage as a result of the ejection charge explosion.
During descent, the rocket’s recovery system worked flawlessly for 3 out of 4 launches. During the second test launch, the main parachute failed to deploy, causing the rocket to fall from apogee to ground under only the drogue chute. Luckily, due to the drogue and some soft mud, the rocket sustained no major damage. Instead, the most important consequence of this failure was the creation of a new set of rules for folding and packing the parachute, as well as an increase in the length of shock cord in the rocket. Both of these fixes ensured the successful deployment of the main chute at both the third and fourth launches. Quantitatively, actual descent rates under both drogue and main chutes gathered from the final launch were very close to predicted:
Predicted (ft/sec) Actual (ft/sec)
36” Drogue 74 70
Cert-3 XL Main Chute 18 21
FailuresThere were two repeated failures that resulted from the design of the avionics bay (AvBay), concerning specifically the system that equalized the pressures inside and outside the avionics bay so that the altimeters could accurately measure pressure. The first failure that occurred more than once was a downward spike in the altitude curve at apogee, as visible in Figure 2. This anomaly was attributed to the improper sealing of the avionics bay from the aft ejection charge that separated the vehicle at apogee. Despite the addition of gaskets and another fiberglass plate inside the avionics bay after the second test launch, this problem persisted through our final launch in Alabama. Although it was never determined that this failure was actually detrimental to any of the electronics in the avionics bay or the vehicle in general, the inability to totally seal
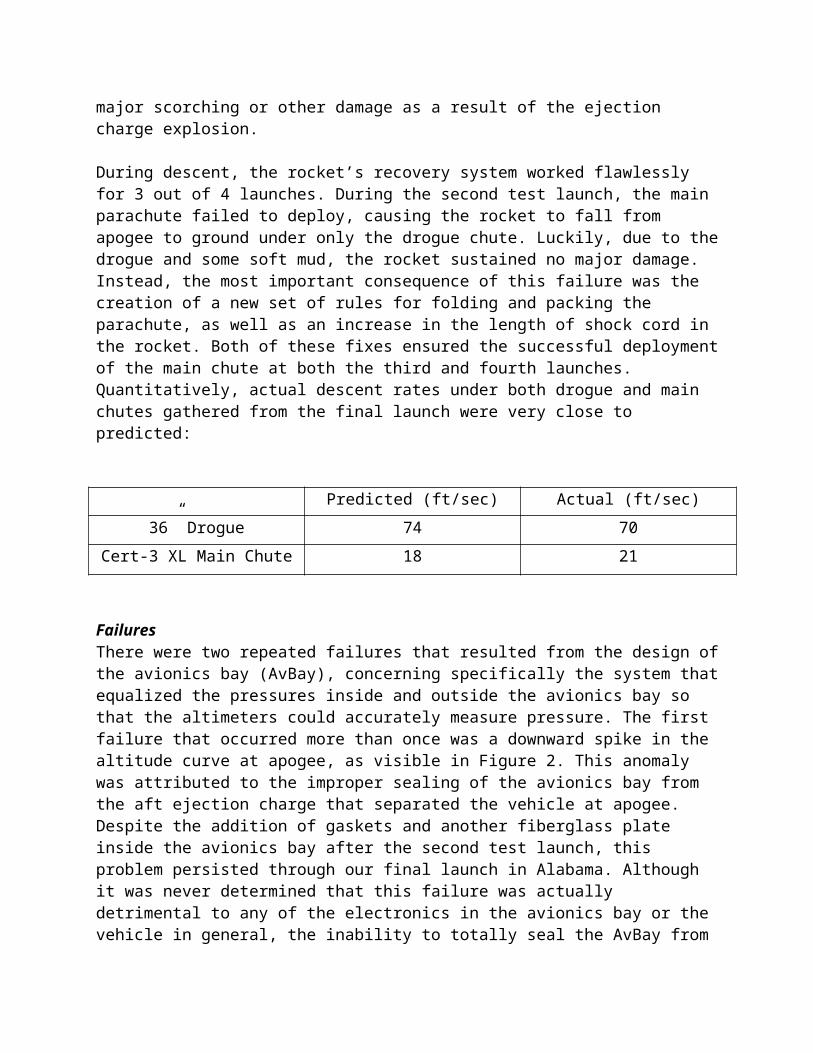
the AvBay from the ejection charges produced an incorrect altitude curve that repeatedly marred the flight data.
Figure 2: Huntsville, AL launch showing erroneous spike in pressure-based altitude curve (blue) at apogee
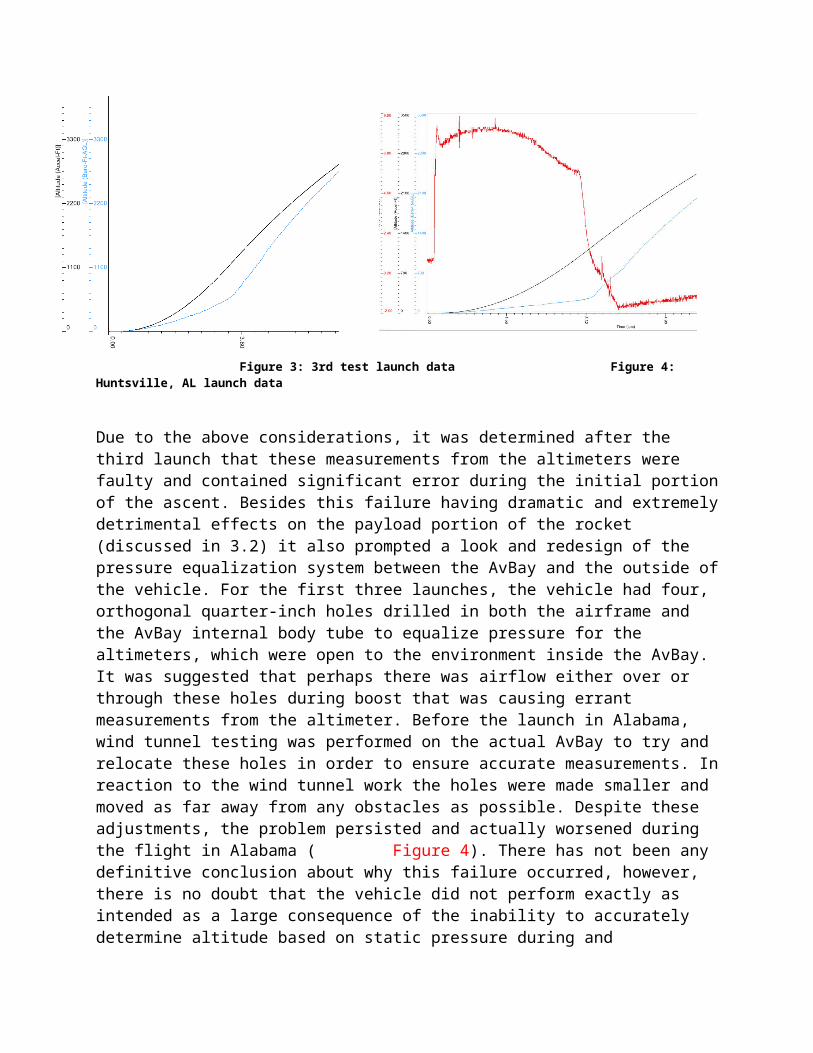
The second failure related to the AvBay was a repeated disparity in altitude measurements between the accelerometer in the Raven flight computer and both altimeters (one in the Raven, the other being the Stratologger). At motor burnout, only some 3-4 seconds into flight, there was at least a 200-meter difference between the two altitude measurements, with the pressure-based data from the altimeter indicating the lower altitude of the two – probably the more incorrect altitude. On a larger scale, the altitude curve derived from the altimeters looks very strange up to and at motor burnout, as there is a sudden increase in slope at burnout ( Figure 3 & Figure 4, blue line). This sudden increase in slope would normally indicate a positive acceleration, however the vehicle should not be positively accelerating at all after the engine has ceased to burn. On the other hand, the altitude data from the accelerometer looks much nicer and agrees with calculations for an approximate altitude at burnout ( Figure 3 & Figure 4, black line).
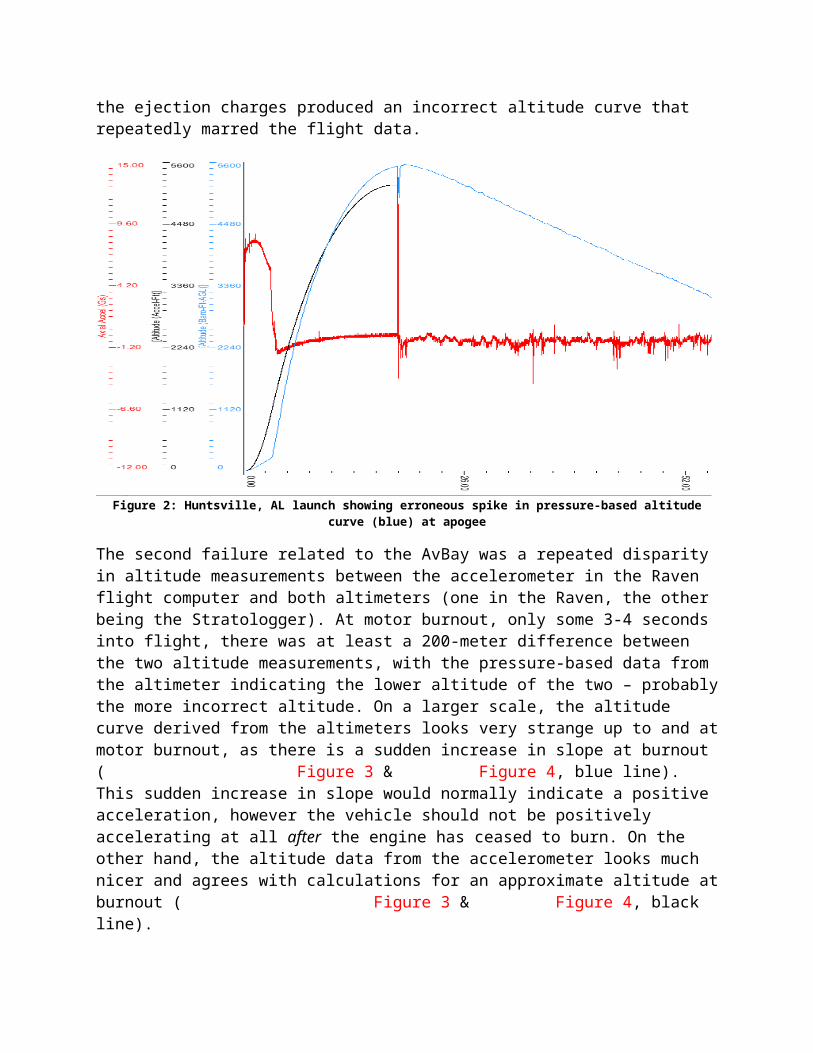
Figure 3: 3rd test launch data Figure 4: Huntsville, AL launch data
Due to the above considerations, it was determined after the third launch that these measurements from the altimeters were faulty and contained significant error during the initial portion of the ascent. Besides this failure having dramatic and extremely detrimental effects on the payload portion of the rocket (discussed in 3.2) it also prompted a look and redesign of the pressure equalization system between the AvBay and the outside of the vehicle. For the first three launches, the vehicle had four, orthogonal quarter-inch holes drilled in both the airframe and the AvBay internal body tube to equalize pressure for the altimeters, which were open to the environment inside the AvBay. It was suggested that perhaps there was airflow either over or through these holes during boost that was causing errant measurements from the altimeter. Before the launch in Alabama, wind tunnel testing was performed on the actual AvBay to try and relocate these holes in order to ensure accurate measurements. In reaction to the wind tunnel work the holes were made smaller and moved as far away from any obstacles as possible. Despite these adjustments, the problem persisted and actually worsened during the flight in Alabama ( Figure 4). There has not been any definitive conclusion about why this failure occurred, however, there is no doubt that the vehicle did not perform exactly as intended as a large consequence of the inability to accurately determine altitude based on static pressure during and immediately after boost – the most dynamic part of flight and most critical for adjusting drag.
3. Experiment
3.1 Experiment SummaryOur payload will use the principles of PID control theory to govern the aforementioned mechanism designed to induce pressure drag as a means of regulating vehicle altitude. The control system will be actuated at a pre-designated trigger velocity to ensure that our flight speed has passed the highly unstable transonic regime, where shock formation on our control surfaces could lead to instabilities. The most significant objective of our controller is induction of pressure drag in the mean energy solution path such that both apogee-amplifying and apogee-depreciating perturbations are recoverable through the majority of flight. The controller should be robust enough to recover altitude goals over various launch environment conditions expected during operation in testing and in competition. Drag should be calculated dynamically during flight, and the controller should respond to physical system changes in no more than 50 milliseconds.
Of utmost importance in payload success is that drag is actuated exclusively opposite to the vehicle velocity vector, and that no moments are created around any other axis than the longitudinal body axis of our vehicle. The control system must demonstrate sufficient disturbance rejection over the range reasonable environmental perturbations encountered during flight at any stage, and recover within 2% of the goal altitude.
3.2 Scientific ValueDue to the nature of our flight goals, and the high level of a prior knowledge we have regarding the nature of our flight, we have implemented a PID algorithm with a slight modification. As opposed to direct gain scheduling, we modify our target altitude dislocating it from our nominal target altitude to ensure that the mean energy path solution is attained as opposed to the controller quickly damping to the goal altitude. The extent and means by which this dislocation occurs is described in detail below, and is based off of several vehicle state variables. This design was selected due to the fact that the control system has no means to add energy back into the system, making energy management an extremely important aspect of the controller design. If the nominal flight path is attained within a few moments of the controller activating, there would be no means for the controller to reject any disturbance which would reduce the apogee altitude. The risk inherent with this classical PID design in failing the criterion of being able to recover within 2% of the goal altitude was determined to be too great to allow an unmodified PID algorithm to control the ascent of our rocket.

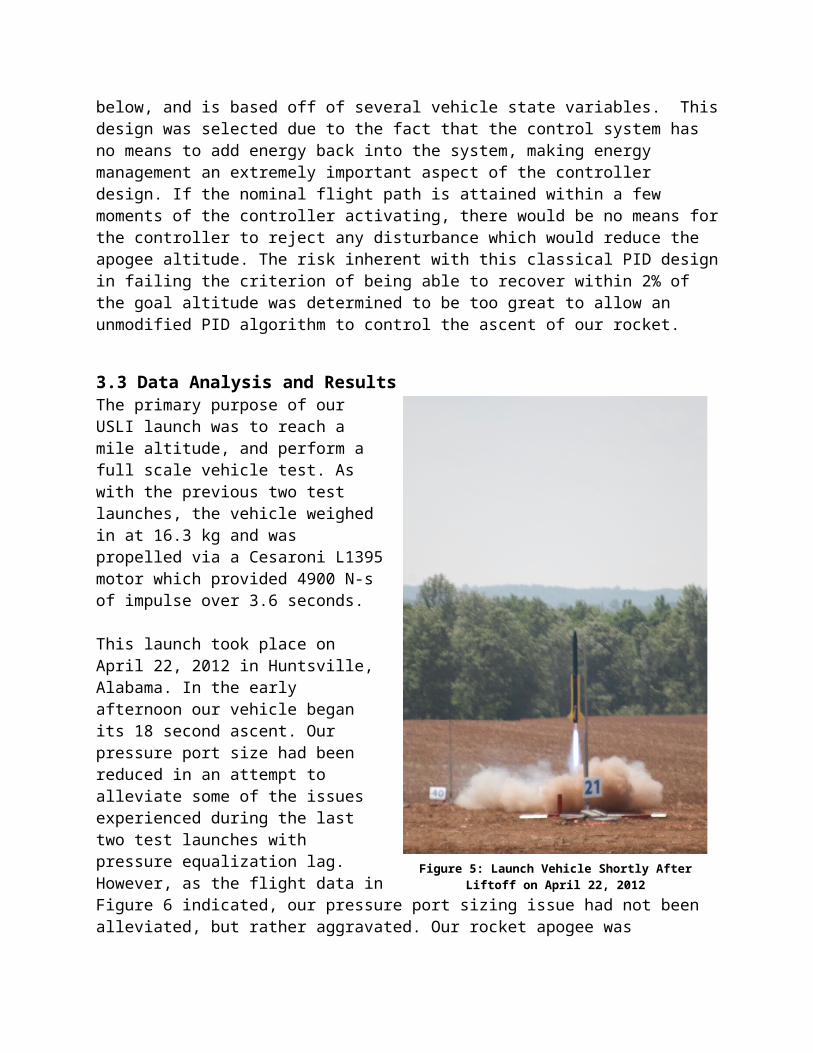
3.3 Data Analysis and ResultsThe primary purpose of our USLI launch was to reach a mile altitude, and perform a full scale vehicle test. As with the previous two test launches, the vehicle weighed in at 16.3 kg and was propelled via a Cesaroni L1395 motor which provided 4900 N-s of impulse over 3.6 seconds.
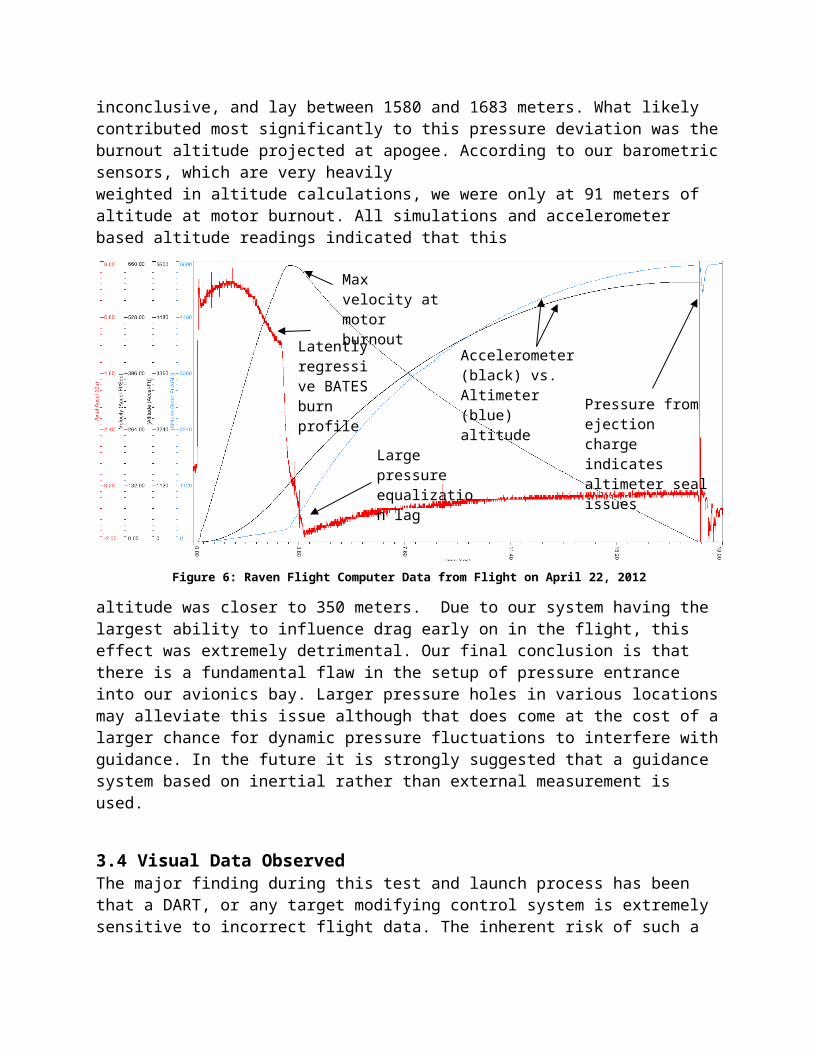
This launch took place on April 22, 2012 in Huntsville, Alabama. In the early afternoon our vehicle began its 18 second ascent. Our pressure port size had been reduced in an attempt to alleviate some of the issues experienced during the last two test launches with pressure equalization lag.However, as the flight data in Figure 6 indicated, our pressure port sizing issue had not been alleviated, but rather aggravated. Our rocket apogee was inconclusive, and lay between 1580 and 1683 meters. What likely contributed most significantly to this pressure deviation was the burnout altitude projected at apogee. According to our barometric sensors, which are very heavilyweighted in altitude calculations, we were only at 91 meters of altitude at motor burnout. All simulations and accelerometer based altitude readings indicated that this
Figure 5: Launch Vehicle Shortly After Liftoff on April 22, 2012
Figure 6: Raven Flight Computer Data from Flight on April 22, 2012
Pressure from ejection charge indicates altimeter seal issues
Max velocity at motor burnout
Accelerometer (black) vs. Altimeter (blue) altitude
Large pressure equalization lag
Latently regressive BATES burn profile
altitude was closer to 350 meters. Due to our system having the largest ability to influence drag early on in the flight, this effect was extremely detrimental. Our final conclusion is that there is a fundamental flaw in the setup of pressure entrance into our avionics bay. Larger pressure holes in various locations may alleviate this issue although that does come at the cost of a larger chance for dynamic pressure fluctuations to interfere with guidance. In the future it is strongly suggested that a guidance system based on inertial rather than external measurement is used.
3.4 Visual Data ObservedThe major finding during this test and launch process has been that a DART, or any target modifying control system is extremely sensitive to incorrect flight data. The inherent risk of such a system is present in twofold, one being that when the system is modifying the target the most heavily, data must very accurate. The second is that a system such as ours relies on a controller that becomes less effective as we approach our target. A perhaps more thorough revision of the controller would include an undershoot command, that rectifies itself via injection of energy into the flight system to increase apogee.
Speaking more directly to the control system itself, gain scheduling effects have been mimicked with general success via a modified target. Had the controller had the correct data during the entire flight, there is a good chance we would have seen altitudes that very nearly achieved our goals, as we can see by the effect of the controller in our final test flight with just a single point of what can be considered consistent data. However by comparing the flight results with what would have been achieved via a simple Zeiger-Nicholas tuned PID controller, we can see the DART controller did provide some substantial gains. Further work regarding a DART controller, or a controller that employs continuous gain scheduling, would involve looking at which state variables can most accurately be used to modify a given arbitrary target, and how those modifications can be based on vehicle characteristics in a general way. Overall this study has shown that there is promise that continuous gain scheduling, if built into the dynamics and via a priori knowledge of a vehicle, can attain better results that a simple PID controller.
4. Lessons Learned and ExperienceBefore the competition we attempted three separate test flights, but we were unable to collect data from our control system on any of these test flights. We feel like we could have benefitted from data collection to see if the control system was working correctly. This showed us how important test flights are in the testing of systems.
We attempted to control our altitude by using two butterfly valves that vary pressure drag. The valves would be actuated based on real time data from multiple onboard electronics shortly after motor burn out. However at competition it was determined that the butterfly valves did not actuate as expected. After doing some analysis we have determined that it was due to inaccurate number readings. At apogee the accelerometer we were using to read off of said 5185ft when in actuality our Raven altimeter read 5523ft and our competition altimeter read 5549ft. We believe the reason for the valves not performing as expected is due to some fundamental flaw in the pressure-hole system resulting in inaccurate readings from both altimeters. This has been an issue that we have been trying to resolve since our third full scale test launch. Our currently assumption is that having the avionics bay enclosed in another hollow cylinder has allowed pressure to leak into the avionics bay.
Even though the system did not work as desired the experience helped prepare us as future engineers. By having these issues we were able to go through the design-fabrication-test cycle multiple times, testing our problem solving skills. Each time we learned more about how the onboard systems work in relation to each other and the environment.
5. Educational EngagementThe Michigan Rocket Engineering Association’s first run of a new outreach project was a deemed a success in a few ways. Our members taught students at Pinckney Community High School the basics of rocketry in a three week seminar in which students built rockets in teams as a part of a TARC-like competition. These students in turn showed a true interest in the subject wanting to start a TARC team and have MREA members mentor the team. The school labeled the seminar a success and invited MREA back to teach again next year. The goals of the USLI educational outreach project were to inspire an interest in rocketry and engineering in general as well as to establish an ongoing project that could continue in years to come. MREA has completed these goals on a small scale and hopes to continue this project on a larger scale. Plans for a manuscript that describes in detail how to run this seminar are in the works and MREA hopes to distribute the information to other schools so that they may run their own seminar without having our members there in person. MREA hopes to continue this project in the fall with a new set of students, perfecting this seminar through trial and error.
6. Budget
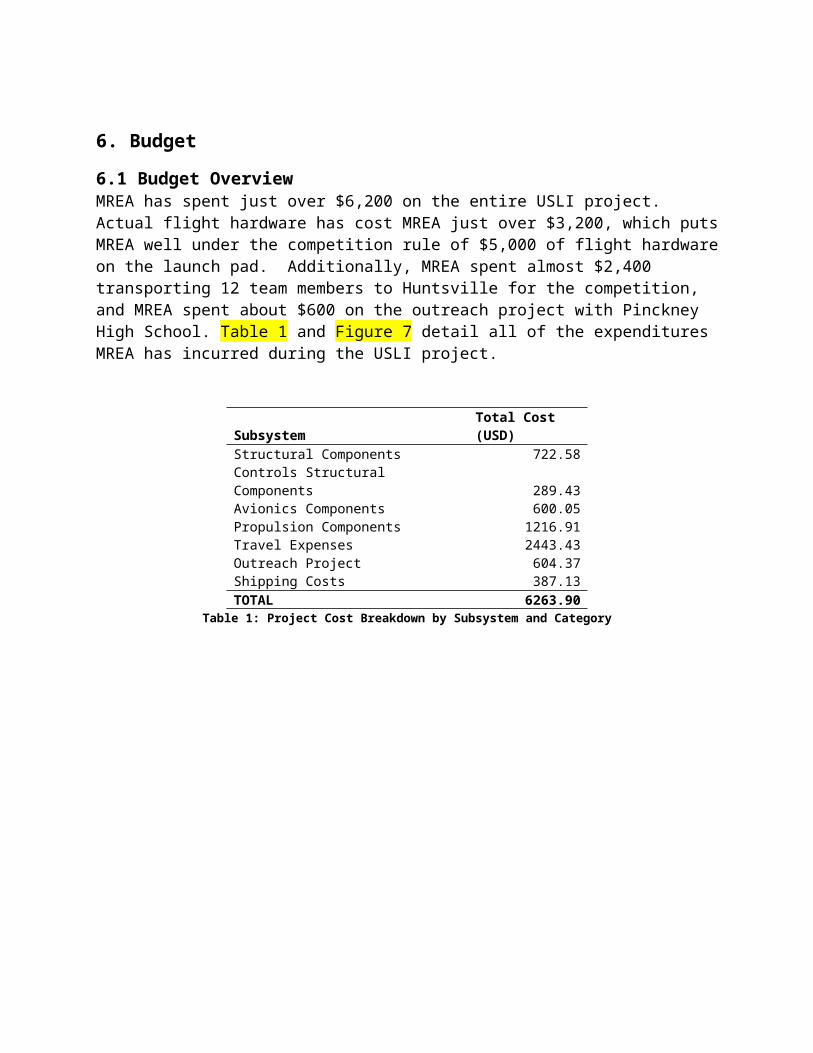
6.1 Budget OverviewMREA has spent just over $6,200 on the entire USLI project. Actual flight hardware has cost MREA just over $3,200, which puts MREA well under the competition rule of $5,000 of flight hardware on the launch pad. Additionally, MREA spent almost $2,400 transporting 12 team members to Huntsville for the competition, and MREA spent about $600 on the outreach project with Pinckney High School. Table 1 and Figure 7 detail all of the expenditures MREA has incurred during the USLI project.
Subsystem Total Cost (USD)Structural Components 722.58Controls Structural Components 289.43Avionics Components 600.05Propulsion Components 1216.91Travel Expenses 2443.43Outreach Project 604.37Shipping Costs 387.13TOTAL 6263.90
Table 1: Project Cost Breakdown by Subsystem and Category
Structural Components12% Controls
Structural Compo-
nents5%
Avionics Compo-
nents10%
Propulsion Com-ponents
19%Travel Expenses
39%
Outreach Project10%
Shipping Costs6%
Figure 7: Visual Representation of Project Costs
In order to fund the project, MREA received numerous grants and contributions from organizations around the University of Michigan. These organizations included the Aerospace Engineering Department at the University, student councils, and Raytheon Missile Systems who provided a $1,000 grant in support of MREA’s USLI efforts. Finally, MREA also had its twelve travelling team members contribute to defray the travel costs. Overall, MREA had ample funding to support the USLI.
Income Source Category AmountStarting Balance Starting Balance 1956.67UM Aerospace Engineering Dept. Grant Grants 2500.00Raytheon Company Grant Grants 1000.00UM Central Student Government Grant Grants 700.00University of Michigan Engineering Council Grant Grants 1000.00Team Travel Contributions Refund 500.00
TOTAL 7851.67Table 2: Project Income Sources
6.2 Project Budget DetailsIncluded in the following tables are details on the individual components that were purchased for the Structural, Controls Structural, Avionics, and Propulsion subsystems. Additionally, outreach project expenses and travel expenses are listed.
Structural Components Supplier Unit Cost (USD) Quantity Total Cost (USD)Upper Body Tube Apogee Rocketry 56.95 1 56.95Outer Fuselage/Side Cans Apogee Rocketry 26.95 5 134.75Can Coupler Apogee Rocketry 9.25 4 37.00Upper/Lower Body Tubes Apogee Rocketry 56.95 2 113.90Misc. Lab Supplies Ace Hardware 93.05 N/A 93.05Blue Tube Coupler 2.56" Apogee Rocketry 9.25 2 18.50Blue Tube Coupler 5.5" Apogee Rocketry 18.95 1 18.95Main Parachute LOC Precision 189.00 1 189.00Plywood Home Depot $34.97 N/A 34.97Home Depot Supplies Home Depot 25.51 N/A 25.51RadioShack Supplies Circuit City 31.17 N/A 31.17
TOTAL 722.58Table 3: Structural Subsystem Component Costs
Controls Structural Components Supplier Unit Cost (USD) Quantity Total Cost (USD)Flat Washer McMaster-Carr 3.37 1 3.37Lock Washer McMaster-Carr 4.03 1 4.03Screw McMaster-Carr 9.80 1 9.80Rods McMaster-Carr 6.21 1 6.21Hex Locknuts McMaster-Carr 5.01 1 5.01Hex Nuts McMaster-Carr 4.49 1 4.49Drag Flap Thrust Plate (Ring) McMaster-Carr 51.30 1 51.30Avionics Bay Apogee Rocketry 38.95 1 38.95HS-5645MG Digital Torque ServoCity 46.99 1 46.99Voltage Regulator Resistor Mouser Electronics 0.19 12 2.28Diode Mouser Electronics 0.34 6 2.04Gears McMaster Carr 36.48 3 109.44Eyebolts McMaster-Carr 2.76 2 5.52
TOTAL 289.43Table 4: Controls Structural Subsystem Component Cost
Avionics Components Supplier Unit Cost (USD) Quantity Total Cost (USD)Drag Flap Thrust Plate (Ring) McMaster-Carr 51.30 1 51.30732 Ohm Resistor Mouser Elec. 0.06 12 0.72240 Ohm Resistor Mouser Elec. 0.13 12 1.56300 Ohm Resistor Mouser Elec. 0.13 12 1.56Capacitor Mouser Elec. 0.31 12 3.72Capacitor Mouser Elec. 0.98 12 11.76Arduino Female Terminal Connectors Mouser Elec. 2.06 4 8.24Accelerometer Voltage Regulator Mouser Elec. 0.60 6 3.60Arduino Voltage Regulator Mouser Elec. 1.70 6 10.20Connectors Mouser Elec. 1.05 6 6.30Accelerometer Sparkfun Elec. 28.95 1 28.95LED Indicator Mouser Elec. 1.39 2 2.78LED Indicator Mouser Elec. 0.59 2 1.18LED Mount Mouser Elec. 0.26 4 1.04Fixed Terminal block Mouser Elec. 0.41 4 1.64Public Missile Fin-D-07 Public Missiles 19.15 4 76.60Key Switches McMaster-Carr 12.95 2 25.90E-Charge Canisters Apogee Rocketry 10.00 5 50.00E-Charge Canisters Apogee Rocketry 9.99 5 49.95Perfect Flight Altimeter Perfect Flight 67.96 1 67.96Voltage Regulator Resistor Mouser Electronics 0.19 12 2.28Diode Mouser Electronics 0.34 6 2.04Micro-SD Card Breakout Board Adrafruit Industries 15.00 1 15.00Steel Bore Miter Gear McMaster-Carr 18.58 3 55.743"x6"x3" Aluminum Block McMaster-Carr 44.12 1 44.12Servo Hub Servo City 9.99 1 9.99Coupler Hub Servo City 7.99 1 7.99Screws Servo City 0.35 4 1.40Key Switches McMaster-Carr 6.65 4 26.58Drag Computer Mouser Elec. 29.95 1 29.95
TOTAL 600.05Table 5: Avionics Subsystem Component Costs
Propulsion Components Supplier Unit Cost (USD) Quantity Total Cost (USD)Motor Mount Tube Public Missiles 16.50 1 16.50Motor Mount Centering Rings LOC Precision 7.00 4 28.00Motor Retention Apogee Rocketry 52.00 1 52.00Motor Thrust Plate McMaster-Carr 12.47 1 12.475 Grain Motor Retention Giant Leap Rocketry 203.45 1 203.45Pro 75 Case Spacer Giant Leap Rocketry 24.95 1 24.95Flight Test Motor #1 Loki 160.00 1 160.00Flight Test Motor #2 Cesaroni 239.54 1 239.54Flight Test Motor #3 Cesaroni 240.00 1 240.00USLI Launch Motor Cesaroni 240.00 1 240.00
TOTAL 1216.91Table 6: Propulsion Subsystem Component Costs
Outreach Project Components Supplier Unit Cost (USD) Quantity Total Cost (USD)Nose Cone LOC Precision 14.65 5 73.25Payload Body LOC Precision 6.25 5 31.25Tube Coupler LOC Precision 2.85 5 14.25Main Body LOC Precision 6.25 5 31.25Parachute 36" LOC Precision 20.95 5 104.75Motor Mount LOC Precision 4.75 5 23.75Centering ring(2) LOC Precision 5.80 5 29.00Bulkhead assembly LOC Precision 2.85 5 14.25Rail Buttons LOC Precision 5.25 5 26.25Shock Chord LOC Precision 6.25 3 18.75G-10 Fiberglass Giant Leap Rocketry 17.99 5 89.95F-Class Motors Apogee 42.97 3 128.91Rocket Fair Display Home Depot 18.76 1 18.76
TOTAL 604.37Table 7: Outreach Project Costs
Travel Expense Unit Cost (USD) Quantity Total Cost (USD)Car Rental 300.00 2 vehicles 600.00Gas 0.24 2000 miles 482.35Hotel 272.22 5 nights 1361.08
TOTAL 2443.43Table 8: Travel Costs