Embed Size (px)
Citation preview

1
Supplementary Discussion 1
2
3
The health benefits of folate biofortified rice in China 4
5
Hans De Steur1*
, Xavier Gellynck1, Sergei Storozhenko
2, Ge Liqun
3, Willy Lambert
4, Dominique 6
Van Der Straeten2, Jacques Viaene
1 7
8
1 Department of Agricultural Economics, Faculty of Bioscience Engineering, Ghent University, 9
Coupure Links 653, B-9000 Gent, Belgium 10
2 Unit Plant Hormone Signalling and Bio-imaging, Department of Physiology, Ghent University, 11
K.L. Ledeganckstraat 35, B-9000 Gent, Belgium 12
3 Rural Economy Research Institute, Liaoning Academy of Agricultural Sciences, Dongling Road, 13
84, Dongling District, 110161 Shenyang, Liaoning, P.R. China 14
4 Laboratory of Toxicology, Department of Bioanalysis, Ghent University, Harelbekestraat 72, B-15
9000 Gent, Belgium 16
e-mail: [email protected] 17
18
Abstract: 19 20 Although genetic modification is still a subject of discussion, both in political and research forums, the widespread 21 adoption of biofortified food crops in China is likely to happen. In the scope of biofortification for improving human 22 nutrition, folate biofortified rice was recently developed as a remedy against folate deficiency and its adverse health 23 outcomes, among which neural-tube defects (NTDs). The objective of this paper is to analyze the potential health 24 benefits of folate enriched rice in China, a rice consuming country characterized by large folate deficiencies. The 25 Disability-Adjusted Life Years (DALY) method is used to calculate the impact of biofortification as the number of 26 DALYs saved due to the reduced number of NTDs. A low and high impact scenario are simulated according to the 27 coverage rate of folate enriched rice consumption. Our findings support folate biofortification of rice as a valuable 28 alternative to increase folate intake and reduce folate deficiency in China. Implementing rice with a folate content of 29 1,200 µg per 100 g rice in China would increase the total daily folate intake for Chinese women of childbearing age to 30 1,120 µg, which is almost three times the recommended folate intake. As a consequence, around 116,090 DALYs in the 31 low impact scenario and 257,345 DALYs in the high impact scenario would be saved by implementing biofortified rice. 32 Although rice consumption is lower in northern areas, these regions account for the biggest health impact of 33 biofortification in China. As expected, regions with high NTD prevalence rates, such as Shanxi Province, will benefit 34 most from folate biofortification of rice. Further research is needed to assess the cost-effectiveness of this intervention 35 and to compare different interventions to increase folate intake, such as a campaign to promote folic acid pills intake. 36 Especially in poor, rural regions where other folate interventions are often unsuccessful, folate enriched rice could be an 37 effective, complementary approach to combat folate deficiency. 38 39
Key words: Folate biofortified rice; folate deficiency, neural-tube defects; health impact; DALYs; 40
China. 41
42
Acknowledgments: With respect to rice consumption data, we acknowledge the assistance 43
provided by Mr. F Gale of the USDA Economic Research Service, Washington, DC. This 44
investigation received financial support from Ghent University, through the Special Research Fund 45
(BOF GOA 1251204). 46
47
48
Nature Biotechnology, vol. 28, no. 6 DeSteur, H. et al.

2
Author Contributions: H.D.S., X.G. and J.V. were responsible for this study and were involved in 49
all aspects: designing, literature study, data collection, results and analysis, and writing and editing 50
the paper. D.V.D.S., S.S. and W.L. contributed to the literature study and concept of this study, 51
were responsible for the data with respect to the development of folate biofortified rice and 52
reviewed the paper in this respect. G.L. gathered NTD related data in China. All authors reviewed 53
the manuscript and approved the final manuscript. 54
55
Abbreviations 56 57 CBA, woman of childbearing age 58
CDPF, Chinese Disabled Person Federation 59
CNGOIC, China National Grain and Oils Information Center 60
DALY, Disability-Adjusted Life Year 61
GAIN, Global Alliance for Improved Nutrition 62
IDA, iron deficiency anemia 63
GM, Genetic modification 64
MOA, Chinese Ministry of Agriculture 65
MOH, Chinese Ministry of Health 66
MTHF(R), 5-methyl-tetrahydrofolate (reductase) 67
NTD, neural-tube defect 68
PNDC, Chinese Public Nutrition and Development Center 69
RDI, the recommended daily intake 70
SGA, State Grain Authority 71
VAD, Vitamin A deficiency 72
WHO, World Health Organization 73
WTO, World Trade Organization 74
YLL, years of life lost 75
YLD, years lived in disability 76
Nature Biotechnology, vol. 28, no. 6 DeSteur, H. et al.

3
Table of contents 77
78
1. Introduction ................................................................................................................................... 4 79
2. Folate deficiency ........................................................................................................................... 6 80
2.1. Folate deficiency in the world ................................................................................................... 6 81
2.2. Folate deficiency in China ........................................................................................................ 7 82
2.3. Folate deficiency compared with other micronutritional deficiencies in China ...................... 8 83
3. Neural-tube defects ....................................................................................................................... 9 84
3.1. Neural-tube defects in the world ............................................................................................. 10 85
3.2. Neural-tube defects in China .................................................................................................. 10 86
3.3. Neural-tube defects caused by folate deficiency in China ...................................................... 13 87
4. Current burden of folate deficiency in China ............................................................................. 15 88
4.1. The DALY formula .................................................................................................................. 15 89
4.2. Input parameters of the DALY formula................................................................................... 15 90
4.3. The current burden of folate deficiency in China (DALYs lost) ............................................. 15 91
5. Policy interventions to tackle folate deficiency .......................................................................... 18 92
5.1. Folic acid based interventions ................................................................................................ 18 93
5.1.1. Folic acid supplementation .................................................................................................. 18 94
5.1.2. Folic acid fortification ......................................................................................................... 19 95
5.2. Folate based interventions ...................................................................................................... 20 96
5.2.1. Dietary diversification ......................................................................................................... 20 97
5.2.2. Folate biofortification .......................................................................................................... 21 98
6. The health impact of folate biofortified rice in China ................................................................ 23 99
6.1. Total folate intake after folate biofortification of rice in China ............................................. 23 100
6.2. Assumptions to measure the health impact of folate biofortified rice in China ...................... 26 101
6.3. The health impact of folate biofortification of rice in China (DALYs saved) ......................... 26 102
6.4. Comparison of health impact studies with respect to biofortified staple crops ...................... 31 103
7. Conclusions................................................................................................................................. 32 104
References .......................................................................................................................................... 34 105
List of Tables ..................................................................................................................................... 39 106
List of Figures .................................................................................................................................... 39 107
Annex 1 Geographical presentation of the main characteristics of the study location related to the 108
DALY framework .............................................................................................................................. 40 109
110
111
Nature Biotechnology, vol. 28, no. 6 DeSteur, H. et al.

4
1. Introduction 112
113
Micronutrient malnutrition is a major health problem, affecting more than half of the world 114
population, especially in developing countries. Biofortification, enhancing the micronutrient content 115
of staple food crops, is considered as an excellent alternative to other micronutrient interventions, 116
such as supplementation, industrial fortification and diet diversification. In 2007, Storozhenko et al1 117
developed rice with a high folate content as an alternative means to tackle folate deficiency. Folate 118
deficiency, characterized by a below normal folate intake (< 400 µg per day), is an important type 119
of micronutrient deficiency that is associated with an increased risk of diseases, such as neural-tube 120
defects (NTD), which is the most common congenital malformation in the world2. The relationship 121
between folate deficiency and its main adverse health outcome, NTDs, is well established in 122
scientific literature3-5
. Periconceptional folate intake reduces the risk of delivering a baby with an 123
NTD. 124
Although not yet available on the market, previous research on folate biofortified rice 125
explored consumers‟ acceptance and purchase intention in Shanxi Province6. The selection of this 126
poor region in Northern China was based on its relation with NTDs and folate deficiency. Shanxi 127
has one of the highest reported prevalence rates of NTDs in the world, with more than 60 NTDs per 128
10,000 births7-9
. Furthermore, strongly related to this high NTD risk, this region is characterized by 129
a low intake of folic acid pills10-12
and dietary folate13
. Expanding this study location to China as a 130
whole would improve the evaluation of folate biofortified rice for two reasons. First of all, China is 131
not only the world leader in the production and consumption of this staple crop, it is also considered 132
as one of the pioneers of R&D and commercialization of genetically modified (GM) foods and, in 133
particular, rice14, 15
. Recently, China‟s Ministry of Agriculture (MOA) granted two bio-safety 134
certificates and approved biotech Bt rice and phytase maize16
. The permission to cultivate these 135
important transgenic crops will lead to its large-scale production in about two to three years. 136
Second, China as a rice consuming country is characterized by large folate deficiencies and high 137
NTD prevalence rates17
, which makes rice an appropriate food vehicle for folate biofortification. 138
Although there are significant differences in rice consumption and folate status between the 139
northern and southern regions, a regional comparison of the health impact would further underpin 140
the ex-ante evaluation of the health impact of folate biofortification in China. 141
Biofortification of the world‟s major staple crop is expected to have a large impact on folate 142
related health problems. This paper is the first attempt to quantify the potential health benefits of a 143
folate biofortified crop. Based on the Disability-Adjusted Life Year (DALY) framework18
, the 144
health impact is measured in terms of “healthy” life years saved due to biofortification. Although 145
the DALY framework has been criticized in the past19, 20
, it is increasingly used as a method in 146
health impact studies of biofortified staple crops21-24
. Previous impact studies evaluated the health 147
effect of biofortified crops, such as Golden Rice25, 26
or other provitamin A enriched crops such as 148
cassava roots27
or sweet potatoes24
, or iron fortified beans28
, on main micronutrient deficiencies (i.e. 149
iron, zinc or vitamin A) in developing countries like Bangladesh, Philippines, Nigeria or India. This 150
study focuses on the introduction of folate biofortified rice in China, which is a relatively new area 151
to evaluate biofortified staple crops24, 29
, and investigates the differences in the health impact 152
between northern and southern regions. 153
154
Figure 1 gives a brief overview of the application of the DALY framework to determine the 155
health impact of the potential introduction of folate biofortified rice in China. The main concepts in 156
this figure are elaborated in the next sections. 157
158
159
160
161
162
163
Nature Biotechnology, vol. 28, no. 6 DeSteur, H. et al.

5
164
165
166
167
168
169
170
171
172
173
174
175
176 Figure 1 Application of the DALY approach to measure the health benefits of folate biofortified rice in disability-177 adjusted life years 178
179
Section 2 and 3 focus on folate deficiency and NTDs, respectively. Besides a general 180
description, these sections present the status of folate deficiency and NTDs in the world and, in 181
particular, in China. In section 4, the current burden of folate deficiency in China is estimated by 182
means of the DALY formula. With respect to the theoretical background of this applied method, 183
reference is made to the “Fourth HarvestPlus Technical Monograph”23
. The fifth section gives an 184
overview of the policy interventions to tackle folate deficiency, with specific attention to the 185
Chinese (policy) context. The sixth section assesses the potential reduction of the current burden of 186
folate deficiency due to the implementation of folate enriched rice, i.e. the health impact. Finally, 187
some conclusions are drawn and recommendations for future research are presented. 188
189
190
health
impact
Neural-Tube Defects
Folate Deficiency
DALYs lost
DALYs saved
Current burden
Reduction of burden
Folate
biofortification
of rice
Nature Biotechnology, vol. 28, no. 6 DeSteur, H. et al.

6
2. Folate deficiency 191
192
193
Nutritional deficiency of folate or folate deficiency is characterized by an inadequate intake 194
of folate, i.e. below 400 µg per person, per day. This is the daily recommended dose, as advised by 195
the World Health Organization (WHO)30
and the US Public Health Service31
. Suboptimal folate 196
intake may result in the onset of diseases and disorders, such as neural-tube defects (NTD), 197
megaloblastic anemia and aggravation of iron deficiency anemia32, 33
. In addition, albeit that a 198
causal link still needs to be proven, folate deficiency has been correlated with certain types of 199
cancer, such as leukemia, colorectal, breast, cervical, pancreatic and bronchial cancer, Alzheimer‟s, 200
coronary and cardiovascular diseases2. These disorders can be broadly divided into three groups of 201
causes, homocysteinemia, hypomethylation and an errant DNA biosynthesis33
, and can be prevented 202
by an adequate folate intake5, 34
. 203
Folate is water-soluble vitamin, found in a wide variety of foods. The most important dietary 204
folate sources are green and/or leafy vegetables (e.g. beans, peas and spinach), eggs, liver and 205
certain fruits (e.g. citrus fruits and oranges)35
. Potential side effects of (high) folate intake include 206
cognitive impairment (only in combination with Vitamin B12 deficiency), facilitated progression and 207
growth of preneoplastic lesions and subclinical cancers and impaired immune function of 208
postmenopausal women36
. On the contrary, folic acid is a synthetic form of folate, which does not 209
occur naturally, but is commercially produced into pills (supplementation) or added to foods 210
(fortification). However, humans may be much poorer at handling folic acid than what had been 211
previously thought and there is now more concern that circulating unmetabolised folic acid may 212
have some downsides37
. Compared to folate, very high intakes of folic acid (>1,000 µg/day) can 213
mask Vitamin B12 deficiency38
. Besides masking micronutrient deficiencies, a high folate acid 214
intake level may also lead to other adverse health effects, such as a cognitive decline in the elderly 215
and a higher risk for colorectal cancer (for a review on potential side effects of folate, folic acid and 216
other micronutrients, see Rogovik et al39
). These potential negative health outcomes of raising the 217
folic acid status partly explain the political reluctance to proceed to mandatory folic acid 218
fortification in Europe40, 41
(see section 5.1.2). 219
220
2.1. Folate deficiency in the world 221
222
As the most important staple foods, such as potatoes and cereals, are poor sources of 223
folate35
, folate deficiency is a global problem for public health. Figure 2 and figure 3 summarize the 224
scientific evidence of the magnitude of folate deficiencies, based on the plasma folate 225
concentrations and the folate deficiency rate, respectively. These findings are based on a worldwide 226
review on adult folate deficiency42
, which compared the results of the most representative survey of 227
each reviewed country. The threshold of folate deficiency is defined by a plasma folate status below 228
10 Nmol/L43
, as suggested at the WHO Technical Consultation on folate and vitamin B12 229
deficiencies in 200544
. 230
In line with other micronutrient deficiencies, folate deficiency is more prevalent in less 231
developed, non-western countries. Most of the Western countries are well above this threshold, 232
especially after the implementation of folic acid fortification programs (see section 5). However, a 233
high average folate status does not imply that folate deficiency is absent, as figure 3 shows. 234
With respect to China, a regional comparison is made. If only the figures of China as a 235
whole would be presented, the differences between Northern and Southern China would be masked. 236
The average plasma folate concentration of Northern China is below the threshold of folate 237
deficiency, by which the number of folate deficient adults is significantly higher than in Southern 238
China (see section 2.2). 239
240
Nature Biotechnology, vol. 28, no. 6 DeSteur, H. et al.

7
241 Figure 2 Folate deficiency in the world. Average plasma folate concentrations (in Nmol/L), per country 242 Source: Mclean et al
42, and Hao et al
45 for China 243
Remarks: Prefortification values are presented in countries with mandatory fortification programs (Canada, Chile, Costa Rica, and the United States). 244 The threshold of folate deficiency is defined by a plasma folate concentration below 10 Nmol/L43, 44. 245 246
247
248 Figure 3 Folate deficiency in the world. Percentage of adults with folate deficiency, per country 249 Source: Mclean et al
42, and Hao et al
45 for China 250
Remarks: In countries with mandatory fortification programs, such as Costa Rica and the United States, prefortification values are presented. 251 252
2.2. Folate deficiency in China 253
254
Given the low folate content of China‟s main staple crop, rice, folate deficiency in China is 255
expected to be high. However, scientific evidence on the number of folate deficient people in China 256
is limited. Only two study reported the folate deficiency rate in Chinese regions spread across the 257
country17, 45
. Other folate status and intake assessment studies in China focused on specific regions, 258
characterized by a low (Shanghai46
, Jiangsu12, 47
and Anqing48
) or high (Shanxi12, 13, 47, 49
and 259
Beijng50
) NTD prevalence rate. The target group in most of these studies was limited to Chinese 260
women of childbearing age (CBA), premarital women or pregnant women, due to their potential 261
risk of having a baby with an NTD caused by folate deficiency. 262
The results of two Chinese studies, i.e. a study on folate deficiency of men and women 263
versus the most recent study on folate status of women of childbearing age, are summarized in 264
Table 1. The regional distribution of the number of folate deficient people, regardless of gender, 265
indicates a significant difference between Northern and Southern China. In total, about 19.6 % or 266
258.8 million people in China are considered to be folate deficient, of which 81.7 % is living in 267
Nature Biotechnology, vol. 28, no. 6 DeSteur, H. et al.

8
Northern China. The higher number of folate deficient people in Northern China is partly 268
attributable to the lower availability and the limited variety of fresh vegetables, and the lower 269
consumption of folate-rich food products45
. The dietary folate intake of people from Northern China 270
mainly depends on their consumption of grains, while folate-rich food products, such as (green) 271
vegetables, are the main folate sources in Southern China17
. With respect to Han populations, the 272
most common ethnicity in China, regional differences could be also due to the higher frequency of 273
mutation in the MTHFR (5-methyl-tetrahydrofolate reductase) gene of Han people from Northern 274
China12
. 275
Furthermore, Chinese men tend to be more folate deficient than women. Folate deficiency 276
rates of males are approximately 2 to 5 times higher in Northern and Southern China, respectively. 277
As the total folate deficiency rates are derived from two Chinese studies, the estimation of 278
the number of folate deficient people in China should be interpreted carefully. Nevertheless, the 279
findings show that folate deficiency in Northern China is a major health problem. 280
281 Table 1 Folate deficiency in China. Percentage of folate deficient men and women (of childbearing age), and the 282 estimated population affected by folate deficiency in China, per region 283 284 Region Folate deficiency rate (%)
Population
c
(million) Men
a Womena CBA
b Totala Total
NORTH 51.5 24.1 20.0 38.0 211.4
Northeast / / 22.8 / /
Northwest / / 14.5 / /
SOUTH 11.0 1.9 1.5 6.2 47.4
Southeast / / 1.0 / /
Southwest / / 2.0 / /
CHINAd 28.1 13.3 9.3 19.6 258.8
285 CBA, women of childbearing age 286 a
Own calculations, based on Hao et al45 287 b
Based on Zhao et al17 288 c
Own calculations, based on the total folate deficiency rate (column 5) and the total population size (see Table 3) 289 d
Own calculations, means are weighted by population size (see Table 3) 290 291
Folate deficiency is of particular importance in one of the northern provinces in China, 292
namely Shanxi Province. Together with the Balrampur District in India51
, this poor coal mining 293
region has one of the highest NTD prevalence rates in the world (between 60 and 150 NTDs per 294
10,000 births8, 9, 52, 53
, up to an NTD rate of 1997). This high incidence is correlated with the high 295
folate deficiency rates of pregnant women (43.8 %)12
and the limited use of folic acid pills (see 296
section 5.1.1.) in this region10-13
. 297
298
2.3. Folate deficiency compared with other micronutritional deficiencies in China 299
300
China, one of the largest countries in the world, is not only affected by folate deficiency. 301
Table 2 summarizes the key indicators of folate deficiency and other micronutrient deficiencies 302
(iron, vitamin A, iodine and zinc) in China. Although these indicators differ according to the type of 303
micronutrient deficiency, this table provides an insight into the magnitude of micronutrient 304
malnutrition in China. 305
Vitamin A deficiency, for instance, remains a serious health problem in Chinese preschool 306
children (11.4 million) and mothers (396 million), especially those living in rural areas54
. The 307
average share of Vitamin A deficient preschool children varies between 12.2 %55
and 16.0 %56
, of 308
which 30,500 children die from increased susceptibility to infection56
. 309
With respect to zinc deficiency, a study of Ma et al29
estimated the total number of Chinese 310
zinc deficient people to be around 86 million. 311
Another important type of micronutrient deficiency is iron deficiency. The number of people 312
affected by iron deficiency anemia (IDA), 208.6 million, is a reliable indicator of the importance of 313
Nature Biotechnology, vol. 28, no. 6 DeSteur, H. et al.

9
iron deficiency in China29
. The high IDA prevalence rate of women of childbearing age (21 %) 314
demonstrates that China‟s fight against iron deficiency is still going on54, 56
. 315
In comparison with important iodine deficient countries, the goitre (theroid swelling) rate in 316
China - the main cause of iodine deficiency - is rather low. Nevertheless, more than 425 million 317
people in China live in areas of endemic iodine deficiency54
.Iodine deficiency in pregnancy, for 318
instance, is responsible for the annual birth of nearly 2 million Chinese babies with intellectual 319
impairment56
. 320
Although there is a lack of folate deficiency indicators in China, besides the NTD 321
prevalence rate (12.9 NTDs per 10,000 births9), the high prevalence rate of folate deficiency from 322
the study of Hao et al45
shows that folate deficiency is also an important micronutrient deficiency. 323
324 Table 2 Estimations of the main micronutritional deficiencies in China 325
326
Vitamin A
deficiency
Zinc
deficiency
Iron
deficiency
Iodine
deficiency
Folate
deficiency
Estimated affected
population
(million)
11.4a
(< 6 years)
396.4a
(maternal)
86.0d
208.6d
425e
(living in ID areas)
1,9c
(children born
mentally impaired)
258.8f
Prevalence rate of
micronutrient
deficiency
indicators
VAD
12.2 %b
16.0 %c
(< 6 years)
IDA
8 % (< 5 years)c
21 % (CBA)b
Goitre rate
10c
NTD
12.9 NTDs
per
10,000 birthsg
327 CBA, women of childbearing age; VAD, Vitamin A deficiency; IDA, iron deficiency anemia; ID, Iodine deficiency; NTD, neural-tube defects 328 a
Based on the 5th UN Report on the World Nutrition Situation57 329 b
Based on a Chinese study of Jingxiong et al55 330 c
Based on a report of UNICEF and The Micronutrient Initiative56 331 d
Based on a Chinese study of Ma et al29 332 e
Based on a Chinese review of Shi-an et al54 333 f Own calculations, see Table 1 334
g Based on Dai et al9 see Table 3 335
336
337
3. Neural-tube defects 338
339
Neural-tube defects, the main adverse health outcome of folate deficiency, are characterized 340
by malformations of the spine (such as spina bifida), skull or brain (eg. anencephaly; 341
encephalocele), and are considered to be the most common congenital malformations in the world58
. 342
These malformations occur when the open neural tube, formed in the early stages in the 343
development of the human embryo, fails to close around the 28th day after fertilization. As a 344
consequence, the development of skull and/or spine is hampered. 345
The relationship between maternal folate deficiency and the risk of having a baby with an 346
NTD is widely established in scientific literature (for a review, see Lumley et al5). Worldwide, 347
studies explored the impact of periconceptional folate intake on the prevalence of NTDs3, 59-61
. 348
Given that folate deficiency refers to a daily folate intake below 400 µg, between 50 % and 70 % of 349
all NTDs in the world are considered to be attributable to folate deficiency. These global protective 350
rates are understood as the percentage of NTDs that can be prevented by consuming the daily 351
recommended folate level of 400 µg. 352
353
354
355
356
357
358
Nature Biotechnology, vol. 28, no. 6 DeSteur, H. et al.

10
3.1. Neural-tube defects in the world 359
360
Folate deficiency leads to an annual number between 200,000 and 300,000 neural-tube 361
defects62-64
and is responsible for 1 out of 10 adult deaths from heart diseases63
. Like all birth 362
defects, NTDs are considered a global health problem, but almost all severe or fatal defects occur in 363
developing, low-income countries62
. Nevertheless, neural-tube defects are still present in the 364
Western world40
. Every year more than 4,500 births in the European Union are affected by neural 365
tube defects65
. In the United States the prevalence rates for the two most common NTDs, spina 366
bifida and anencephaly, were 1.8 per 10,000 live births and 1.1 per 10,000 live births, 367
respectively66
. The lower prevalence of NTDs in the United States, about 3,000 per year, is partly 368
based on the successful implementation of policy interventions to increase folate intake (see section 369
5.1.2.). 370
Figure 4 gives an overview of the top 20 countries according to the estimated annual number 371
of neural-tube defects. The number of NTDs is considered as an important indicator of the 372
magnitude of folate deficiency. There is a significant difference in the estimated number of NTDs 373
between the two highest ranked countries, India and China, and the other countries. Inadequate 374
folate intake levels in China are causing approximately 18,000 NTDs each year. These NTDs 375
account for one-third of stillbirths and a quarter to a third of neonatal deaths, mainly due to the high 376
prevalence of NTDs in Northern China8, 9
(see section 3.2.). When controlled for population size, 377
African and Middle-Eastern countries are the most problematic (For a global report on birth defects 378
and NTDs, see Christianson et al62
and the UNICEF Global Damage Assessment Report63
, 379
respectively ). 380
381
382 383 Figure 4 The estimated annual number of neural-tube defects, Top 20 countries. 384 Source: Own calculations based on UNICEF
63, Busby et al
65 (EU), Cherian et al
51 (India) and Table 4 (China) 385
386
3.2. Neural-tube defects in China 387
388
Given China‟s position in the world ranking of neural-tube defects (see Figure 4), this 389
section further explores the number of neural-tube defects in China and its regions (For a map of the 390
administrative areas/regions, see Annex 1, Figure 6). Table 3 presents the most relevant 391
demographic statistics to calculate the total number of NTDs according to its main type (spina 392
bifida, anencephaly or encephalocele). In 2007, China is characterized by a total population of 1.3 393
billion people and, based on a birth rate of 11.2 births per 1,000 population, approximately 14 394
million births. As no recent regional life expectancy rates are available, the life expectancy of these 395
births, 71.24 years for China, refers to the year 200067
. The NTD prevalence rates per 396
administrative area and region are expressed per 10,000 births and refer to NTD affected 397
pregnancies within the period 1996 to 20009. Therefore, these rates are used as approximate 398
incidence rates. In Figure 7 of Annex 1, a graphical presentation of the NTD prevalence rates per 399
administrative region is shown. 400
Nature Biotechnology, vol. 28, no. 6 DeSteur, H. et al.

11
Table 3 Demographic profile of China, total population, birth rate, total births and life expectancy at birth, and NTD 401 prevalence rates per functional outcome, per administrative area and region 402 403 Region/
Administrative
area
Populationa Births NTD rate
d
Total
Rateb
Life (per 10,000 births)
(x 1,000 persons) Total expectancyc Anenc. Spina Enceph. Total
NORTH 556,299 10.8 6,028,946 73.19 7.3 10.2 2.4 19.9
Northeast 458,688 10.4 4,761,446 73.59 6.6 10.3 2.3 19.2
Beijing 16,171 8.3 134,544 76.10 2.3 5.8 1.4 9.6
Tianjin 10,996 7.9 86,975 74.91 3.7 10.3 2.2 16.2
Hebei 70,557 13.3 940,520 72.54 5.1 9.2 2.6 16.9
Shanxi 34,521 11.3 390,089 71.65 27.2 27.2 6.6 60.9
Inner Mongolia 24,518 10.2 250,327 69.87 17.0 11.8 3.2 32.0
Liaoning 43,686 6.9 300,993 73.34 4.3 11.0 1.6 16.9
Jilin 27,852 7.6 210,284 73.10 5.0 8.2 0.9 14.0
Heilongjiang 39,103 7.9 308,134 72.37 4.6 5.2 1.3 11.1
Shandong 95,218 11.1 1,057,870 78.14 1.6 6.8 1.3 9.7
Henan 96,067 11.3 1,081,711 73.91 5.1 12.4 3.3 20.8
Northwest 97,611 13.0 1,267,500 72.39 9.4 9.9 2.9 22.2
Shaanxi 38,203 10.2 390,056 74.70 12.3 14.5 5.8 32.6
Gansu 26,656 13.1 350,254 71.85 11.7 12.2 2.6 26.5
Qinghai 5,606 14.9 83,691 72.55 6.6 6.6 2.0 15.3
Ningxia 6,178 14.8 91,431 68.95 9.2 10.1 1.8 21.1
Xinjiang 20,969 16.8 352,068 73.92 5.9 4.8 2.5 13.3
SOUTH 764,524 11.4 8,741,811 69.42 2.7 2.2 0.8 5.8
Southeast 565,087 11.5 6,524,892 69.96 2.7 2.1 0.8 5.6
Shanghai 18,564 9.1 168,380 71.54 0.7 0.8 0.4 1.8
Jiangsu 77,226 9.4 723,603 71.08 1.5 2.0 0.4 3.9
Zhejiang 50,938 10.4 528,734 70.66 2.6 2.8 0.3 5.7
Anhui 62,497 12.8 796,833 73.27 5.3 4.0 1.6 10.8
Fujian 36,393 11.9 433,081 71.29 4.3 1.5 1.2 6.9
Jiangxi 44,383 13.9 615,153 72.92 2.2 2.5 1.1 5.8
Hubei 58,231 9.2 535,144 71.73 2.9 2.0 1.3 6.2
Hunan 64,869 12.0 775,832 71.20 2.6 3.8 1.1 7.4
Guangdong 95,166 12.0 1,138,180 65.96 2.5 2.1 1.0 5.6
Guangxi 48,269 14.2 684,936 65.49 5.1 0.7 0.5 6.2
Hainan 8,551 14.6 125,017 64.37 2.7 1.0 0.2 3.9
Southwest 199,437 11.1 2,216,919 68.23 2.8 2.7 1.0 6.6
Sichuan 83,557 9.2 769,557 70.07 1.8 1.5 1.1 4.4
Guizhou 38,430 13.3 510,350 67.47 4.3 6.9 0.7 11.9
Yunnan 45,854 13.1 599,776 66.03 1.8 1.0 1.0 3.8
Tibet 2,874 16.4 47,141 70.17 3.6 3.6 0.0 7.3
Chongqing 28,722 10.1 290,094 67.41 4.0 2.0 1.6 7.6
CHINA 1,320,823 11.2 14,770,757 71.24 5.0 6.3 1.6 12.9 a Population figures of 2007 are based on the China Statistical Yearbook 200867 404
b Birth rates are expressed per 1,000 population in 2007, based on the China Statistical Yearbook 200867 405
c Regional life expectancy at birth in 2000 is expressed in years, based on the China Statistical Yearbook 200867 406
d NTD prevalence rates between 1996 – 2000 are expressed per 10,000 births, based on a study of Dai et al9. 407
408 409 Based on the population, the birth rate and the NTD prevalence rate (Table 3), the total 410
number of NTDs can be calculated for each administrative area (Table 4). To define the number of 411
NTDs per functional outcome, reference is made to the composition of NTDs in the study of Li et 412
al8, where NTDs were ascertained from live births, still births and induced abortions in Shanxi 413
Province. While abortions are considered as a voluntary or spontaneous termination of a pregnancy, 414
stillbirths are defined as births of a baby with no signs of life68
. According to this Chinese study, 415
31 % of all NTDs are considered to be abortions, and live births and stillbirths account for 40.09 % 416
and 28.91 % of all NTDs, respectively. These figures are in line with other studies in China52, 69
. 417
Nature Biotechnology, vol. 28, no. 6 DeSteur, H. et al.

12
Within the group of NTD live births, the number of cases of spina bifida and encephalocele is 418
determined by the proportion of their prevalence rate and the total NTD prevalence rate. 419
420 Table 4 Neural-tube defects in China, per functional outcome, per administrative area and region 421 422 Region/
Administrative
area
Non-Fatal Fatal Total
Spina Enceph. Total Abort. Stillb. Total
NORTH 3,957 1,031 4,988 3,857 3,597 7,454 12,443
Northeast 3,057 734 3,791 2,932 2,734 5,666 9,457
Beijing 41 10 52 40 37 77 129
Tianjin 47 10 56 44 41 84 141
Hebei 499 140 639 494 461 955 1,594
Shanxi 767 185 952 736 687 1 423 2,375
Inner Mongolia 253 68 321 248 231 479 800
Liaoning 178 26 204 158 147 305 509
Jilin 107 11 118 92 85 177 295
Heilongjiang 110 27 137 106 99 205 343
Shandong 345 65 410 317 295 612 1,022
Henan 711 191 902 697 650 1,347 2,249
Northwest 900 298 1,197 926 863 1,789 2,986
Shaanxi 365 145 509 394 367 761 1,270
Gansu 307 65 372 287 268 556 927
Qinghai 39 12 51 40 37 77 128
Ningxia 66 12 77 60 56 115 193
Xinjiang 123 64 187 145 135 280 467
SOUTH 1,584 651 2,236 1,729 1,612 3,341 5,577
Southeast 1,176 488 1,664 1,287 1,200 2,486 4,150
Shanghai 8 4 12 10 9 18 31
Jiangsu 96 17 113 87 82 169 282
Zhejiang 108 13 121 94 87 181 302
Anhui 248 97 345 267 249 516 861
Fujian 67 53 120 93 87 180 300
Jiangxi 99 44 143 111 103 214 357
Hubei 81 51 132 102 95 198 330
Hunan 180 50 231 178 166 345 575
Guangdong 170 85 255 197 184 381 636
Guangxi 103 68 171 132 123 256 427
Hainan 16 3 19 15 14 29 49
Southwest 409 163 572 442 413 855 1,427
Sichuan 80 56 136 105 98 203 338
Guizhou 220 24 244 189 176 365 609
Yunnan 45 45 90 70 65 135 225
Tibet 14 0 14 11 10 21 34
Chongqing 50 39 88 68 64 132 220
CHINA 5,541 1,683 7,224 5,586 5,210 10,796 18,020
423
Each year, a total of 18,020 pregnancies are affected with an NTD in China, most of them 424
with a fatal result. It is important to notice that the total NTD figures in Table 2 refer to all NTDs, 425
i.e. NTDs caused by folate deficiency or other factors, such as genetic or environmental70
, except 426
for spontaneous NTD related abortions. Although there is evidence on the positive relationship 427
between a history of spontaneous abortions and an increased prevalence of NTDs71
, the number of 428
spontaneous NTD related abortions are not investigated in this study. If information on the number 429
of NTDs that result in a spontaneous termination would be available, the number of NTDs in China 430
would be higher. 431
Nature Biotechnology, vol. 28, no. 6 DeSteur, H. et al.

13
When comparing Chinese regions, the NTD prevalence rate is more appropriate as an 432
indicator of NTD-risk regions than the total number of NTDs. Although Shanxi Province, situated 433
in the Northeast, obtains the highest NTD prevalence rate (60.9), Northwest China is considered as 434
the most problematic Chinese region, with 22.2 NTDs per 10,000 births. The significant difference 435
between Northern and Southern China is shown in both the NTD rate and the total number of NTD 436
(see also Annex 1, Figure 7). While 31 % of all NTD affected pregnancies occur in Southern China, 437
in its northern counterpart accounts for more than two thirds of all Chinese NTDs. 438
439
3.3. Neural-tube defects caused by folate deficiency in China 440
441
Although the total number of NTDs has been used as an indicator of the importance of folate 442
deficiency (see section 3.1.), only a part of these NTDs are attributable to folate deficiency. This 443
section estimates the number of neural-tube defects caused by folate deficiency in China. As there is 444
a lack of data on the contribution of folate deficiency to other functional outcomes, NTDs caused by 445
folate deficiency are the only functional outcomes of folate deficiency that will be included in the 446
DALY framework to measure the current burden of folate deficiency (see section 4) and the health 447
impact of folate biofortification (see section 6). This implies an underestimation of the global health 448
benefits of folate biofortified rice. Its health impact would be significantly higher when other 449
outcomes of folate deficiency could be included, such as megaloblastic anemia, heart diseases and 450
cancer. Nevertheless, as NTDs are not only considered as the main adverse health outcome of folate 451
deficiency, but also as the world‟s major congenital malformation, the number of NTDs is a 452
valuable indicator to measure the current burden of folate deficiency. 453
As there is currently no data on the contribution of folate deficiency to NTDs in each 454
administrative area, two regional contribution levels are used to determine the number of NTDs 455
caused by folate deficiency. Based on a folic acid supplementation study among pregnant women 456
(see section 5.1.1.), Berry et al72
estimated that women in Northern and Southern China are able to 457
reduce the risk of having a baby with an NTD by 85 % and 40 %, respectively, if they achieve the 458
daily folate recommendation of 400 µg. In other words, respectively 85 % and 40 % of all NTDs 459
are attributable to folate deficiency in northern and southern regions. Although this study only 460
investigated some of the provinces in Northern and Southern China, similar protective rates are 461
found in a Chinese study of Chen et al73
. 462
Based on these regional contribution levels and the total number of NTDs in Table 4, the 463
number of NTDs caused by folate deficiency are calculated in Table 5. The use of different 464
contribution levels in Northern and Southern China explains the increased regional difference in the 465
number of NTDs caused by folate deficiency. No less than 83 % of all these NTD affected 466
pregnancies in China occur in the north, and in particular, in the northwest. Even more striking is 467
the number of the NTDs in Shanxi Province, which is almost as high as the whole southern part. 468
With respect to the different functional outcomes, almost 60 % of the NTDs has a fatal 469
outcome. If the NTD results in a live birth, malformations in the back (i.e. spina bifida) are the most 470
frequent outcome. When linking Table 5 to the input parameters of the DALY framework (see 471
section 4.2.), the total number of non-fatal and fatal NTDs caused by folate deficiency are 472
considered as the combined input parameters TjIij and TjMj, respectively. 473 474
Nature Biotechnology, vol. 28, no. 6 DeSteur, H. et al.

14
Table 5 Neural-tube defects caused by folate deficiency in China, per functional outcome, per administrative area and 475 region 476 477 Region/
Administrative
area
Non-Fatal Fatal Total
Spina Enceph. Total Abort. Stillb. Total
NORTH 3,363 877 4,240 3,279 3,058 6,336 10,576
Northeast 2,599 624 3,223 2,492 2,324 4,816 8,038
Beijing 35 9 44 34 32 66 110
Tianjin 40 8 48 37 35 72 120
Hebei 424 119 543 420 392 812 1,355
Shanxi 652 158 809 626 584 1,209 2,019
Inner Mongolia 215 58 273 211 197 407 680
Liaoning 151 22 173 134 125 259 433
Jilin 91 9 101 78 73 150 251
Heilongjiang 93 23 117 90 84 175 291
Shandong 293 55 348 269 251 520 868
Henan 604 162 766 593 553 1,145 1,912
Northwest 765 253 1,018 787 734 1,521 2,538
Shaanxi 310 123 433 335 312 647 1,080
Gansu 261 55 316 244 228 472 788
Qinghai 33 10 44 34 32 65 109
Ningxia 56 10 66 51 47 98 164
Xinjiang 105 55 159 123 115 238 397
SOUTH 634 261 894 692 645 1,337 2,231
Southeast 470 195 666 515 480 995 1,660
Shanghai 3 2 5 4 4 7 12
Jiangsu 38 7 45 35 33 68 113
Zhejiang 43 5 48 37 35 72 121
Anhui 99 39 138 107 100 206 345
Fujian 27 21 48 37 35 72 120
Jiangxi 40 18 57 44 41 85 143
Hubei 32 21 53 41 38 79 132
Hunan 72 20 92 71 67 138 230
Guangdong 68 34 102 79 74 152 255
Guangxi 41 27 68 53 49 102 171
Hainan 6 1 8 6 6 12 19
Southwest 163 65 229 177 165 342 571
Sichuan 32 22 54 42 39 81 135
Guizhou 88 10 98 75 70 146 243
Yunnan 18 18 36 28 26 54 90
Tibet 6 0 6 4 4 8 14
Chongqing 20 15 35 27 25 53 88
CHINA 3,997 1,137 5,134 3,970 3,703 7,673 12,807 478 Note: These figures are determined by the total number of NTDs (Table 2) and the contribution level of folate deficiency to NTDs in Northern (85 %) 479 and Southern China (40 %). 480 481
482
Nature Biotechnology, vol. 28, no. 6 DeSteur, H. et al.

15
4. Current burden of folate deficiency in China 483
484
4.1. The DALY formula 485
486
The Disability-Adjusted Life Year method is used to quantify the burden of folate deficiency 487
as a single index, i.e. the number of DALYs lost. This number equals the sum of the “Years Lived 488
with Disability” (YLD) and “Years of Life Lost” (YLL), which represent, respectively, disability-489
weighted morbidity and cause-specific mortality due to folate deficiency. The DALY formula23, 26
490
to estimate both the death and disease condition resulting from folate deficiency is expressed as: 491
492
The input parameters of the formula are the total number of people in target group j (Tj); the 493
mortality rate associated with the deficiency in target group j (Mj); incidence rate of functional 494
outcome i in target group j (Iij); the disability weight for functional outcome i in target group j, (Dij); 495
the duration of functional outcome i in target group j (dij); the average remaining life expectancy for 496
target group j (Lj) and the discount rate for future life years (r). 497
When applying this formula to calculate the burden of folate deficiency, only NTDs caused 498
by folate deficiency are included as functional outcomes. Therefore, the three main NTD types, i.e. 499
spina bifida, encephalocele (also known as cranium bifidum) and anencephaly, in particular those 500
NTDs that are attributable to folate deficiency, are considered as functional outcomes in this study. 501
The target groups referring to these NTDs are births, both fatal and non-fatal, as these are the ones 502
that will be directly influenced by their mother‟s biofortified diet. The functional outcomes related 503
to these target groups are split up into a non-fatal (morbidity) and fatal (mortality) component. 504
While the latter is determined by abortions and stillbirths, the former consists of live births suffering 505
from spina bifida or encephalocele. The third NTD type, anencephaly, results in death before or 506
shortly after birth and is considered as a part of the mortality component74, 75
. The values of the 507
input parameters of the DALY framework are further described in section 4.2. 508
509
4.2. Input parameters of the DALY formula 510
511
Table 6 summarizes all input parameters that are included in the DALY formula. The input 512
parameters TjIij and TjMj are presented in Table 5 and refer to non-fatal and fatal functional 513
outcomes, respectively. Disability weights of the functional outcomes (Dij) differ according to the 514
level of severity or disability, and range from 0 („healthy‟) to 1 („death‟)18
. The average remaining 515
life expectancy (Lj) of stillbirths and abortions refers to the average life expectancy at birth (see 516
Table 3). Also the duration of a non-fatal NTD (dij) is assumed to be permanent, by which dij equals 517
Lj. Based on the global burden of disease study of Mathers et al75
, a disability weight of 0.593 and 518
0.52 is attributed to spina bifida and encephalocele, respectively. The discount rate for future life 519
years (r) amounts to 3 percent, in accordance with previous health impact studies23, 26
. 520
521 Table 6 Overview of the input parameters of the DALY formula, applied to China 522 523
Functional outcome TjIij TjMj Dij Lj=dij r
Morbidity
Spina bifida Table 5, column 2 NA 0.593 Table 3, column 5 3 %
Encephalocele Table 5, column 3 NA 0.520
Mortality
Stillbirths NA Table 5, column 5 NA Table 3, column 5 3 %
Abortions NA Table 5, column 6 NA 524 Tj, total number of people in target group j; Iij, incidence rate of functional outcome i in target group j; Mj, the mortality rate associated with the 525 deficiency in target group j; Dij, the disability weight for functional outcome i in target group j; Lj, the average remaining life expectancy for target 526 group j; dij, the duration of functional outcome i in target group j; r, discount rate for future life years; NA, not applicable 527 528
4.3. The current burden of folate deficiency in China (DALYs lost) 529
Nature Biotechnology, vol. 28, no. 6 DeSteur, H. et al.

16
530
The present burden of folate deficiency in China, i.e. the situation „without‟ biofortification, 531
can be calculated by entering the input parameters of Table 6 into the DALY formula. This burden 532
is expressed in the number of DALYs lost per administrative area (Table 7). Based on the present 533
consumption pattern, folate deficiency in China is responsible for an annual loss of 314,180 534
DALYs. With respect to the regional differences, the number of DALYs lost is significantly higher 535
in Northern China, especially in the northeast. However, when these numbers are weighted 536
according to the total population, the current situation is worst in Northwest China, with 6.39 537
DALYs lost per 10,000 persons, per year (see also Table 11, column 3). By way of comparison, the 538
annual number of DALYs lost in the northeast is 4.31 per 10,000 persons. The relative burden in 539
Southern China is significantly lower with 0.71 DALYs lost per 10,000 persons. These findings are 540
mainly a consequence of differences in NTD prevalence rates and the regional contribution level of 541
folate deficiency to NTDs. Regarding the functional outcomes, the burden of morbidity and 542
mortality caused by folate deficiency amounts to 27.85 % and 72.15 %, respectively. Within these 543
categories, spina bifida obtains the highest number of years lived with disability, while the lost life 544
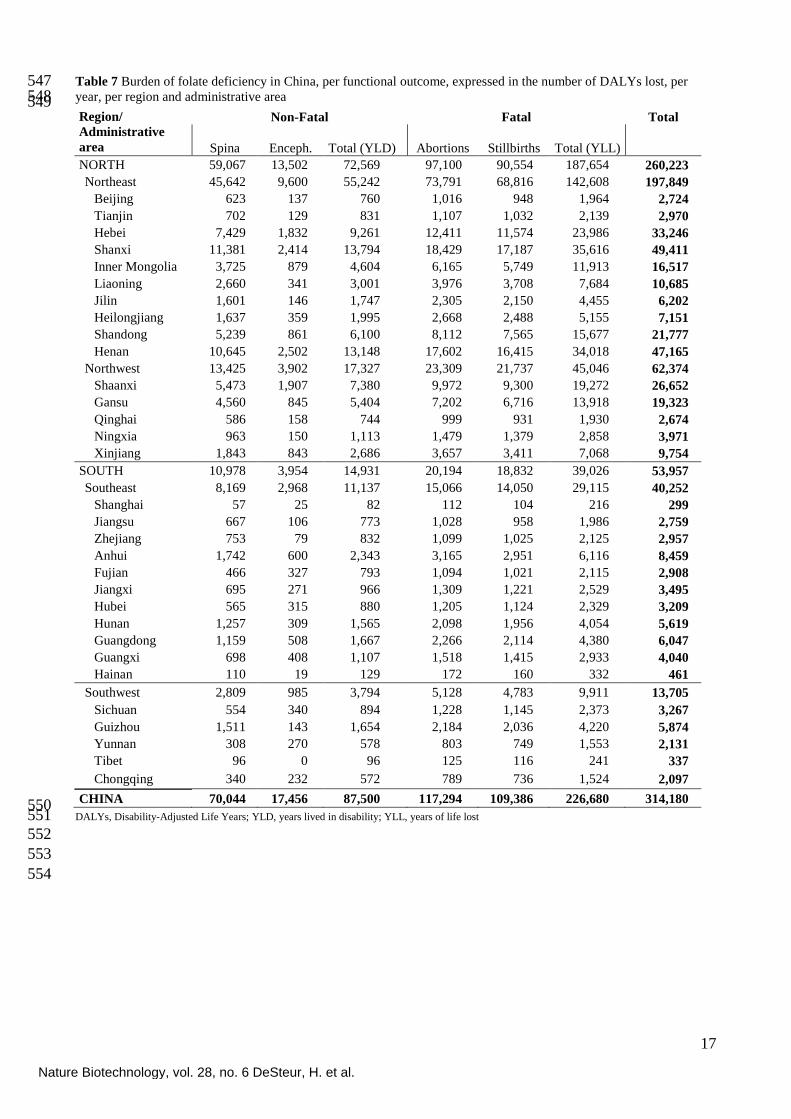
years are more or less equally divided between the two fatal outcomes. 545 546
Nature Biotechnology, vol. 28, no. 6 DeSteur, H. et al.
17
Table 7 Burden of folate deficiency in China, per functional outcome, expressed in the number of DALYs lost, per 547 year, per region and administrative area 548 549 Region/
Administrative
area
Non-Fatal Fatal Total
Spina Enceph. Total (YLD) Abortions
Stillbirths Total (YLL)
NORTH 59,067 13,502 72,569 97,100 90,554 187,654 260,223
Northeast 45,642 9,600 55,242 73,791 68,816 142,608 197,849
Beijing 623 137 760 1,016 948 1,964 2,724
Tianjin 702 129 831 1,107 1,032 2,139 2,970
Hebei 7,429 1,832 9,261 12,411 11,574 23,986 33,246
Shanxi 11,381 2,414 13,794 18,429 17,187 35,616 49,411
Inner Mongolia 3,725 879 4,604 6,165 5,749 11,913 16,517
Liaoning 2,660 341 3,001 3,976 3,708 7,684 10,685
Jilin 1,601 146 1,747 2,305 2,150 4,455 6,202
Heilongjiang 1,637 359 1,995 2,668 2,488 5,155 7,151
Shandong 5,239 861 6,100 8,112 7,565 15,677 21,777
Henan 10,645 2,502 13,148 17,602 16,415 34,018 47,165
Northwest 13,425 3,902 17,327 23,309 21,737 45,046 62,374
Shaanxi 5,473 1,907 7,380 9,972 9,300 19,272 26,652
Gansu 4,560 845 5,404 7,202 6,716 13,918 19,323
Qinghai 586 158 744 999 931 1,930 2,674
Ningxia 963 150 1,113 1,479 1,379 2,858 3,971
Xinjiang 1,843 843 2,686 3,657 3,411 7,068 9,754
SOUTH 10,978 3,954 14,931 20,194 18,832 39,026 53,957
Southeast 8,169 2,968 11,137 15,066 14,050 29,115 40,252
Shanghai 57 25 82 112 104 216 299
Jiangsu 667 106 773 1,028 958 1,986 2,759
Zhejiang 753 79 832 1,099 1,025 2,125 2,957
Anhui 1,742 600 2,343 3,165 2,951 6,116 8,459
Fujian 466 327 793 1,094 1,021 2,115 2,908
Jiangxi 695 271 966 1,309 1,221 2,529 3,495
Hubei 565 315 880 1,205 1,124 2,329 3,209
Hunan 1,257 309 1,565 2,098 1,956 4,054 5,619
Guangdong 1,159 508 1,667 2,266 2,114 4,380 6,047
Guangxi 698 408 1,107 1,518 1,415 2,933 4,040
Hainan 110 19 129 172 160 332 461
Southwest 2,809 985 3,794 5,128 4,783 9,911 13,705
Sichuan 554 340 894 1,228 1,145 2,373 3,267
Guizhou 1,511 143 1,654 2,184 2,036 4,220 5,874
Yunnan 308 270 578 803 749 1,553 2,131
Tibet 96 0 96 125 116 241 337
Chongqing 340 232 572 789 736 1,524 2,097
CHINA 70,044 17,456 87,500 117,294 109,386 226,680 314,180 550 DALYs, Disability-Adjusted Life Years; YLD, years lived in disability; YLL, years of life lost 551
552
553
554
Nature Biotechnology, vol. 28, no. 6 DeSteur, H. et al.

18
5. Policy interventions to tackle folate deficiency 555
556
Like other micronutrient deficiencies, folate deficiency can be addressed by four strategies: 557
distributing folic acid supplements (pharmaceutical supplementation), fortifying foods with folic 558
acid (industrial fortification), diversifying people‟s diets to increase the consumption of folate-rich 559
foods (dietary diversification) or enhancing the folate content of staple crops (biofortification). 560
While the former two interventions aim to limit folate deficiency through the increased intake of 561
synthetic folic acid, the objective of the latter two strategies is to enhance the natural folate intake 562
level. Folic acid based interventions are often criticized because of the relationship between 563
excessive folic acid intake and masking anemia caused by vitamin B12 deficiency76
. Although the 564
folic acid fortification policy in the United States did not cause a major increase in the number of 565
vitamin B12 deficient people38
, and a multi-micronutrient fortification policy to increase both folic 566
acid and vitamin B12 could be a partial solution for the future41, 76
, the debate about the adverse 567
health effects of high folic acid intake hampers the introduction of mandatory folic acid fortification 568
in many (European) countries77
. 569
The following sections briefly discuss the different policy interventions to tackle folate 570
deficiency in relation to the (Chinese) policy context (For a general overview and comparison of the 571
different interventions to tackle nutritional deficiencies, we refer to the Stein et al25
). As not all 572
interventions have been implemented in China, the experience of folate or other nutritional 573
programs in other countries is also drawn. 574
575
5.1. Folic acid based interventions 576
577
5.1.1. Folic acid supplementation 578
579
Folic acid supplementation is an external nutritional intervention to tackle folate deficiency 580
in specific target groups by promoting the use of folic acid or multivitamin supplements. 581
Supplementation programs mainly target women of childbearing age. By encouraging them to 582
consume daily folic acid pills from the periconceptional period until approximately three months of 583
gestation, the number of NTDs can be reduced. The ability to focus on specific population groups is 584
considered as both an advantage and disadvantage of this intervention. On the one hand, targeting 585
women of childbearing age tackles folate deficiency where it is most needed. On the other hand, a 586
population-based approach is needed, as folate deficiency is present in all sections of the 587
population42
. 588
Folic acid pills generally contain 400 µg of folic acid, which is in line with the folate 589
recommendations. Therefore, a daily consumption of such pills is currently considered as the most 590
effective strategy for women of childbearing age in order to prevent them against a pregnancy 591
affected by an NTD caused by folate deficiency (for a review of the relationship between folic acid 592
supplementation and NTDs, see Lumley et al5). Besides these daily supplements, folic acid can also 593
be given less frequently, e.g. 5 mg on a weekly basis. Although weekly supplementation could be a 594
practical answer to the low compliance to consume folic acid supplements, evidence is needed to 595
demonstrate that it is as effective as daily folic acid supplements78
. 596
Folic acid supplements can also be delivered with other micronutrients. By implementing 597
such a multivitamin program, by which folic acid is incorporated in another vitamin supplement, 598
such as vitamin A capsules, duplication of costs and efforts can be avoided. 599
600
Supplementation programs 601
602
Effective supplementation programs were introduced in Philippines, Cambodia, and 603
Vietnam, where pregnant women received free daily iron and folic acid supplements and non-604
pregnant women were encouraged to take weekly supplements79
. In Western and Northern Europe, 605
folic acid supplementation policies are well established, but their effectiveness to reduce NTDs is 606
Nature Biotechnology, vol. 28, no. 6 DeSteur, H. et al.

19
rather limited40, 65, 76
. The success of supplementation programs depends on the duration and the 607
intensity of supplementation efforts, the accessibility of supplements, the effectiveness of the health 608
system and the inclusion of a targeted educational component in the program78, 80
. However, 609
pharmaceutical supplementation is not considered as a long-term solution to tackle folate 610
deficiency. Previous campaigns to promote folic acid supplementation in the United States81
and 611
The Netherlands82
, for instance, increased knowledge about folic acid, but were less effective in 612
stimulating the use of folic acid supplements. And if a program is effective, the increased folic acid 613
intake is often not sustainable and decreases again once the program ceased83
(For a review of the 614
success of folic acid supplementation programs, see Cordero et al78
). 615
616
China and supplementation 617
618
Because of the one child per family policy, the prevention and control of birth defects is a 619
high priority for the Chinese government. In their “2002-2010 National Action Plan for Reducing 620
Birth Defects and Disabilities in China”, the Ministry of Health (MOH) and the Chinese Disabled 621
Person Federation (CDPF) recommend that all women of child-bearing age should obtain folic acid 622
and health information on folic acid supplementation, in order to bring birth defects under effective 623
control by 201084
. By the end of 2010, at least 60% of all married women who plan to be pregnant 624
have to achieve the daily recommendation for folate. Therefore, a national public health education 625
campaign and a national preconception care program is released. In 2009, for instance, about 12 626
million rural Chinese women of child-bearing age received free folic acid supplements85
. 627
Although such supplementation programs are expected to reduce the number of NTDs, the 628
reduction is likely to be a short term effect. Between 1993 and 1995 for instance, a successful folic 629
acid supplementation intervention was conducted as a part of the public health campaign72
. This 630
intervention reduced the number of NTDs by delivering folic acid supplements to women during 631
their mandatory premarital health examination. However, once the program ceased, the NTD 632
prevalence rate increased to its pre-supplementation value86
. 633
Despite previous supplementation efforts, the current intake of folic acid supplements is 634
very low in rural areas and high risk regions. In Shanxi Province, for example, only 10 % of women 635
of childbearing age once used folic acid pills, regardless of their knowledge about the correct time 636
of use10, 11
. The low compliance of taking folic acid supplements in such poor, rural areas might be 637
determined by the price of folic acid (30 pills of 400 µg folic acid is about 10 yuan or 1.5 dollar) 638
and the limited access86
. Low compliance of taking folic acid supplements is also a consequence of 639
the large number of unintended pregnancies in China. Most Chinese women are not aware of the 640
need to take folic acid supplements during the periconceptual period. Therefore, implementing a 641
targeted folic acid supplementation program will be more difficult when all women of childbearing 642
age need to be reached and continuation of the program is crucial to keep them motivated78
. 643
644
5.1.2. Folic acid fortification 645
646
While folic acid supplementation targets a specific population group, (industrial) folic acid 647
fortification, i.e. adding folic acid directly to staple crops during the first stage of milling, is 648
currently considered as the most effective population-based strategy to fight folate deficiency 649
without altering dietary habits41
. As successful folic acid fortification requires specialized 650
infrastructure, strict quality control and strong partnerships between public and private sectors, folic 651
acid fortification is less feasible in developing countries and regions that are characterized by large 652
micronutrient deficiencies78, 80, 87
. In line with the multivitamin strategy, folic acid can be added to 653
existing fortified foods, which is successfully demonstrated in Costa Rica88
. 654
655
656
657
658
Nature Biotechnology, vol. 28, no. 6 DeSteur, H. et al.

20
Fortification programs 659
660
In 2005, about 38 countries had opted for a mandatory folic acid fortification policy76
. In the 661
United States34, 89
and Canada60
, for example, cereal grain products were fortified with folic acid to 662
a level of 140 and 150 μg per 100 g, respectively. Other countries focused their mandatory folic 663
acid fortification policy on one (e.g. wheat flour in Chile90
) or more food vehicles (e.g. wheat flour, 664
corn flour, milk and rice in Costa Rica88
). In general, these mandatory fortification programs led to 665
increased folic acid consumption levels78
. As a consequence, the folate intake requirements for most 666
adults were met or exceeded, and the number of NTDs decreased, e.g. from 4,000 to 3,000 NTD 667
affected pregnancies in the United States91
. In Europe, most countries have voluntarily folic acid 668
fortified foods and in some cases, such as in Ireland and in the UK, the introduction of mandatory 669
folic acid fortification has been advocated40, 76, 92
. Only Eastern Europe and Eurasia currently 670
embrace mandatory folic acid fortification. Kazakhstan, for example, is in the process of 671
implementing the laws to require a certain level of folic acid in flour (Flour Fortification Initiative; 672
http://www.sph.emory.edu/wheatflour/). 673
674
China and fortification 675
676
In 2003, the flour fortification pilot program “Flour Fortification in the Western Region of 677
China” was initiated by the State Grain Bureau and the Ministry of Health in China93, 94
. With the 678
support of the Global Alliance for Improved Nutrition (GAIN), a market-based, voluntary 679
fortification program was introduced, with a folic acid fortification level of 200 μg per 100 g. This 680
resulted in the production of fortified flour, often known as “7+1 flour”, in a few companies. 681
However, due to delays in implementation, this project came to an end in 2008. 682
Between 2006 and 2007, folic acid fortified flour was introduced to more than 60,000 683
consumers in the high NTD risk region of Shanxi Province, as a part of the “Strong Newborn” 684
project93
. The objective of this program was to evaluate the effect of flour fortification in the 685
prevention of NTDs. Although the findings indicate a positive effect, there were significant 686
problems to guarantee the quality of fortified flour and to obtain funding in order to start a 687
province-wide implementation. 688
In 2008, the Chinese Public Nutrition and Development Center (PNDC) developed a 689
voluntary flour fortification standard, which was released by the State Grain Authority (SGA)93, 95
. 690
However, at present, very little flour is voluntary fortified in China (about 1 %)93
. Given the limited 691
access to voluntary folic acid fortified foods in China, the main challenge will be to guarantee that 692
the fortified food vehicle will actually (continue to) reach the Chinese consumer, especially in the 693
rural regions of China. As policy makers have still concerns on the feasibility of folic acid 694
fortification in China, the Chinese Ministry of Health intend to undertake additional flour and rice 695
fortification trials in the future86, 93
. Nevertheless, the actual implementation of provincial flour 696
fortification in the market will depend largely on provincial authorities‟ interest and commitment. 697
698
5.2. Folate based interventions 699
700
5.2.1. Dietary diversification 701
702
Dietary diversification aims to modify the dietary patterns of consumers through 703
interventions that promote the consumption of micronutrient-rich foods, e.g. home gardening, as 704
well as nutrition education, e.g. learning consumers to retain micronutrients during processing. 705
Previous food-based strategies focused mainly on the reduction of Vitamin A or iron deficiencies 706
(for a review, see Ruel96
). Although this strategy is considered to be the most sustainable solution, 707
there are currently no scientific reports of population-based interventions which promoted a folate-708
rich diet (e.g. green leafy vegetables and orange-fleshed fruits)78
. While a vegetarian eating pattern, 709
Nature Biotechnology, vol. 28, no. 6 DeSteur, H. et al.

21
characterized by long-term high consumption of vegetables, positively affects the folate intake97
, 710
dietary folate interventions are not necessarily effective to address folate deficiency98
. 711
Furthermore, such food-based strategies rely on food varieties that are already available in 712
the market. Due to the limited availability and consumption of folate-rich products in Northern 713
China, it will be difficult to modify the eating behaviors in this high NTD risk region17, 45
. 714
Especially in the poor rural areas, where consumers mainly consume folate-poor staple crops, such 715
as rice, increasing the consumption of folate-rich food products is less feasible than pro-poor 716
interventions, such as folate biofortification (see section 5.2.2.). 717
718
5.2.2. Folate biofortification 719
720
Biofortification is a pro-poor and pro-rural strategy that uses plant breeding techniques, such 721
as conventional breeding or transgenic techniques, to develop staple food crops for higher 722
micronutrient content99
. The first example of a genetically engineered biofortified staple crop is rice 723
enriched with beta-carotene to tackle Vitamin A deficiency, also known as Golden Rice100
. 724
Folate biofortification, the enhancement of folate in staple food crops, can improve the 725
folate intake of malnourished rural populations that are unlikely to benefit from folic acid 726
fortification or supplementation. Currently, rice with a high folate content, developed by metabolic 727
engineering, is the most advanced folate biofortified staple crop33, 101, 102
. Storozhenko et al1 728
obtained different transgenic lines with a folate content ranging from 350 to 1,700 µg per 100 g of 729
raw polished grains. These figures are 20 to 100 times higher than normal folate levels in rice103
. 730
Even though there is a clear potential to use conventional plant breeding techniques to increase the 731
folate content of rice (e.g. conventional biofortification of other vitamins in maize, wheat, beans, 732
cassava, and rice104
), it may be hard to reach the same level of enhancement as in transgenic 733
techniques, because of the low intrinsic folate concentrations in natural rice varieties102, 105
(For a 734
detailed discussion on the technological issues regarding folate biofortification of food plants and 735
rice, see Storozhenko et al1 and Bekaert et al
102, respectively). 736
As such, folate biofortification of rice, the world‟s main staple crop, can be considered as an 737
alternative and complementary approach to the above mentioned strategies, especially in regions 738
where other interventions are less successful or feasible. First of all, unlike folic acid fortification or 739
supplementation, folate biofortification does not rely on industrial food processing, specialized 740
distribution channels or accessible health systems. Second, it is considered to be a more sustainable 741
approach due to the possibility of re-sowing the biofortified seeds from the previous harvest. Third, 742
possible negative side effects of folic acid fortification, such as masking Vitamin B12 deficiency and 743
the increased risk of colorectal cancer, are less likely to occur with folate biofortification (see 744
section 2). 745
However, in comparison with the targeted approach of folic acid supplementation, there is 746
no assurance that the population will achieve to consume the recommended amount of folate. 747
Furthermore, folate in food is subject to additional losses due to the processing methods, such as 748
cooking106
, and its bioavailability degree (50 %) is significantly lower than in folic acid fortified 749
foods or supplements, respectively 85 % and 100 %107, 108
. Moreover, biofortification, initially 750
applied to improve the micronutritional content of staple crops, may alter other attributes, such as 751
appearance and taste. Such negative attributes may limit consumer acceptance and, in turn, reduce 752
the potential impact of this intervention. Consumers in Kenya109
and Mozambique110
, for instance, 753
preferred traditional white maize over yellow-orange biofortified maize, which is enriched with 754
provitamin A. In the latter study, the authors even found a negative consumer perception of the 755
flavor of biofortified maize. Although folate biofortification is not expected to change sensory and 756
visual product attributes102
, similar to folic acid fortification111
, further research is needed to 757
determine the influence of folate biofortification on product attributes and its consumer acceptance. 758
759
760
761
Nature Biotechnology, vol. 28, no. 6 DeSteur, H. et al.

22
China and biofortification 762
763
China is considered as one of the world leaders in the field of R&D and commercialization 764
of genetically modified foods. Research on biofortification of staple crops became increasingly 765
important for China‟s food security policy, especially after China‟s entry into the World Trade 766
Organization (WTO) in 200180, 112
. The HarvestPlus China Program, for example, initiated in 2004 767
eight research projects related to the development of biofortified maize, wheat, sweet potato and 768
rice in China, in order to address specific micronutrient deficiencies, such as Fe or Vitamin A113
769
(http://www.harvestplus-china.org/). Nevertheless, no transgenic crop was approved for animal or 770
human consumption until recently, when China‟s Ministry of Agriculture (MOA) granted two bio-771
safety certificates and approved phytase maize (feed crop) and biotech Bt rice (food crop)16
. The 772
permission to cultivate these major transgenic crops is expected to lead to full commercialization in 773
about two to three years. As a consequence, China will be the first to introduce a troika of key 774
transgenic crops into the market place, i.e. Bt cotton (fiber), phytase maize (feed) and Bt rice 775
(food)114
. The approval and deployment of the latter will probably lead to the approval of other 776
transgenic food crops, including biofortified staple crops. 777
Even though this might be promising for biofortified staple crops, including folate enriched 778
rice, the process and outcome of the standard food safety and environmental field trials makes it 779
impossible to predict if and when these biotech crops will be approved in China. Furthermore, if 780
(transgenic) biofortified crops will be introduced, labeling of transgenic food crops will probably be 781
required, as outlined by the Chinese State Council80
. With respect to the Chinese Intellectual 782
Property Rights (IPR), patent registration and enforcement probably need to be reformed and 783
centralized in order to improve IPR-protection for biofortified crops (for more information on 784
biofortification policy issues in China, we refer to Campos-Bower et al80
and Pray et al 112
). 785
Although the approval of BT rice might be a catalyst of approving biofortified staple crops, 786
there is a clear difference between these two types of transgenic crops. While the former 787
encompasses improvements of agronomic traits, i.e. insect resistance, the latter improves quality 788
traits, such as a higher folate content115
. From a policy point of view it can be argued that GM crops 789
that are attractive to both farmers (e.g. by increasing yields due to the improved crop quality; 1st 790
generation crops) and consumers (e.g. by improving health due to the enhanced nutritional quality; 791
2nd
generation crops), will increase public acceptance, and thus, gain political acceptance. The 792
combination of a nutritional and an agronomic trait in staple food crops is considered to be more 793
than the sum of parts. Besides its potential for cost-reduction through the combined implementation 794
efforts, these crops improve farmer‟s health directly, through consumption, and indirectly, through 795
promoting sustainable agriculture (increased yields, productivity and income)116
. Together with 796
multi-biofortification, where one staple crop is enriched with a full range of nutrients, among which 797
folate, this strategy should be put as a priority on the research agenda. Targeting different 798
micronutrient deficiencies at once is a strategy which is also found in other policy interventions, 799
such as pharmaceutical supplementation (e.g. multivitamin supplements), food fortification (e.g. 800
multi-micronutrient fortification, including folic acid and Vitamin B12) and dietary diversification, 801
if it aims to tackle malnutrition as a whole by improve dietary habits. Golden Rice, for example, is 802
assumed to be cost-effective, as shown in scientific literature (see for instance, Stein, et al25
). 803
Crossing our folate trait into this biofortified crop would be an interesting approach to tackle folate 804
and Vitamin A deficiencies and to improve the health impact by introducing one multi-biofortified 805
crop. However, combining first and second generation GM crops, such as Bt rice with a high folate 806
content, would definitely go further by providing an economic incentive to farmers. 807
This paper focuses on the world‟s most consumed staple crop, rice, as the food vehicle for 808
folate biofortification. China is one of the key players in terms of producing and consuming rice, as 809
well as GM rice14, 15
. While Japonica rice is the dominant rice variety in Northern China, Indica rice 810
is mainly planted in Southern China. With respect to folate biofortified rice in China, it will be 811
important to cross folate biofortified rice into local varieties to reach the poorest consumers in the 812
rural regions. In addition, to ensure that Chinese farmers will produce this variety, the trait needs to 813
Nature Biotechnology, vol. 28, no. 6 DeSteur, H. et al.

23
be crossed into a variety that has a high yielding potential, such as Bt rice, and the product should 814
be incorporated into existing marketing chains102
. The success of introducing folate biofortified rice 815
further depends on the efficacy of systems to disseminate such improved rice varieties. 816
817
818
6. The health impact of folate biofortified rice in China 819
820
The health impact of the introduction of folate enriched rice depends on different factors, as 821
Figure 5 depicts. Two important determinants are directly related to folate enriched rice, namely its 822
efficacy (section 6.1.) and coverage rate (section 6.2.). While the former determines the folate dose, 823
the latter defines the market potential of this crop and, thus, the response to this dose. Information 824
about the current folate intake levels and the current rice consumption patterns is used to calculate 825
the total folate intake after biofortification, which reduces the number of maternal folate 826
deficiencies and, thus, reduces the number of neural-tube defects, i.e. the response or the health 827
benefits. 828
This framework to assess the health benefits of folate biofortified rice is based upon 829
previous health impact studies26, 99
. Because the health impact is related to the number of NTDs in 830
China, two target groups are considered. On the one hand, newborns are considered as the target 831
group of the health benefits, as they carry the risk of having a neural-tube defect. On the other hand, 832
due to the relationship between maternal folate deficiency and the risk of delivering a baby with an 833
NTD, women of childbearing age are the target group for folate biofortified rice consumption. The 834
calculation method and the assumptions for each determinant are described in the next two sections. 835
The health impact of introducing folate biofortified rice in China is presented in section 6.3 and 836
compared with other health impact studies in section 6.4. 837
838
839
840
841 842 843 844 845 846 847 848 849 850 851 Figure 5 The health impact of folate biofortified rice 852 Remarks: Efficacy = (folate content in rice, µg per 100 g)*(% folate retention, %)*(degree of bio-availability, %) 853
Additional folate intake = (efficacy, µg per 100 g) - (initial folate content of 100 g rice) 854 Coverage rate = (maternal acceptance rate, %)*(„access‟ = farmers‟ acceptance rate, %) 855
Total folate intake after biofortification = (current folate intake, µg) + (additional folate intake, µg per g)*(rice consumption, g) 856 857
6.1. Total folate intake after folate biofortification of rice in China 858
859
The efficacy of folate biofortified rice is calculated by multiplying the amount of additional 860
folate in rice with the retention of folate after processing the rice and its bioavailability. For the 861
calculations in this paper we have used 1,200 µg per 100 g raw polished grains. This folate content 862
will be reduced by 50 % during rice processing, i.e. cooking1. To take into account the 863
bioavailability upon ingestion, this folate retention will be reduced by 50 %107, 108
. Combining these 864
three efficacy parameters results in a total folate intake of biofortified rice of 300 µg per 100 g rice. 865
Given the initial folate content of rice, 8 µg per 100 g35
, the total added folate intake amounts 292 866
µg per 100 g. 867
Eff
ica
cy
dose - response Folate content
Folate retention
Bio-availability
Total
folate intake Current folate intake
Rice consumption
Additional folate intake
Co
vera
ge
Acceptance
Access
Reduction of
the burden
of folate
deficiency
after
biofortification
Nature Biotechnology, vol. 28, no. 6 DeSteur, H. et al.

24
Given that the current rice patterns do not differ after introducing folate biofortified rice, the 868
total folate intake of Chinese women of childbearing age after biofortification can be estimated by 869
adding the additional folate intake to the current folate intake (Table 8). The average daily rice 870
consumption can be calculated for each administrative area, based on data from the China‟s 871
National Grain and Oils Information Center117
. The lack of regional rice consumption data for 872
women of childbearing age is an important limitation of this study. The maternal intake of rice 873
could be lower than the average, which could influence the total folate intake after biofortification 874
and, thus, the success of the intervention. Although most of the administrative areas have high 875
folate intake levels after biofortification, this could be a problem in, for instance, Shandong and 876
Xinjiang. However, this can be tackled by implementing a transgenic line with a higher folate 877
content, such as 1,700 µg per 100 g of raw polished grains (see section 5.2.1.). 878
Rice consumption in Southern China is twice as large as in Northern China. On average, a 879
Chinese person consumes 315.29 g of rice per day. Also the current daily folate intake is higher in 880
Southern China (212.9 µg per woman of childbearing age) than in Northern China (188.0 µg per 881
woman of childbearing age). This is in accordance with a study of Dexter118
which found a higher 882
prevalence of micronutrient deficiencies in rice consuming regions. A geographical presentation of 883
this relationship is included in Annex 1, where rice consumption (Figure 8), rice production 884
(Figure 9) and folate intake after biofortification (Figure 10) in China are juxtaposed. 885
Given the current rice consumption, the current folate intake and the additional folate intake 886
of biofortified rice, a scenario where Chinese women completely switch to folate biofortified rice 887
and do not alter their rice consumption pattern results in an average folate intake of 1,120.41 µg per 888
day, per woman of childbearing age. This is almost three times the required intake or 280 % of the 889
recommended daily intake (RDI). Regional folate intake levels after biofortification vary from 890
552.18 µg, per day, per person in Shandong (northeast) to 1,941.66 µg, per day, per person in 891
Hunan (southeast). The contribution of the total folate intake after biofortification to the 892
recommended dose varies between 136.29 % in Xinjiang (northwest) and 485.41 % in Hunan 893
(southeast). Although rice consumption and folate intake in the northern regions are significantly 894
lower, the required daily folate intake can still be achieved if folate biofortified rice is consumed. 895
When reporting folate levels above 1,000 µg, doubts about the risk of masking Vitamin B12 896
deficiency can be raised102, 106, 107
(see also section 2). Vitamin B12 deficiency is characterized by 897
macrocytic anemia and neurological impairment. The diagnosis of Vitamin B12 may be delayed by 898
folic acid (reduction to H4folate), as the latter can correct the macrocytosis. However, as our folate 899
biofortified rice mainly contains 5-methyl-tetrahydrofolate (MTHF), the effect of masking this 900
micronutrient deficiency is absent1. This is because the synthesis of H4folate from 5-MTHF is 901
catalyzed by a Vitamin B12 dependent enzyme (methionine synthase). Therefore, a functional folate 902
deficiency occurs when Vitamin B12 is lacking, which makes an early diagnosis of Vitamin B12 903
deficiency possible36
. Furthermore, in regions with folate intake levels higher than 1,000 µg after 904
folate biofortification, such as in Southern China (except Tibet), a transgenic line with a lower 905
folate content can be deployed to avoid negative side effects associated with high folate intake 906
levels. 907
908 909
Nature Biotechnology, vol. 28, no. 6 DeSteur, H. et al.

25
Table 8 Folate biofortification of rice in China in an optimal scenario (100 % consumption of biofortified rice). Current 910 rice and folate consumption, added and total folate intake after biofortification, and % of RDI, per administrative area 911 and region 912 913 914 Region/
Administrative area Current Added Total
rice cons.a folate intake
b folate intake
c folate intake
d % of RDI
e
g /day/person µg /day/CBA µg /day/CBA µg /day/CBA
NORTH 181.14 188.0 528.92 716.92 179.23
Northeast 186.48 190.9 544.51 735.41 183.85
Beijing 379.50 190.9 1,108.15 1,299.05 324.76
Tianjin 286.54 190.9 836.70 1,027.60 256.90
Hebei 134.35 190.9 392.31 583.21 145.80
Shanxi 157.14 190.9 458.85 649.75 162.44
Inner Mongolia 166.50 190.9 486.18 677.08 169.27
Liaoning 279.71 190.9 816.75 1,007.65 251.91
Jilin 321.66 190.9 939.24 1,130.14 282.54
Heilongjiang 294.27 190.9 859.26 1,050.16 262.54
Shandong 123.73 190.9 361.28 552.18 138.04
Henan 133.18 190.9 388.90 579.80 144.95
Northwest 156.06 182.7 455.69 638.39 159.60
Shaanxi 159.21 182.7 464.88 647.58 161.90
Gansu 153.15 182.7 447.19 629.89 157.47
Qinghai 161.29 182.7 470.96 653.66 163.42
Ningxia 252.78 182.7 738.13 920.83 230.21
Xinjiang 124.12 182.7 362.44 545.14 136.29
SOUTH 412.90 212.9 1,205.66 1,418.56 354.64
Southeast 435.53 215.1 1,271.73 1,486.83 371.71
Shanghai 360.09 215.1 1,051.47 1,266.57 316.64
Jiangsu 390.25 215.1 1,139.52 1,354.62 338.65
Zhejiang 493.75 215.1 1,441.76 1,656.86 414.21
Anhui 284.95 215.1 832.04 1,047.14 261.79
Fujian 484.06 215.1 1,413.45 1,628.55 407.14
Jiangxi 520.37 215.1 1,519.49 1,734.59 433.65
Hubei 394.74 215.1 1,152.65 1,367.75 341.94
Hunan 591.29 215.1 1,726.56 1,941.66 485.41
Guangdong 358.42 215.1 1,046.60 1,261.70 315.42
Guangxi 575.54 215.1 1,680.59 1,895.69 473.92
Hainan 278.74 215.1 813.93 1,029.03 257.26
Southwest 348.79 210.4 1,018.46 1,228.86 307.22
Sichuan 357.40 210.4 1,043.60 1,254.00 313.50
Guizhou 300.85 210.4 878.48 1,088.88 272.22
Yunnan 307.11 210.4 896.75 1,107.15 276.79
Tibet 142.97 210.4 417.47 627.87 156.97
Chongqing 475.03 210.4 1,387.08 1,597.48 399.37
CHINA 315.29 199.8 920.64 1,120.41 280.10 CBA, woman of childbearing age; RDI, the recommended daily intake (i.e. folate) 915 a
The daily rice consumption per person is expressed per person, in 2007119. 916 b
The current, regional folate intake before biofortification refers to findings from Zhao et al17. 917 c
The total added folate intake due to biofortification is based on the total current rice intake (column 1), folate intake (column 2) and additional folate 918 content of biofortified rice, 2.92 µg per g. 919 d
Sum of the current and additional folate intake. 920 e
Calculated by comparing the total folate intake after biofortification with the recommended daily intake (RDI) of folate, i.e. a daily average folate 921 intake of 400 µg folate per person. 922 923
924
925
926
Nature Biotechnology, vol. 28, no. 6 DeSteur, H. et al.

26
6.2. Assumptions to measure the health impact of folate biofortified rice in China 927
928
In order to assess the health impact of folate biofortification, assumptions have to be made 929
with respect to the effect of additionally absorbed folate on folate deficiency, the so-called “dose-930
response”. The “dose” is understood as the average daily folate intake after biofortification in China 931
and its regions (see Table 8, column 5). Although a few studies investigated the effect of different 932
folate doses on the reduction of NTD incidence59, 61
, there is still a lack of scientific evidence to 933
measure the health impact of each of the regional total folate intake levels in China. To overcome 934
this problem, the “response” is evaluated by comparing the total folate intake level of women of 935
childbearing age in each of the Chinese administrative areas with the recommended folate intake 936
(see Table 8, column 6). In accordance to previous literature, the “response” to a daily folate intake 937
of 400 µg or higher is understood as the prevention of folate deficiency and its adverse health 938
outcomes, e.g. NTDs2, 5
. Given that each administrative area in China exceeds the recommended 939
daily folate intake of 400 µg per childbearing woman, consumption of folate biofortified rice with 940
an initial folate content of approximately 1,200 µg per 100 g rice is assumed to prevent maternal 941
folate deficiency and the risk of having a baby affected with an NTD caused by folate deficiency. 942
The use of average, regional folate intake levels in the dose-response relationship is an important 943
limitation, which may bias the results. Therefore, it is important to notice that it is the average 944
women of childbearing age that can recover from folate deficiency through a biofortified diet. 945
Nevertheless, a regional comparison of average folate intake levels with the recommended folate 946
dose is also a valuable approach, as the effectiveness of biofortification as a strategy to combat 947
folate deficiency in all Chinese administrative areas can be evaluated. 948
Because only women who agree to consume the folate biofortified rice will recover from 949
folate deficiency and its health risks, the dose after biofortification only refers to a part of the 950
market. This part is determined by the coverage rate, which combines women‟s acceptance of and 951
their access to farmers willing to produce folate enriched rice. According to a recent Chinese study6, 952
55.4 % of female rice consumers are willing to accept rice with a high folate content, while 32.3 % 953
react indifferent and 12.3 % are reluctant. The findings for farmers are even more positive, with 954
66.7 % accepting and only 6.6 % of the farmers rejecting the rice. Although this study was 955
conducted in Shanxi Province, the results are in line with other Chinese consumer studies on other 956
GM food products120-123
. Therefore, by combining acceptance and access to farmers, a low and high 957
coverage rate are defined. While the former (36.95 %) contains only accepting female consumers 958
which have access to approving farmers, the high coverage rate (81.91 %) also takes into account 959
females and farmers that are indifferent to folate biofortified rice. These coverage rates are defined 960
as the percentage of women that switch completely to folate biofortified rice, compared to women 961
that hold on to traditional rice. In that way, they determine the percentage of women that can 962
recover from folate deficiency by a biofortified diet. It is important to notice that it will depend on 963
policy decisions regarding labeling and the availability of, and access to folate biofortified rice, and 964
its product characteristics, such as visual and sensory attributes, whether women will actually be 965
able and willing to switch completely to folate biofortified rice, instead of consuming a mix of rice 966
varieties. Assuming such a mix may lead to a lower health impact of folate biofortification 967
compared to the health benefits of a complete switch to folate biofortified rice. 968
969
6.3. The health impact of folate biofortification of rice in China (DALYs saved) 970
971
Based on the product and market characteristics of folate biofortified rice, described in the 972
previous sections, the benefits to public health can be assessed by comparing the number of DALYs 973
lost under the current situation (“without”) with two biofortification scenario‟s (“with”). A low and 974
high impact scenario are defined by the coverage rate of folate biofortified rice, i.e. 36.95 % (low) 975
and 81.91 % (high) of Chinese women who are willing to accept and have access to this crop. These 976
scenarios start from the assumption that the total folate intake under biofortification in each 977
administrative area in China is significantly higher than the threshold to prevent folate deficiency 978
Nature Biotechnology, vol. 28, no. 6 DeSteur, H. et al.

27
and the risk of delivering a baby affected with an NTD (see Table 8). Table 9 and Table 10 979
summarize the health benefits of folate biofortification of rice in China under a low and high impact 980
scenario, respectively. The results are expressed as the number of DALYs saved through the 981
implementation of folate enriched rice. It is the difference between the number of DALYs lost 982
under the current situation, shown in Table 7, and the DALYs lost under a folate biofortification 983
scenario. This health impact, expressed in DALYs saved, refers to the number of children with an 984
NTD that are “saved”, which is based on the number of their mothers that recover from folate 985
deficiency through a biofortified diet, i.e. the coverage rate. Since some of the parameters of the 986
DALY framework are based on different years (i.e. NTD prevalence rate in 2004, rice consumption 987
in 2007, coverage rate in 2008), this annual number of DALYs gained through biofortification has 988
to be perceived as a theoretical number, rather than a real figure. 989
The potential introduction of folate biofortified rice in China increases the folate intake for 990
women of childbearing age to 1,120 µg per day, and saves annually 116,090 DALYs in the low and 991
257,345 DALYs in the high biofortification scenario. Regarding the functional outcomes, fatal 992
outcomes gain the largest number of DALYs, followed by spina bifida and encephalocele. While 993
the burden in the low biofortification scenario is still around 200,000 DALYs per year, the high 994
impact scenario reduces the annual number of DALYs lost to approximately 57,000. In other words, 995
63.05 % and 18.09 % of all NTDs caused by folate deficiency are still present after folate 996
biofortification in the low and high impact scenario, respectively. This is equal to the percentage of 997
women who did not switch to folate biofortified rice and, therefore, did not recovered from folate 998
deficiency. When focusing on the four Chinese regions, the highest number of DALYs saved is 999
obtained in Northeast China. Shanxi Province, characterized by one of the highest NTD prevalence 1000
rates in the world, benefits the most from the introduction of folate biofortified rice. The health 1001
impact in the northwest, southwest and southeast of China is significantly lower. 1002
According to the target group, newborns or their mothers, the health impact can be 1003
interpreted in two ways. First, the health benefits can be expressed in terms of DALYs saved, based 1004
on the reduced number of births affected with an NTD, due to their mothers biofortified diet. 1005
Second, based on the coverage rate of folate biofortified rice, the health impact can also be 1006
understood as the number of women of childbearing age, including mothers, recovering from folate 1007
deficiency. This “double” health impact is an important argument to underpin future 1008
communication strategies in order to tackle folate deficiency and its adverse health outcomes. 1009 1010
Nature Biotechnology, vol. 28, no. 6 DeSteur, H. et al.

28
Table 9 The health impact of folate biofortification of rice in China, low impact scenario, per functional outcome, 1011 expressed in the number of DALYs saved, per year, per region and administrative area 1012 1013 Region/
Administrative
area
Non-Fatal Fatal Total
Spina Enceph. Total (YLD) Abortions
Stillbirths Total (YLL)
NORTH 21,825 4,989 26,814 35,879 33,460 69,338 96,152
Northeast 16,865 3,547 20,412 27,266 25,428 52,694 73,105
Beijing 230 51 281 375 350 726 1,007
Tianjin 259 48 307 409 381 791 1,098
Hebei 2,745 677 3,422 4,586 4,277 8,863 12,285
Shanxi 4,205 892 5,097 6,810 6,351 13,160 18,257
Inner Mongolia 1,376 325 1,701 2,278 2,124 4,402 6,103
Liaoning 983 126 1,109 1,469 1,370 2,839 3,948
Jilin 592 54 646 852 794 1,646 2,292
Heilongjiang 605 133 737 986 919 1,905 2,642
Shandong 1,936 318 2,254 2,997 2,795 5,793 8,047
Henan 3,933 925 4,858 6,504 6,066 12,570 17,428
Northwest 4,960 1,442 6,402 8,613 8,032 16,645 23,047
Shaanxi 2,022 705 2,727 3,685 3,436 7,121 9,848
Gansu 1,685 312 1,997 2,661 2,482 5,143 7,140
Qinghai 216 58 275 369 344 713 988
Ningxia 356 55 411 546 510 1,056 1,467
Xinjiang 681 312 993 1,351 1,260 2,612 3,604
SOUTH 4,056 1,461 5,517 7,462 6,959 14,420 19,937
Southeast 3,018 1,097 4,115 5,567 5,191 10,758 14,873
Shanghai 21 9 30 41 39 80 110
Jiangsu 246 39 286 380 354 734 1,020
Zhejiang 278 29 307 406 379 785 1,093
Anhui 644 222 866 1,169 1,091 2,260 3,126
Fujian 172 121 293 404 377 781 1,075
Jiangxi 257 100 357 484 451 935 1,291
Hubei 209 116 325 445 415 861 1,186
Hunan 464 114 578 775 723 1,498 2,076
Guangdong 428 188 616 837 781 1,618 2,234
Guangxi 258 151 409 561 523 1,084 1,493
Hainan 41 7 48 63 59 123 170
Southwest 1,038 364 1,402 1,895 1,767 3,662 5,064
Sichuan 205 126 330 454 423 877 1,207
Guizhou 558 53 611 807 752 1,559 2,171
Yunnan 114 100 214 297 277 574 787
Tibet 35 0 35 46 43 89 124
Chongqing 126 86 211 291 272 563 775
CHINA 25,881 6,450 32,331 43,340 40,418 83,758 116,090 1014 DALYs, Disability-Adjusted Life Years; YLD, years lived in disability; YLL, years of life lost 1015 Note: These figures are determined by a low coverage rate of folate biofortified rice, i.e. 36.95 %. The coverage rate is the percentage of women who 1016 consume folate biofortified rice and recover from folate deficiency. It is also the percentage of NTDs caused by folate deficiency that can be 1017 prevented by a mother‟s biofortified diet. 1018 1019
1020
Nature Biotechnology, vol. 28, no. 6 DeSteur, H. et al.

29
Table 10 The health impact of folate biofortification of rice in China, high impact scenario, per functional outcome, 1021 expressed in the number of DALYs saved, per year, per region and administrative area 1022 1023 Region/
Administrative
area
Non-Fatal Fatal Total
Spina Enceph. Total (YLD) Abortions Stillbirths Total (YLL)
NORTH 48,382 11,060 59,441 79,535 74,173 153,707 213,149
Northeast 37,385 7,863 45,248 60,442 56,367 116,810 162,058
Beijing 511 112 623 832 776 1,609 2,231
Tianjin 575 105 681 907 846 1,752 2,433
Hebei 6,085 1,501 7,585 10,166 9,481 19,647 27,232
Shanxi 9,322 1,977 11,299 15,096 14,078 29,173 40,472
Inner Mongolia 3,051 720 3,771 5,049 4,709 9,758 13,529
Liaoning 2,179 279 2,458 3,257 3,037 6,294 8,752
Jilin 1,311 120 1,431 1,888 1,761 3,649 5,080
Heilongjiang 1,341 294 1,634 2,185 2,038 4,223 5,857
Shandong 4,291 706 4,997 6,645 6,197 12,841 17,838
Henan 8,720 2,050 10,769 14,418 13,446 27,864 38,633
Northwest 10,996 3,197 14,193 19,092 17,805 36,897 51,090
Shaanxi 4,483 1,562 6,045 8,168 7,618 15,786 21,831
Gansu 3,735 692 4,427 5,899 5,501 11,401 15,827
Qinghai 480 129 609 818 763 1,581 2,190
Ningxia 789 123 912 1,211 1,130 2,341 3,252
Xinjiang 1,510 691 2,200 2,996 2,794 5,789 7,989
SOUTH 8,992 3,238 12,230 16,541 15,426 31,966 44,197
Southeast 6,691 2,431 9,122 12,340 11,508 23,848 32,971
Shanghai 47 21 67 92 86 177 245
Jiangsu 546 87 633 842 785 1,627 2,260
Zhejiang 617 65 681 901 840 1,740 2,422
Anhui 1,427 492 1,919 2,592 2,417 5,010 6,929
Fujian 382 268 650 896 836 1,732 2,382
Jiangxi 569 222 791 1,072 1,000 2,072 2,863
Hubei 463 258 721 987 921 1,908 2,628
Hunan 1,029 253 1,282 1,718 1,602 3,321 4,603
Guangdong 949 416 1,365 1,856 1,731 3,588 4,953
Guangxi 572 334 906 1,243 1,159 2,402 3,309
Hainan 90 16 106 141 131 272 377
Southwest 2,301 807 3,108 4,201 3,917 8,118 11,226
Sichuan 454 279 732 1,006 938 1,944 2,676
Guizhou 1,238 117 1,355 1,789 1,668 3,456 4,812
Yunnan 252 221 474 658 614 1,272 1,745
Tibet 78 0 78 102 95 197 276
Chongqing 279 190 469 646 603 1,249 1,717
CHINA 57,373 14,298 71,671 96,076 89,598 185,674 257,345 1024 DALYs, Disability-Adjusted Life Years; YLD, years lived in disability;YLL, years of life lost 1025 Note: These figures are determined by a high coverage rate of folate biofortified rice, i.e. 81.91 %. The coverage rate is the percentage of women who 1026 consume folate biofortified rice and recover from folate deficiency. It is also the percentage of NTDs caused by folate deficiency that can be 1027 prevented by a mother‟s biofortified diet. 1028 1029
1030
Nature Biotechnology, vol. 28, no. 6 DeSteur, H. et al.

30
As the health benefits of folate biofortified rice depend on demographic characteristics, such 1031
as population number and birth rate, a comparison of the regional results should be carefully 1032
analyzed. One way to overcome this, is to standardize the regional saved DALYs (Table 11). When 1033
the number of DALYs are expressed per 10,000 persons, the burden and health impact is relatively 1034
the highest in the Northwest China, while the absolute numbers are the highest in the Northeast. The 1035
current situation is most problematic in Shanxi (northeast), Gansu (northwest), Anhui (southeast) 1036
and Guizhou (southwest). 1037
1038 Table 11 Burden of folate deficiency (DALYs lost) and the health impact of folate biofortification (DALYs saved) in 1039 China, expressed in the total number of DALYs and per 10,000 persons, per year, per region and administrative area 1040 1041 Region/
Administrative
area
Current burden
(DALYs lost)
Folate biofortication
(DALYs saved)
Low impact High impact
Total
Per 10,000
persons
Total
Per 10,000
persons
Total
Per 10,000
persons
NORTH 260,223 4.68 96,152 1.73 213,149 3.83
Northeast 197,849 4.31 73,105 1.59 162,058 3.53
Beijing 2,724 1.68 1,007 0.62 2,231 1.38
Tianjin 2,970 2.70 1,098 1.00 2,433 2.21
Hebei 33,246 4.71 12,285 1.74 27,232 3.86
Shanxi 49,411 14.31 18,257 5.29 40,472 11.72
Inner Mongolia 16,517 6.74 6,103 2.49 13,529 5.52
Liaoning 10,685 2.45 3,948 0.90 8,752 2.00
Jilin 6,202 2.23 2,292 0.82 5,080 1.82
Heilongjiang 7,151 1.83 2,642 0.68 5,857 1.50
Shandong 21,777 2.29 8,047 0.85 17,838 1.87
Henan 47,165 4.91 17,428 1.81 38,633 4.02
Northwest 62,374 6.39 23,047 2.36 51,090 5.23
Shaanxi 26,652 6.98 9,848 2.58 21,831 5.71
Gansu 19,323 7.25 7,140 2.68 15,827 5.94
Qinghai 2,674 4.77 988 1.76 2,190 3.91
Ningxia 3,971 6.43 1,467 2.37 3,252 5.26
Xinjiang 9,754 4.65 3,604 1.72 7,989 3.81
SOUTH 53,957 0.71 19,937 0.26 44,197 0.58
Southeast 40,252 0.71 14,873 0.26 32,971 0.58
Shanghai 299 0.16 110 0.06 245 0.13
Jiangsu 2,759 0.36 1,020 0.13 2,260 0.29
Zhejiang 2,957 0.58 1,093 0.21 2,422 0.48
Anhui 8,459 1.35 3,126 0.50 6,929 1.11
Fujian 2,908 0.80 1,075 0.30 2,382 0.65
Jiangxi 3,495 0.79 1,291 0.29 2,863 0.65
Hubei 3,209 0.55 1,186 0.20 2,628 0.45
Hunan 5,619 0.87 2,076 0.32 4,603 0.71
Guangdong 6,047 0.64 2,234 0.23 4,953 0.52
Guangxi 4,040 0.84 1,493 0.31 3,309 0.69
Hainan 461 0.54 170 0.20 377 0.44
Southwest 13,705 0.69 5,064 0.25 11,226 0.56
Sichuan 3,267 0.39 1,207 0.14 2,676 0.32
Guizhou 5,874 1.53 2,171 0.56 4,812 1.25
Yunnan 2,131 0.46 787 0.17 1,745 0.38
Tibet 337 1.17 124 0.43 276 0.96
Chongqing 2,097 0.73 775 0.27 1,717 0.60
CHINA 314,180 2.38 116,090 0.88 257,345 1.95 DALYs, Disability-Adjusted Life Years 1042 1043
Nature Biotechnology, vol. 28, no. 6 DeSteur, H. et al.

31
6.4. Comparison of health impact studies with respect to biofortified staple crops 1044
1045
By expressing the number of DALYs gained per 10 000 persons, the potential health impact 1046
of folate biofortified rice in China can be compared with results from other health impact studies 1047
that applied the DALY approach. Table 12 presents the estimated potential health impact of 1048
introducing different transgenic and non-transgenic biofortified staple crops in several developing 1049
countries. 1050
In comparison with the burden of micronutrient deficiencies in other health impact studies, 1051
the burden of folate deficiency in this study is relatively the lowest. However, as only NTDs caused 1052
by folate deficiency are included as functional outcomes, only a part of this burden is calculated in 1053
this study. If other functional outcomes would be included, such as heart diseases, the target group 1054
would be extended to the total population. Given the estimated total number of folate deficient 1055
people in China, 258 million, the actual burden of folate deficiency would be much higher. 1056
With respect to the health impact, most of the DALYs are saved through the introduction of 1057
Vitamin A biofortification in Uganda (sweet potato) and Congo (cassava roots). The relative impact 1058
of iron or zinc biofortification on public health is the highest in India and Pakistan, and North-East 1059
Brazil (iron) and Bangladesh (zinc). While the burden of our folate biofortified rice in China is 1060
relatively low, this intervention obtains relatively one of the highest number of DALYs. This is 1061
mainly due to the high folate intake levels after biofortification (see section 6.1.) and the 1062
assumption that these intake levels prevent maternal folate deficiency and the risk of having a baby 1063
with an NTD (see section 6.2). 1064
Although this comparison is useful to place folate biofortification in the context of other 1065
biofortified interventions to tackle micronutrient deficiencies in developing countries, these findings 1066
should be interpreted with caution. First, the parameters of the DALY framework and the 1067
characteristics of the impact scenarios differ from one study to another. Second, as there is currently 1068
no biofortified staple crop commercialized, regardless of the technique that has been used, the 1069
expected micronutrient content after biofortification is mostly based on estimates from plant 1070
breeders. This is, for instance, the case in the HarvestPlus health impact analyses 1071
(http://www.harvestplus.org) of Meenakshi et al22
. 1072
1073
1074
1075
Nature Biotechnology, vol. 28, no. 6 DeSteur, H. et al.

32
Table 12 Comparison of the burden of micronutrient deficiencies (DALYs lost) and the health impact of potential 1076 biofortified staple crops (DALYs saved), per crop, nutrient, and country, in DALYs lost/saved per 10,000 persons and 1077 in % reduction of the burden 1078 1079
Crop Nutrient Technique Target country
Burden of
deficiencies
Health impact
Pessimistic Optimistic
Relative % Relative %
Rice Vitamin A T Indiab 20.52 1.80 8.8 12.19 59.4
Philippinesc 32.06 1.82 5.7 10.11 31.5
Iron C Bangladesha 34.36 2.75 8.0 0.91 2.6
Indiaa 35.27 1.76 5.0 7.22 20.5
Indiae 35.27 4.41 12.5 5.29 15.0
Philippinesa 8.31 0.33 4.0 12.19 146.7
Zinc C Bangladesha 30.86 5.25 17.0 10.18 33.0
Indiaa 24.96 4.99 20.0 13.98 56.0
Philippinesa 9.50 1.23 12.9 4.08 42.9
Folate T Chinaf 2.38 0.88 37.0 1.95 81.9
Shanxi Provincef 14.31 5.29 37.0 11.72 81.9
Wheat Iron C Indiae 35.27 2.65 7.0 13.76 39.0
C Indiaa 35.27 2.47 37.0 13.23 375.0
Pakistana 57.65 3.46 7.5 8.82 15.3
Zinc C Indiaa 24.96 2.25 6.0 11.98 48.0
Pakistana 40.11 2.01 9.0 13.24 33.0
Maize Vitamin A C Ethiopiaa 52.76 0.53 5.0 8.97 17.0
Kenyaa 32.27 2.58 1.0 10.33 32.0
Cassava
roots
Vitamin A C Congoa 1206.93 36.21 8.0 386.22 32.0
Nigeriad 100.26 7.05 3.0 21.11 21.1
Nigeriaa 57.14 1.71 7.0 16.00 28.0
North-East Brazila 10.00 0.40 3.0 1.90 19.0
Beans Iron C Hondurasa 57.65 1.06 4.0 16.14 28.0
Nicaraguaa 53.61 1.61 1.8 5.84 10.9
North-East Brazila 40.00 3.60 3.0 8.58 21.5
Zinc C Hondurasa 13.27 0.40 9.0 1.99 15.0
Nicaraguaa 17.87 0.36 3.0 1.97 11.0
North-East Brazila 20.00 1.00 2.0 4.00 20.0
Sweet potato Vitamin A C Ugandaa 56.64 21.52 5.0 36.25 64.0
DALYs, Disability-Adjusted Life Years; T, biofortification using transgenic methods; C, biofortification using conventional methods 1080 a
Own calculations, based on Meenakshi et al22 1081 b
Own calculations, based on Stein et al25 1082 c
Own calculations, based on Zimmermann & Qaim26 1083 d
Own calculations, based on Manyong27 1084 e
Own calculations, based on Stein et al28 1085 f These figures are based on Table 11, column 5 (burden), 7 (pessimistic) and 9 (optimistic) 1086
1087
1088
7. Conclusions 1089
1090
This paper evaluates the potential health benefits of a biofortified staple crop, namely rice 1091
with a high folate content, in China. By means of the Disability-Adjusted Life Years approach, the 1092
health impact on folate deficiency is measured in terms of the number of DALYs lost. As China is 1093
the world leader in rice consumption and production, and a key player in the research field of 1094
genetically modification of rice, China was selected as the study location. Due to the specific 1095
differences in terms of NTD prevalence, rice consumption and current folate intake, this health 1096
impact analysis is conducted at regional and administrative divisional level. 1097
Application of the DALY method reveals that the current burden of folate deficiency 1098
amounts to an annual loss of 314,180 DALYs. The introduction of rice with a folate content of 1099
1,200 µg per 100 g rice in China would save 116,090 DALYs in the low impact scenario and 1100
257,345 DALYs in the high impact scenario. The burden and the health impact are the highest in 1101
Nature Biotechnology, vol. 28, no. 6 DeSteur, H. et al.

33
Northern China, in absolute (northeast) as well as relative numbers (northwest). The region with the 1102
highest NTD prevalence rate, Shanxi Province, will benefit the most from folate biofortification. 1103
The regional health benefits in China are based on average daily folate intakes between 1104
545 µg and 1,941 µg per woman of childbearing age, which are significantly higher than the 1105
recommended folate intake of 400 µg. Although these numbers refer to averages, the high folate 1106
intake level in China demonstrates that folate biofortification of rice can be a valuable means to 1107
reduce folate deficiency and neural-tube defects. Especially in poor, rural regions where other folate 1108
interventions are less feasible the introduction of folate enriched rice could be important. Even in 1109
the northern regions, where wheat is more popular than rice, folate biofortification of rice could 1110
contribute to achieve the recommended folate dose. 1111
The DALY framework is a popular method to analyze the health impact of implementing 1112
biofortified staple crops. As this is the first attempt to measure the health benefits of folate 1113
biofortification, some recommendations can be made to further improve the research results. First, 1114
collecting primary or fine tune secondary data would significantly benefit this health impact study. 1115
While some parameters of the DALY framework have to be further explored (e.g. a stable folate 1116
content of folate enriched rice and the exact degree of bioavailability), others need to be adapted 1117
according to the study location (e.g. the current folate intake and the contribution level of folate 1118
deficiency to NTDs, per administrative area) or the target group (e.g. rice consumption of women of 1119
childbearing age). Second, to be able to calculate all health benefits of folate biofortified rice, 1120
additional research is required to define the contribution of folate deficiency to each of its 1121
functional outcomes. 1122
However, before folate biofortified rice can be approved, it still needs to be figured out how 1123
it will be introduced in China. The price, the availability, the accessibility and the dissemination of 1124
folate biofortified rice, labeling and other legislation requirements, the selection of the transgenic 1125
line and the rice variety (e.g. multi-biofortification) and product attributes will influence consumer 1126
and farmer acceptance. Thus, public acceptance will be a crucial determinant of the approval and 1127
the success of folate biofortified rice. Therefore, to further increase the health impact of folate 1128
biofortified rice in China, once commercialization is approved, communication strategies should 1129
focus on the coverage rate of folate biofortified rice. The higher the coverage rate, the more women 1130
recover from folate deficiency, by which more NTDs will be prevented. 1131
Building upon the investigated (regional) health impact, future research should focus on 1132
analyzing the cost-effectiveness of folate biofortified rice in China. This can be done by juxtaposing 1133
the costs of biofortification and the calculated health benefits. Another research topic is to involve 1134
and compare different strategies to improve folate intake. As awareness and use of folic acid pills in 1135
China is often low, especially in rural regions, and altering dietary habits is less feasible in poor, 1136
rural regions, folate biofortified rice has to be considered as a complementary means to combat 1137
folate deficiency. Although folate biofortification has particular advantages due to its pro-poor and 1138
pro-rural approach, a combination of policy interventions will be probably the most feasible and 1139
effective method to tackle folate deficiency in all sections of the population. 1140
Nature Biotechnology, vol. 28, no. 6 DeSteur, H. et al.

34
References 1141 1142 1 Storozhenko S et al. Folate fortification of rice by metabolic engineering. Nat Biotechnol. 1143
2007 25: 1277-9. 1144
2 Molloy A, Scott J. Folates and prevention of disease. Public Health Nutr. 2001 4: 601-9. 1145
3 MRC Vitamin Study Research Group. Prevention of neural tube defects: results of the 1146
Medical Research Council Vitamin Study. Lancet. 1991 338: 131-7. 1147
4 Stockley L, Lund V. Use of folic acid supplements, particularly by low-income and young 1148
women: a series of systematic reviews to inform public health policy in the UK. Public Health Nutr. 1149
2008 11: 807-21. 1150
5 Lumley J, Watson L, Watson M, Bower C. Periconceptional supplementation with folate 1151
and/or multivitamins for preventing neural tube defects. Cochrane Database Syst Rev. 2001: Issue 1152
3, CD001056. . 1153
6 De Steur H et al. Willingness to Accept and Purchase Genetically Modified Rice with High 1154
Folate Content in Shanxi Province, China. Appetite. 2010 54: 118-25. 1155
7 Gu X et al. High Prevalence of NTDs in Shanxi Province: A Combined Epidemiological 1156
Approach. Birth Defects Res A Clin Mol Teratol. 2007 79: 702-7. 1157
8 Li Z, Ren A, Zhang L, Guo Z, Li Z. A population-based case-control study of risk factors 1158
for neural tube defects in four high-prevalence areas of Shanxi province, China. Paediatr Perinat 1159
Epidemiol. 2006 20: 43-53. 1160
9 Dai L et al. Dynamic monitoring of neural tube defects in China during 1996 to 2000 1161
(Article in Chinese). Zhonghua Yu Fang Yi Xue Za Zhi. 2002 36: 402-5. 1162
10 Li Z, Ren A, Zhang L, Liu J, Li Z. Periconceptional use of folic acid in Shanxi Province of 1163
northern China. Public Health Nutr. 2007 10: 471-6. 1164
11 Ren A et al. Awareness and use of folic acid, and blood folate concentrations among 1165
pregnant women in northern China - An area with a high prevalence of neural tube defects. Reprod 1166
Toxicol. 2006 22: 431-6. 1167
12 Ren A et al. Comparison of blood folate levels among pregnant Chinese women in areas 1168
with high and low prevalence of neural tube defects. Public Health Nutr. 2007 10: 762-8. 1169
13 Zhang B et al. Correlation Between Birth Defects and Dietary Nutrition Status in a High 1170
Incidence Area of China. Biomed Environ Sci. 2008 21: 37-44. 1171
14 Jia H, Jayaraman K, Louët S. China ramps up efforts to commercialize GM rice. Nat 1172
Biotechnol. 2004 22: 642. 1173
15 Wang Y, Johnston S. The status of GM rice R&D in China. Nat Biotechnol. 2007 25: 717-8. 1174
16 Shuping N, Miles T. Top rice producer China approves GMO strain. Reuters. 2009-11-27, 1175
2009. 1176
17 Zhao Y et al. Plasma folate status and dietary folate intake among Chinese women of 1177
childbearing age. Matern Child Nutr. 2009 5: 104-16. 1178
18 Murray C, Lopez A. The Global Burden of Disease. Cambridge: Harvard University, 1996. 1179
19 Anand S, Hanson K. DALYs: Efficiency versus equity. World Dev. 1998 26: 307-10. 1180
20 Lyttkens C. Time to disable DALYs? On the use of disability-adjusted life years in health 1181
policy. Eur J Health Econ. 2003 4: 195-202. 1182
21 Horton S. The Economics of Food Fortification. J Nutr. 2006 136: 1068-71. 1183
22 Meenakshi J et al. How cost-effective is biofortification in combating micronutrient 1184
malnutrition? An ex-ante assessment. HarvestPlus Working Paper No. 2. Washington, D.C.: 1185
International Food Policy Research Institute, 2007. 1186
23 Stein A et al. Analyzing the Health Benefits of Biofortified Staple Crops by Means of the 1187
Disability-Adjusted Life Years Approach: a Handbook Focusing on Iron, Zinc and Vitamin A. 1188
HarvestPlus Technical Monograph 4. Washington, D.C.: International Food Policy Research 1189
Institute, 2005. 1190
24 Fan Y, Wan J, Lei X. Progress of HarvestPlus China Program. J Agr Sci Technol. 2009 11: 1191
1-6. 1192
Nature Biotechnology, vol. 28, no. 6 DeSteur, H. et al.
35
25 Stein A, Sachdev H, Qaim M. Potential impact and cost-effectiveness of Golden Rice. Nat 1193
Biotechnol. 2006 24: 1200-1. 1194
26 Zimmermann R, Qaim M. Potential Health Benefits of Golden Rice: a Philippine Case 1195
Study. Food Policy. 2004 29: 147-68. 1196
27 Manyong V. Ex-Ante Evaluation of Nutrition and Health Benefits of Biofortified Cassava 1197
Roots in Nigeria: The Dalys Approach. Proceedings of the Inaugural Symposium. Nairobi, Kenya, 1198
2004 1199
28 Stein A et al. Potential impacts of iron biofortification in India. Soc Sci Med. 2008 66: 1797-1200
808. 1201
29 Ma G et al. Iron and zinc deficiencies in China: what is a feasible and cost-effective 1202
strategy? Public Health Nutr. 2007 11: 632-8. 1203
30 WHO. Standards for Maternal and Neonatal Care. Iron and folate supplementation. 1204
Geneva: World Health Organization, 2006. 1205
31 USFDA. Food labeling: Health Claims and Label Statements; Folate and Neural Tube 1206
Defects. Final Rule. Fed Regist. 1996 61: 8752-81. 1207
32 Geisel J. Folic acid and neural tube defects in pregnancy - A review. J Perinat Neonatal 1208
Nurs. 2003 17: 268-79. 1209
33 Blancquaert D et al. Folates and folic acid: from fundamental research towards sustainable 1210
health. Crit Rev Plant Sci. 2008 29: 14-35. 1211
34 Rader J, Schneeman B. Prevalence of neural tube defects, folate status, and folate 1212
fortification of enriched cereal-grain products in the United States. PEDIATRICS. 2006 117: 1394-1213
9. 1214
35 US Department of Agriculture. Agricultural Research Service. USDA National Nutrient 1215
Database for Standard Reference, release 21. ed, 2008. 1216
36 Tam C et al. Periconceptional Folic Acid Supplementation: A New Indication for 1217
Therapeutic Drug Monitoring. Ther Drug Monit. 2009 31: 319-26. 1218
37 Wright A, Dainty J, Finglas P. Folic acid metabolism in human subjects revisited: potential 1219
implications for proposed mandatory folic acid fortification in the UK Br J Nutr. 2007 98: 667-75. 1220
38 Mills J et al. Low vitamin B-12 concentrations in patients without anemia: the effect of folic 1221
acid of grain. Am J Clin Nutr. 2003 77: 1474-7. 1222
39 Rogovik A, Vohra S, Goldman R. Safety Considerations and Potential Interactions of 1223
Vitamins: Should Vitamins Be Considered Drugs? Ann Pharmacother. 2010 44: 311-24. 1224
40 EUROCAT. EUROCAT Special Report: Prevention of Neural Tube Defects by 1225
Periconceptional Folic Acid Supplementation in Europe, 2nd Edition: EUROCAT Central Registry, 1226
University of Ulster, 2005. 1227
41 Finglas P et al. Research goals for folate and related B vitamin in Europe. Eur J Clin Nutr. 1228
2006 60: 287-94. 1229
42 Mclean E, Benoist B, Allen L. Review of the magnitude of folate and vitamin B12 1230
deficiencies worldwide. Food Nutr Bull. 2008 29: S38-51. 1231
43 Selhub J, Jacques P, Dallal G, Choumenkovitch S, Rogers G. The use of blood 1232
concentrations of vitamins and their respective functional indicators to define folate and vitamin 1233
B12 status. Food Nutr Bull. 2008 29: S67-73. 1234
44 De Benoist B. Conclusions of a WHO Technical Consultation on folate and vitamin B12 1235
deficiencies. Food Nutr Bull. 2008 29: S238-44. 1236
45 Hao L et al. Geographical, Seasonal and Gender Differences in Folate Status among Chinese 1237
Adults. J Nutr. 2003 133: 3630-5. 1238
46 Shrubsole M et al. Dietary folate intake and breast cancer risk: results from the Shanghai 1239
Breast Cancer Study. Cancer Res. 2001 61: 7136-41. 1240
47 Li Z et al. Difference in prevalence and seasonal variations of folate deficiencies among pre-1241
marital women from high and low risk areas of neural tube defects (in Chinese). Zhongguo 1242
Yousheng Youyu Zazhi. 1996 1: 1-4. 1243
Nature Biotechnology, vol. 28, no. 6 DeSteur, H. et al.

36
48 Ronnenberg A, Goldman M, Aitken I, Xu X. Anemia and Deficiencies of Folate and 1244
Vitamin B-6 Are Common and Vary with Season in Chinese Women of Childbearing Age. J Nutr. 1245
2000 130: 2703-10. 1246
49 Zhang L et al. Folate concentrations and folic acid supplementation among women in their 1247
first trimester of pregnancy in a rural area with a high prevalence of neural tube defects in Shanxi, 1248
China. Birth Defects Res A Clin Mol Teratol. 2006 76: 461-6. 1249
50 Gao X et al. Dietary pattern is associated with homocysteine and B vitamin status in an 1250
urban Chinese population. J Nutr. 2003 133: 3636-42. 1251
51 Cherian A, Seena S, Bullock R, Antony A. Incidence of neural tube defects in the least-1252
developed area of India: a population-based study. Lancet. 2005 366: 930-1. 1253
52 Moore C et al. Elevated rates of severe neural tube defects in a high-prevalence area in 1254
northern China. Am J Med Genet. 1997 73: 113-8. 1255
53 Xiao K. The epidemiology of neural tube defects in China. Zhonghua Yi Xue Za Zhi. 1989 1256
69: 189-91. 1257
54 Shi-an Y, Mason J, Mathys E, Deitchler M. The status of micronutrients and the efficiency 1258
of intervention in China. Food Nutr Bull. 2004 25: 81-2. 1259
55 Jingxiong J, Toschke A, Kries VR, Koletzko B, Liangming L. Vitamin A status among 1260
children in China. Public Health Nutr. 2006 9: 955-60. 1261
56 UNICEF and The Micronutrient Initiative. Vitamin and Mineral Deficiency: A Damage 1262
Assessment Report for China. New York, NY, USA: UNICEF, 2004. 1263
57 UN. 5th report on the world nutrition situation. Geneva: UN SCN, 2004. 1264
58 Pinar T, Tatevosyants N, Singer D. Central Nervous System Malformations in a 1265
Perinatal/Neonatal Autopsy Series. Pediatr Dev Pathol. 1998 1: 42-8. 1266
59 Daly S et al. Minimum effective dose of folic acid for food fortification to prevent neural-1267
tube defects. Lancet. 1997 350: 1666-9. 1268
60 De Wals P et al. Reduction in Neural-Tube Defects after folic acid fortification in Canada. N 1269
Engl J Med. 2007 357: 135-42. 1270
61 Moore L, Bradlee M, Singer M, Rothman K, Milunsky A. Folate intake and the risk of 1271
Neural Tube Defects: An estimation of Dose-Response. Epidemiology. 2003 14: 200-2005. 1272
62 Christianson A, Howson C, Modell B. March of Dimes. Global Report on Birth Defects 1273
White Plains, New York: March of Dimes Birth Defects Foundation, 2006. 1274
63 UNICEF and The Micronutrient Initiative. Vitamin and Mineral Deficiency: A Global 1275
Damage Assessment Report. New York, NY, USA: UNICEF, 2004. 1276
64 Kondo A, Kamihira O, Ozawa H. Neural tube defects: Prevalence, etiology and prevention. 1277
Int J Urol. 2009 16: 49-57. 1278
65 Busby A. Preventing neural tube defects in Europe: population based study. Br Med J. 2005 1279
330: 574-5. 1280
66 Mathews T. Trends in Spina Bifida and Anencephalus in the United States, 1991-2005. 1281
Hyattsville, MD: National Center for Health Statistics, 2007. 1282
67 National Bureau of Statistics of China. China Statistical Yearbook 2008. Beijing: China 1283
Statistics Press, 2008. 1284
68 WHO. Definitions and Indicators in Family Planning, Maternal and Child Health and 1285
Reproductive Health. Geneva: WHO, 2001. 1286
69 U.S. Department of Health and Human Services PHS, Centers for Disease Control. The Risk 1287
Approach in Perinatal Health. Shunyi County, People’s Republic of China. Washington, DC: 1288
Government Printing Office, 1989. 1289
70 Sever L. Looking for causes of neural tube defects: where does the environment fit in? 1290
Environ Health Perspect. 1995 103: 165-71. 1291
71 Todoroff K, Shaw G. Prior spontaneous abortion, prior elective termination, interpregnancy 1292
interval, and risk of neural tube defects. Am J Epidemiol. 2000 151: 505-11. 1293
72 Berry R et al. Prevention of Neural-Tube Defects with folic acid in China. N Engl J Med. 1294
1999 341: 1485-91. 1295
Nature Biotechnology, vol. 28, no. 6 DeSteur, H. et al.

37
73 Chen G et al. Prevention of NTDs with Periconceptional Multivitamin Supplementation 1296
Containing Folic Acid in China. Birth Defects Res A Clin Mol Teratol. 2008 82: 592-6. 1297
74 Access Economics. Cost benefit analysis of fortifying the food supply with folic acid. Report 1298
for Food Standards Australia New Zealand. Melbourne: Access Economics, 2006. 1299
75 Mathers C, Vos T, Stevenson C. The burden of disease and injury in Australia. AIHW cat. 1300
no. PHE 17. Canberra: AIHW, 1999. 1301
76 Czernichow S et al. Case for folic acid and vitamin B12 fortification in Europe. Semin Vasc 1302
Med. 2005 5: 156-62. 1303
77 Cornel M, De Smit D, De Jong-Van Den Berg L. Folic acid - the scientific debate as a base 1304
for public health policy. Reprod Toxicol. 2005 20: 411-5. 1305
78 Cordero J, Do A, Berry R. Review of interventions for the prevention and control of folate 1306
and vitamin B12 deficiencies. Food Nutr Bull. 2008 29: S188-95. 1307
79 Cavalli-Sforza T, Berger J, Smitasiri S, Viteri F. Weekly iron-folic acid supplementation of 1308
women of reproductive age: Impact overview, lessons learned, expansion plans, and contributions 1309
toward achievement of the millennium development goals. Nutr Rev. 2005 63: S152-8. 1310
80 Campos-Bowers M, Wittenmyer B. Biofortification in China: policy and practice. Health 1311
Res Policy Sys. 2007 5: 1-7. 1312
81 Centers for Disease Control and Prevention. Use of dietary supplements containing folic 1313
acid among women of childbearing age - United States, 2005. MMWR Morb Mortal Wkly Rep. 2005 1314
54: 955-8. 1315
82 Van Der Pal-De Bruin K et al. Influence of educational level on determinants of folic acid 1316
use. Paediatr Perinat Epidemiol. 2003 17: 256-63. 1317
83 Lawrence M et al. Design and evaluation of interventions promoting periconceptional 1318
multivitamin use. Am J Prev Med. 2003 25: 17-24. 1319
84 Chinese Ministry of Health. National Action Plan for Reducing Birth Defects and 1320
Disabilities in China for 2002-2010. Beijing: Ministry of Health of the People‟s Republic of China, 1321
2001. 1322
85 Juan S. Program to help lower birth defects, China Daily. 2009-06-18. 1323
86 Li Z, Hao L. National Neural Tube Defects Prevention Program in China. Food Nutr Bull. 1324
2008 29: S196-204. 1325
87 Underwood B. Overcoming micronutrient deficiencies in developing countries: Is there a 1326
role for agriculture? Food Nutr Bull. 2000 21: 356-60. 1327
88 Chen L, Rivera M. The Costa Rican experience: Reduction of neural tube defects following 1328
food fortification programs. Nutr Rev. 2004 62: S40-3. 1329
89 Choumenkovitch S et al. Folic acid intake from fortification in United States exceeds 1330
predictions. J Nutr. 2002 132: 2792-8. 1331
90 Hertrampf E et al. Consumption of folic acid-fortified bread improves folate status in 1332
women of reproductive age in Chile. J Nutr. 2003 133: 3166-9. 1333
91 Centers for Disease Control and Prevention. Spina bifida and anencephaly before and after 1334
folic acid mandate. United States, 1995-1996 and 1999-2000. MMWR Morb Mortal Wkly Rep. 2004 1335
53: 362-5. 1336
92 SACN (Scientific Advisory Committee on Nutrition). Folate and Disease Prevention. 1337
London: TSO, 2005. 1338
93 FFI (Flour Fortification Initiative). Overview of Progress Toward Fortification. China. 1339
Executive Summary. Atlanta, GA: FFI, 2009. 1340
94 Lawrence M et al. Examination of selected national policies towards mandatory folic acid 1341
fortification. Nutr Rev. 2009 67: S73-S8. 1342
95 WHO et al. Recommendations on wheat and maize flour fortification. Meeting Report: 1343
Interim Consensus Statement. Geneva: World Health Organization, 2009. 1344
96 Ruel M. Can food-based strategies help reduce vitamin A and iron deficiencies? A review of 1345
recent evidence. Food Policy Review No. 5. Washington D.C.: International Food Policy Research 1346
Institute, 2001. 1347
Nature Biotechnology, vol. 28, no. 6 DeSteur, H. et al.
38
97 Koebnick C, Heins U, Hoffmann I, Dagnelie P, Leitzmann C. Folate status during 1348
pregnancy in women is improved by long-term high vegetable intake compared with the average 1349
western diet. J Nutr. 2001 131: 733-9. 1350
98 Cuskelly G, McNulty H, Scott J. Effect of increasing dietary folate on red-cell folate: 1351
implications for prevention of neural tube defects. Lancet. 1996 347: 657-9. 1352
99 Qaim M, Stein A, Meenakshi J. Economics of biofortification. 26th International 1353
Association of Agricultural Economists (IAAE) Conference. Gold Coast, Australia, 2006 1354
100 Beyer P et al. Golden Rice: introducing the β-carotene biosynthesis pathway into rice 1355
endosperm by genetic engineering. J Nutr. 2002 132: S506-10. 1356
101 McIntosh S, Brushett D, Henry R. GTP cyclohydrolase 1 expression and folate 1357
accumulation in the developing wheat seed. J Cereal Sci. 2008 48: 503-12. 1358
102 Bekaert S et al. Folate biofortification in food plants. Trends Plant Sci. 2008 13: 28-35. 1359
103 US Department of Agriculture Agricultural Research Service. USDA National Nutrient 1360
Database for Standard Reference, release 21. ed, 2009. 1361
104 Bouis H. Plant breeding: a new tool for fighting micronutrient malnutrition. J Nutr. 2002 1362
132: S491-4. 1363
105 Rébeillé F et al. Folates in plants: biosynthesis, distribution, and enhancement Physiologia 1364
Plantarum. 2006 126: 330-42. 1365
106 Scott J, Rébeillé F, Fletcher J. Folic acid and folate: the feasibility for nutritional 1366
enhancement in plant foods. J Sci Food Agric. 2000 80: 795-824. 1367
107 Bailey L. Folate and Vitamin B12 Recommended intakes and status in the United States. 1368
Nutr Rev. 2004 62: 14-20. 1369
108 FSAI. Report of the national committee on folic acid food fortification. Dublin: FSAI, 2006. 1370
109 De Groote H, Kimenju S. Comparing consumer preferences for color and nutritional quality 1371
in maize: Application of a semi-double-bound logistic model on urban consumers in Kenya. Food 1372
Policy. 2008 33: 362-70. 1373
110 Stevens R, Winter-Nelson A. Consumer acceptance of provitamin A-biofortified maize in 1374
Maputo, Mozambique. Food Policy. 2008 33: 341-51. 1375
111 Achanta K, Boeneke C, Aryana K. Characteristics of Reduced Fat Milks As Influenced By 1376
the Incorporation of Folic Acid. J Dairy Sci. 2007 90: 90-8. 1377
112 Pray C, Huang J. Biofortification for China: Political Responses to Food Fortification and 1378
GM Technology, Interest Groups, and Possible Strategies. AgBioForum. 2007 10: 161-9. 1379
113 Bouis H, McClafferty B. The Biofortification Challenge Program. 2007 Annual Report for 1380
the Executive Council of the CGIAR. Washington, D.C.: HarvestPlus, 2008. 1381
114 James C. China Approves Biotech Rice and Maize in Landmark Decision, ISAAA Crop 1382
Biotech Update. 2009. 1383
115 Engel K-H, Frenzel T, Miller A. Current and future benefits from the use of GM technology 1384
in food production. Toxicol Lett. 2002 127: 329-36. 1385
116 Juma C, Paarlberg R, Pray C. Patterns of political support and pathways to final impact. 1386
AgBioForum. 2007 10: 201-7. 1387
117 CNGOIC. Food Grains Weekly Report. Newsletter, various issues. Beijing: CNGOIC, 2009. 1388
118 Dexter P. Rice fortification for developing countries. Fayetteville: University of Arkansas, 1389
1998. 1390
119 CNGOIC. Monthly Report on Food Grains Supply and Demand Situation, no. 114. Beijing: 1391
CNGOIC, 2009. 1392
120 Ho P, Vermeer E, Zhao J. Biotechnology and food safety in China: consumer's acceptance 1393
or resistance? Dev Change. 2006 37: 227-54. 1394
121 Huang J, Qiu H, Bai J, Pray C. Awareness, acceptance of and willingness to buy genetically 1395
modified foods in Urban China. Appetite. 2006 46: 144-51. 1396
122 Li Q, Curtis K, McCluskey J, Wahl T. Consumer attitudes toward genetically modified 1397
foods in Beijing, China. AgBioForum. 2002 5: 145-52. 1398
Nature Biotechnology, vol. 28, no. 6 DeSteur, H. et al.

39
123 Lin W, Somwaru A, Tuan F, Huang J, Bai J. Consumer attitudes toward biotech foods in 1399
China. J Int Food Agribus Mark. 2006 18: 177-203. 1400 1401 1402
List of Tables 1403 1404 Table 1 Folate deficiency in China. Percentage of folate deficient men and women (of childbearing 1405
age), and the estimated population affected by folate deficiency in China, per region ....................... 8 1406
Table 2 Estimations of the main micronutritional deficiencies in China ............................................. 9 1407
Table 3 Demographic profile of China, total population, birth rate, total births and life expectancy at 1408
birth, and NTD prevalence rates per functional outcome, per administrative area and region ......... 11 1409
Table 4 Neural-tube defects in China, per functional outcome, per administrative area and region . 12 1410
Table 5 Neural-tube defects caused by folate deficiency in China, per functional outcome, per 1411
administrative area and region ........................................................................................................... 14 1412
Table 6 Overview of the input parameters of the DALY formula, applied to China ........................ 15 1413
Table 7 Burden of folate deficiency in China, per functional outcome, expressed in the number of 1414
DALYs lost, per year, per region and administrative area ................................................................. 17 1415
Table 8 Folate biofortification of rice in China in an optimal scenario (100 % consumption of 1416
biofortified rice). Current rice and folate consumption, added and total folate intake after 1417
biofortification, and % of RDI, per administrative area and region .................................................. 25 1418
Table 9 The health impact of folate biofortification of rice in China, low impact scenario, per 1419
functional outcome, expressed in the number of DALYs saved, per year, per region and 1420
administrative area ............................................................................................................................. 28 1421
Table 10 The health impact of folate biofortification of rice in China, high impact scenario, per 1422
functional outcome, expressed in the number of DALYs saved, per year, per region and 1423
administrative area ............................................................................................................................. 29 1424
Table 11 Burden of folate deficiency (DALYs lost) and the health impact of folate biofortification 1425
(DALYs saved) in China, expressed in the total number of DALYs and per 10,000 persons, per 1426
year, per region and administrative area ............................................................................................ 30 1427
Table 12 Comparison of the burden of micronutrient deficiencies (DALYs lost) and the health 1428
impact of potential biofortified staple crops (DALYs saved), per crop, nutrient, and country, in 1429
DALYs lost/saved per 10 000 persons and in % reduction of the burden ......................................... 32 1430 1431
List of Figures 1432 1433 Figure 1 Application of the DALY approach to measure the health benefits of folate biofortified 1434
rice in disability-adjusted life years ..................................................................................................... 5 1435
Figure 2 Folate deficiency in the world. Average plasma folate concentrations (in Nmol/L), per 1436
country ................................................................................................................................................. 7 1437
Figure 3 Folate deficiency in the world. Percentage of adults with folate deficiency, per country ..... 7 1438
Figure 4 The estimated annual number of neural-tube defects, Top 20 countries. ............................ 10 1439
Figure 5 The health impact of folate biofortified rice ........................................................................ 23 1440
Figure 6 Administrative areas and provinces in China, per region .................................................... 40 1441
Figure 7 NTD prevalence rates in China, per administrative region (1996-2000), in number of 1442
NTDs per 10,000 births ...................................................................................................................... 40 1443
Figure 8 Current rice consumption patterns in China, per administrative region, in g per day per 1444
women of childbearing age ................................................................................................................ 41 1445
Figure 9 Share of rice production in cropland usage in China ........................................................... 41 1446
Figure 10 Total daily folate intake after biofortification in China, per women of childbearing age . 42 1447 1448
1449
Nature Biotechnology, vol. 28, no. 6 DeSteur, H. et al.

40
Annex 1 Geographical presentation of the main characteristics of the study location 1450
related to the DALY framework 1451
1452
1453 Figure 6 Administrative areas and provinces in China, per region 1454
1455
1456
1457
1458 1459 Figure 7 NTD prevalence rates in China, per administrative region (1996-2000), in number of NTDs per 10,000 births 1460 Source: Table 1, based on Dai et al
9 1461
1462
1463
1464
1465
Nature Biotechnology, vol. 28, no. 6 DeSteur, H. et al.

41
1466
1467 1468 Figure 8 Current rice consumption patterns in China, per administrative region, in g per day per women of childbearing 1469 age 1470 Source: Table 6, based on rice consumption data of the CNGOIC
119 1471
1472 1473 1474
1475 1476 Figure 9 Share of rice production in cropland usage in China 1477 Source: IIASA, International Institute for Applied Systems Analysis 1478
Nature Biotechnology, vol. 28, no. 6 DeSteur, H. et al.

42
1479
1480 1481 Figure 10 Total daily folate intake after biofortification in China, per women of childbearing age 1482 Source : Table 6, based on Zhao et al
17, CNGOIC data
119 and Storozhenko et al
1 1483
1484
Nature Biotechnology, vol. 28, no. 6 DeSteur, H. et al.