Embed Size (px)
Citation preview
11
Sustainable Withdrawal Sustainable Withdrawal RatesRates
and and
How Alternative Strategies Affect the How Alternative Strategies Affect the HeirsHeirs
Peter James Lingane, EA, CFPPeter James Lingane, EA, CFP®®Financial Security by DesignFinancial Security by Design
Lafayette, CALafayette, [email protected]@lingane.com
July 25 and 26, 2007July 25 and 26, 2007

22
Required Investment Cash Required Investment Cash FlowFlow
• Necessary spending and taxes less all Necessary spending and taxes less all income flows except investment flowsincome flows except investment flows
• Initial amount and escalation rate are Initial amount and escalation rate are customer specificcustomer specific
• Quoted as fraction of initial portfolio Quoted as fraction of initial portfolio valuevalue
• May, or may not, be quoted net of taxMay, or may not, be quoted net of tax

33
Today’s FocusToday’s Focus
• Customers of moderate meansCustomers of moderate means
• Life annuityLife annuity
• Bond portfolio followed by a life Bond portfolio followed by a life annuityannuity
• Diversified investment portfolioDiversified investment portfolio
• The Planner’s RoleThe Planner’s Role

44
Understand Your Customer!Understand Your Customer!
• Single female, normal life expectancySingle female, normal life expectancy
• $30,000 AT, inflation-adjusted until age $30,000 AT, inflation-adjusted until age 8585
• 25% federal ordinary tax, plus state25% federal ordinary tax, plus state
• Home is reserved for LTC and the heirsHome is reserved for LTC and the heirs
• Estate and health documents are in orderEstate and health documents are in order
• Health insurance; no life insuranceHealth insurance; no life insurance

55
85 year old Single Woman85 year old Single Woman
• Life annuity – lowest riskLife annuity – lowest risk$30,000 AT for life costs $230,000$30,000 AT for life costs $230,000
• Bond portfolio – low riskBond portfolio – low risk$30,000 AT for 15 yr. costs $30,000 AT for 15 yr. costs $360,000$360,000
• Inflation may be an issue at younger Inflation may be an issue at younger agesages

66
Inflation-Protected Bonds Inflation-Protected Bonds “TIPS”“TIPS”
• Secure, liquid Treasury bondsSecure, liquid Treasury bonds
• Inflation risk transferred to the Inflation risk transferred to the Treasury Treasury
• Quoted yields are net of inflationQuoted yields are net of inflation
Nominal YTM ~ Real YTM + Inflation Nominal YTM ~ Real YTM + Inflation RateRate

77
65 year old Woman65 year old Woman $30,000 after-tax, inflation adjusted for 20 $30,000 after-tax, inflation adjusted for 20
yearsyears
1.1. Indexed life annuityIndexed life annuity
$640,000 single life; $740,000 joint $640,000 single life; $740,000 joint liveslives
2.2. $730,000 combination strategy: TIPS $730,000 combination strategy: TIPS portfolio plus a life annuity from age portfolio plus a life annuity from age 8585
3.3. $750,000 investment portfolio$750,000 investment portfolio

88
Present Value of Risked Present Value of Risked ResidualResidual
$30,000 after-tax, inflation-adjusted, 65WF$30,000 after-tax, inflation-adjusted, 65WF
Present Present CostCost ResidualResidual
Single Life, Single Life, Indexed Indexed AnnuityAnnuity
640,000640,000 zerozero
CombinationCombination 730,000730,000 200,000200,000
Investment Investment PortfolioPortfolio 750,000750,000 400,000400,000

99
Best for Everyone?Best for Everyone?
• Immediate life annuity plusImmediate life annuity plus
• Immediate gifts to the heirsImmediate gifts to the heirs

1010
Forecasts Must Be Probabilistic Forecasts Must Be Probabilistic with respect to returns, inflation, life with respect to returns, inflation, life expectancyexpectancy
• Draw time sequences from the Draw time sequences from the historical recordhistorical record
• Randomize the historical recordRandomize the historical record
• Describe historical record Describe historical record mathematicallymathematically
1111
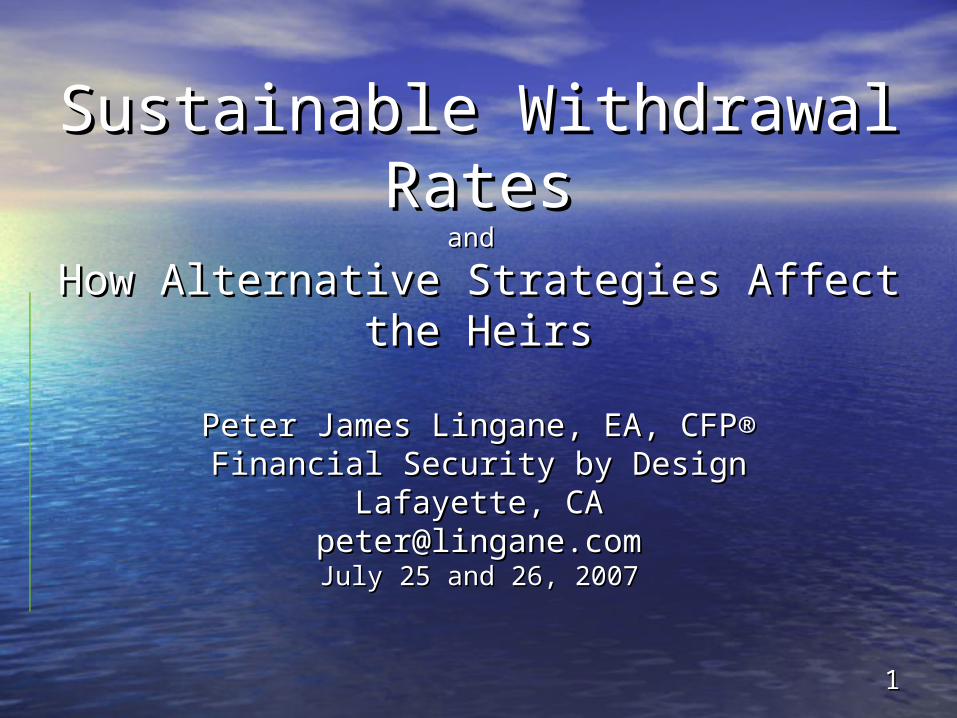
Incorporate Life Expectancy When Incorporate Life Expectancy When Describing Risk of Exhausting Describing Risk of Exhausting
PortfolioPortfolio• Failure within 35 years; orFailure within 35 years; or• Failure before deathFailure before deathWhich is the more meaningful?Which is the more meaningful?
• 27% risk of failure within 35 years; or27% risk of failure within 35 years; or• 5% risk of failure before death 5% risk of failure before death Which is the less frightening?Which is the less frightening?

1212
Pay Attention to the Pay Attention to the AssumptionsAssumptions
5% risk of failure before death5% risk of failure before death • 4.5% initial cash flow, inflation-adjusted4.5% initial cash flow, inflation-adjusted
• No tax on earnings, gains or withdrawalsNo tax on earnings, gains or withdrawals
• 0.3% expenses0.3% expenses
• 60% large cap stocks, 40% bonds60% large cap stocks, 40% bonds
• Historical simulations, 1926 – 2005Historical simulations, 1926 – 2005
• White female, aged 65, normal healthWhite female, aged 65, normal health

1313
Effect of Income TaxEffect of Income Tax0.3% expenses, 60% large cap stocks, 65 0.3% expenses, 60% large cap stocks, 65
WFWF After Tax Cash After Tax Cash
FlowFlow 3.4%3.4% 4.0%4.0% 4.5%4.5%
No tax (Roth No tax (Roth IRA)IRA) 1%1% 5%5%
25% Deferred 25% Deferred TaxTax 5%5% 17%17% 27%27%
15% Current 15% Current TaxTax 1%1% 5%5% 12%12%
July 9July 9 1414
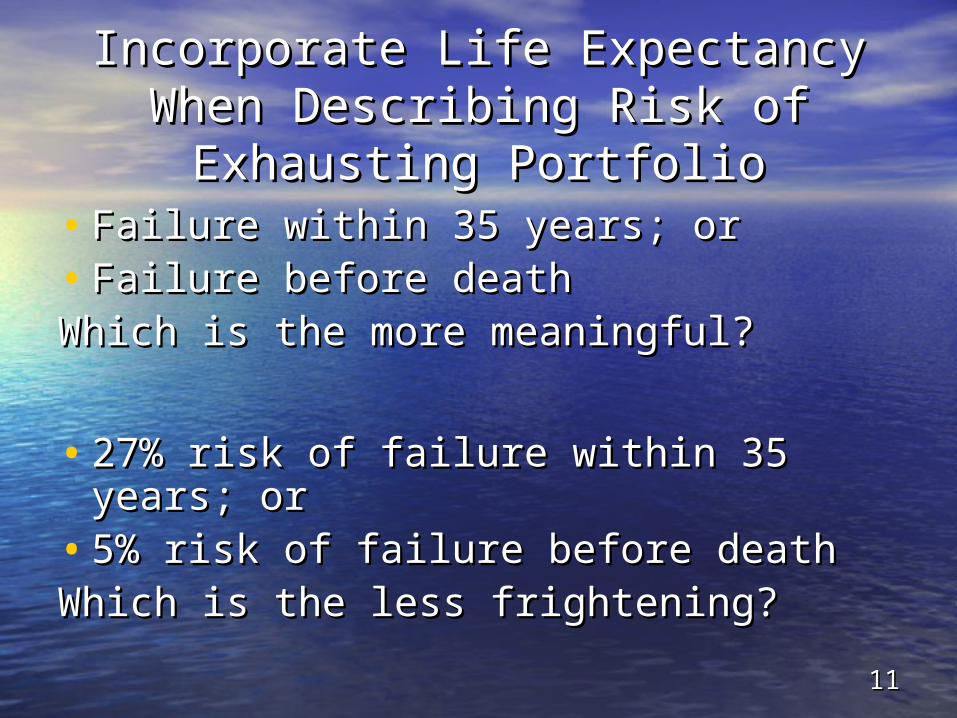
Sustainable Cash Flow vs. Sustainable Cash Flow vs. AgeAge
0.3% expenses, no tax, WF, 1926-20050.3% expenses, no tax, WF, 1926-2005
3%
4%
5%
6%
7%
8%
50 60 70 80 90
Age
Sust
ain
able
Cash
Flo
w

July 9July 9 1515
Impact of Portfolio Impact of Portfolio CompositionCompositionRisk of Exhausting Portfolio Before Death, Risk of Exhausting Portfolio Before Death, 65WF65WF
0%
3%
6%
9%
12%
15%
30% 100%
Equity Allocation

July 9July 9 1616
Impact of Portfolio Impact of Portfolio CompositionCompositionPresent Value of Residual, 65WFPresent Value of Residual, 65WF
30% 100%
Equity Allocation
1717
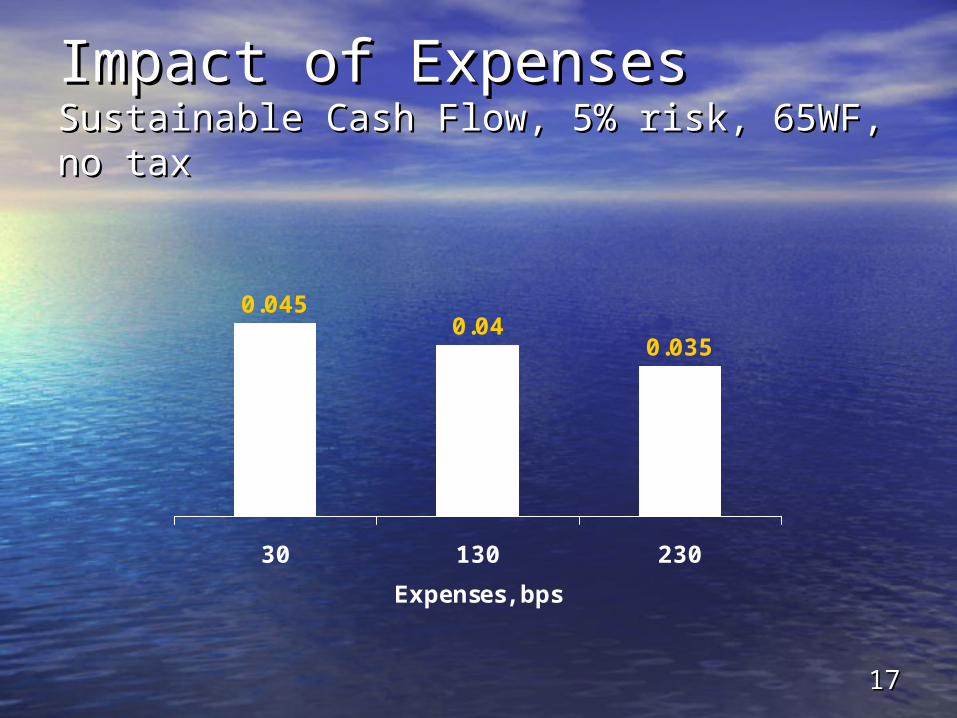
Impact of ExpensesImpact of ExpensesSustainable Cash Flow, 5% risk, 65WF, no Sustainable Cash Flow, 5% risk, 65WF, no taxtax
0.0450.04
0.035
30 130 230
Expenses, bps

1818
Escalating Required Cash Escalating Required Cash FlowFlow• Sustainable cash flow often increases when Sustainable cash flow often increases when
expenses are escalated realisticallyexpenses are escalated realistically
• Reports of high sustainable cash flows are Reports of high sustainable cash flows are often caused by low escalation ratesoften caused by low escalation rates
• Constant annuities stress the portfolio; Constant annuities stress the portfolio; inflation-linked annuities relax the portfolioinflation-linked annuities relax the portfolio

1919
Monte CarloMonte Carlo requires requires a a mathematical model of financial mathematical model of financial
markets and of inflationmarkets and of inflation • Current realityCurrent reality
– Model descriptions are limitedModel descriptions are limited– Few validation and sensitivity studiesFew validation and sensitivity studies– Wide variation in predicted failure ratesWide variation in predicted failure rates
• Criticisms (practical impacts are not known)Criticisms (practical impacts are not known)– Serial correlations omittedSerial correlations omitted– Binary correlations sometimes omittedBinary correlations sometimes omitted– Constant distributions, variances, correlationsConstant distributions, variances, correlations

2020
Analytical “Monte Carlo” Analytical “Monte Carlo” SolutionSolutionMilevsky and Robinson, 2005Milevsky and Robinson, 2005
• Allows planners to determine, using Excel, Allows planners to determine, using Excel, risk of failure before death as function ofrisk of failure before death as function of
Real cash flowReal cash flowPortfolio return & standard deviationPortfolio return & standard deviationLife expectancyLife expectancy
• Assumptions Assumptions Constant mortality risk, an approximationConstant mortality risk, an approximationReal portfolio returns are lognormalReal portfolio returns are lognormal

2121
Real Portfolio Returns, 60% Real Portfolio Returns, 60% EquitiesEquities
12-month rolling intervals 1926 - 200512-month rolling intervals 1926 - 2005
-0.5 0 0.5 1
Fre
quency
ActualLognormal

2222
Implications of Lognormal Implications of Lognormal Real Portfolio ReturnsReal Portfolio Returns•Partially validates analytical modelPartially validates analytical model
•Eliminates the correlation matrix, Eliminates the correlation matrix, which awhich allows dllows direct comparisons of irect comparisons of historical and Monte Carlo historical and Monte Carlo simulations by imbedding a simulations by imbedding a lognormal distribution of real lognormal distribution of real portfolio returns in a historical portfolio returns in a historical simulator.simulator.

July 9July 9 2323
Historical versus AnalyticalHistorical versus Analytical5% risk of failure before death, 0.3% 5% risk of failure before death, 0.3% expenses, no income tax, cash flow expenses, no income tax, cash flow
escalated as inflationescalated as inflation
2%
4%
6%
8%
010203040
Median Life Expectancy WF, years
Sust
ain
able
Cash
Flo
w HistoricalAnalytical

2424
Midcourse CorrectionsMidcourse Corrections
• Decision rules are “… a bumpy path Decision rules are “… a bumpy path that not all clients may be willing, or that not all clients may be willing, or capable, of sustaining.”capable, of sustaining.”
• Planning date versus retirement datePlanning date versus retirement date
• Increase cash flow to age-adjusted Increase cash flow to age-adjusted valuevalue
• Accelerate IRAs distributionsAccelerate IRAs distributions

2525
Conclusions – For PlannersConclusions – For Planners• Know Your CustomerKnow Your Customer
Life ExpectancyLife ExpectancyRate of Cash Flow EscalationRate of Cash Flow EscalationBequest motivation and tolerance for volatilityBequest motivation and tolerance for volatility
• Consider life annuities plus immediate Consider life annuities plus immediate giftsgifts
• Construct diversified portfoliosConstruct diversified portfolios
• Control expenses and taxesControl expenses and taxes
• Analytical Monte Carlo modelAnalytical Monte Carlo model

2626
Conclusions – for Model Conclusions – for Model ProvidersProviders
• Risk of exhausting portfolio before deathRisk of exhausting portfolio before death
• Descriptions of model, input parametersDescriptions of model, input parameters
• SSimulator performance specificationsCertify simulators against these specificationsIdentify reasons for the differences between historical and Monte Carlo simulationsReconcile “breakthroughs” to prior work” to prior work

2727
CaveatsCaveats
• Regrettably, this analysis contains Regrettably, this analysis contains errorserrors
““Trust, but verify!”Trust, but verify!”
• Interest rates, annuity payouts and Interest rates, annuity payouts and tax rates are near historic lows.tax rates are near historic lows.
• Uncertainty in forecastsUncertainty in forecasts