Embed Size (px)
Citation preview

1
Taiwan’s High-tech Industry at the Turn of the Century
Chi SchivePresident
Taiwan Academy of Banking and FinanceAdvisor
Council for Economic Planning and Development
Industrial Restructuring in Asia
Thammasat UniversitySeptember 18, 2000

2
High-tech Development in Taiwan
Outline
I. Introduction
II. Status of Taiwan’s high-tech industry
III. Development of high-tech industry in Taiwan - the case of semiconductor industry
IV. Policy for developing high-tech development industry in Taiwan
V. The foundation of the high-tech economy
VI. Global logistics in Taiwan’s high-tech industries
3
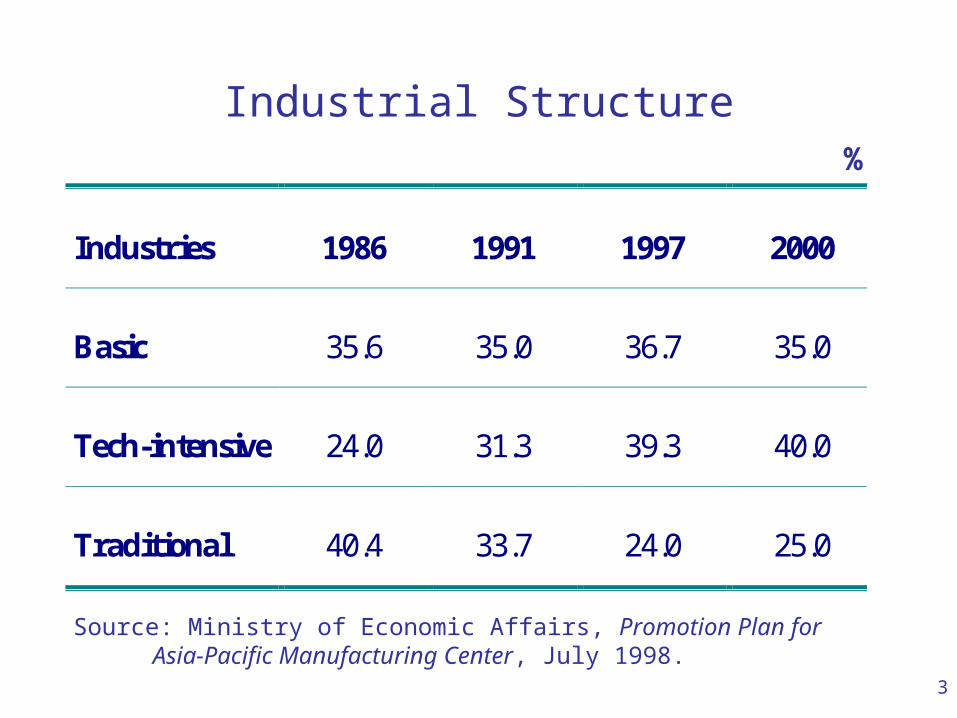
Industrial Structure
Industries 1986 1991 1997 2000
Basic 35.6 35.0 36.7 35.0
Tech-intensive 24.0 31.3 39.3 40.0
Traditional 40.4 33.7 24.0 25.0
%
Source: Ministry of Economic Affairs, Promotion Plan for Asia-Pacific Manufacturing Center, July 1998.

4
World’s No. 1 Producers in Taiwan
World’s No. 1, 1999World’s No.1, 1983
Market share by quantity (%)Shoe Scanner 91Electric fan CD-ROM 77Bicycle PC case 75Umbrella Power supplies 70Sewing machine Keyboard 68Tennis racket Foundry wafer 67Bicycle tire Mother board 64Thermos bottle Monitor 58Monosodium glutamate Modem 57Bicycle break Notebook computer 49Camphor ABS resin 25Bicycle chains Hand tools 16
Nuts and bolts 16Key bd
Sources: Cosmos Magazine, Oct., 1984; Ministry of Economic Affairs, ITIS project.

5
High-Tech Share of Taiwan’s Exports
20
30
40
50
60%
52.1
26.0

6
Policies Relevant to High-Tech Industry in Taiwan
Preparation (1960-80) - Technology development
• Development of core-satellite industrial grouping
• Establishment of Industrial Technology Research Institute (ITRI ,1973), Institute for Information Industry (1979), Development Center for Biotechnology (1984)
Seedling (1981-90)
• Establishment of Hsinchu Science Park (1981)
• Encouraging venture capital business and providing tax incentives to high-tech firms (1984)
• Foreign exchange and financial liberalization
• Environmental protection

7
Policies Relevant to High-Tech Industry in Taiwan
Expansion (1991- )
• Promoting “ten emerging” industries - Statute for Industrial Upgrading (1991) providing tax holidays or tax credits
• Subsidy (1991) to product development up to 50% of R&D spending
• Subsidy (1997)to technology development
• Promoting NII (national information infrastructure) (1996)
• Setting up venture business incubator in universities and research institutions (1998)
• Granting property right of government-funded research output (1999) to research organizations

8
Then Rise of IT Industries in Taiwan
• As the market for black and white televisions shrank, Taiwan’s prosperous television industry switched to produce monitors, which was a readily available alternative.
• Local firms entered the industry in five ways
– People with first-hand experience, such as university professors and former game television manufacturers who lost business after the government closed television game playhouses
– Former marketers for foreign multinationals
– Local companies organized by large multinationals
– Start-ups with government contribution of funds and technology
– Local firms seeking to expand product lines

9
• Subsidiary established by General Instrument (1966), Texas Instrument, RCA, and Philips (1969-71)
– helped develop skilled labor and technicians and managers
– introduced packaging and resting technology, and quality control system
• Laboratories established within educational and research institutions
• Electronics Research and Service Organization (ERSO) established 1974 developed a technology with good market potential and competitive cost
• United Microelectronics Corporation (UMC) was jointly formed by the government, public bank and private enterprises.
Then Rise of Semiconductor Industries in Taiwan
10
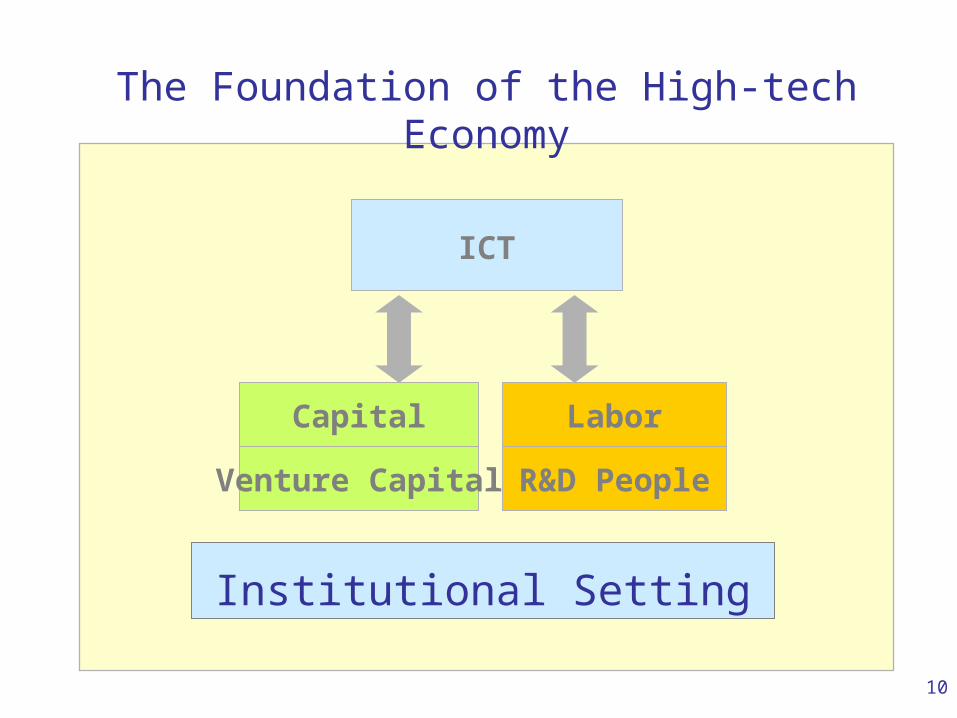
LaborCapital
ICT
The Foundation of the High-tech Economy
R&D PeopleVenture Capital
Institutional Setting
11
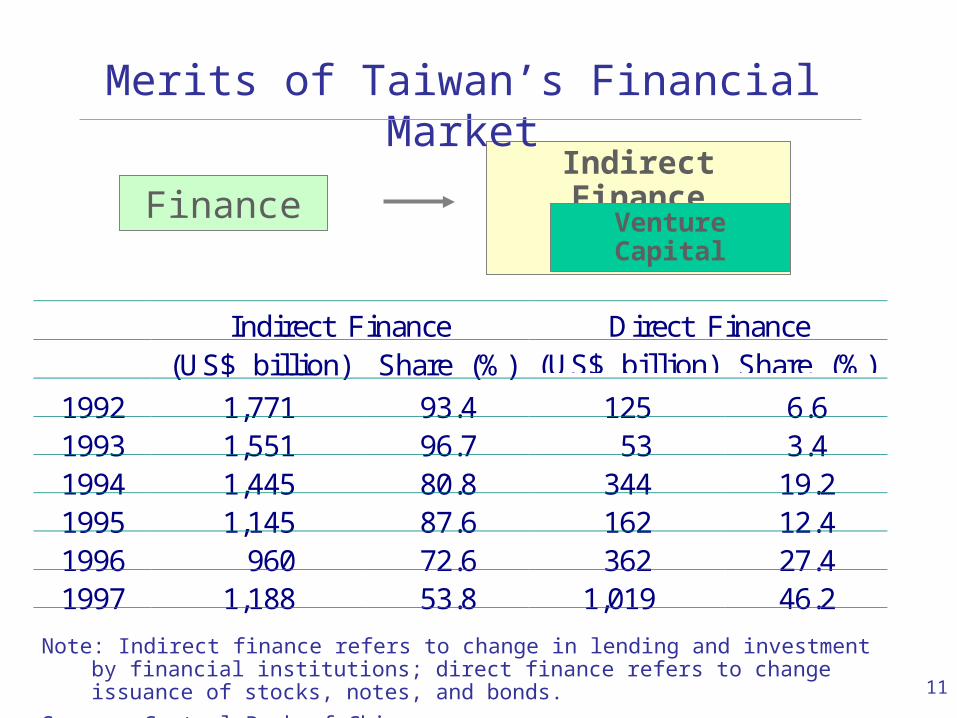
Indirect Finance
Venture CapitalFinance
Merits of Taiwan’s Financial Market
Indirect Finance Direct Finance(US$ billion) Share (%) (US$ billion) Share (%)
1992 1,771 93.4 125 6.61993 1,551 96.7 53 3.41994 1,445 80.8 344 19.21995 1,145 87.6 162 12.41996 960 72.6 362 27.41997 1,188 53.8 1,019 46.2
Note: Indirect finance refers to change in lending and investment by financial institutions; direct finance refers to change issuance of stocks, notes, and bonds.
Source: Central Bank of China.

12
Industrial Structure of Selected Stock Markets
Taiwan
(1996)
Hong Kong
(1995)
Singapore
(1995)
Thailand
(1995)
Industry 50.4 7.8 67.3
(includingservices)
19.4
Electronics 14.2 - - 1.6Financialservices 36.0 24.3 16.8 40.4
Real estate &construction 5.3 30.5 12.7 8.6
Other industries 8.3 37.4 3.3 31.6
Sources: Stock exchanges of Taiwan, Hong Kong, Singapore, and Thailand.

13
What Financial System did For Taiwan’s ICT Industry?
Continuous, steady financial liberalization in appropriate sequence since the late 1970s
Floating exchange rate regime was implemented in 1979.
Limits on interest rate change were abolished in 1989.
The ban on establishing new banks was lifted in 1990.
Stock and money markets have been steadily expanding and improving.
Capital market was opened to foreigners in three phases since 1983.
WTO-GATS commitments.

14
What Financial System did for Taiwan’s ICT Industry?
As a result
Taiwan posted the least spreads between lending and deposit rates on the list of the IMD global competitiveness list. Capital adequacy ratio is far above the required 8% by BIS.
Investment efficiency and quality rose due to increasing competition of the financial market.

15
24
16
2
47
5
52
5
0
10
20
30
40
50
60
before 1992 Jan-98 2000
New Banks
Reorganized from trusts
Reorganized form cooperatives
Reorganized form trusts
Source: McKinsey&Company.
Increasing Number of Banks in the 1990s
16
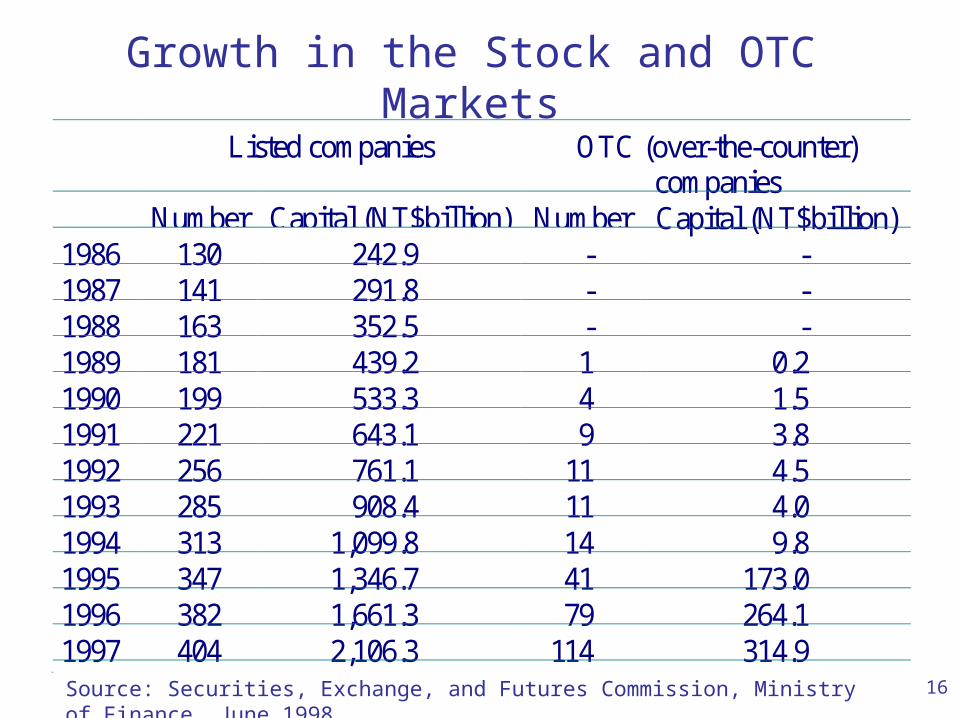
Growth in the Stock and OTC Markets
Listed companies OTC (over-the-counter)companies
Number Capital (NT$billion) Number Capital (NT$billion)1986 130 242.9 - -1987 141 291.8 - -1988 163 352.5 - -1989 181 439.2 1 0.21990 199 533.3 4 1.51991 221 643.1 9 3.81992 256 761.1 11 4.51993 285 908.4 11 4.01994 313 1,099.8 14 9.81995 347 1,346.7 41 173.01996 382 1,661.3 79 264.11997 404 2,106.3 114 314.9
1994
Source: Securities, Exchange, and Futures Commission, Ministry of Finance, June 1998.

17
Increasing Openness of Taiwan’s Financial Sector
Banks Securities Life insurance
Number Foreign banks’share of assets
Number Number
Local Foreign Share(%)
Growth(%)
Local Foreign
Foreignshare of
stockmarket
(%)
Local Foreign
Foreignshare ofmarket
(%)
1990 16 35(43) 5.78 11.4 na na na 8 8 1.4
1991 17 36(47) 5.23 8.2 351 2 0.6 8 10 2.3
1992 32 36(50) 5.27 20.6 294 2 1.1 8 13 3.1
1993 33 37(53) 5.42 21.5 272 1 1.8 14 14 4.0
1994 34 37(57) 5.30 13.5 262 1 2.2 15 14 4.9
1995 34 38(58) 5.53 13.2 249 7 3.9 16 14 6.0
1996 34 41(65) 5.53 10.0 229 13 3.7 16 15 6.8
1997 39 45(69) 6.65 31.7 221 15 2.8 16 15 7.7
Source: Central Bank of China, Ministry of Finance.

18
Knowledge
Innovations
Commercialization
SMEsV.C. Large firms
Capital MarketBanks
?
TSMC, Winbond, and Micronix were established with v.c.

19
High-tech industriesHigh-tech industries
InvestorsInvestorsInnovatorsInnovators VentureCapitalists
Tax incentives (no more today)An Alternative to Industrial Policy
Good projects BanksInsurance companiesInstitutional investors

20
Sectoral Distribution of Venture Investment
Semiconductor 37%
Communications 15%
Information 15%
Opto-electronics 10%
Software 9%
Biotechnology 3%
Other high-tech 7%
Non high-tech 4%
Source:Taipei Venture Capital Association, Venture Capital Report, No. 19, 1998.

21
Performance of V.C. Firms
-2.0
-1.0
0.0
1.0
2.0
3.0
4.0
5.0
6.0
7.0
1984 1986 1988 1990 1992 1994 1996
NT$
6.33
1.81
0.12
Earnings Per Share
Top 10
Average

22
1984 1986 1988 1990 1992
No. of firms 1 1 3 7 2
NT$ billion 0.2 0.8 1.5 3.6 1.2
1994 1996 1998 1999Up to June
2000
No. of firms 1 14 38 46 161
NT$ billion 1.1 6.8 30.3 30.4 110.4
Growth of VC Firms in Taiwan
Source: Taipei Venture Capital Association (June 2000).

23
What Fiscal Sector did for Taiwan’s ICT Industry?
• Income taxes were moderate.
• Fiscal surplus as a percent of GNP was 6.6% in
average during 1974-81.
24
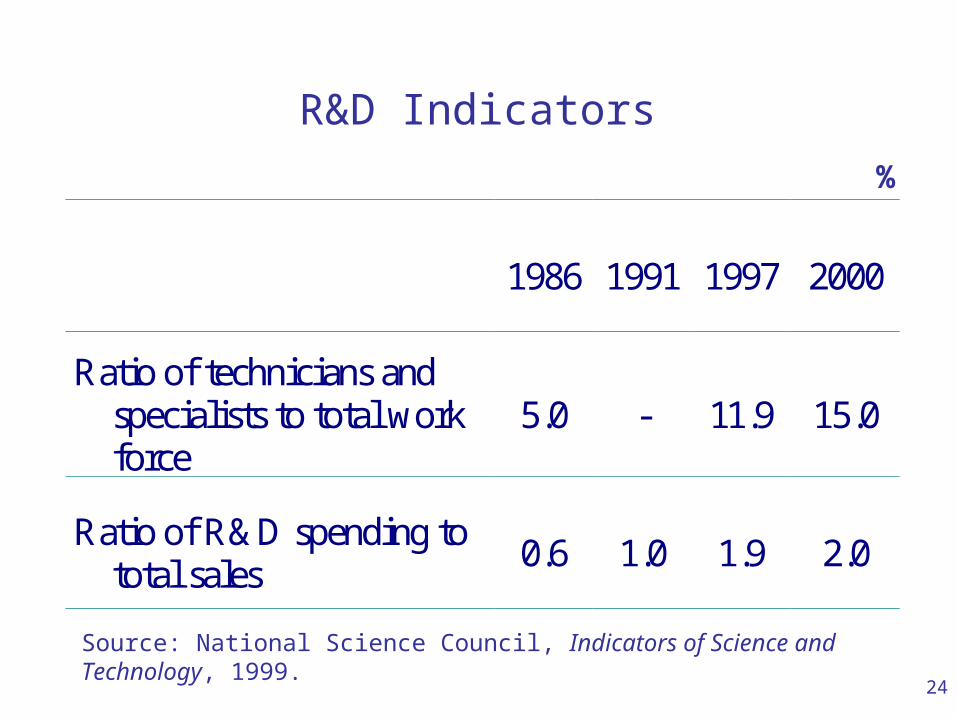
R&D Indicators
1986 1991 1997 2000
Ratio of technicians andspecialists to total workforce
5.0 - 11.9 15.0
Ratio of R&D spending tototal sales
0.6 1.0 1.9 2.0
%
Source: National Science Council, Indicators of Science and Technology, 1999.

25
R&D Spendingas a percent of GDP
1.2
1.4
1.71.7
1.8 1.81.8 1.8 1.8
1.92.0
1
1.5
2
1988 1989 1990 1991 1992 1993 1994 1995 1996 1997 1998
Source: National Science Council, Indicators of Science and Technology, 1999.

26
Researchers per 10,000 Population
19.822.6 22.5
26.227.5
31.233.4
35.338.0
23.3
15
25
35
45
1989 1990 1991 1992 1993 1994 1995 1996 1997 1998
Source: National Science Council, Indicators of Science and Technology, 1999.

27
No. of Patents Granted in the U.S.
15101814 2087
24192597
3805
4526
0
1000
2000
3000
4000
5000
1993 1994 1995 1996 1997 1998 1999
Rank
7 7 7 7 7 5 4
Source: U.S. Patent and Trademark Office, U.S. Department of Commerce.

28
Employment by Level of Education
Total Junior high & below
Senior high & vocational
Polytechnic & above
1964 100.0 90.2 6.8 3.01980 100.0 70.1 19.5 10.41988 100.0 57.4 27.9 14.71998 100.0 40.5 34.6 24.9
%
Source: Directorate-General of Budget, Accounting & Statistics, Monthly Bulletin of Manpower Statistics, 1999.

29
Higher Education Graduates by Discipline
TotalScience&Tech
Humanities & SocialSciences
1977 100.0 45.5 54.51988 100.0 54.0 46.01998 100.0 55.5 44.5
%
Source: Ministry of Education, Education Indicators, 1999.

30
Behind the Emergence of Global Logistics
• Production fragmentation - Classic trade theory
To push cost down, vertically integrated production
processes are taking place across country borders
around the world.
• New phenomenon
Shortening product cycle is generating inventory pressure.
• New phenomenon
Technology change improves the cost of information
transmission and goods transportation.

31
Changes in Local Operations
R&D Manufacturing Marketing andDistribution
OEM
R D Mfg Marketing andDistribution
ODM
R D Mfg Logistics M
ODL/GL
Before the mid-1980s
In the late 1980s and early 1990s
After the mid-1990s
: Local operations

32
Japan
Taiwan U.S.
I: InvestmentM: Materials/IntermediatesQ: Finished product/commodityS: Strategic alliance
Before the mid-1980sLate 1980s and early 1990sAfter the mid-1990sASEAN
S
I&M
M
I&MQ
QS
Q
Q
Taiwan’s International Division of Labor
China
I&M
Q

33
Procurement Order Sharing by Taiwan Firms
% of MfgDomesticproduction
Foreignproduction
Manufacturing 100.00 89.35 10.65
Information electronics 35.71 82.03 17.97
Electronics, electricalmachinery
34.90 82.06 17.94
Precision instruments 0.81 80.92 19.08
Metal machinery 23.91 97.62 2.38
Chemicals 23.35 89.05 10.95
Consumer products 17.04 93.50 6.50
%
Source: Ministry of Economic Affairs, Statistics Department, Survey on Manufacturing Activities,July 1999.

34
Production Sharing of Taiwan’s Information Industry
1995 1996 1997 1998 1999*
Total 100.0 100.0 100.0 100.0 100.0
Taiwan 72.0 67.9 62.6 57.0 52.7
China 14.0 16.8 22.8 29.0 33.2
Thailand 5.0 5.5 5.9 5.4 5.3
Malaysia 7.2 7.4 5.6 4.5 4.0
Other 1.8 2.4 3.1 4.1 4.8
%
* Estimates.Source: Market Intelligence Center, Institute for Information Industry.

35
1. DELL sends a request to Taiwan upon a Singaporean client order
2. The U.S. firm sends CPU to Taiwan
3. China sends cases and power supplies to Taiwan
4. China sends semi-assembled parts to Taiwan
5. Malaysia sends PCB to Taiwan
6. Taiwan sends DRAM mainboard and semi-asembled parts to Singapore
7.China send monitors to Singapore
8. Singapore assembles and sends the finished PC to the client
9. DELL sends the payment to Taiwan
Singapore
China U.S.
DELL
5
PCB
6
1
2
4
Order
CPU
MO
NIT
OR
9
DRAM main-board
8 PC
7
Source: Prepared by CEPD.
3
Taiwan as a Global Logistics Center
Taiwan
Malaysia
Steps 1 to 8 take 2 to 5 days to complete

36
GLC
MacroeconomicFree flows of 4 I’s (industries, investment, individual, i
nformation)
Information
Products Logistics
Cash
Main supplier on the global market - tech and
mfg capability
International funding and paymentFast data transmission
and management
Telecom
Manufacturing Sea/Air
Financial
Building Global Logistics Capabilities
Customs clearance and fast delivery