Embed Size (px)
Citation preview

1
Tennessee Higher Education Commission
Outcomes Formula Technical DetailsTBR
May 17, 2011
2
Tennessee Higher Education Commission
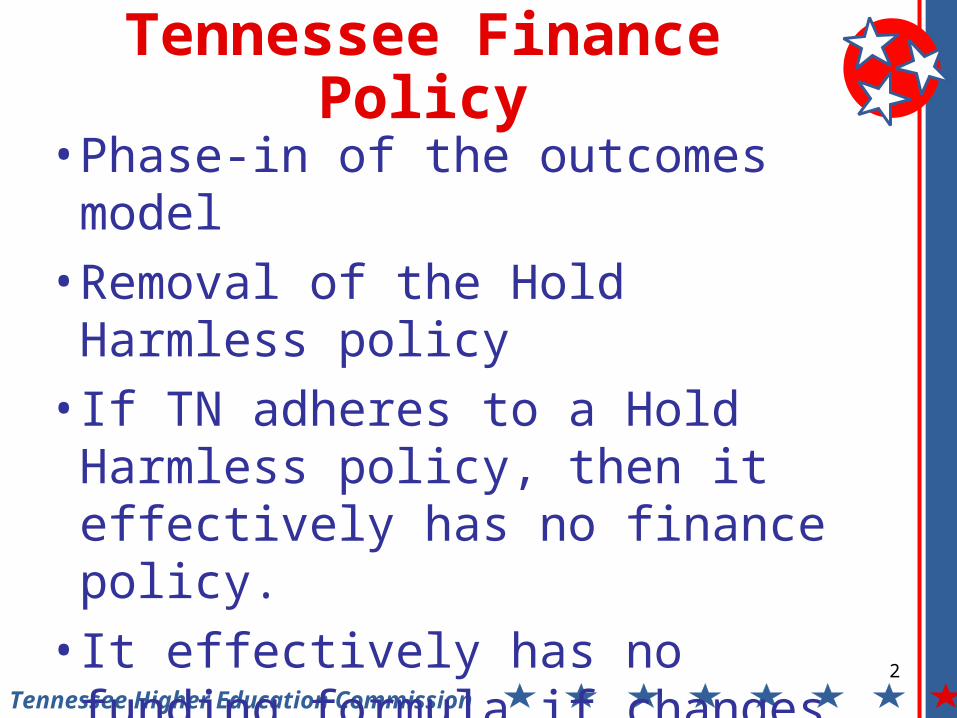
Tennessee Finance Policy
• Phase-in of the outcomes model
• Removal of the Hold Harmless policy
• If TN adheres to a Hold Harmless policy, then it effectively has no finance policy.
• It effectively has no funding formula if changes in the need calculation do not produce changes in funding levels.
3
Tennessee Higher Education Commission
Tennessee Finance Policy
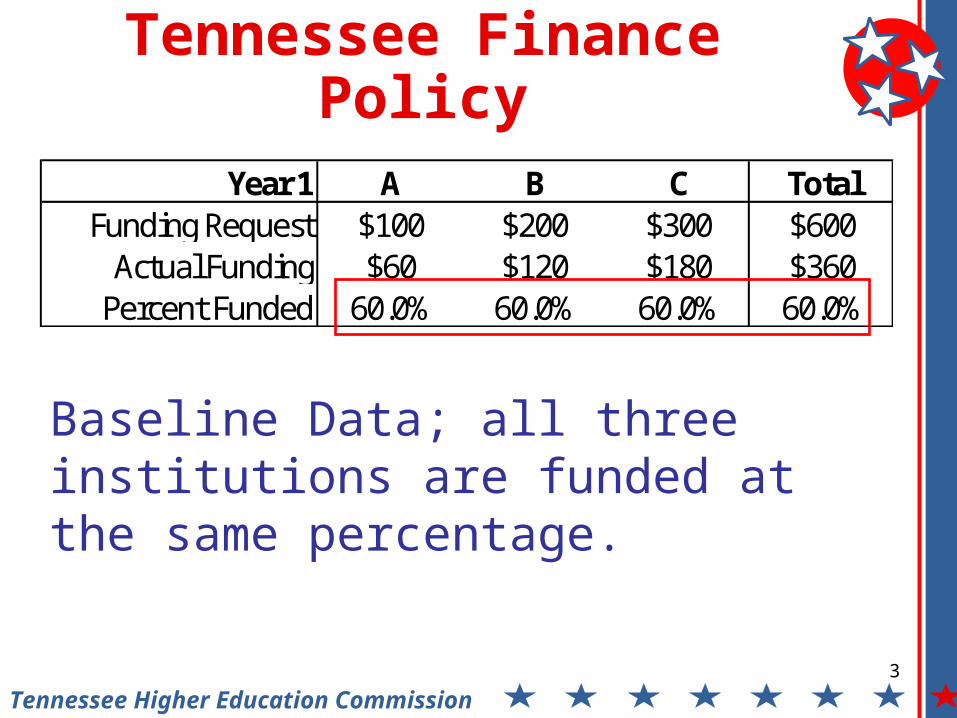
Year 1 A B C TotalFunding Request $100 $200 $300 $600
Actual Funding $60 $120 $180 $360Percent Funded 60.0% 60.0% 60.0% 60.0%
Baseline Data; all three institutions are funded at the same percentage.
4
Tennessee Higher Education Commission
Tennessee Finance Policy
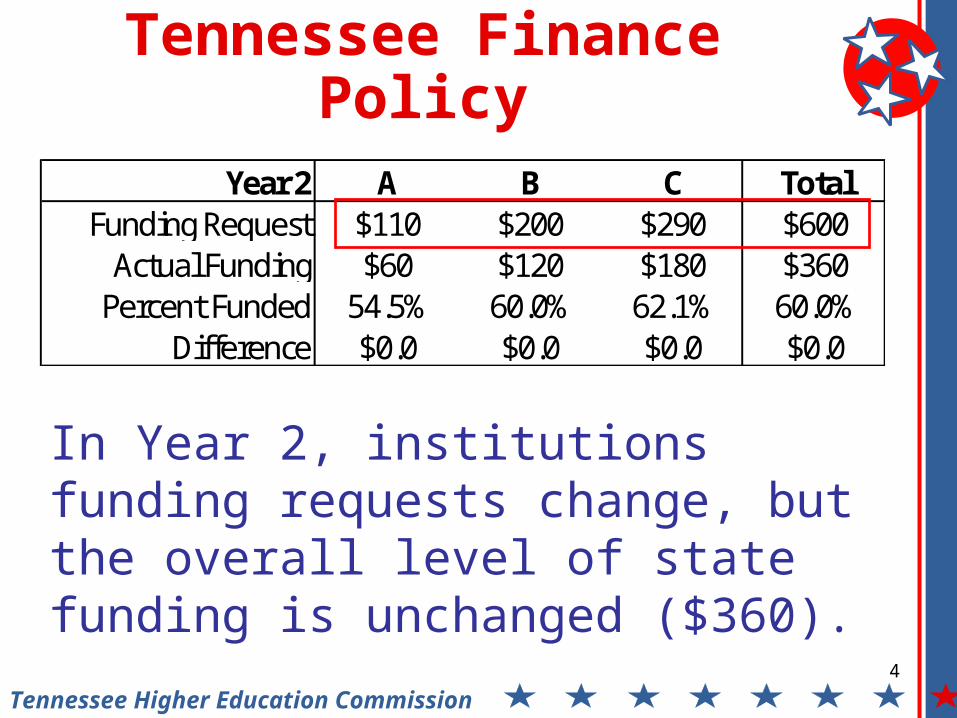
In Year 2, institutions funding requests change, but the overall level of state funding is unchanged ($360).
Year 2 A B C TotalFunding Request $110 $200 $290 $600
Actual Funding $60 $120 $180 $360Percent Funded 54.5% 60.0% 62.1% 60.0%
Difference $0.0 $0.0 $0.0 $0.0
5
Tennessee Higher Education Commission
Tennessee Finance Policy
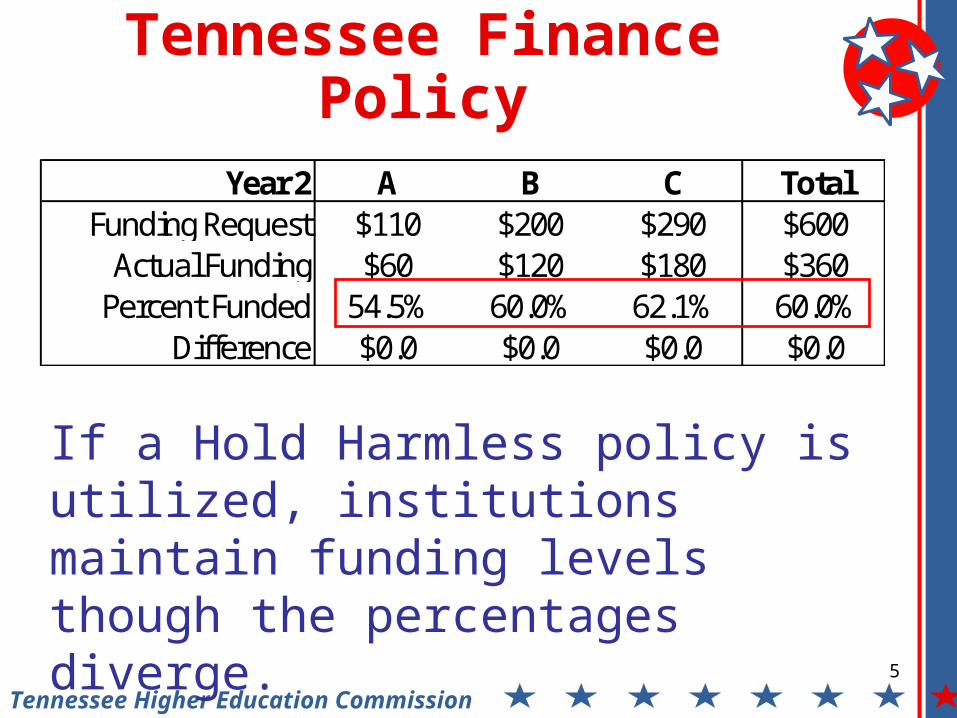
If a Hold Harmless policy is utilized, institutions maintain funding levels though the percentages diverge.
Year 2 A B C TotalFunding Request $110 $200 $290 $600
Actual Funding $60 $120 $180 $360Percent Funded 54.5% 60.0% 62.1% 60.0%
Difference $0.0 $0.0 $0.0 $0.0
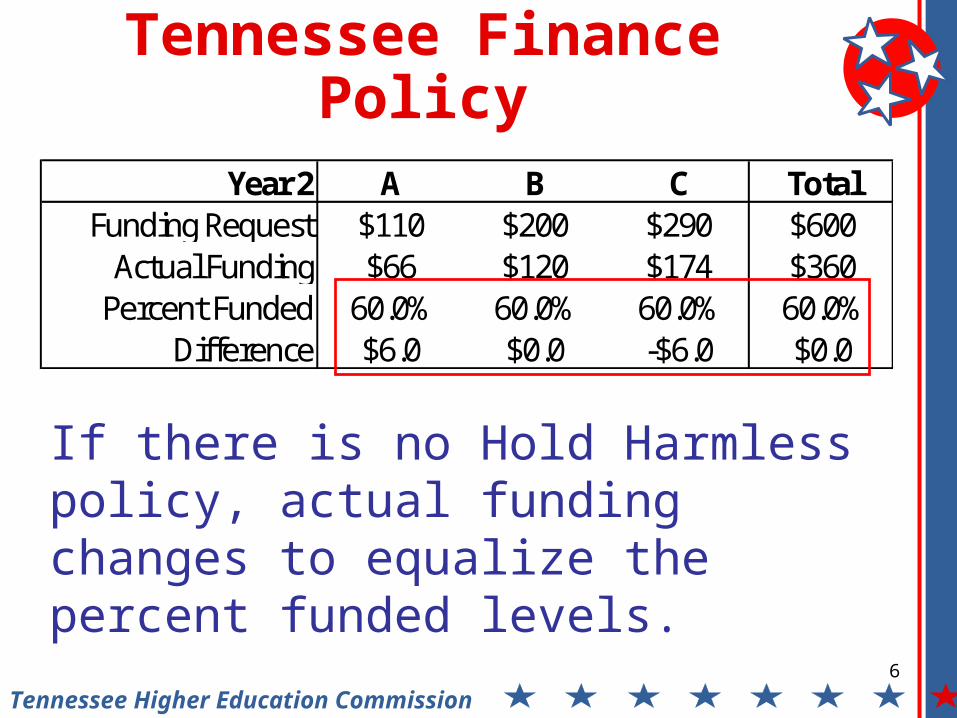
6
Tennessee Higher Education Commission
Tennessee Finance Policy
If there is no Hold Harmless policy, actual funding changes to equalize the percent funded levels.
Year 2 A B C TotalFunding Request $110 $200 $290 $600
Actual Funding $66 $120 $174 $360Percent Funded 60.0% 60.0% 60.0% 60.0%
Difference $6.0 $0.0 -$6.0 $0.0
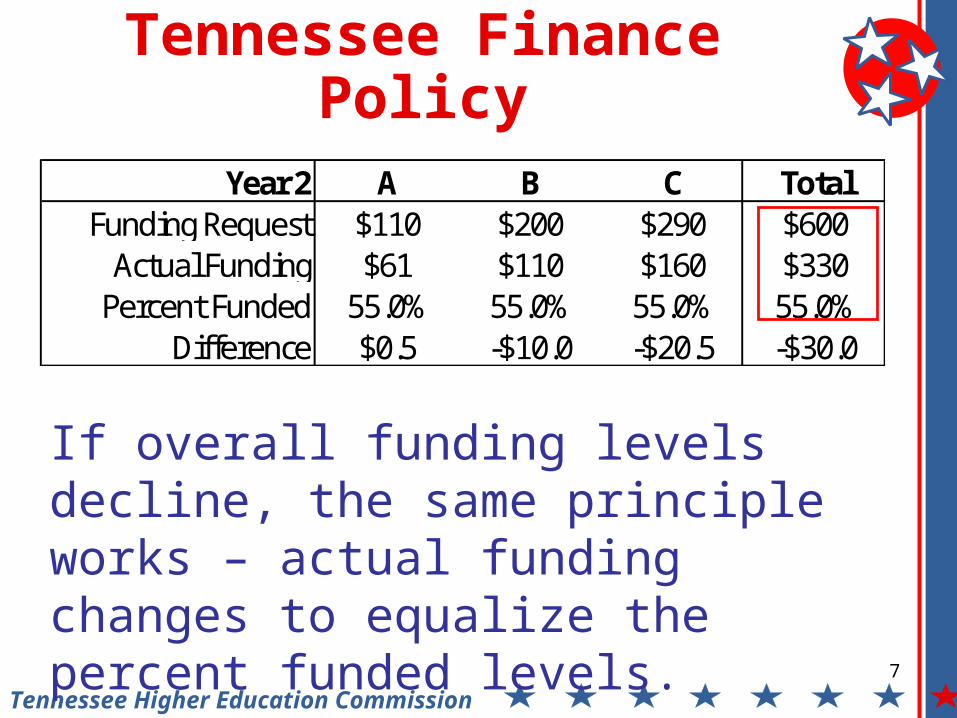
7
Tennessee Higher Education Commission
Tennessee Finance Policy
If overall funding levels decline, the same principle works – actual funding changes to equalize the percent funded levels.
Year 2 A B C TotalFunding Request $110 $200 $290 $600
Actual Funding $61 $110 $160 $330Percent Funded 55.0% 55.0% 55.0% 55.0%
Difference $0.5 -$10.0 -$20.5 -$30.0
8
Tennessee Higher Education Commission
Tennessee Finance Policy
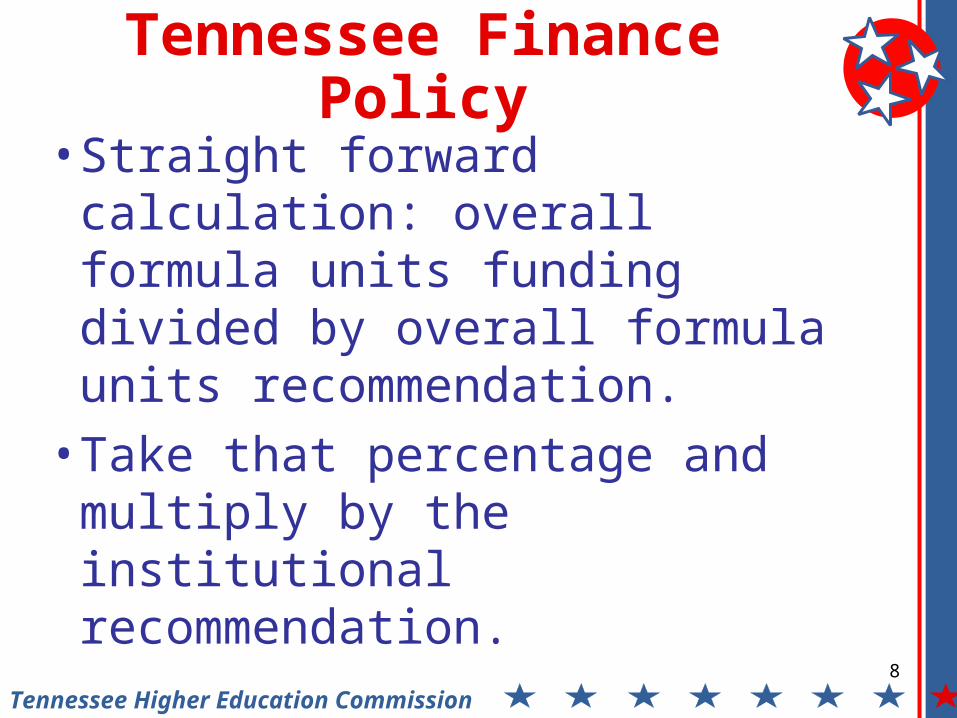
• Straight forward calculation: overall formula units funding divided by overall formula units recommendation.
• Take that percentage and multiply by the institutional recommendation.

9
Tennessee Higher Education Commission
Tennessee Finance Policy
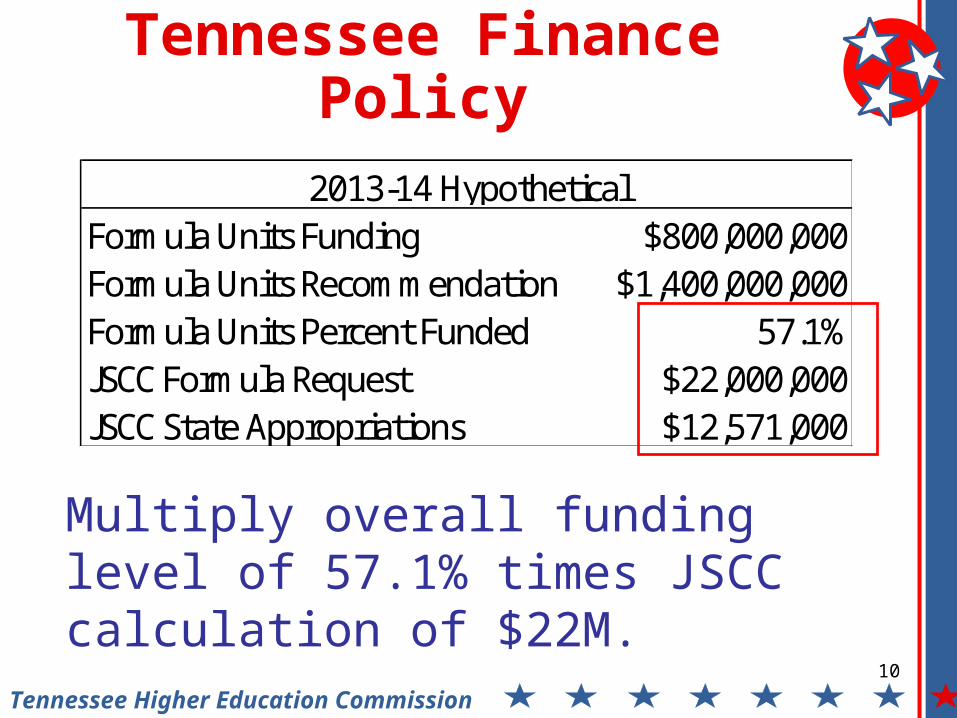
Formula Units Funding $800,000,000Formula Units Recommendation $1,400,000,000Formula Units Percent Funded 57.1%JSCC Formula Request $22,000,000JSCC State Appropriations $12,571,000
2013-14 Hypothetical
10
Tennessee Higher Education Commission
Tennessee Finance Policy
Multiply overall funding level of 57.1% times JSCC calculation of $22M.
Formula Units Funding $800,000,000Formula Units Recommendation $1,400,000,000Formula Units Percent Funded 57.1%JSCC Formula Request $22,000,000JSCC State Appropriations $12,571,000
2013-14 Hypothetical

11
Tennessee Higher Education Commission
Tennessee Finance Policy
How the Phase-In Process Works
12
Tennessee Higher Education Commission
Tennessee Finance Policy
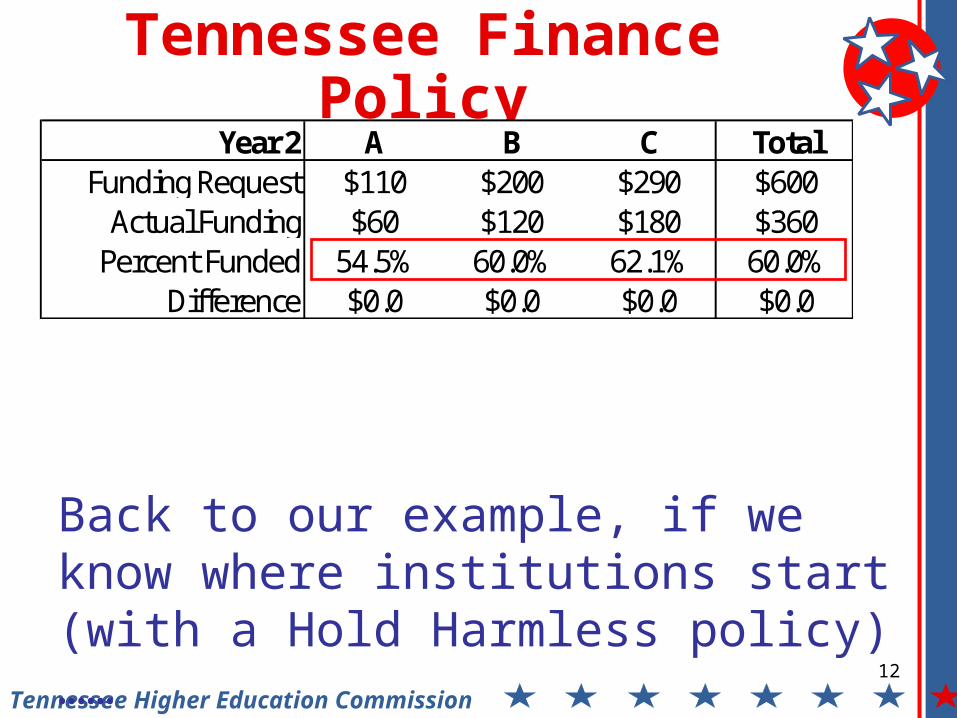
Back to our example, if we know where institutions start (with a Hold Harmless policy)……
Year 2 A B C TotalFunding Request $110 $200 $290 $600
Actual Funding $60 $120 $180 $360Percent Funded 54.5% 60.0% 62.1% 60.0%
Difference $0.0 $0.0 $0.0 $0.0
13
Tennessee Higher Education Commission
Tennessee Finance Policy
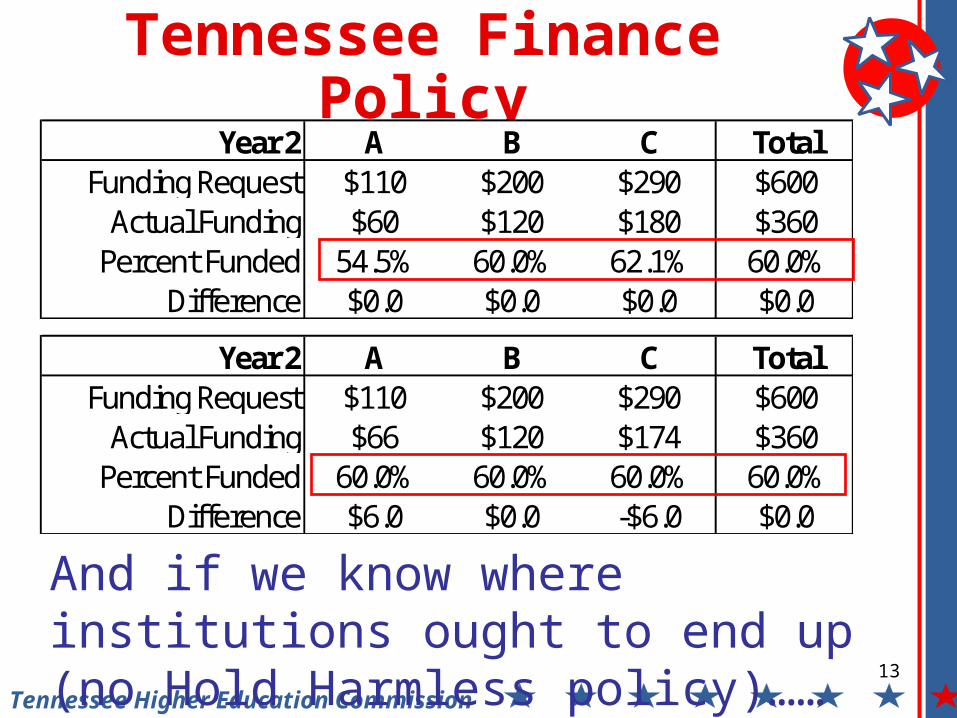
And if we know where institutions ought to end up (no Hold Harmless policy)……
Year 2 A B C TotalFunding Request $110 $200 $290 $600
Actual Funding $60 $120 $180 $360Percent Funded 54.5% 60.0% 62.1% 60.0%
Difference $0.0 $0.0 $0.0 $0.0
Year 2 A B C TotalFunding Request $110 $200 $290 $600
Actual Funding $66 $120 $174 $360Percent Funded 60.0% 60.0% 60.0% 60.0%
Difference $6.0 $0.0 -$6.0 $0.0
14
Tennessee Higher Education Commission
Tennessee Finance Policy
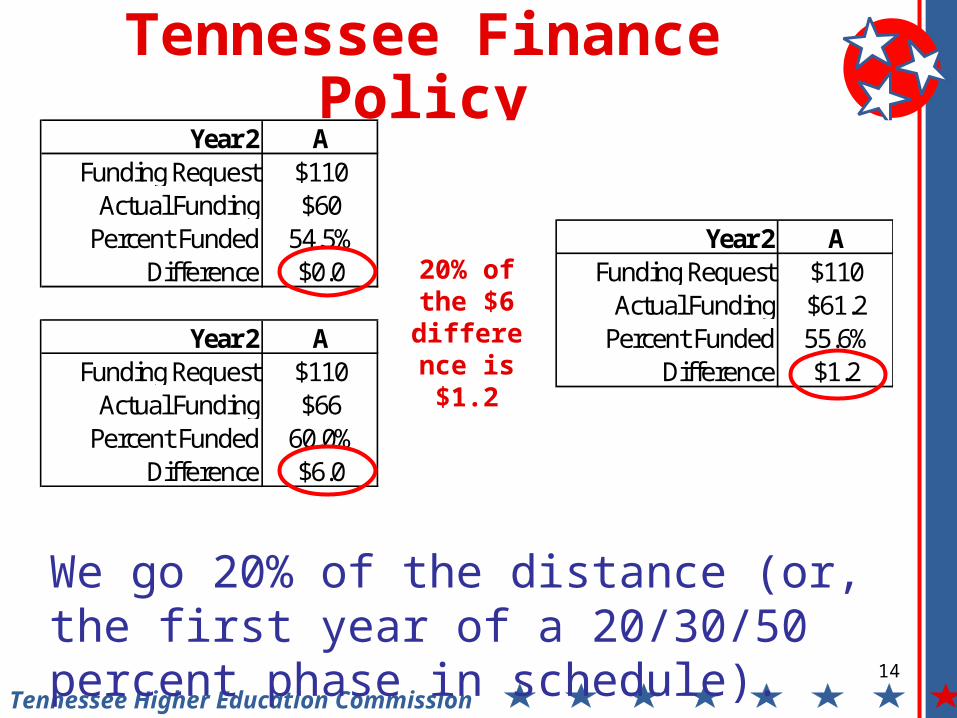
We go 20% of the distance (or, the first year of a 20/30/50 percent phase in schedule).
Year 2 AFunding Request $110
Actual Funding $60Percent Funded 54.5% Year 2 A
Difference $0.0 Funding Request $110Actual Funding $61.2
Year 2 A Percent Funded 55.6%Funding Request $110 Difference $1.2
Actual Funding $66Percent Funded 60.0%
Difference $6.0
20% of the $6
difference is $1.2
15
Tennessee Higher Education Commission
Tennessee Finance Policy
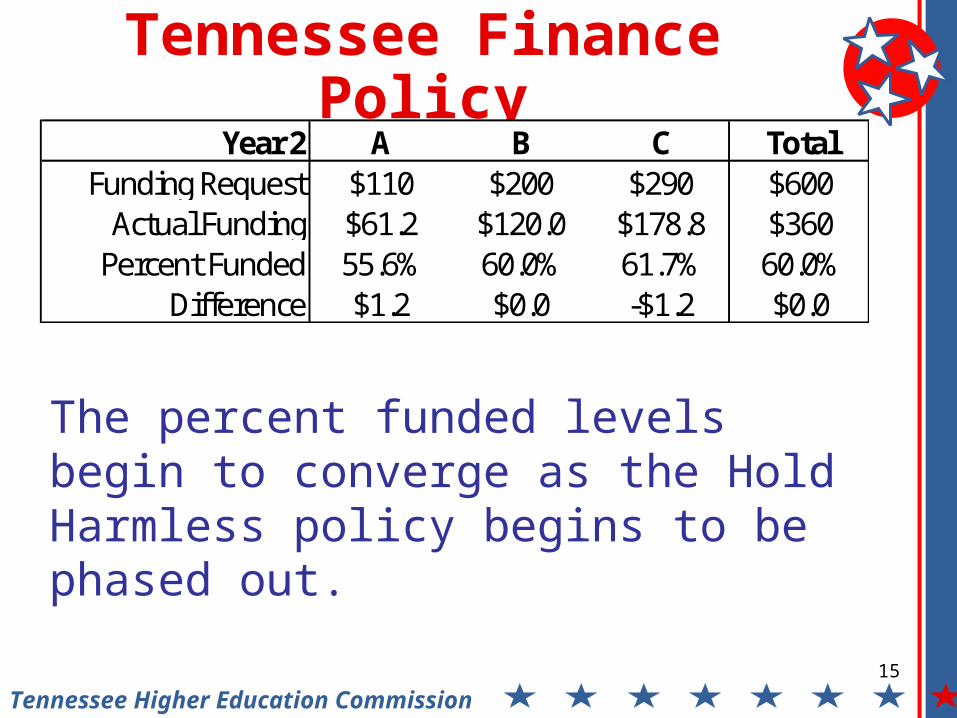
The percent funded levels begin to converge as the Hold Harmless policy begins to be phased out.
Year 2 A B C TotalFunding Request $110 $200 $290 $600
Actual Funding $61.2 $120.0 $178.8 $360Percent Funded 55.6% 60.0% 61.7% 60.0%
Difference $1.2 $0.0 -$1.2 $0.0

16
Tennessee Higher Education Commission
Tennessee Finance Policy
How the Formula Phase-In Factors
Were Derived
17
Tennessee Higher Education Commission
Tennessee Finance Policy
• During the design process, THEC attempted to have the 2010-11 outcomes model estimates replicate the 2010-11 enrollment model numbers.
• Generally, the design came within +/- five percent.
18
Tennessee Higher Education Commission
Tennessee Finance Policy
• To make every effort to have the outcomes model “pick up” where the enrollment model left off, an additional, temporary calculation was added.
19
Tennessee Higher Education Commission
Tennessee Finance Policy
• For example, if the 2010-11 design estimates “undershot” an institution’s enrollment model by 3%, then a factor of 1.03 was added to the model.
• This factor would be used during the three year phase in period.
20
Tennessee Higher Education Commission
Tennessee Finance Policy
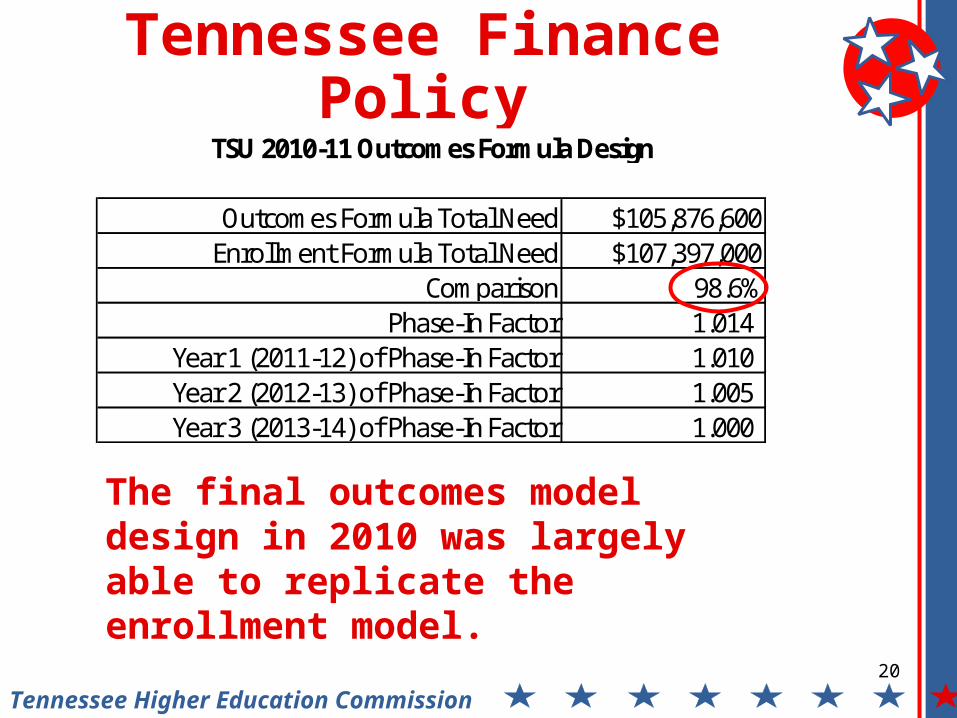
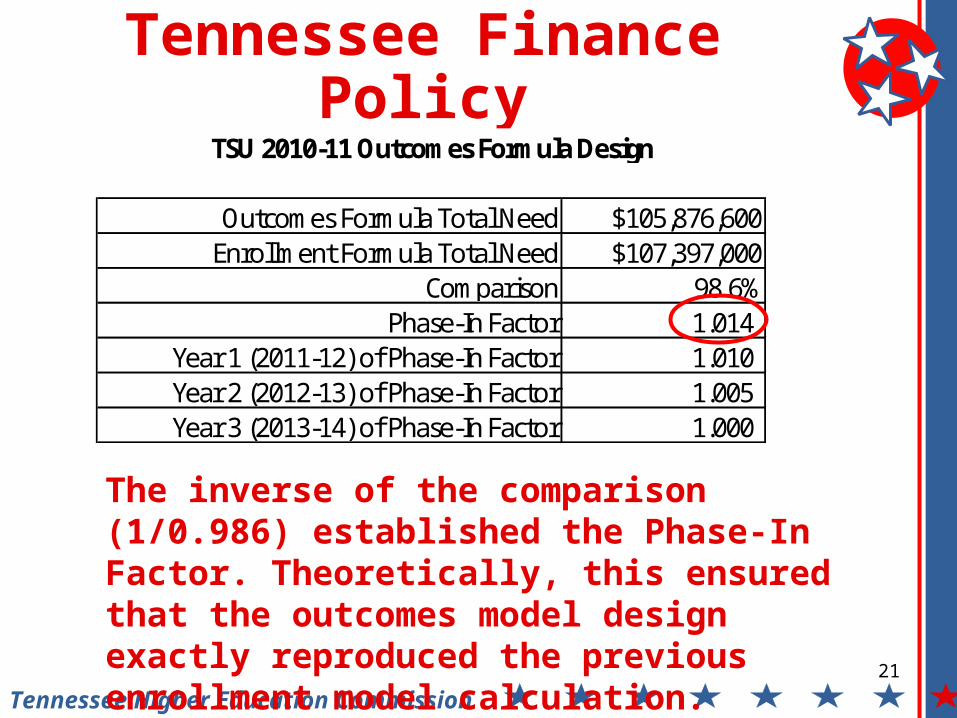
Outcomes Formula Total Need $105,876,600Enrollment Formula Total Need $107,397,000
Comparison 98.6%Phase-In Factor 1.014
Year 1 (2011-12) of Phase-In Factor 1.010 Year 2 (2012-13) of Phase-In Factor 1.005 Year 3 (2013-14) of Phase-In Factor 1.000
TSU 2010-11 Outcomes Formula Design
The final outcomes model design in 2010 was largely able to replicate the enrollment model.
21
Tennessee Higher Education Commission
Tennessee Finance Policy
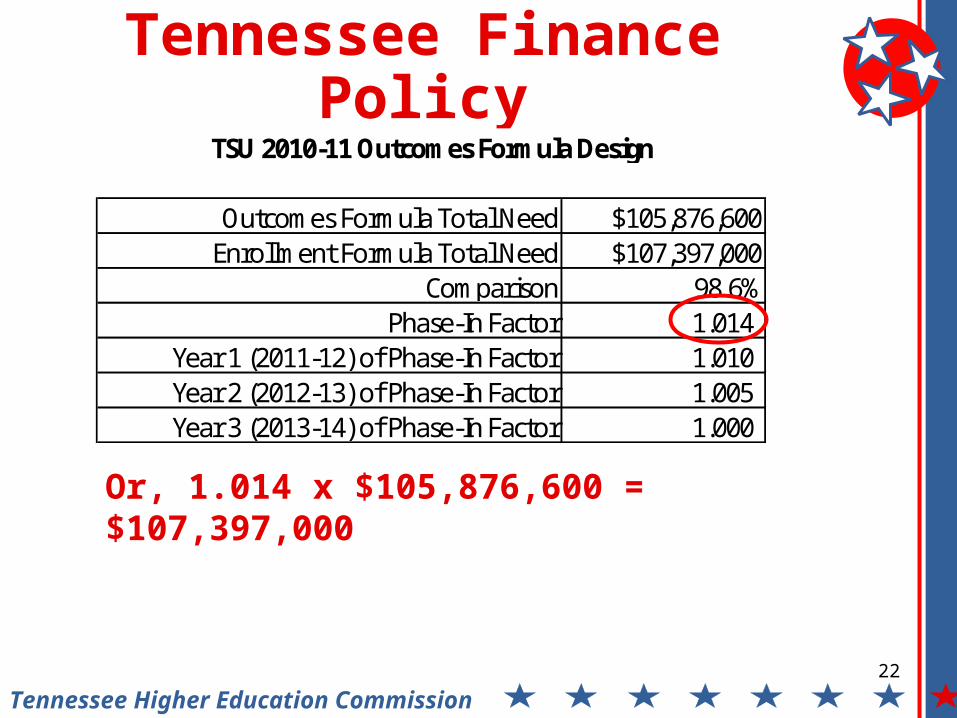
Outcomes Formula Total Need $105,876,600Enrollment Formula Total Need $107,397,000
Comparison 98.6%Phase-In Factor 1.014
Year 1 (2011-12) of Phase-In Factor 1.010 Year 2 (2012-13) of Phase-In Factor 1.005 Year 3 (2013-14) of Phase-In Factor 1.000
TSU 2010-11 Outcomes Formula Design
The inverse of the comparison (1/0.986) established the Phase-In Factor. Theoretically, this ensured that the outcomes model design exactly reproduced the previous enrollment model calculation.
22
Tennessee Higher Education Commission
Tennessee Finance Policy
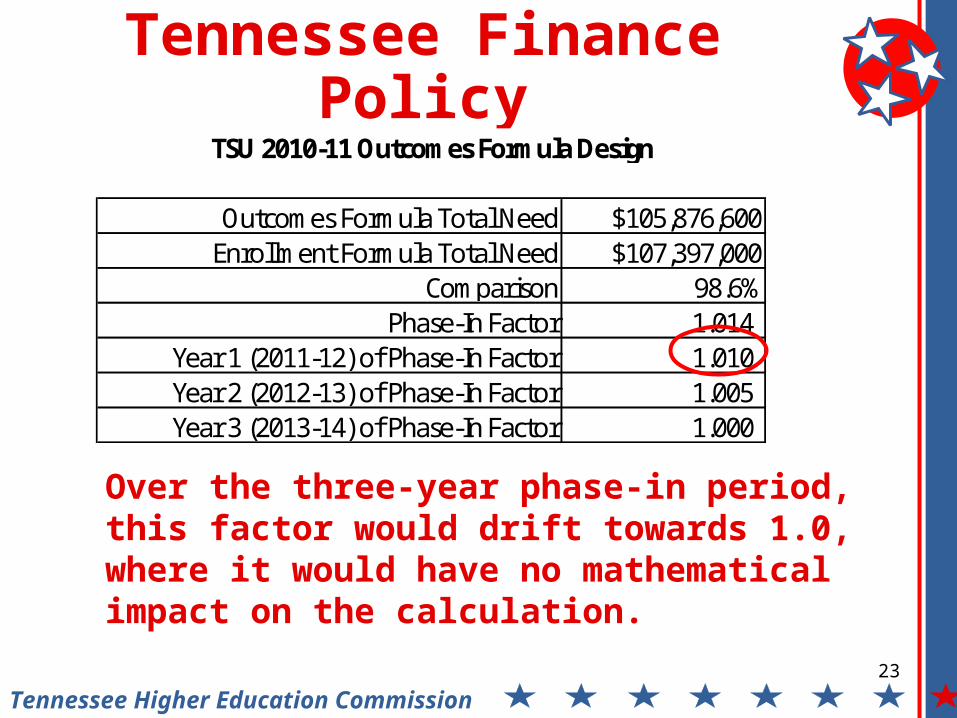
Outcomes Formula Total Need $105,876,600Enrollment Formula Total Need $107,397,000
Comparison 98.6%Phase-In Factor 1.014
Year 1 (2011-12) of Phase-In Factor 1.010 Year 2 (2012-13) of Phase-In Factor 1.005 Year 3 (2013-14) of Phase-In Factor 1.000
TSU 2010-11 Outcomes Formula Design
Or, 1.014 x $105,876,600 = $107,397,000
23
Tennessee Higher Education Commission
Tennessee Finance Policy
Outcomes Formula Total Need $105,876,600Enrollment Formula Total Need $107,397,000
Comparison 98.6%Phase-In Factor 1.014
Year 1 (2011-12) of Phase-In Factor 1.010 Year 2 (2012-13) of Phase-In Factor 1.005 Year 3 (2013-14) of Phase-In Factor 1.000
TSU 2010-11 Outcomes Formula Design
Over the three-year phase-in period, this factor would drift towards 1.0, where it would have no mathematical impact on the calculation.

24
Tennessee Higher Education Commission
Tennessee Finance Policy
Outcomes Formula Total Need $105,876,600Enrollment Formula Total Need $107,397,000
Comparison 98.6%Phase-In Factor 1.014
Year 1 (2011-12) of Phase-In Factor 1.010 Year 2 (2012-13) of Phase-In Factor 1.005 Year 3 (2013-14) of Phase-In Factor 1.000
TSU 2010-11 Outcomes Formula Design
This is the outcomes model phase-in factor and it is distinct from the removal of the Hold Harmless provision.
25
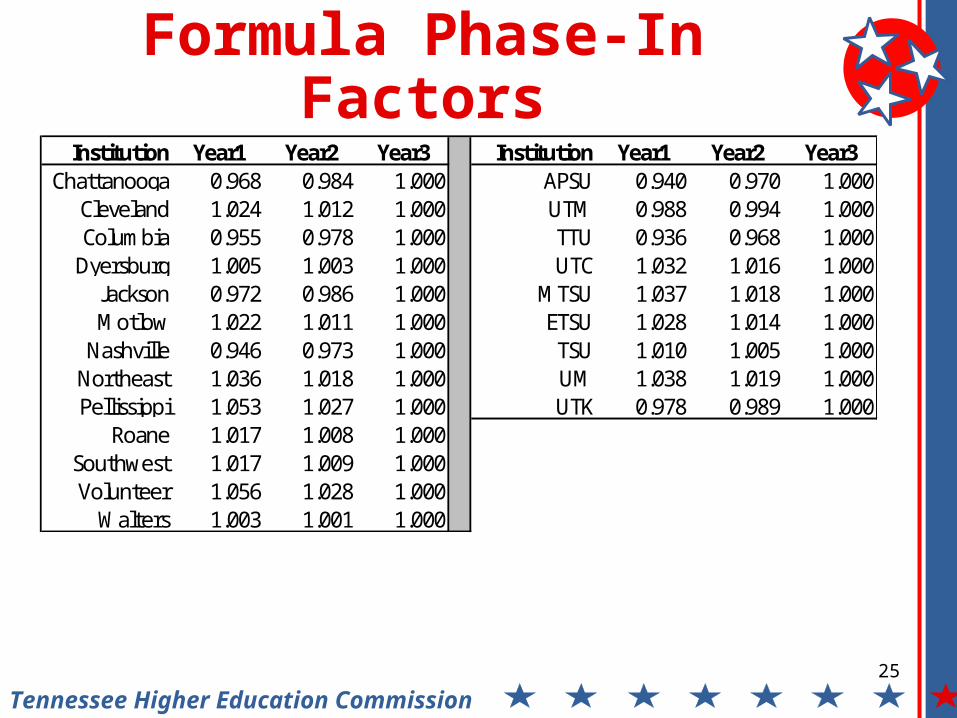
Tennessee Higher Education Commission
Formula Phase-In FactorsInstitution Year1 Year2 Year3 Institution Year1 Year2 Year3
Chattanooga 0.968 0.984 1.000 APSU 0.940 0.970 1.000Cleveland 1.024 1.012 1.000 UTM 0.988 0.994 1.000Columbia 0.955 0.978 1.000 TTU 0.936 0.968 1.000
Dyersburg 1.005 1.003 1.000 UTC 1.032 1.016 1.000Jackson 0.972 0.986 1.000 MTSU 1.037 1.018 1.000Motlow 1.022 1.011 1.000 ETSU 1.028 1.014 1.000
Nashville 0.946 0.973 1.000 TSU 1.010 1.005 1.000Northeast 1.036 1.018 1.000 UM 1.038 1.019 1.000Pellissippi 1.053 1.027 1.000 UTK 0.978 0.989 1.000
Roane 1.017 1.008 1.000Southwest 1.017 1.009 1.000Volunteer 1.056 1.028 1.000
Walters 1.003 1.001 1.000

26
Tennessee Higher Education Commission
Outcomes Formula Technical DetailsTBR
May 17, 2011


![[tbr] menu](https://img.pdfslide.net/doc/110x75/568cadc91a28ab186dad27b9/tbr-menu.jpg)