Embed Size (px)
Citation preview

1
Testing Effectiveness and Reliability Modeling for Diverse
Software Systems
CAI Xia
Ph.D Term 4
April 28, 2005

2
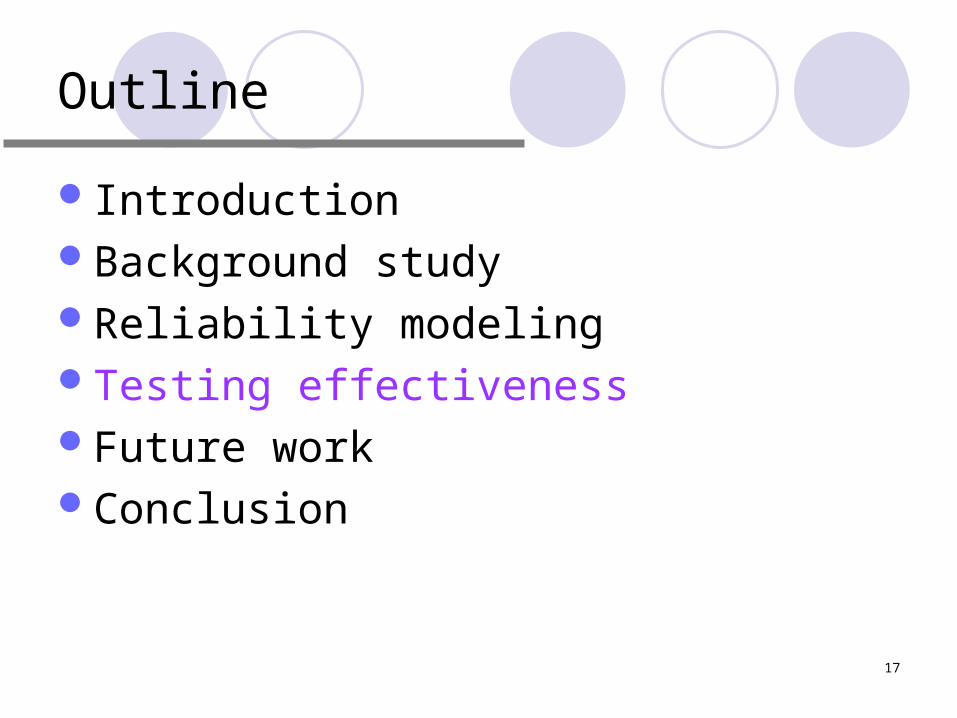
Outline
IntroductionBackground studyReliability modelingTesting effectivenessFuture workConclusion

3
Introduction
Software reliability engineering techniques Fault avoidance
structure programming, software reuse, and formal methods
Fault removal testing, verification, and validation
Fault tolerance single-version technique multi-version technique (design diversity)
Fault prediction reliability modeling

4
Software Fault Tolerance
Layers of Software fault tolerance

5
SFT techniques
Single-version techniques Checkpointing and recovery Exception handling Data diversity
Multi-version techniques (Design diversity) Recovery block N-version programming N self-checking programming
6
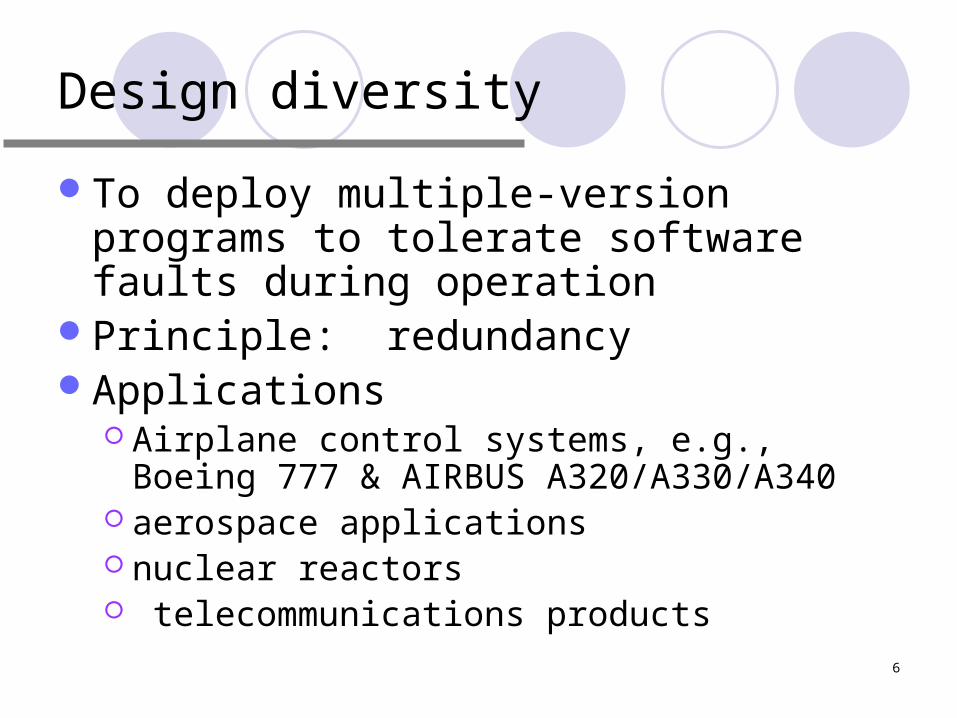
Design diversity
To deploy multiple-version programs to tolerate software faults during operation
Principle: redundancyApplications
Airplane control systems, e.g., Boeing 777 & AIRBUS A320/A330/A340
aerospace applications nuclear reactors telecommunications products
7
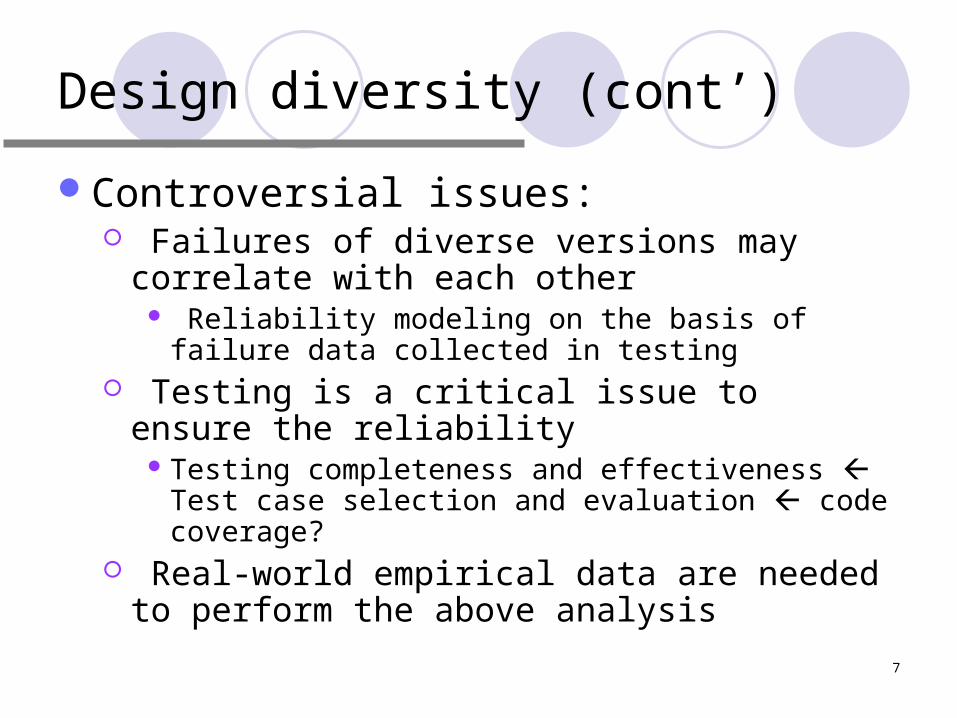
Design diversity (cont’)
Controversial issues: Failures of diverse versions may correlate with
each other Reliability modeling on the basis of failure data
collected in testing Testing is a critical issue to ensure the
reliability Testing completeness and effectiveness Test
case selection and evaluation code coverage? Real-world empirical data are needed to
perform the above analysis

8
Research questions
1. How to predict the reliability of design diversity on the basis of the failure data of each individual version?
2. How to evaluate the effectiveness of a test set? Is code coverage a good indicator?
9
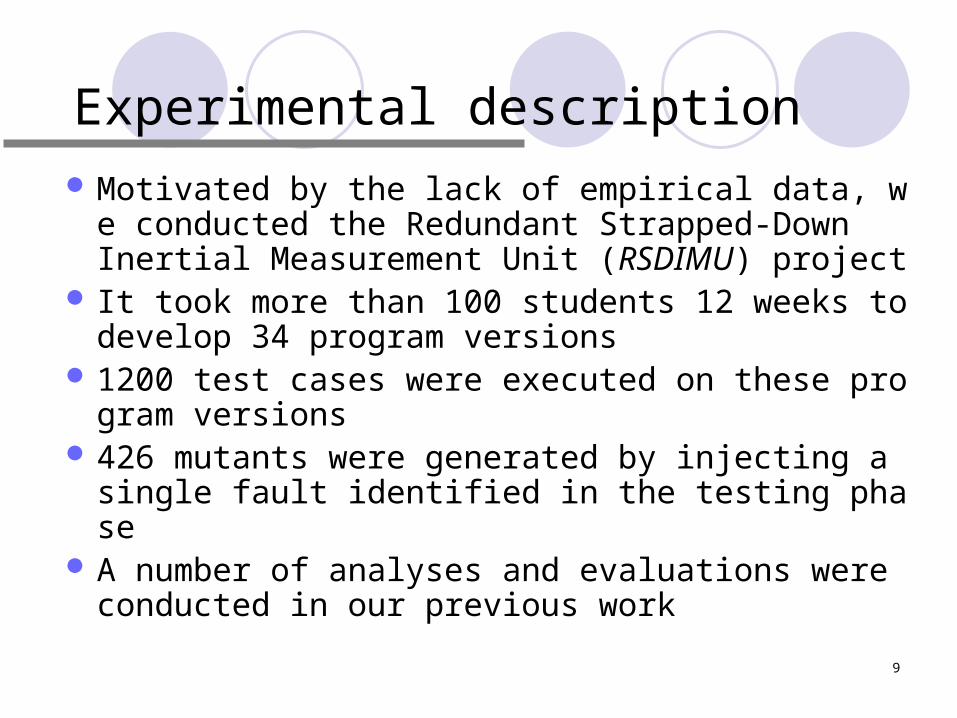
Experimental description
Motivated by the lack of empirical data, we conducted the Redundant Strapped-Down Inertial Measurement Unit (RSDIMU) project
It took more than 100 students 12 weeks to develop 34 program versions
1200 test cases were executed on these program versions
426 mutants were generated by injecting a single fault identified in the testing phase
A number of analyses and evaluations were conducted in our previous work

10
Outline
IntroductionBackground studyReliability modelingTesting effectivenessFuture workConclusion

11
Eckhardt and Lee (1985) Variation of difficulty on demand space Positive correlations between version failures
Littlewood and Miller (1989) Forced design diversity Possibility of negative correlations
Dugan and Lyu (1995) Markov reward model
Tomek and Trivedi (1995) Stochastic reward net
Popov, Strigini et al (2003) Subdomains on demand space Upper/lower bounds for failure probability
Reliability models for design diversity
Conceptual
models
Structural
models
In between

12
PS Model
Alternative estimates for probability of failures on demand (pfd) of a 1-out-of-2 system

13
PS Model (cont’)
Upper bound of system pfd
“Likely” lower bound of system pfd- under the assumption of conditional independence

14
DL Model
Example: Reliability model of DRB
15
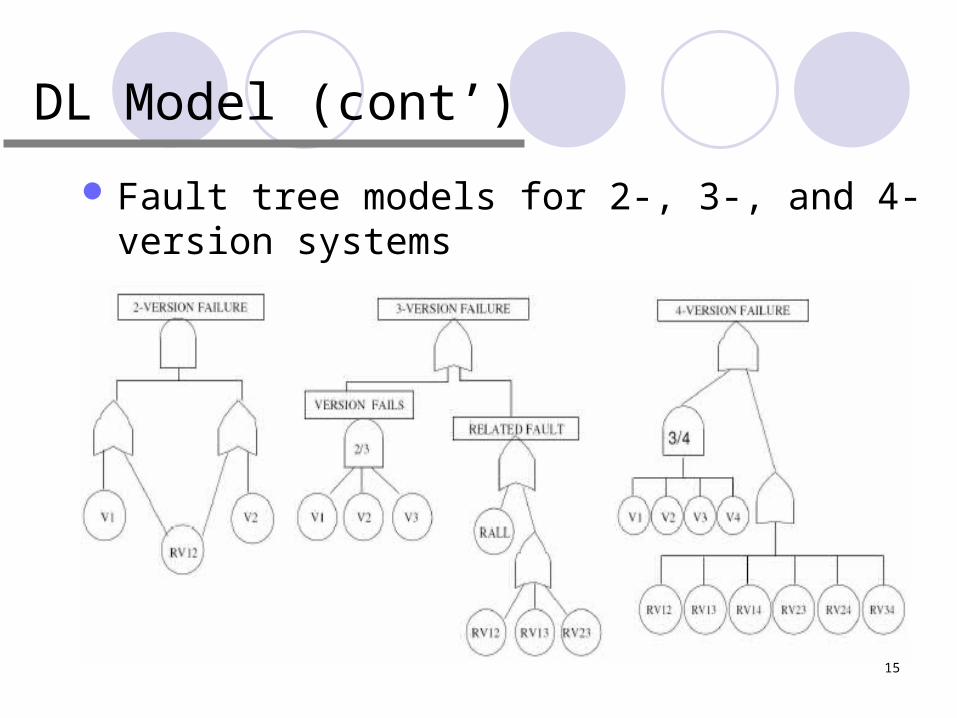
DL Model (cont’)
Fault tree models for 2-, 3-, and 4-version systems

16
Comparison of PS & DL Model
PS Model DL Model
Assumptions
The whole demand space can be partitioned into disjoint subdomains; knowledge on subdomains should be given
The faults among program versions can be classified into unrelated faults and related faults
Prerequisite
1.Probability of subdomains
2.Failure probabilities of programs on subdomains
1.Number of faults unrelated and related among versions
2. Probability of hardware and decider failure
Target system Specific 1-out-of-2 system configurations
All multi-version system combinations
Measurement objective
Upper and lower bounds for failure probability
Average failure probability
Experimental results
Give tighter bounds under most circumstances, yet whether tighter enough needs further investigation
The prediction results agree well with observation, yet may have deviations to a specific system
17
Outline
IntroductionBackground studyReliability modelingTesting effectivenessFuture workConclusion

18
Testing effectiveness
The key issue in software testing is test case selection and evaluation
What is a good test case? testing effectiveness and completeness fault coverage
To allocate testing resources, how to predict the effectiveness of a given test case in advance?

19
Code coverage: an indicator of fault detection capability?
Positive evidence high code coverage brings high software
reliability and low fault rate both code coverage and fault detected in
programs grow over time, as testing progresses. Negative evidence
Can this be attributed to causal dependency between code coverage and defect coverage?
Testing effectiveness

20
Is code coverage a good indicator for fault detection capability?
( That is, what is the effectiveness of code coverage in testing? )
1. Does such effect vary under different
testing profiles?2. Do different code coverage metrics
have various effects?
Testing effectiveness (cont’)

21
Basic concepts: code coverage
Code coverage - measured as the fraction of program codes that are executed at least once during the test.
Block coverage - the portion of basic blocks executed.
Decision coverage - the portion of decisions executed
C-Use - computational uses of a variable. P-Use - predicate uses of a variable
22
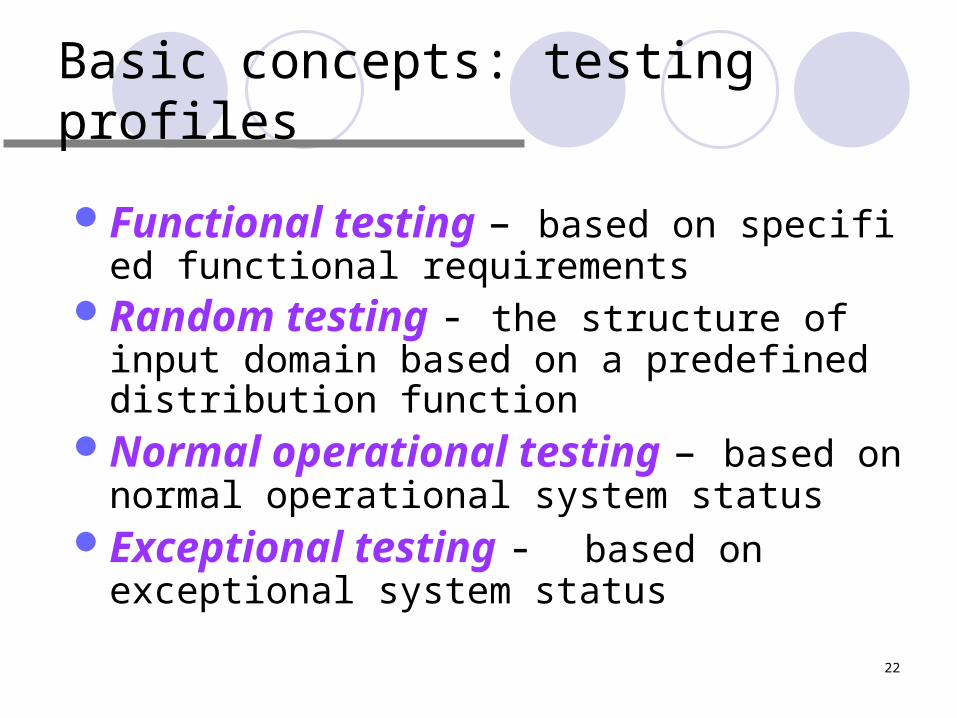
Basic concepts: testing profiles
Functional testing – based on specified functional requirements
Random testing - the structure of input domain based on a predefined distribution function
Normal operational testing – based on normal operational system status
Exceptional testing - based on exceptional system status

23
Experimental requirement
Complicated and real-world applicationLarge population of program versionsControlled development process Bug history recordedReal faults studied
Our RSDIMU project satisfies above requirements

24
Test cases description
I
II
IIIIV
V
VI

25
The correlation between code coverage and fault detection
Is code coverage a good indicator of fault detection capability?
In different test case regionsFunctional testing vs. random testingNormal operational testing vs.
exceptional testingIn different combinations of coverage
metrics

26
The correlation: various test regions
Test case coverage contribution on block coverage
Test case coverage contribution on mutant coverage

27
The correlation: various test regions
Linear modeling fitness in test case regions
Linear regression relationship between block coverage and defect coverage in whole test set

28
The correlation: various test regions
Linear regression relationship between block coverage and defect coverage in region VI
Linear regression relationship between block coverage and defect coverage in region IV

29
The correlation: various test regions
Observations:Code coverage: a moderate indicatorReasons behind the big variance
between region IV and VIRegion IV Region VI
Design principle Functional testing Random testing
Coverage range 32% ~ 50% 48% ~ 52%
Number of exceptional test cases
277
(Total: 373)
0

30
The correlation: functional testing vs. random testing
• Code coverage:
- a moderate indicator
• Random testing
– a necessary complement to functional testing Similar code coverage High fault detection capability
Testing profile (size) R-square
Whole test set (1200) 0.781
Functional test cases (800)
0.837
Random test cases (400) 0.558

31
The correlation: functional testing vs. random testing
Failure details of mutants failed at less than
20 test cases:
detected by 169
functional test cases
(800 in total)
& 94 random test cases
(400 in total)

32
The correlation: functional testing vs. random testing
Failure number of mutants that detected only by functional testing or random testing
Test case type
Mutants detected exclusively
(total mutants killed)
Average number of test cases that
detect these mutants
Std. deviation
Functional testing
20
(382)
4.50 3.606
Random testing
9
(371)
3.67 2.236

33
The correlation: normal operational testing vs. exceptional testing
The definition of operational status and exceptional status Defined by specification application-dependent
For RSDIMU application Operational status: at most two sensors failed as the
input and at most one more sensor failed during the test Exceptional status: all other situations
The 1200 test cases are classified to operational and exceptional test cases according to their inputs and outputs

34
The correlation: normal operational testing vs. exceptional testing
Normal operational testing very weak correlation
Exceptional testing strong correlation
Testing profile (size) R-square
Whole test case (1200) 0.781
Normal testing (827) 0.045
Exceptional testing (373) 0.944

35
The correlation: normal operational testing vs. exceptional testing
Normal testing: small coverage range (48%-52%) Exceptional testing: two main clusters
36
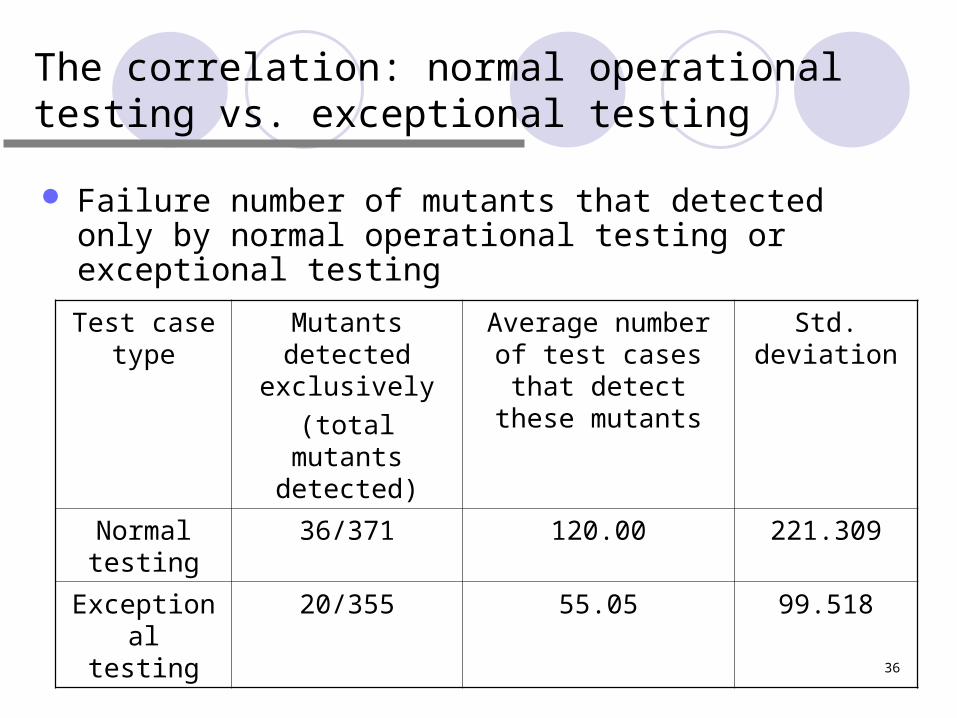
The correlation: normal operational testing vs. exceptional testing
Failure number of mutants that detected only by normal operational testing or exceptional testing
Test case type
Mutants detected exclusively
(total mutants detected)
Average number of test cases that detect
these mutants
Std. deviation
Normal testing
36/371 120.00 221.309
Exceptional testing
20/355 55.05 99.518
37
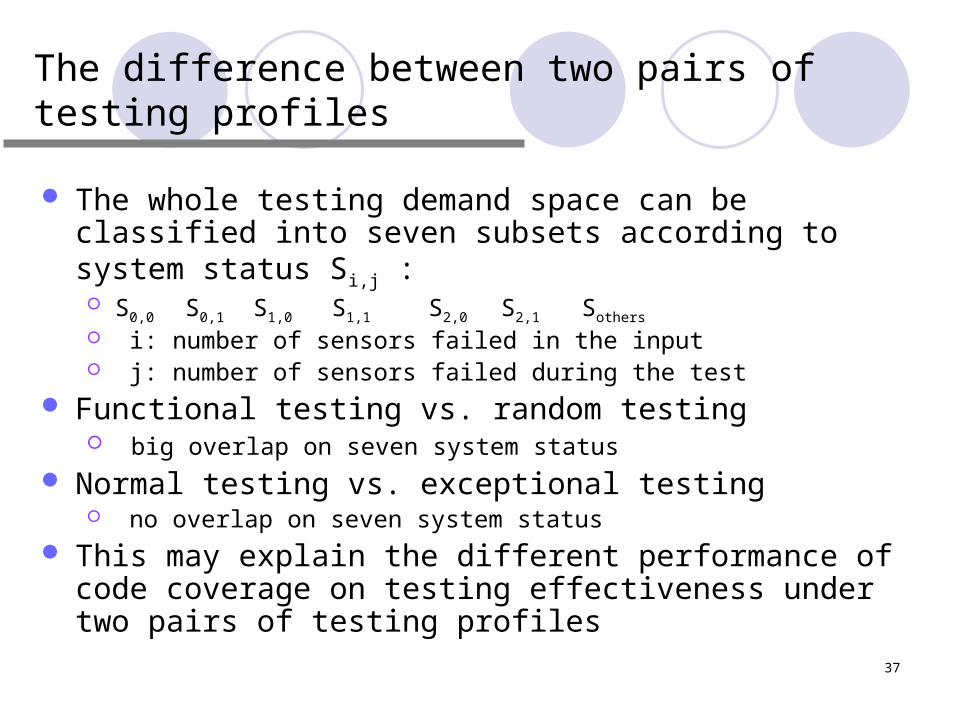
The difference between two pairs of testing profiles
The whole testing demand space can be classified into seven subsets according to system status Si,j : S0,0 S0,1 S1,0 S1,1 S2,0 S2,1 Sothers
i: number of sensors failed in the input j: number of sensors failed during the test
Functional testing vs. random testing big overlap on seven system status
Normal testing vs. exceptional testing no overlap on seven system status
This may explain the different performance of code coverage on testing effectiveness under two pairs of testing profiles
38
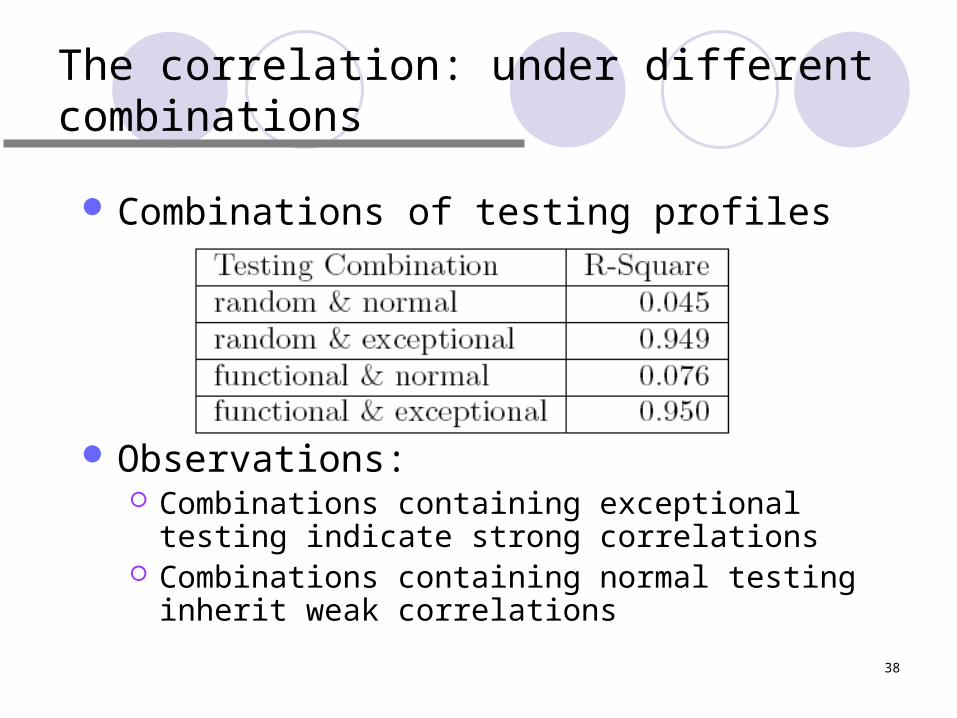
The correlation: under different combinations
Combinations of testing profiles
Observations: Combinations containing exceptional testing
indicate strong correlations Combinations containing normal testing inherit
weak correlations
39
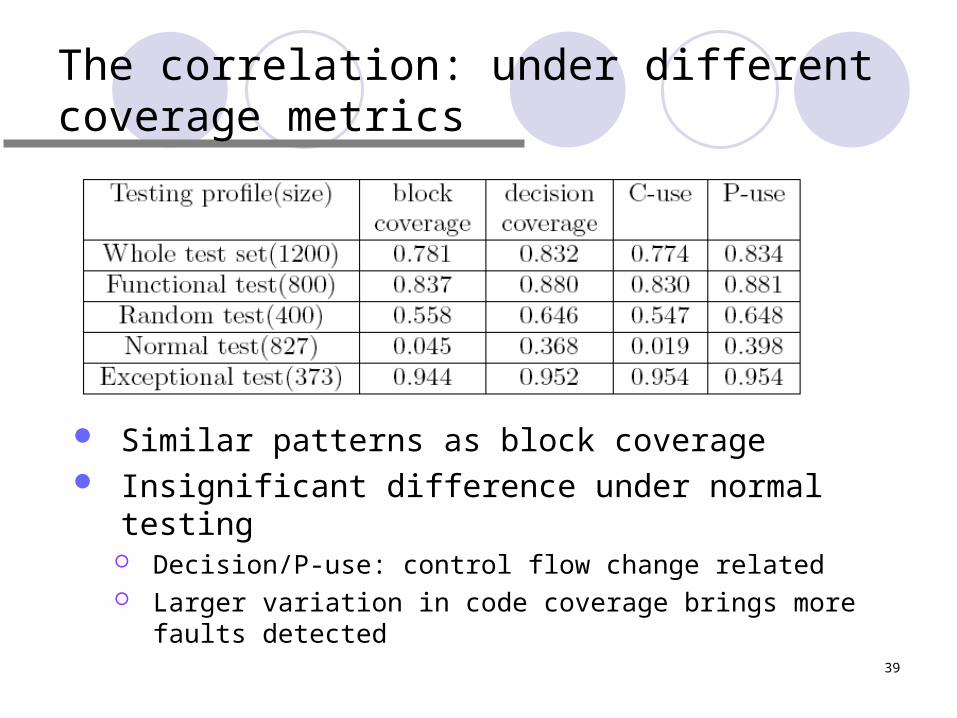
The correlation: under different coverage metrics
Similar patterns as block coverage Insignificant difference under normal testing
Decision/P-use: control flow change related Larger variation in code coverage brings more faults
detected
40
Discussions
1. Does the effect of code coverage on fault detection vary under different testing profiles?
A significant correlation exists in exceptional test cases, while no correlation in normal operational test cases.
Higher correlation is revealed in functional testing than in random testing, but the difference is insignificant.
2. Do different coverage metrics have various effects on such relationship?
Not obvious with our experimental data

41
Discussions (cont’)
This is the first time that the effect of code coverage on fault detection are examined under different testing profiles
Overall, code coverage is a moderate indicator for testing effectiveness
The correlation in small code coverage range is insignificant
Our findings of the positive correlation can give guidelines for the selection and evaluation of exceptional test cases
42
Future work
Generate 1 million test cases and exercise them on current 34 versions to collect statistical failure data
Conduct cross-comparison with previous project to investigate the “variant” and “invariant” features in design diversity
Quantify the relationship between code coverage and testing effectiveness

43
Conclusion
Survey on software fault tolerance evolution, techniques, applications and modeling
Evaluate the performance of current reliability models on design diversity
Investigate the effect of code coverage under different testing profiles and find it is a clear indicator for fault detection capability, especially for exceptional test cases

44
Q & A
Thank you!