Embed Size (px)
Citation preview

1
Texas Revenues, Medicaid & National Health Reform
TMA Select Committee on Medicaid, CHIP, and the
Uninsured February 13, 2010
Anne Dunkelberg, Assoc. Director, [email protected]
Center for Public Policy Priorities900 Lydia Street - Austin, Texas 78702
Phone (512) 320-0222 (X102) – www.cppp.org
www.texasvoiceforhealthreform.org

2
LBB’s Best Case ScenarioAssuming revenue growth matches growth in expenses
Current Budget
2012-13 Budget
General Revenue $75.0 billion $75.0 billion
ARRA (instead of GR) $6.4 billion $0
Cash on hand $2.4 billion $0
Property Tax Relief Fund carryover
$3.0 billion $0
Permanent School Fund $0 $1.2 billion
Other adjustments $0.2 billion -
TOTAL GR BUDGET $87.0 billion $76.2 billion
GAP $10.8 billion

3
Budget Scenario for 2012-13
$0
$25
$50
$75
$100
2002-03 2004-05 2006-07 2008-09 2010-11 2012-13
Local School Tax Cut (GR and PTF)
GR for Higher Ed
ARRA instead of GR
Other GR*
GR for HHS
Other GR for K-12
GR for Prisons
Additional GR Needed
$7 b
$1 b
None
$3 b
$3.3 b
$300 m
$700 m

4
Sources of State Revenue 2009Total $84.5 billion
Lottery, 2%
Licenses, Fees, Fines, Penalties, 9%
Interest,Investment Income, 2%
Other, 5%
Taxes, 45%
Federal Funds, 37%
Source: Comptroller of Public Accounts, Annual Cash Report

5Sources: Comptroller of Public Accounts, Annual Cash Report, Annual Property Tax Report.
Major State & Local Taxes in Texas, 2009
School26%
Special Districts
6%
County8%
City8%
Other State20%
Local 7%
State 25%
Sales Tax – 32%
Property Tax – 48%

6
How to Balance 2012-2013?Options for a Balanced Approach:
“Easy Money”
Potential Revenue for 2012-13
Economic growth with no change in revenue system
$800 million for each 1% growth
Smoke and mirrorsPayment delays, etc.
$1.5 billion

7
Funding a Balanced Approach: Rainy Day Fund
Rainy Day Fund Potential Revenue for 2012-13
Beginning balance $8.2 billion
Growth during 2012-13 $1.4 billion
TOTAL AVAILABLE $9.6 billionCurrent Balance: expected to reach $8 billion by end of fiscal 2011; another $922 million deposit slated for Fall 2011Uses:
1991: $29 million for public schools1993: $200 million for prisons2003: $1.2 billion — the entire balance that was projected at the time — was appropriated for CHIP and Medicaid shortfalls, retired teacher health care, and for brand-new Governor’s Enterprise Fund2005: $1.9 billion, for existing shortfalls, and for 2006-07 child protective services reforms and new Emerging Technology Fund
• 2/3 vote of each chamber needed to spend RDF “at any time and for any purpose”; slightly less (3/5 vote) required when state revenue is expected to drop in upcoming biennium

8
Options for a Balanced Approach:Potential Revenue for 2012-13
Eliminate Current Exemptions:
• Sales tax on business, professional services (Legal, stock & real estate broker, accounting, management consulting – except health care)
$5.6 billion
• Eliminate high-cost natural gas exemption $2.3 billion
• Eliminate recognition of optional % homestead exemption: $1.0 billion
• Eliminate freeport property tax exemption (constitutional) $850 million
• Eliminate 10% property tax appraisal cap (constitutional) $650 million
• Eliminate sales-tax timely filer and prepayment discounts $425 million
• Eliminate sales tax holiday $100 million
• Eliminate gasoline-tax collection allowance $100 million
• Eliminate CAPCO credits$100 million
• Eliminate ineffective tax exemptions $100 million
• Eliminate reimbursement of school taxes for local tax abatements $20 million

9
Options for a Balanced Approach:Potential Revenue for 2012-13 (more)
Increases to Existing Taxes:• Raise sales tax ½% (to 6.75% state/8.75% total, with
rebate for families in bottom 20% of income; 8 states would have
higher state rates) $3.0 billion• Increase franchise tax rate from 1% to 1.25%
(Retail from 0.5% to 0.625%) $2.1 billion• Raise gasoline tax by 5 cents per gallon (From 20¢
to 25¢ – 23 states now at 25¢ or higher) $1.6 billion– ($400 million to Available School Fund; $1.2 billion to State
Highway Fund)

10
Options for a Balanced Approach:Potential Revenue for 2012-13 (more)
Increases to Existing Taxes:
Raise cigarette tax From $1.41 to $2.00 per pack
15 states now at $2.00 or above $1.2 billionRaise motor vehicles sales tax by ½%From 6.25% to 6.75% $450 millionRaise beer taxFrom 11 cents to 17 cents per six-pack
Last raised in 1984; 15 states would be higher $100 million
11
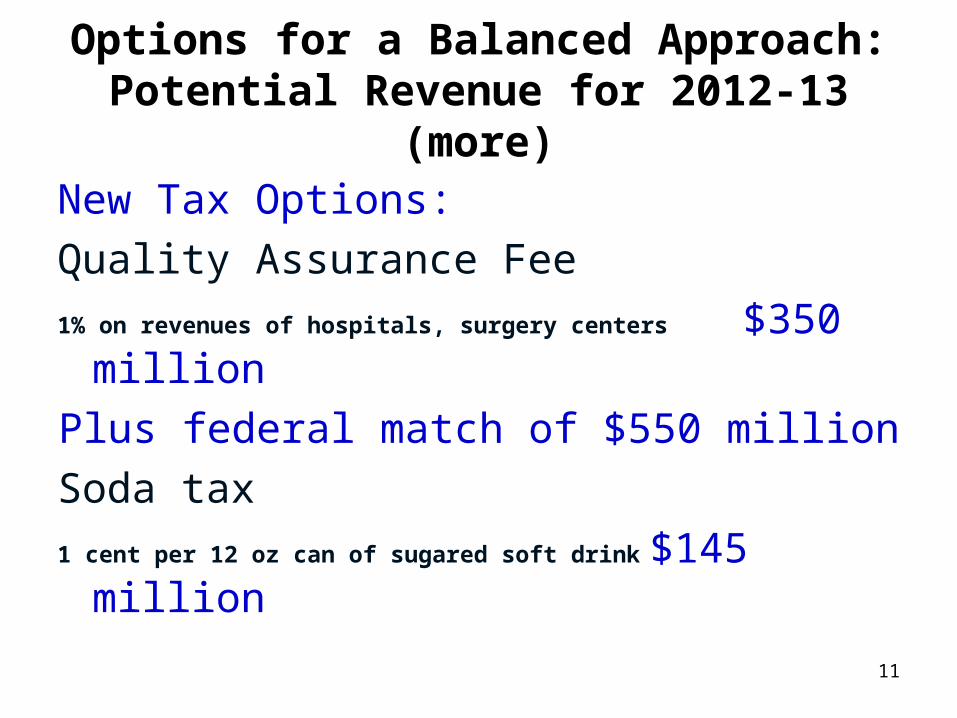
Options for a Balanced Approach:Potential Revenue for 2012-13 (more)
New Tax Options:
Quality Assurance Fee
1% on revenues of hospitals, surgery centers $350 million
Plus federal match of $550 million
Soda tax
1 cent per 12 oz can of sugared soft drink $145 million

12
Funding a Balanced Approach: Beyond this Session
Potential Revenue for Future Budgets
State personal income tax $14 billion net
(dedicated to education)
Eliminate school property tax abatements - Chap 313
$1.2 billion
Sales tax on Internet sales $1.2 billion
Sales price disclosure $350 million

13
Medicaid in 2010-2011 TX Budget• No National Reform effect (expansion begin 2014; no state share $$
until 2017)
• Avg. Budgeted Caseloads in SB 1 3,105,445 for 2010, 3,168,320 2011 “recipient-months”
• Actual January 1 enrollment 2,918,958; converts to 3.3 million
• Over 735 eligibility staff added since 9/1/09.
• Feb 1 HHSC report to LBB projects HHSC Medicaid about $387 million GR over budget by end of FY 2010 (i.e., just for current year).
• Texas getting 70.94% match now; 69.85% Jul-December. IF Congress extends 2 more quarters, worth $925 million to Texas.
• HHSC has no “official” projection of current budget shortfall yet.

14
Medicaid in 2010-2011 TX Budget• Shortfall numbers make it obvious: without more revenue, there WILL be
deep cuts.
• In 2003, Provider Rates were the largest category of cut. After partial restorations, the total projected reduction in Medicaid and CHIP rates was about $599 million.
• Federal law Medicaid maintenance of effort required:
– From BBA 1997 (CHIP Statute): States cannot adopt Medicaid eligibility criteria that are more restrictive than those in effect as of June 1, 1997.
– ARRA 2009 (stimulus): States cannot make eligibility standards, methodologies, or procedures stricter than 7/1/2008; includes disability standards or numbers served in community care waivers.
– If health reform passes, additional MOEs will apply: children in Medicaid and CHIP through 2019; adults until Health Insurance Exchanges operational in 2014.
• That leaves provider rates and “optional” adult benefits to cut
– 2003 Lawmakers rejected certain cuts: cutting off community care and nursing home care; eliminating Rx coverage for aged, disabled, and adult clients
– They DID eliminate services of LPCs, SWs, psychologists, LMFTs, podiatrists, and chiropractors; and adult eyeglasses and hearing aids. (Restored in 2005)

15
How National Health Reform Fits In: Texas Update

16
Only the Highest-Income Families Have Better-Than-U.S.-Average Chance of Being Insured
Texas average: 25.1%
Source: CPS Annual Social & Econ. Supplementwww.census.gov/hhes/www/hlthins/hlthins.html
12%
29%
35%
42%
Below poverty 100 to 200% ofpoverty
200 to 300% ofpoverty
Above 300% ofpoverty
11%
16%
24%
34% 36%
Below $25,000 $25,000 to $49,999 $50,000 to $74,999 $75,000 to $99,999 $100,000 and over

17
57.4 56.253 53 54 53.1 52.2
50.4 49.5
64.2 63.2 61.9 61 60.5 60.2 59.7 59.3 58.5
30
45
60
75
2000 2001 2002 2003 2004 2005 2006 2007 2008
% of Residents With Job-Based Insurance
Employer-Sponsored Coverage Declining in Texas and Nationwide, Even Before Recession
U.S. Average
Texas
Source: CPS Annual Social & Econ. Supplementwww.census.gov/hhes/www/hlthins/hlthins.html

18
• Key elements of both bills:– Build on current system (Senate bill especially leaves curernt coverage potentially
unchanged for years)
– Medicaid expansion: cover all up to 133% or 150% FPL ($14,404-$16,245 for one; $29,327-$33,075 for 4).
– Reform Private Health Insurance: standardize benefits, no price variation for gender or occupation, limited age variation, no denial of coverage, no excluding pre-existing conditions, no annual or lifetime maximums. Changes first for uninsured, individual, small employer coverage.
– New Health Insurance Exchange(s) where private insurers’ options can be compared and purchased (like Amazon or Travelocity for insurance).
• May or may not include Public or Non-profit plan option?
• HIE is only a framework: effectiveness depends on subsidies, market reforms, standardized benefits, individual mandate, negotiating powers.
– Premium assistance up to 400% of FPL ($88,200 for family of 4)
– Out-of-pocket subsidies (reduces out of pocket for all consumers) and stop-loss caps, too, to increase affordability reduce medical bankruptcy
– Individual mandate to have coverage (with exemptions)
– Some Requirements for employers to contribute, with exemptions for small employers
Health Reform Basics

19
Texas Uninsured by Income Today……6.1 million uninsured in 2008
300-400% FPL$66,200-$88,200
200-250% FPL$44,100-$55,100
250-300% FPL$55,100-$66,200
150-200% FPL$33,100-$44,100
>400% FPL>$88,200 <100% FPL
<$22,100/yr for family of four
100-150% FPL$22,100-$33,100
682K
622K
751K1.06
Million
1.611 Million
484K
Annual income limits given for a family of four, 2009 federal poverty level U.S. Census, CPS
898K

20
……And if House Bill Implemented TomorrowCBO: 4.7 to 4.8 million out of 6.1 million gain coverage
<100% FPL
300-400% FPL
>400% FPL
100-150% FPL
250-300% FPL
150-200% FPL200-250% FPL
682K
622K
1.6 Million
1.611 Million
Up to 1.8 million in Medicaid:• 1.3 million expansion to 150% FPL (adults)•500K already- eligible (kids)
2.0 million 150-400% FPL qualify
for help w/premiums, out-of-pocketIn Exchange
751K
484K
898K

21
Who Remains Uninsured?
• CBO assumes small percentage opt not to be covered (no penalty for lowest income and penalties much lower than cost of coverage)
• If premium subsidies lower, (Senate version concerns), larger share of low- & moderate income may stay uninsured.
• Undocumented: – no Medicaid/CHIP, – no premium subsidy, possibly cannot buy @ full cost from
exchange– Best estimates say 40% of undocumented in US TODAY have
private coverage• Legal Permanent Residents:
– continued exclusion from Texas Medicaid, – May be barred from subsidy, too, in first 5 years in US

22
• Medicaid expansion—up to 133% FPL(S) or 150% FPL (H)
• “Static” Illustration based on current US Census data and Texas Medicaid costs:
• HOUSE: – in 2008, 1.3 million uninsured Texas adults aged 19-64 who (a) are U.S. citizens and (b) have incomes below 150%
FPL. – At 2009 cost of ~ $305 per adult/mo., covering 1.3 million more adults = about $4.7 billion in new health care
spending. – Under HR 3962, Feds pay 100% of costs for 2 years, and 91% after that.
– In year 3, Texas’ 9% state share of the $4.7 billion would be would be about $421 million,
– And Feds pay the remaining $4.25 billion. – In other words, about ten federal dollars in for every one state dollar. – Plus multiplier effect of over $12.5 Billion (economic multiplier of 3.25 per
Perryman). (↑State tax revenues + ↓Local taxes avoided) nearly = GR costs
• Lesson: Medicaid expansion, while not “free” for Texas, will yield substantial economic benefits.
• Texas economy will also benefit from federal premium assistance and out-of-pocket cost help to families from 150-400% FPL, which will not require any state budget contribution at all.
Fiscal Benefit/Cost of Health Reform to State

23
• Medicaid expansion—up to 133% FPL(S); same “Static” Illustration based on current US Census data and Texas Medicaid costs:
• SENATE: – in 2008, 1.0 million uninsured Texas adults aged 19-64 who (a) are U.S. citizens and (b)
have incomes below 133% FPL. – At 2009 cost of ~ $305 per adult/mo., covering 1.3 million more adults = about $4.7
billion in new health care spending. – Under HR 3590, Feds pay 100% of costs for 3 years: 2014, 2015, 2016– In 2017 the Texas would pay about 5.14% or $188 million, with the federal share $3.47
Billion– In 2018, Texas would pay 6.14% or $225 million, with the federal share $3.44 Billion– In 2019 and thereafter, Texas would pay 7.14% or $261 million, with the federal
share $3.4 billion. • $18 federal dollars for each $1 the state spent in 2017 on expanded Medicaid
coverage;• $15 federal dollars for each $1 the state spent in 2018; and• $13 federal dollars for each $1 the state spent in 2019 and thereafter
– Plus economic multiplier of 3.25 per Perryman
Fiscal Benefit/Cost of Health Reform to State

24
Welcome Mat Effect• States that cover all children found that 50%+ of enrollment after
reforms were kids already eligible before reform but not enrolled: “Welcome Mat” effect.
• No Individual Mandate penalties apply to Texans below 100% FPL who remain uninsured, but based on other states, over time more of our currently-eligible Texas children will enroll in Medicaid.
• Because Texas has very limited eligibility for adults today, there is very low risk of Medicaid welcome mat effect for adults.)
• UNLIKE state costs for newly-eligible adults largely borne by federal budget, strong welcome mat response by already-eligible uninsured Texas children would add significant cost to the state budget, because state will be responsible for standard Medicaid share of just under 40% for those children.
• If welcome mat effect were as powerful as 12-month enrollment projected to be, the GR annual costs (at current costs and demographics) could amount to $200 to $350 million (LBB vs. HHSC).
• If 100% of the 440,000 Medicaid currently-eligible uninsured children were to enroll today, the current annual cost to the state budget would range from about $350 million to $466 million (LBB vs. HHSC costs), based on the “usual” state’s share of ~39%.

25
Illustration: How House Bill Would Change Texas Medicaid Budget
Fed Share Expansion
Adults$4.25 Billion
State Share Expansion
Adults$421 million
Fed Share 2008
$10.8 Billion
State Share 2008
$7.0 Billion
State Share Welcome Mat
Kids: $400 million
Fed Share Welcome Mat
Kids : $600 million Baseline “Now” = Projected Texas
Medicaid Services Spending, 2008 (Texas HHSC)
Note: this does NOT model increased admin costs.
If Covered 1.3 million new adults; 400K kids, @ Current costs and demographics

26
Top Advocate Concerns for Final Bill
Affordability remains the top focus of consumer and low-income advocates, and the experts we trust the most continue to advocate for these provisions in the compromise bill:
(1) House bill’s superior premium assistance for people under 250% FPL;
(2) Senate premium assistance for people between 250-400% FPL.
(3) House’s superior cost-sharing subsidies (which reduce out-of-pocket costs) for all incomes.
(4) House’s broader expansion of Medicaid to 150% FPL.
(5) House’s Medicaid primary care payment rate increases.
(6) National Health Insurance Exchange in House bill, or dramatically stronger minimum standards and federal oversight than in Senate bill at minimum.

27
Roles/Functions
• Possible Administration of Health Insurance Exchange
– Senate: State or NFP must operate by 1/2014, or feds will do it; grant $$ available
– Likely includes major enrollment/subsidy eligibility function
– HIEs are to be $$ self-sustaining after first year
• Much Greater Role for TDI in Regulation
• Medicaid eligibility system enhancement CRITICAL
– Accommodate both expansion & increased participation
– Smooth interface with HIE system
– HIE may pay state to do income eligibility for subsidies
Other New Roles, Costs for State

28
Other New Roles, Costs for State(cont’d.)
Costs
• In addition to max. 9% share of Medicaid expansion & (possible) reimbursement increases from 2015 (H) or 2017 forward (S); and welcome mat kid costs…
• Admin costs for state of expanded enrollment presumably @ 50%; financing of HIE interface costs unclear
• Increased costs of doing business passed through in Medicaid rates.
Issues
• Will a Texas Executive opposed to reform implement new state functions competently?
• 9% share--even offset 9-to-1 with federal funds--must be funded in stated budget, and in context of a severe structural deficit in our state tax system.

29
Use of This Presentation
The Center for Public Policy Priorities encourages you to reproduce and distribute these slides, which were developed for use in making public presentations.
If you reproduce these slides, please give appropriate credit to CPPP.
The data presented here may become outdated.
For the most recent information or to sign up for our free E-Mail Updates, visit www.cppp.org.
© CPPP
Center for Public Policy Priorities900 Lydia StreetAustin, TX 78702
P 512/320-0222 F 512/320-0227

30
Resource Slides

31
2010-11 Biennial State Budget
Source: Legislative Budget Board, Fiscal Size Up 2010-11
Other K-1222%Other K-12
28%
Property tax cuts 12%
Property tax cuts 8%
Higher Ed 13%
Higher Ed 16%
HHS 33%
HHS 27%
Prisons 3%
Prisons 7%
Highways 10%
All Other 10%
All Other 9%
$0
$50
$100
$150
$200
General Revenue $80.6 billion All Funds $182.2 billion
91%
77%

32
How Would An Income Tax Work?
$13.7 billion $2.2 billion
$4.6 billion Two-thirds of income tax revenue would be returned to taxpayers through lower property tax rates
Uncle Sam would pick up 10% of the cost of an income tax through higher deductions on federal tax returns
Net cost to Texas taxpayers after lower property taxes, federal tax deduction changes
Total income tax revenue = $20.5 billion
annually

33Source: Comptroller of Public Accounts, Annual Cash Report.
State Tax Collections 2009Total $37.8 billion
Sales56%
Motor Vehicle Sales
and Rental7%
Motor Fuels8%
Sin (Cigarette, Tobacco,
Alcohol)
6%
Franchise11%
Gas/Oil Production
6%
Insurance3%Other
3%

34
100-200% FPL, 464K
300-400% FPL, 108K <100% FPL,
446K
200-300% FPL, 282K
> 400% FPL, 118K
Uninsured Texas Children, (0-
18) 2007-2008
By Family Income
Total uninsured
children: 1.418 million
US Census, March 2008 & 2009 CPS

35
Income Caps for Texas Medicaid and CHIP, 2009
0%
50%
100%
150%
200%
250%
PregnantWomen
Newborns Age 1-5 Age 6-18 TANFparent of
2, noincome
WorkingParent of
2
SSI (agedor
disabled)
LongTermCare
CHIP
Mandatory Optional
$24,352/yr
$33,874/yr $33,874/yr
185% 185%
133%
$18,310
100%$2,256 $3,696
12.3% 20.2%74%
$7,884
222%
$24,264$36,620
200%
Income Limit as Percentage of Federal Poverty IncomeAnnual Income is for a family of 3,
except Individual Incomes shown for SSI and Long Term Care

36
Texas Medicaid: Who it Helps
Children, 1,944,555
Disabled, 359,937
Elderly, 374,395
Poor Parents, 91,838
TANF Parent, 30,758
Maternity, 96,036
October 2009, HHSC data.
Total enrolled 10/1/2009: 2.97 million

37
Uninsured Texans by Age Group, 200865+
0-18
19-64Rate: 32% of
19-64 are Uninsured
Rate: 20% of 0-18 are uninsured
~2/3 are below
200% FPL57% are below
200% FPL
Source: U.S. Census

38
Texas Worst Among the States
Texas: 24.1%
Massachusetts: 4.1%
U.S. average: 15.1%
All Ages, 2008

39
Almost All Congressional Districts Worse than U.S. Average
% Uninsured (All Ages) by U.S. Congressional District, 2008
U.S. average: 15.1% — Texas average: 24.1%
Inset: Dallas/ Fort Worth
Inset: Houston Area
District 3
District 26
2432
7
District 16
2815
27
2520

40
0
5
10
15
Under 19 19 to 64 65 and over
Millions of Texans
Job-based coverage Medicaid Medicare Uninsured
Working-Age Texans Are Most Likely to be Uninsured
19% uninsured
3% uninsured
32% uninsured
Source: CPS Annual Social & Econ. Supplementwww.census.gov/hhes/www/hlthins/hlthins.html

41
Employed65%
Unemployed7%
Not in Labor Force28%
Uninsured by Labor Force Status, 2007-08 Average
2 Out of 3 Uninsured Working-Age Texans Have a Job
Source: CPS Annual Social & Econ. Supplementwww.census.gov/hhes/www/hlthins/hlthins.html

42
U.S.-born citizen
68%
Naturalized U.S. Citizen
6%
Not a U.S. Citizen
26%
Uninsured by Citizenship Status, 2007-08 Average
Most Uninsured Texans are U.S. Citizens(6.1 million Uninsured in 2008)
Source: CPS Annual Social & Econ. Supplementwww.census.gov/hhes/www/hlthins/hlthins.html
4.1 million352,000
1.6 million (~40%
legal immigrants)