Embed Size (px)
Citation preview
edchoice.org/123s
THE 123s OF SCHOOL CHOICEWhat the research says about private school
choice programs in America
Last Updated 04/14/21
1
There are currently
in
with more than
across the country.
69 private school choice programs and policies operating
33 states, Washington, D.C., and Puerto Rico
1,355,152 familiesparticipating
2
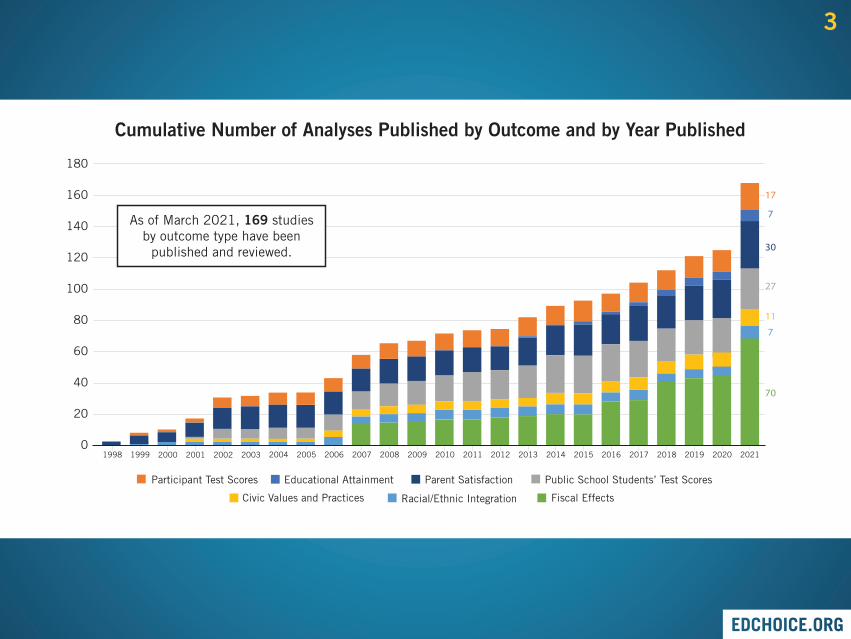
Cumulative Number of Analyses Published by Outcome and by Year Published
2019 2020 2021201820172016201520142013201220112010200920082007200620052004200320022001200019991998
180
160
140
120
100
80
60
40
20
0
Parent SatisfactionParticipant Test Scores Public School Students’ Test ScoresEducational Attainment
Fiscal EffectsRacial/Ethnic IntegrationCivic Values and Practices
As of March 2021, 169 studies by outcome type have been
published and reviewed.
7
17
7
27
11
70
30
3
It’s imperative that we understand the effectiveness of these programs. Therefore, researchers have studied
them for decades.
4
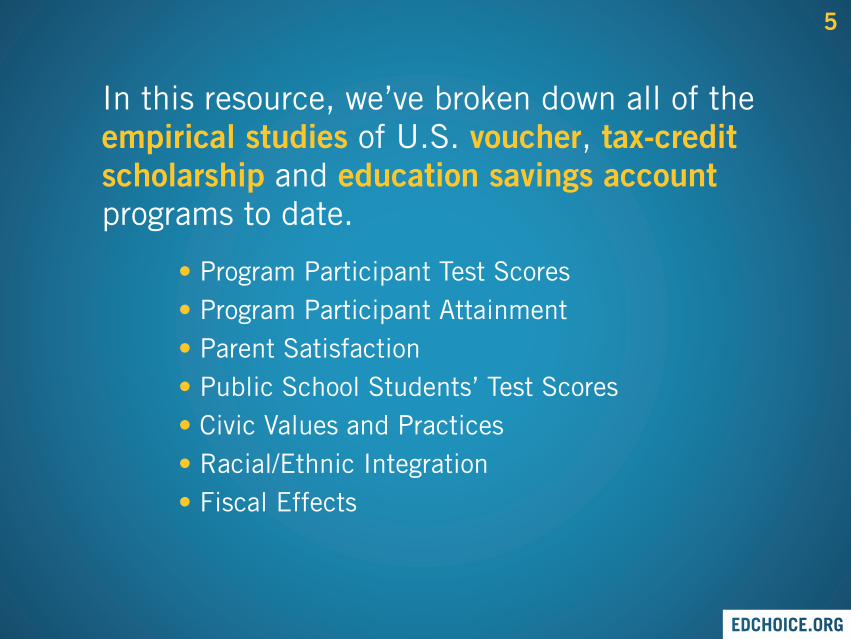
In this resource, we’ve broken down all of the empirical studies of U.S. voucher, tax-credit scholarship and education savings account programs to date.
• Program Participant Test Scores• Program Participant Attainment • Parent Satisfaction • Public School Students’ Test Scores• Civic Values and Practices • Racial/Ethnic Integration • Fiscal Effects
5
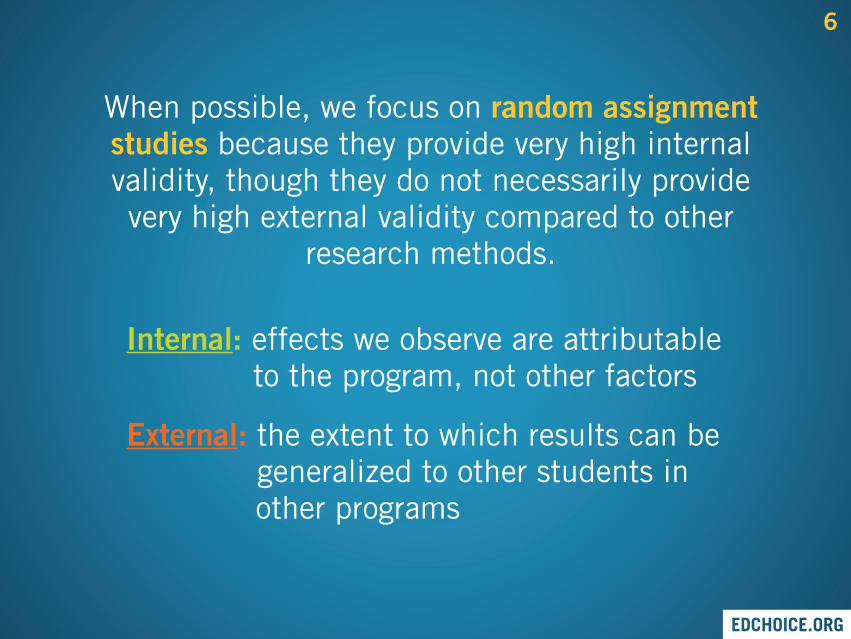
When possible, we focus on random assignment studies because they provide very high internal validity, though they do not necessarily provide very high external validity compared to other
research methods.
Internal: effects we observe are attributable to the program, not other factors
External: the extent to which results can be generalized to other students in other programs
6
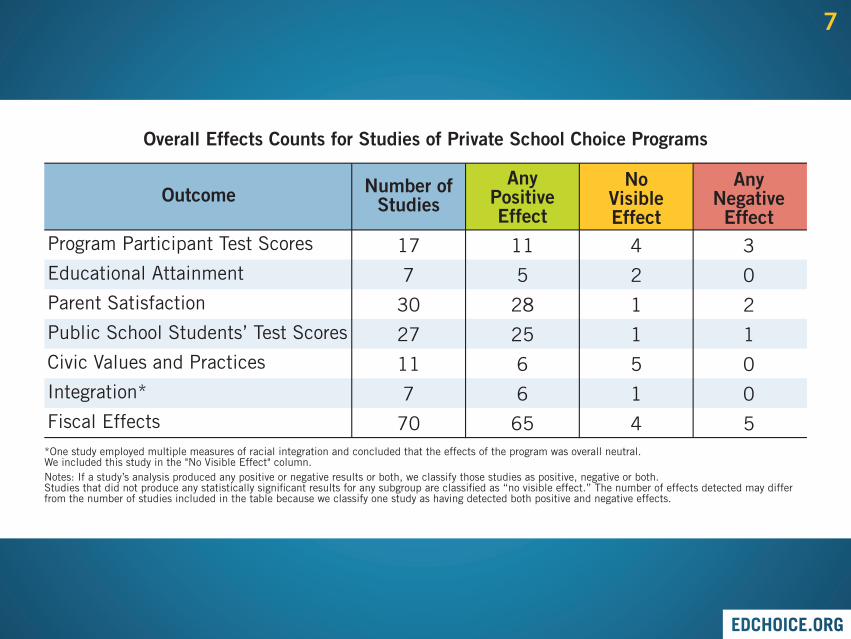
Overall Effects Counts for Studies of Private School Choice Programs
Program Participant Test Scores
Educational Attainment
Parent Satisfaction
Public School Students’ Test Scores
Civic Values and Practices
Integration*
Fiscal Effects
17
7
30
27
11
7
70
11
5
28
25
6
6
65
4
2
1
1
5
1
4
3
0
2
1
0
0
5
Number of StudiesOutcome
Any Positive Effect
No VisibleEffect
Any Negative Effect
*One study employed multiple measures of racial integration and concluded that the effects of the program was overall neutral. We included this study in the "No Visible Effect" column.Notes: If a study’s analysis produced any positive or negative results or both, we classify those studies as positive, negative or both. Studies that did not produce any statistically significant results for any subgroup are classified as “no visible effect.” The number of effects detected may differ from the number of studies included in the table because we classify one study as having detected both positive and negative effects.
7
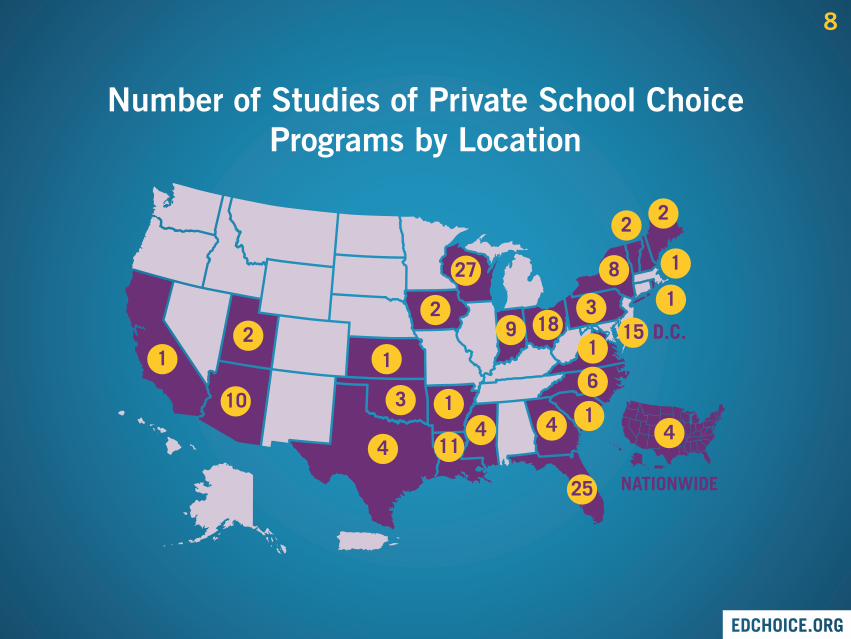
Number of Studies of Private School Choice Programs by Location
1518
6
8
11
27
D.C.
25
410
9
1
4
1
4
22
3
2
11
11
2 3 1
NATIONWIDE
4
8
PROGRAM PARTICIPANTTEST SCORES
9
These studies examine whether students who receive and/or use scholarships to attend a
private school of their choice achieve higher test scores than students who applied for, but
did not receive or use scholarships.
10
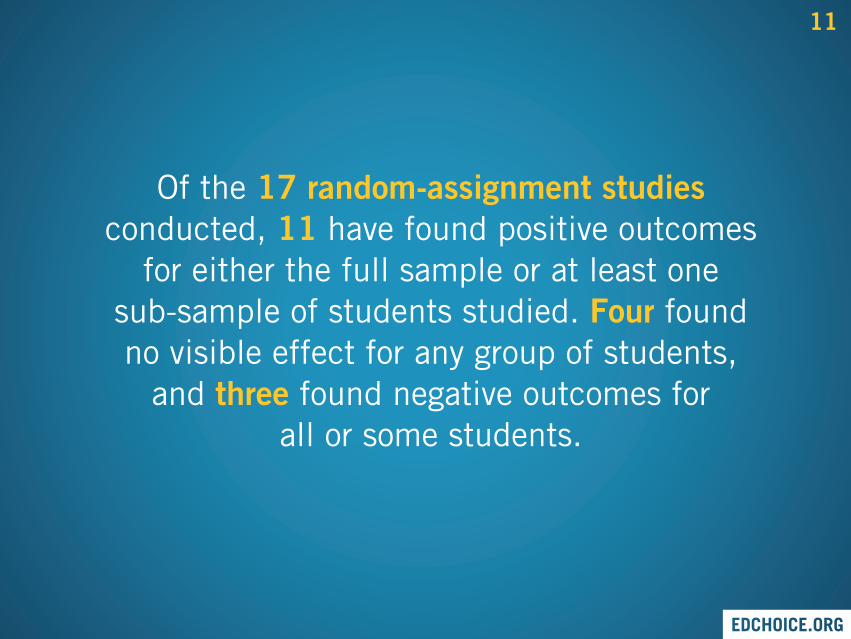
Of the 17 random-assignment studies conducted, 11 have found positive outcomes
for either the full sample or at least one sub-sample of students studied. Four found no visible effect for any group of students,
and three found negative outcomes for all or some students.
11
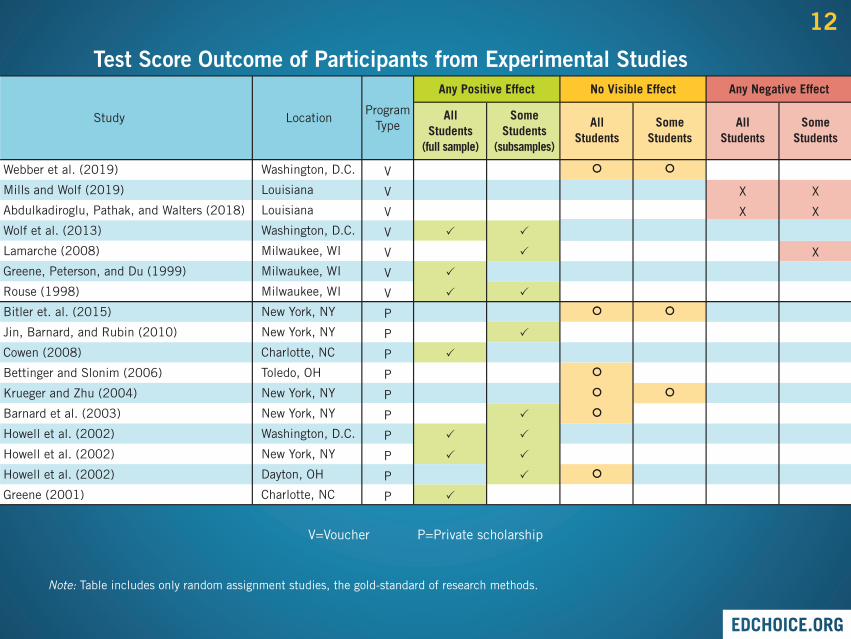
Note: Table includes only random assignment studies, the gold-standard of research methods.
V=Voucher P=Private scholarship
Study LocationProgram
Type
Any Positive Effect
AllStudents
(full sample)
SomeStudents
(subsamples)
AllStudents
SomeStudents
AllStudents
SomeStudents
No Visible Effect Any Negative Effect
�
�
�
�
�
�
�
�
�
�
�
�
�
�
�
��
��
������
��
��
��
��
X
X
X
X
X
Washington, D.C.
Louisiana
Louisiana
Washington, D.C.
Milwaukee, WI
Milwaukee, WI
Milwaukee, WI
New York, NY
New York, NY
Charlotte, NC
Toledo, OH
New York, NY
New York, NY
Washington, D.C.
New York, NY
Dayton, OH
Charlotte, NC
V
V
V
V
V
V
V
P
P
P
P
P
P
P
P
P
P
Webber et al. (2019)
Mills and Wolf (2019)
Abdulkadiroglu, Pathak, and Walters (2018)
Wolf et al. (2013)
Lamarche (2008)
Greene, Peterson, and Du (1999)
Rouse (1998)
Bitler et. al. (2015)
Jin, Barnard, and Rubin (2010)
Cowen (2008)
Bettinger and Slonim (2006)
Krueger and Zhu (2004)
Barnard et al. (2003)
Howell et al. (2002)
Howell et al. (2002)
Howell et al. (2002)
Greene (2001)
Test Score Outcome of Participants from Experimental Studies
12
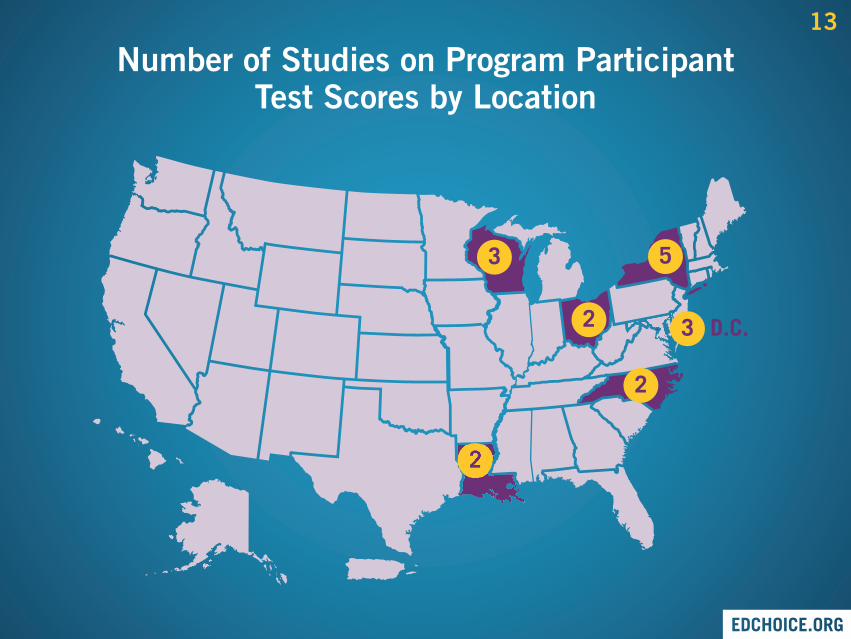
Number of Studies on Program ParticipantTest Scores by Location
32
2
5
2
3
D.C.
13
PROGRAM PARTICIPANT ATTAINMENT
14
These studies examine whether school choice programs have an effect on students’
likelihood to graduate high school, enroll in college or attain
a college degree.
15
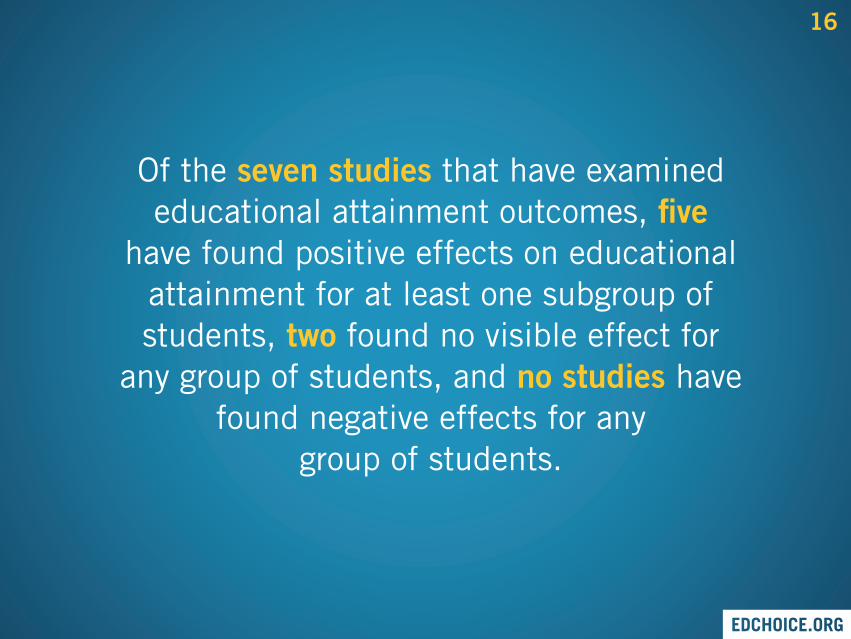
Of the seven studies that have examined educational attainment outcomes, five
have found positive effects on educational attainment for at least one subgroup of students, two found no visible effect for
any group of students, and no studies have found negative effects for any
group of students.
16
Study LocationProgram
Type
Any Positive Effect
AllStudents
(full sample)
SomeStudents
(subsamples)
AllStudents
(full sample)
SomeStudents
(subsamples)
AllStudents
(full sample)
SomeStudents
(subsamples)
No Visible Effect Any Negative Effect
�
�
�
�
�
�
�
��
��
��
��
��
Indiana
Washington, D.C.
Milwaukee, WI
Louisiana
Washington, D.C.
Florida
New York, NY
V
V
V
V
V
TCS
P
Austin and Pardo (2021)
Chingos et al. (2019)
Chingos et al. (2019)
Erickson, Mills, and Wolf (2019)
Wolf et al. (2013)
Chingos et al. (2019)
Cheng and Peterson* (2020)
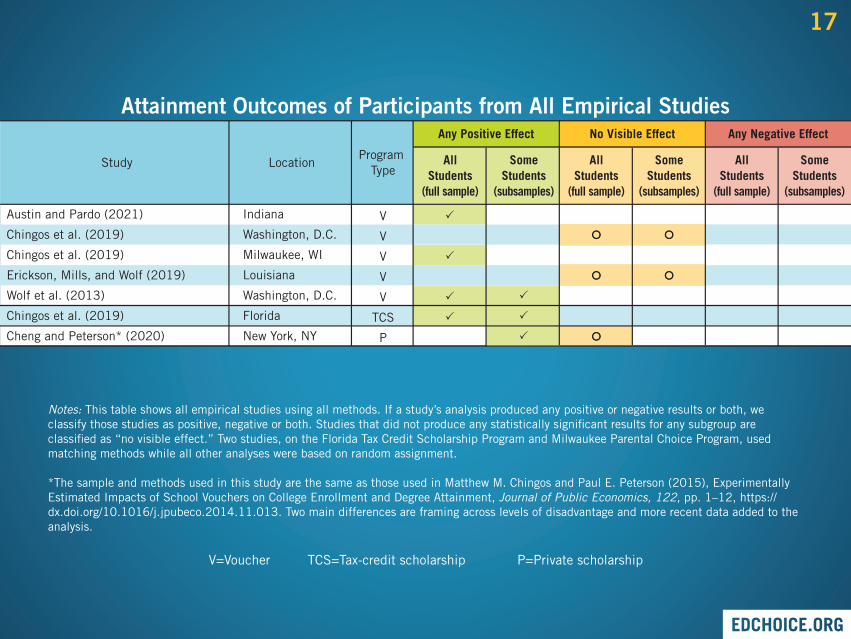
Attainment Outcomes of Participants from All Empirical Studies
Notes: This table shows all empirical studies using all methods. If a study’s analysis produced any positive or negative results or both, we classify those studies as positive, negative or both. Studies that did not produce any statistically significant results for any subgroup are classified as “no visible effect.” Two studies, on the Florida Tax Credit Scholarship Program and Milwaukee Parental Choice Program, used matching methods while all other analyses were based on random assignment.
*The sample and methods used in this study are the same as those used in Matthew M. Chingos and Paul E. Peterson (2015), Experimentally Estimated Impacts of School Vouchers on College Enrollment and Degree Attainment, Journal of Public Economics, 122, pp. 1–12, https://dx.doi.org/10.1016/j.jpubeco.2014.11.013. Two main differences are framing across levels of disadvantage and more recent data added to the analysis.
V=Voucher TCS=Tax-credit scholarship P=Private scholarship
17
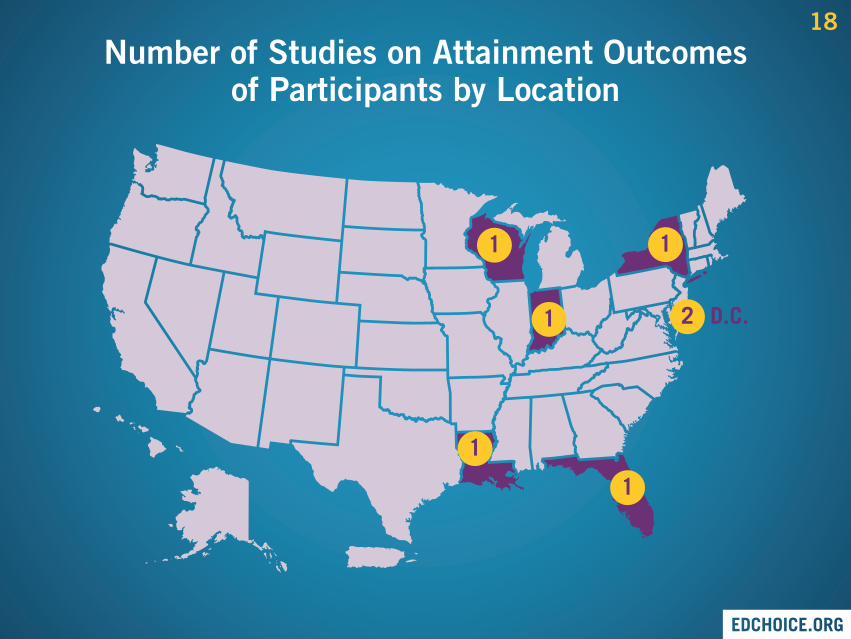
Number of Studies on Attainment Outcomes of Participants by Location
2
1
1
1
1
1
D.C.
18
PARENT SATISFACTION
19
These studies rely on polling and surveys to measure the extent to which parents with
children participating in private school choice programs are satisfied with their current
school compared to their pre-program school or to non-program students.
20
Of the 30 studies that have examined school choice’s impact on parent
satisfaction, 28 found positive outcomes. One found null results, and two found overall negative outcomes.
21
Continues on next slide.
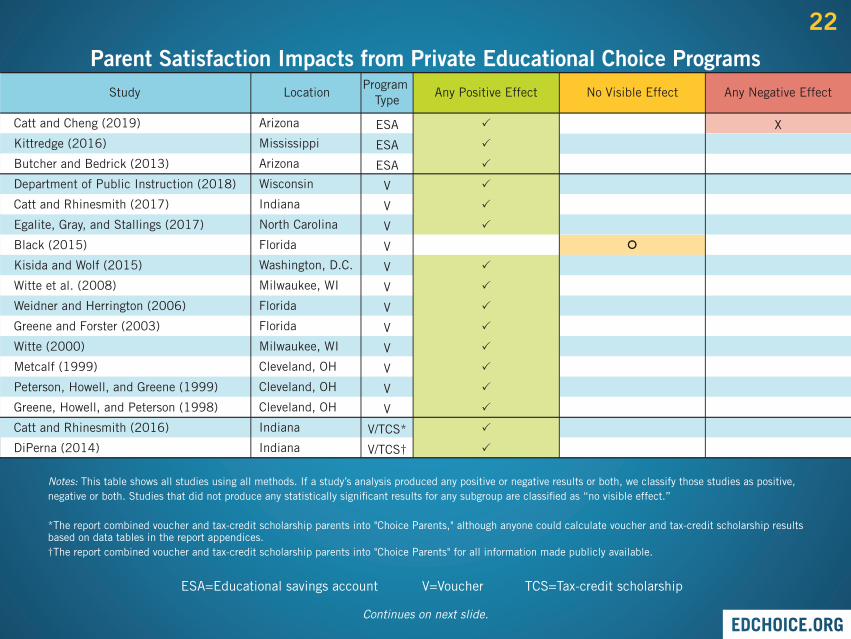
V=Voucher TCS=Tax-credit scholarshipESA=Educational savings account
Study LocationProgram
TypeAny Positive Effect No Visible Effect Any Negative Effect
�
�
�
�
�
�
�
�
�
�
�
�
�
�
�
�
Arizona
Mississippi
Arizona
Wisconsin
Indiana
North Carolina
Florida
Washington, D.C.
Milwaukee, WI
Florida
Florida
Milwaukee, WI
Cleveland, OH
Cleveland, OH
Cleveland, OH
Indiana
Indiana
ESA
ESA
ESA
V
V
V
V
V
V
V
V
V
V
V
V
V/TCS*
V/TCS†
Catt and Cheng (2019)
Kittredge (2016)
Butcher and Bedrick (2013)
Department of Public Instruction (2018)
Catt and Rhinesmith (2017)
Egalite, Gray, and Stallings (2017)
Black (2015)
Kisida and Wolf (2015)
Witte et al. (2008)
Weidner and Herrington (2006)
Greene and Forster (2003)
Witte (2000)
Metcalf (1999)
Peterson, Howell, and Greene (1999)
Greene, Howell, and Peterson (1998)
Catt and Rhinesmith (2016)
DiPerna (2014)
Parent Satisfaction Impacts from Private Educational Choice Programs
X
��
Notes: This table shows all studies using all methods. If a study’s analysis produced any positive or negative results or both, we classify those studies as positive, negative or both. Studies that did not produce any statistically significant results for any subgroup are classified as “no visible effect.”
*The report combined voucher and tax-credit scholarship parents into "Choice Parents," although anyone could calculate voucher and tax-credit scholarship results based on data tables in the report appendices. †The report combined voucher and tax-credit scholarship parents into "Choice Parents" for all information made publicly available.
22
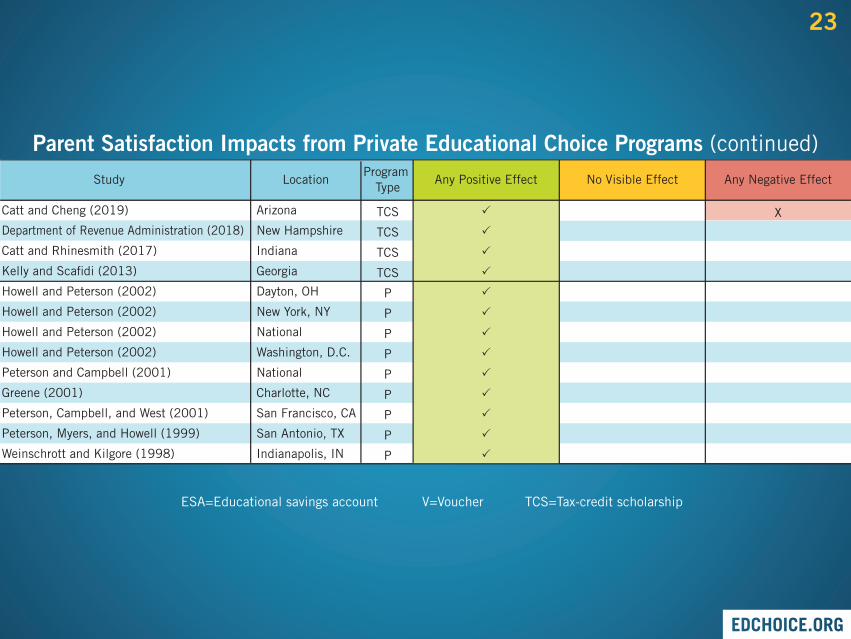
V=Voucher TCS=Tax-credit scholarshipESA=Educational savings account
Study LocationProgram
TypeAny Positive Effect No Visible Effect Any Negative Effect
�
�
�
�
�
�
�
�
�
�
�
�
�
Arizona
New Hampshire
Indiana
Georgia
Dayton, OH
New York, NY
National
Washington, D.C.
National
Charlotte, NC
San Francisco, CA
San Antonio, TX
Indianapolis, IN
TCS
TCS
TCS
TCS
P
P
P
P
P
P
P
P
P
Catt and Cheng (2019)
Department of Revenue Administration (2018)
Catt and Rhinesmith (2017)
Kelly and Scafidi (2013)
Howell and Peterson (2002)
Howell and Peterson (2002)
Howell and Peterson (2002)
Howell and Peterson (2002)
Peterson and Campbell (2001)
Greene (2001)
Peterson, Campbell, and West (2001)
Peterson, Myers, and Howell (1999)
Weinschrott and Kilgore (1998)
Parent Satisfaction Impacts from Private Educational Choice Programs (continued)
X
23
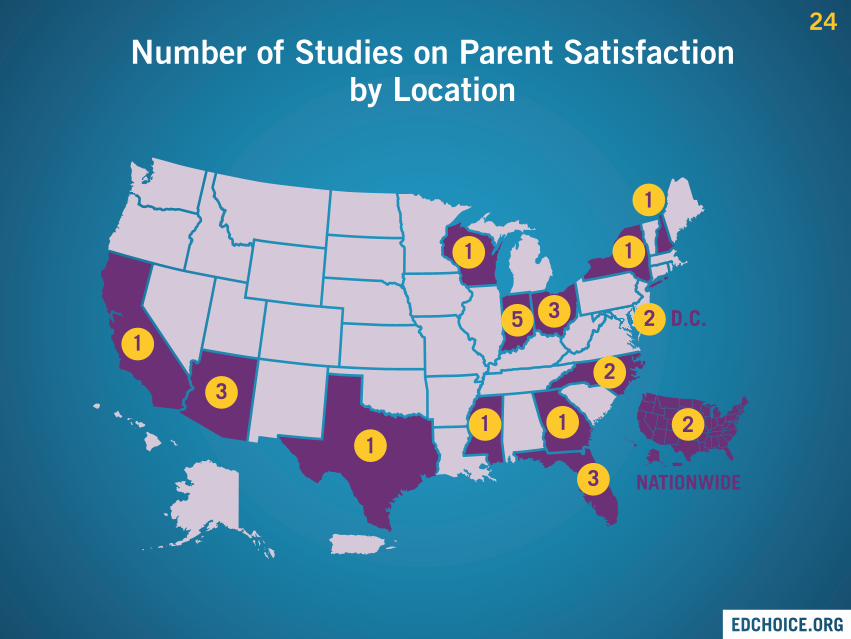
Number of Studies on Parent Satisfaction by Location
23
2
1
1
11
3
3
1
1
5
1
D.C.
NATIONWIDE
2
24
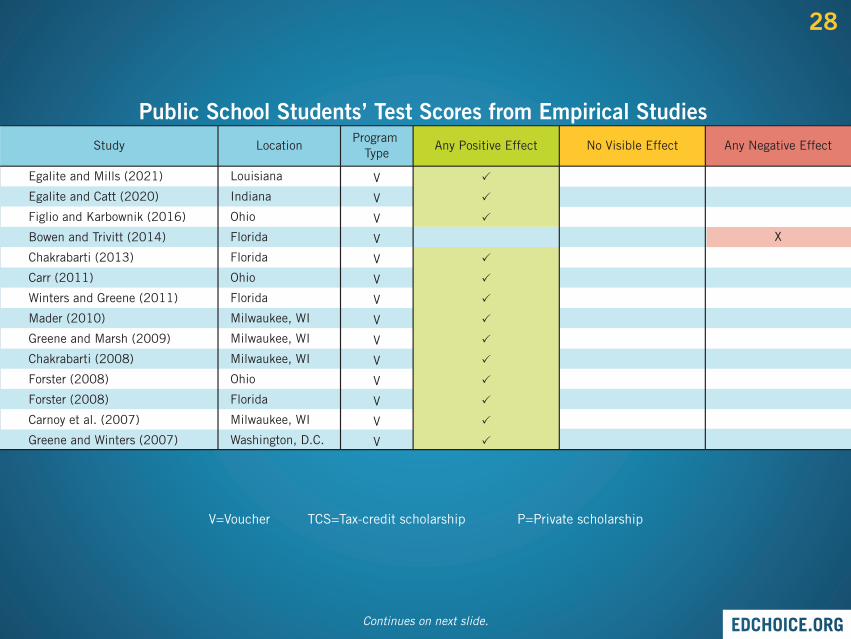
PUBLIC SCHOOL STUDENTS' TEST SCORES
25
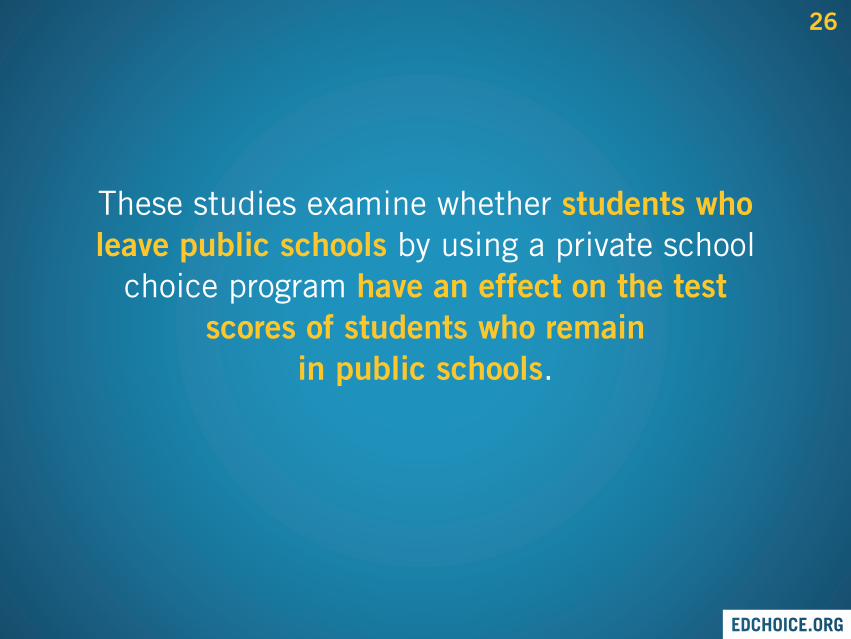
These studies examine whether students who leave public schools by using a private school
choice program have an effect on the test scores of students who remain
in public schools.
26
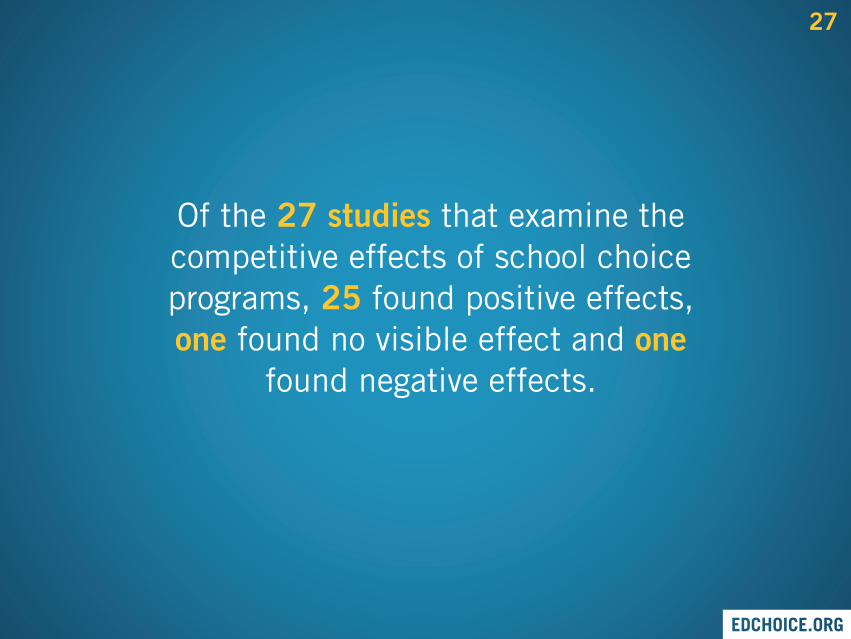
Of the 27 studies that examine the competitive effects of school choice programs, 25 found positive effects, one found no visible effect and one
found negative effects.
27
Continues on next slide.
V=Voucher TCS=Tax-credit scholarship P=Private scholarship
Study LocationProgram
TypeAny Positive Effect No Visible Effect Any Negative Effect
�
�
�
�
�
�
�
�
�
�
�
�
�
Louisiana
Indiana
Ohio
Florida
Florida
Ohio
Florida
Milwaukee, WI
Milwaukee, WI
Milwaukee, WI
Ohio
Florida
Milwaukee, WI
Washington, D.C.
V
V
V
V
V
V
V
V
V
V
V
V
V
V
Egalite and Mills (2021)
Egalite and Catt (2020)
Figlio and Karbownik (2016)
Bowen and Trivitt (2014)
Chakrabarti (2013)
Carr (2011)
Winters and Greene (2011)
Mader (2010)
Greene and Marsh (2009)
Chakrabarti (2008)
Forster (2008)
Forster (2008)
Carnoy et al. (2007)
Greene and Winters (2007)
Public School Students’ Test Scores from Empirical Studies
X
28
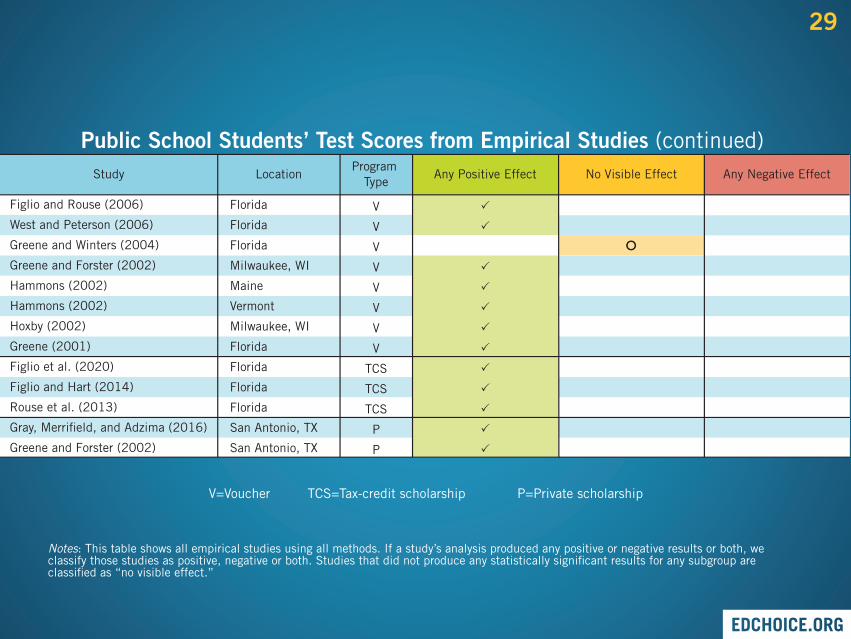
Notes: This table shows all empirical studies using all methods. If a study’s analysis produced any positive or negative results or both, we classify those studies as positive, negative or both. Studies that did not produce any statistically significant results for any subgroup are classified as “no visible effect.”
V=Voucher TCS=Tax-credit scholarship P=Private scholarship
Study LocationProgram
TypeAny Positive Effect No Visible Effect Any Negative Effect
�
�
�
�
�
�
�
�
�
�
�
�
Florida
Florida
Florida
Milwaukee, WI
Maine
Vermont
Milwaukee, WI
Florida
Florida
Florida
Florida
San Antonio, TX
San Antonio, TX
V
V
V
V
V
V
V
V
TCS
TCS
TCS
P
P
Public School Students’ Test Scores from Empirical Studies (continued)
Figlio and Rouse (2006)
West and Peterson (2006)
Greene and Winters (2004)
Greene and Forster (2002)
Hammons (2002)
Hammons (2002)
Hoxby (2002)
Greene (2001)
Figlio et al. (2020)
Figlio and Hart (2014)
Rouse et al. (2013)
Gray, Merrifield, and Adzima (2016)
Greene and Forster (2002)
��
29
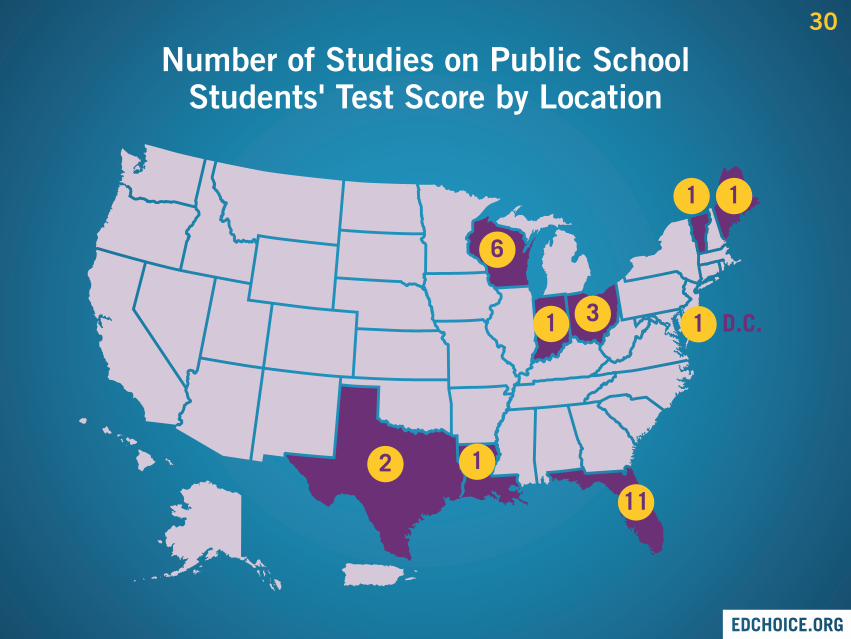
Number of Studies on Public School Students' Test Score by Location
1
1
11
6
D.C.
2
1 1
1 3
30
CIVIC VALUESAND PRACTICES
31
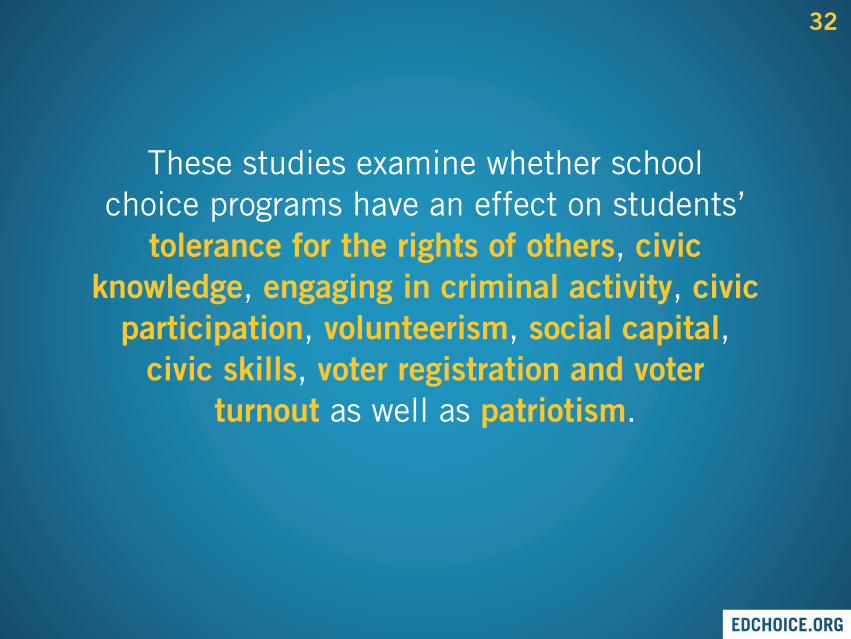
These studies examine whether school choice programs have an effect on students’
tolerance for the rights of others, civic knowledge, engaging in criminal activity, civic
participation, volunteerism, social capital, civic skills, voter registration and voter
turnout as well as patriotism.
32
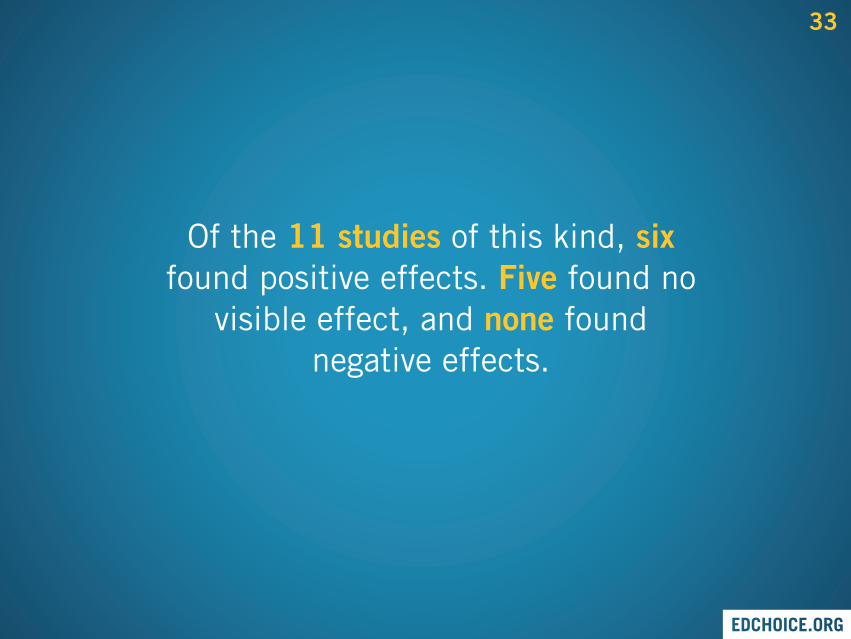
Of the 11 studies of this kind, six found positive effects. Five found no
visible effect, and none found negative effects.
33
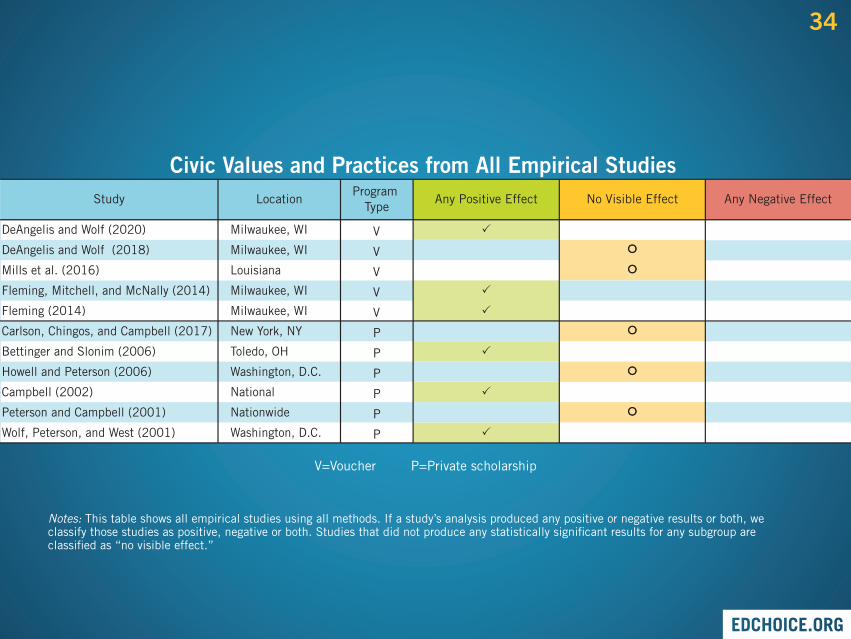
Notes: This table shows all empirical studies using all methods. If a study’s analysis produced any positive or negative results or both, we classify those studies as positive, negative or both. Studies that did not produce any statistically significant results for any subgroup are classified as “no visible effect.”
V=Voucher P=Private scholarship
Study LocationProgram
TypeAny Positive Effect No Visible Effect Any Negative Effect
�
�
�
�
�
�
����
��
��
��
Milwaukee, WI
Milwaukee, WI
Louisiana
Milwaukee, WI
Milwaukee, WI
New York, NY
Toledo, OH
Washington, D.C.
National
Nationwide
Washington, D.C.
V
V
V
V
V
P
P
P
P
P
P
DeAngelis and Wolf (2020)
DeAngelis and Wolf (2018)
Mills et al. (2016)
Fleming, Mitchell, and McNally (2014)
Fleming (2014)
Carlson, Chingos, and Campbell (2017)
Bettinger and Slonim (2006)
Howell and Peterson (2006)
Campbell (2002)
Peterson and Campbell (2001)
Wolf, Peterson, and West (2001)
Civic Values and Practices from All Empirical Studies
34
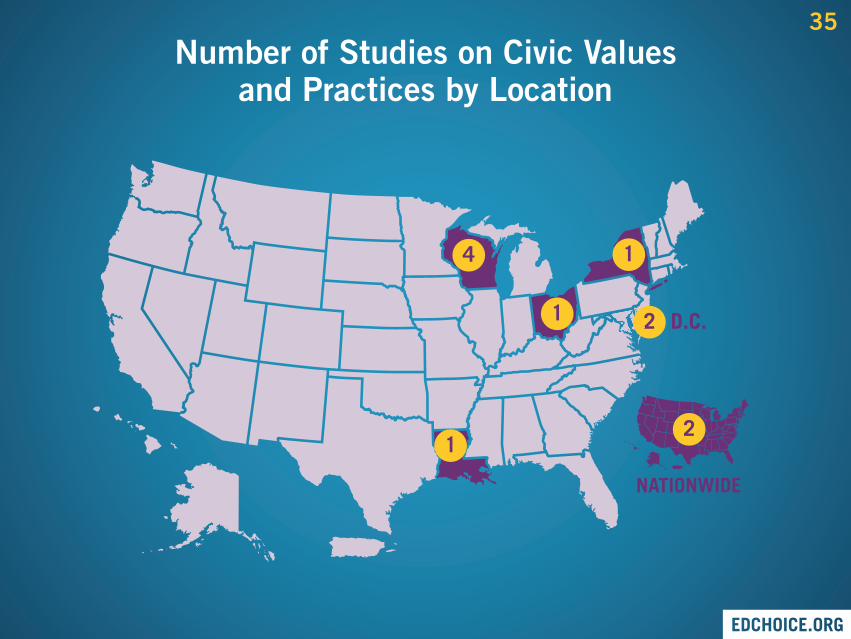
Number of Studies on Civic Valuesand Practices by Location
21
2
1
1
4
D.C.
NATIONWIDE
35
RACIAL / ETHNICINTEGRATION
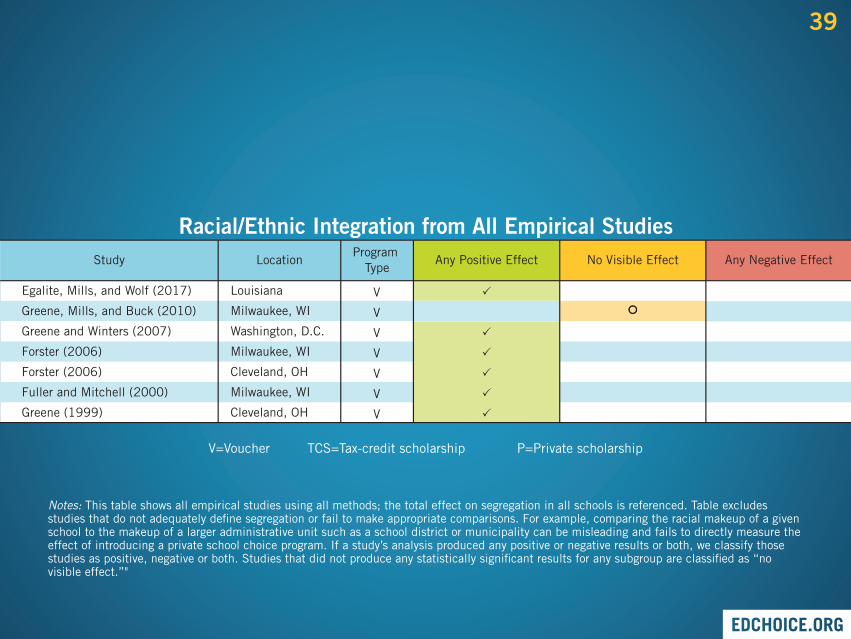
36
These studies examine the effect of school choice programs on racial and ethnic
diversity in schools.
37
Of the seven studies that have examined school choice’s effect on integration in
schools, six found positive effects. One was unable to detect any effects, and
none found negative effects.
38
Study LocationProgram
TypeAny Positive Effect No Visible Effect Any Negative Effect
�
�
�
�
�
�
��Louisiana
Milwaukee, WI
Washington, D.C.
Milwaukee, WI
Cleveland, OH
Milwaukee, WI
Cleveland, OH
V
V
V
V
V
V
V
Egalite, Mills, and Wolf (2017)
Greene, Mills, and Buck (2010)
Greene and Winters (2007)
Forster (2006)
Forster (2006)
Fuller and Mitchell (2000)
Greene (1999)
Racial/Ethnic Integration from All Empirical Studies
Notes: This table shows all empirical studies using all methods; the total effect on segregation in all schools is referenced. Table excludes studies that do not adequately define segregation or fail to make appropriate comparisons. For example, comparing the racial makeup of a given school to the makeup of a larger administrative unit such as a school district or municipality can be misleading and fails to directly measure the effect of introducing a private school choice program. If a study’s analysis produced any positive or negative results or both, we classify those studies as positive, negative or both. Studies that did not produce any statistically significant results for any subgroup are classified as “no visible effect.”"
V=Voucher TCS=Tax-credit scholarship P=Private scholarship
39
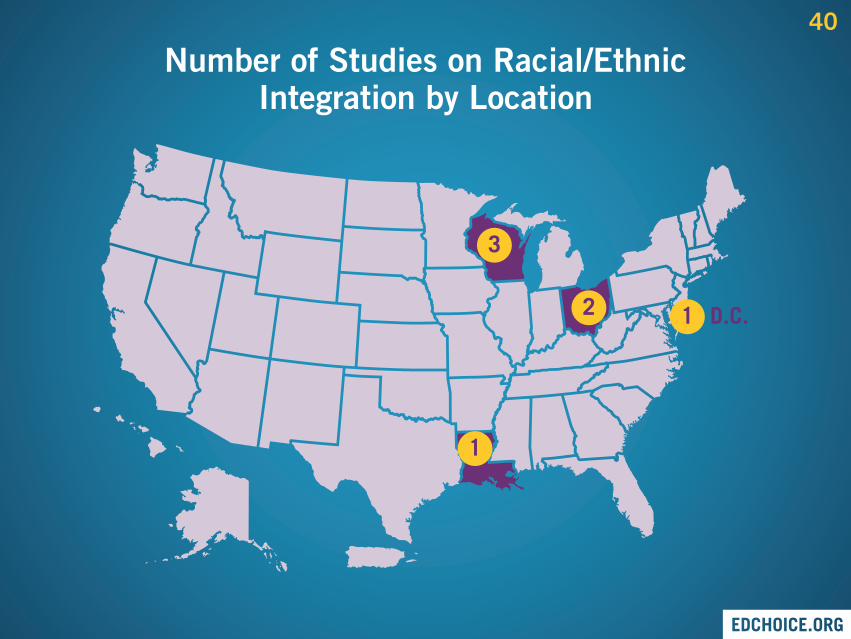
Number of Studies on Racial/EthnicIntegration by Location
12
1
3
D.C.
40
FISCAL EFFECTS
41
These studies examine whether school choice programs generate net savings, net
costs or are cost-neutral for taxpayers.
42
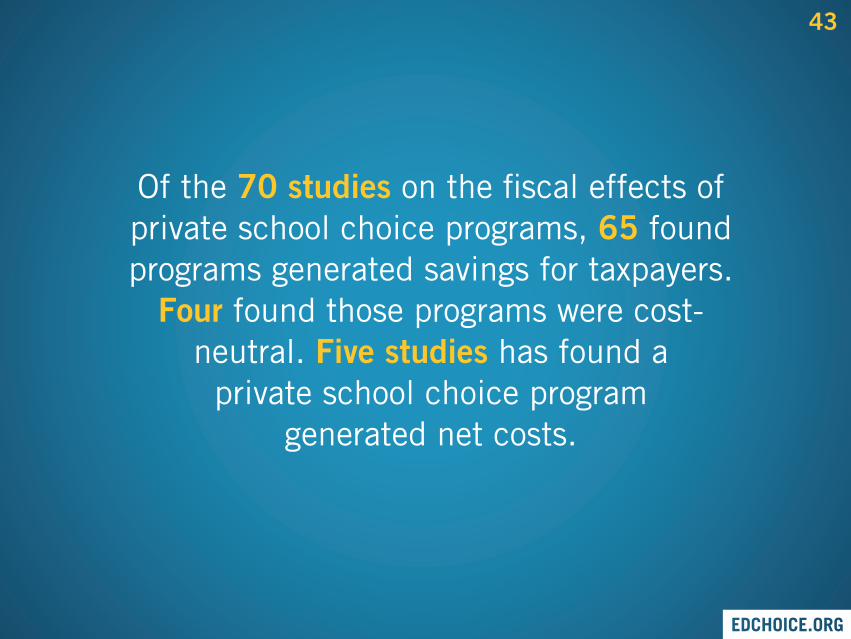
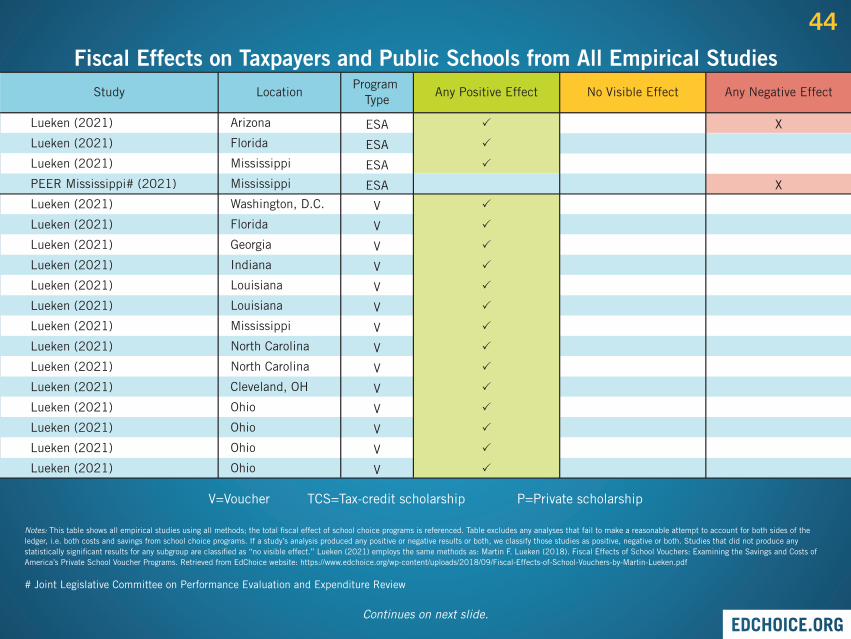
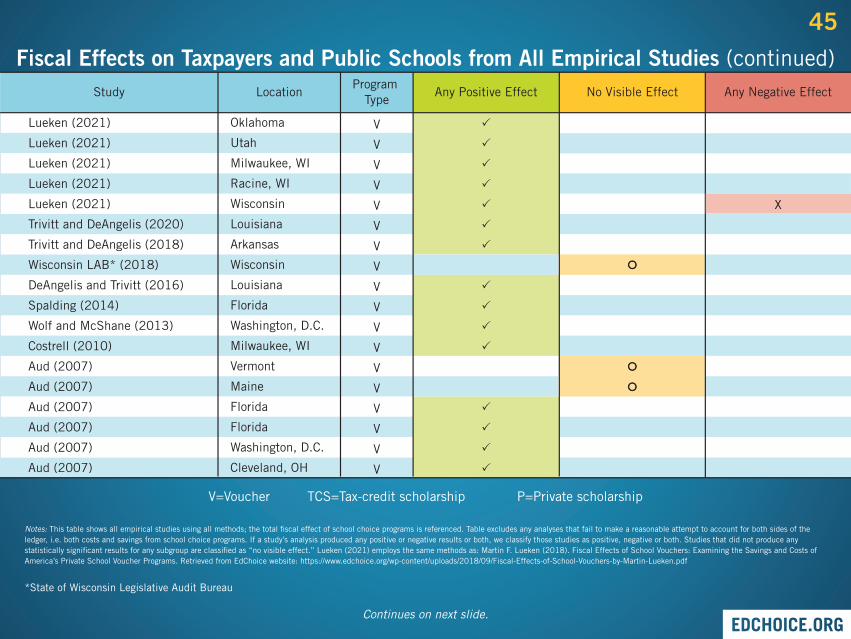
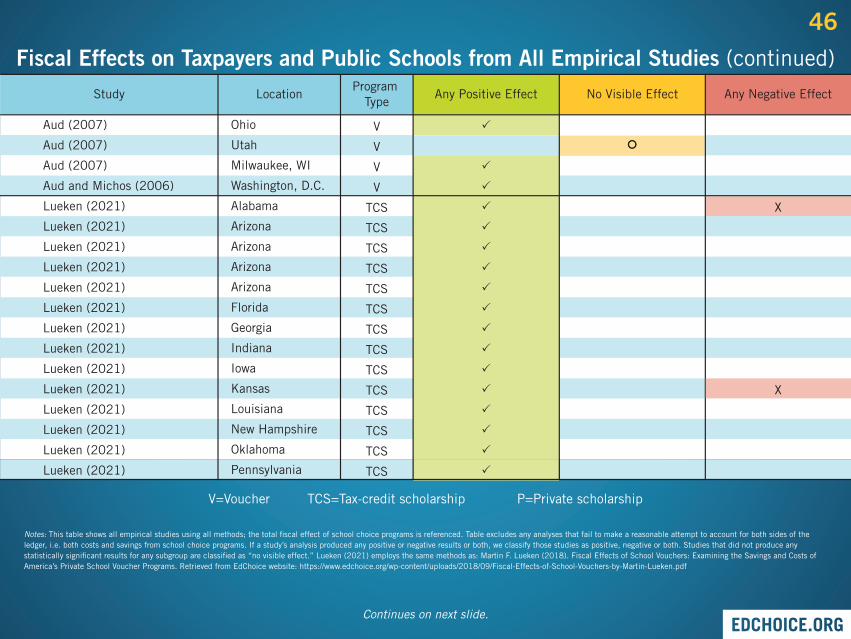
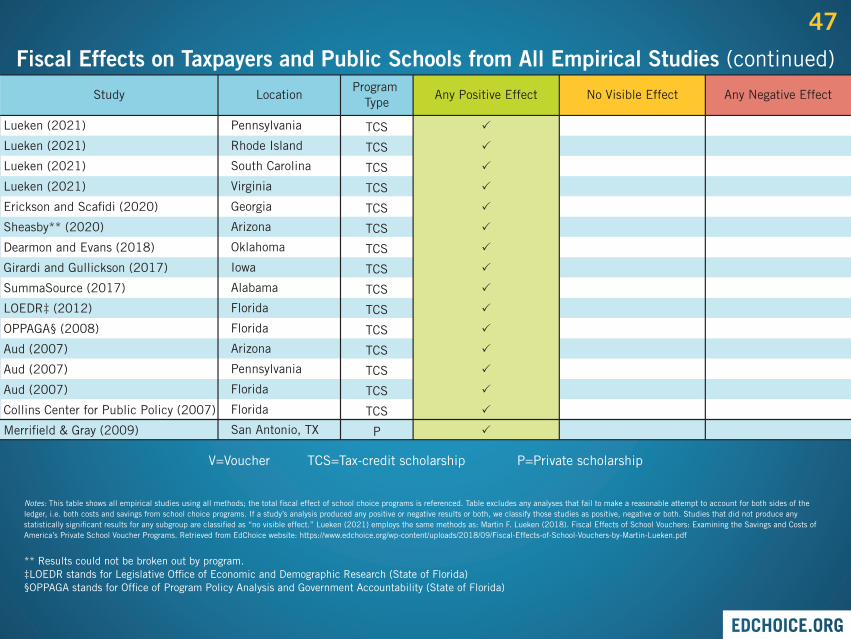
Of the 70 studies on the fiscal effects of private school choice programs, 65 found programs generated savings for taxpayers.
Four found those programs were cost-neutral. Five studies has found a
private school choice program generated net costs.
43
Continues on next slide.
V=Voucher TCS=Tax-credit scholarship P=Private scholarship
Study LocationProgram
TypeAny Positive Effect No Visible Effect Any Negative Effect
�
�
�
�
�
�
�
�
�
�
�
�
�
�
�
�
�
X
X
Arizona
Florida
Mississippi
Mississippi
Washington, D.C.
Florida
Georgia
Indiana
Louisiana
Louisiana
Mississippi
North Carolina
North Carolina
Cleveland, OH
Ohio
Ohio
Ohio
Ohio
ESA
ESA
ESA
ESA
V
V
V
V
V
V
V
V
V
V
V
V
V
V
Lueken (2021)
Lueken (2021)
Lueken (2021)
PEER Mississippi# (2021)
Lueken (2021)
Lueken (2021)
Lueken (2021)
Lueken (2021)
Lueken (2021)
Lueken (2021)
Lueken (2021)
Lueken (2021)
Lueken (2021)
Lueken (2021)
Lueken (2021)
Lueken (2021)
Lueken (2021)
Lueken (2021)
Fiscal Effects on Taxpayers and Public Schools from All Empirical Studies
Notes: This table shows all empirical studies using all methods; the total fiscal effect of school choice programs is referenced. Table excludes any analyses that fail to make a reasonable attempt to account for both sides of the ledger, i.e. both costs and savings from school choice programs. If a study’s analysis produced any positive or negative results or both, we classify those studies as positive, negative or both. Studies that did not produce any statistically significant results for any subgroup are classified as “no visible effect.” Lueken (2021) employs the same methods as: Martin F. Lueken (2018). Fiscal Effects of School Vouchers: Examining the Savings and Costs of America’s Private School Voucher Programs. Retrieved from EdChoice website: https://www.edchoice.org/wp-content/uploads/2018/09/Fiscal-Effects-of-School-Vouchers-by-Martin-Lueken.pdf
# Joint Legislative Committee on Performance Evaluation and Expenditure Review
44
Continues on next slide.
V=Voucher TCS=Tax-credit scholarship P=Private scholarship
Study LocationProgram
TypeAny Positive Effect No Visible Effect Any Negative Effect
�
�
�
�
�
�
�
�
�
�
�
�
�
�
�
��
����
Oklahoma
Utah
Milwaukee, WI
Racine, WI
Wisconsin
Louisiana
Arkansas
Wisconsin
Louisiana
Florida
Washington, D.C.
Milwaukee, WI
Vermont
Maine
Florida
Florida
Washington, D.C.
Cleveland, OH
V
V
V
V
V
V
V
V
V
V
V
V
V
V
V
V
V
V
Lueken (2021)
Lueken (2021)
Lueken (2021)
Lueken (2021)
Lueken (2021)
Trivitt and DeAngelis (2020)
Trivitt and DeAngelis (2018)
Wisconsin LAB* (2018)
DeAngelis and Trivitt (2016)
Spalding (2014)
Wolf and McShane (2013)
Costrell (2010)
Aud (2007)
Aud (2007)
Aud (2007)
Aud (2007)
Aud (2007)
Aud (2007)
Fiscal Effects on Taxpayers and Public Schools from All Empirical Studies (continued)
X
Notes: This table shows all empirical studies using all methods; the total fiscal effect of school choice programs is referenced. Table excludes any analyses that fail to make a reasonable attempt to account for both sides of the ledger, i.e. both costs and savings from school choice programs. If a study’s analysis produced any positive or negative results or both, we classify those studies as positive, negative or both. Studies that did not produce any statistically significant results for any subgroup are classified as “no visible effect.” Lueken (2021) employs the same methods as: Martin F. Lueken (2018). Fiscal Effects of School Vouchers: Examining the Savings and Costs of America’s Private School Voucher Programs. Retrieved from EdChoice website: https://www.edchoice.org/wp-content/uploads/2018/09/Fiscal-Effects-of-School-Vouchers-by-Martin-Lueken.pdf
*State of Wisconsin Legislative Audit Bureau
45
Notes: This table shows all empirical studies using all methods; the total fiscal effect of school choice programs is referenced. Table excludes any analyses that fail to make a reasonable attempt to account for both sides of the ledger, i.e. both costs and savings from school choice programs. If a study’s analysis produced any positive or negative results or both, we classify those studies as positive, negative or both. Studies that did not produce any statistically significant results for any subgroup are classified as “no visible effect.” Lueken (2021) employs the same methods as: Martin F. Lueken (2018). Fiscal Effects of School Vouchers: Examining the Savings and Costs of America’s Private School Voucher Programs. Retrieved from EdChoice website: https://www.edchoice.org/wp-content/uploads/2018/09/Fiscal-Effects-of-School-Vouchers-by-Martin-Lueken.pdf
V=Voucher TCS=Tax-credit scholarship P=Private scholarship
��
Study LocationProgram
TypeAny Positive Effect No Visible Effect Any Negative Effect
�
�
�
�
�
�
�
�
�
�
�
�
�
�
�
�
�
Ohio
Utah
Milwaukee, WI
Washington, D.C.
Alabama
Arizona
Arizona
Arizona
Arizona
Florida
Georgia
Indiana
Iowa
Kansas
Louisiana
New Hampshire
Oklahoma
Pennsylvania
V
V
V
V
TCS
TCS
TCS
TCS
TCS
TCS
TCS
TCS
TCS
TCS
TCS
TCS
TCS
TCS
Aud (2007)
Aud (2007)
Aud (2007)
Aud and Michos (2006)
Lueken (2021)
Lueken (2021)
Lueken (2021)
Lueken (2021)
Lueken (2021)
Lueken (2021)
Lueken (2021)
Lueken (2021)
Lueken (2021)
Lueken (2021)
Lueken (2021)
Lueken (2021)
Lueken (2021)
Lueken (2021)
Fiscal Effects on Taxpayers and Public Schools from All Empirical Studies (continued)
X
X
Continues on next slide.
46
Notes: This table shows all empirical studies using all methods; the total fiscal effect of school choice programs is referenced. Table excludes any analyses that fail to make a reasonable attempt to account for both sides of the ledger, i.e. both costs and savings from school choice programs. If a study’s analysis produced any positive or negative results or both, we classify those studies as positive, negative or both. Studies that did not produce any statistically significant results for any subgroup are classified as “no visible effect.” Lueken (2021) employs the same methods as: Martin F. Lueken (2018). Fiscal Effects of School Vouchers: Examining the Savings and Costs of America’s Private School Voucher Programs. Retrieved from EdChoice website: https://www.edchoice.org/wp-content/uploads/2018/09/Fiscal-Effects-of-School-Vouchers-by-Martin-Lueken.pdf
V=Voucher TCS=Tax-credit scholarship P=Private scholarship
** Results could not be broken out by program. ‡LOEDR stands for Legislative Office of Economic and Demographic Research (State of Florida) §OPPAGA stands for Office of Program Policy Analysis and Government Accountability (State of Florida)
Study LocationProgram
TypeAny Positive Effect No Visible Effect Any Negative Effect
�
�
�
�
�
�
�
�
�
�
�
�
�
�
�
�
Pennsylvania
Rhode Island
South Carolina
Virginia
Georgia
Arizona
Oklahoma
Iowa
Alabama
Florida
Florida
Arizona
Pennsylvania
Florida
Florida
San Antonio, TX
TCS
TCS
TCS
TCS
TCS
TCS
TCS
TCS
TCS
TCS
TCS
TCS
TCS
TCS
TCS
P
Lueken (2021)
Lueken (2021)
Lueken (2021)
Lueken (2021)
Erickson and Scafidi (2020)
Sheasby** (2020)
Dearmon and Evans (2018)
Girardi and Gullickson (2017)
SummaSource (2017)
LOEDR‡ (2012)
OPPAGA§ (2008)
Aud (2007)
Aud (2007)
Aud (2007)
Collins Center for Public Policy (2007)
Merrifield & Gray (2009)
Fiscal Effects on Taxpayers and Public Schools from All Empirical Studies (continued)
47
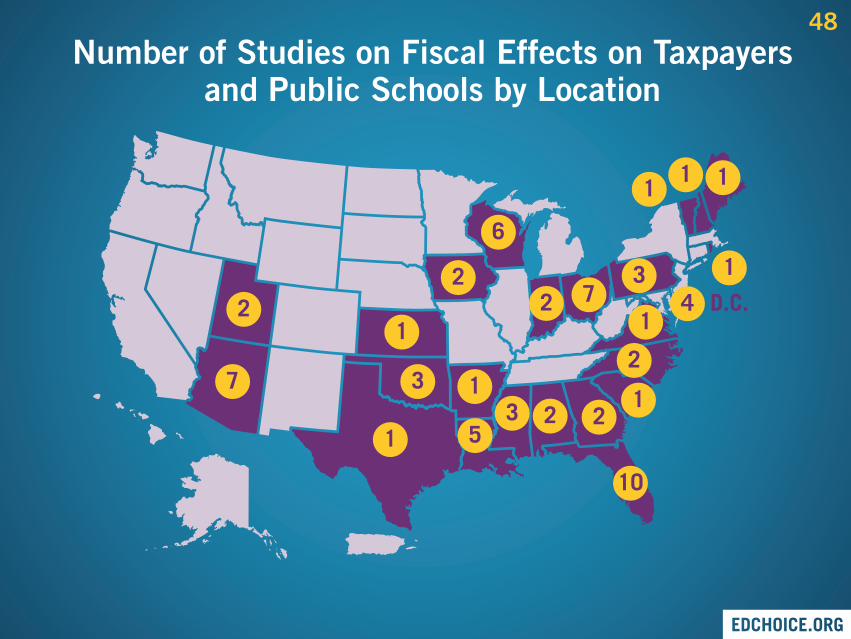
Number of Studies on Fiscal Effects on Taxpayersand Public Schools by Location
472
2
11
2
1
1
1
1
3
33
1
2
2
10
1
1
72
5
6
D.C.
48
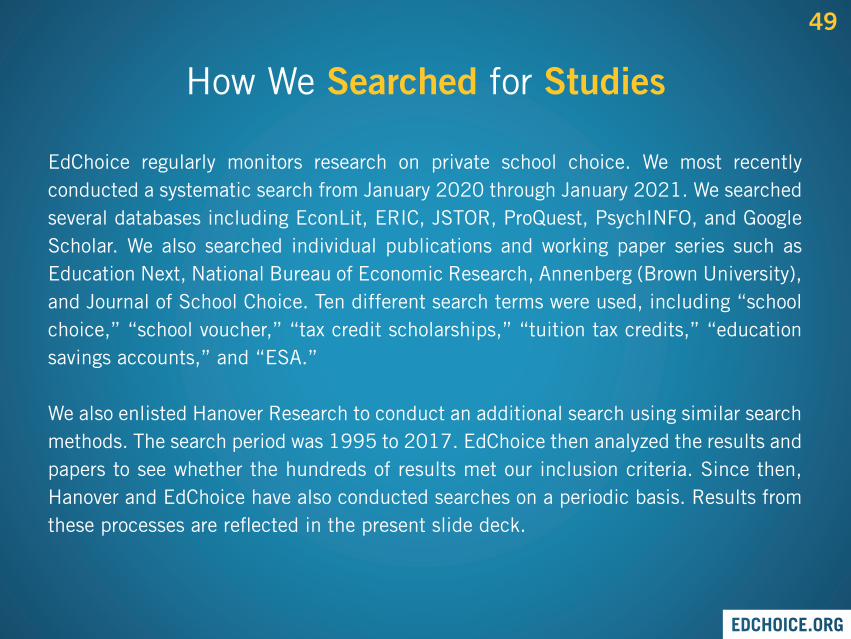
How We Searched for Studies
EdChoice regularly monitors research on private school choice. We most recently conducted a systematic search from January 2020 through January 2021. We searched several databases including EconLit, ERIC, JSTOR, ProQuest, PsychINFO, and Google Scholar. We also searched individual publications and working paper series such as Education Next, National Bureau of Economic Research, Annenberg (Brown University), and Journal of School Choice. Ten different search terms were used, including “school choice,” “school voucher,” “tax credit scholarships,” “tuition tax credits,” “education savings accounts,” and “ESA.”
We also enlisted Hanover Research to conduct an additional search using similar search methods. The search period was 1995 to 2017. EdChoice then analyzed the results and papers to see whether the hundreds of results met our inclusion criteria. Since then, Hanover and EdChoice have also conducted searches on a periodic basis. Results from these processes are reflected in the present slide deck.
49
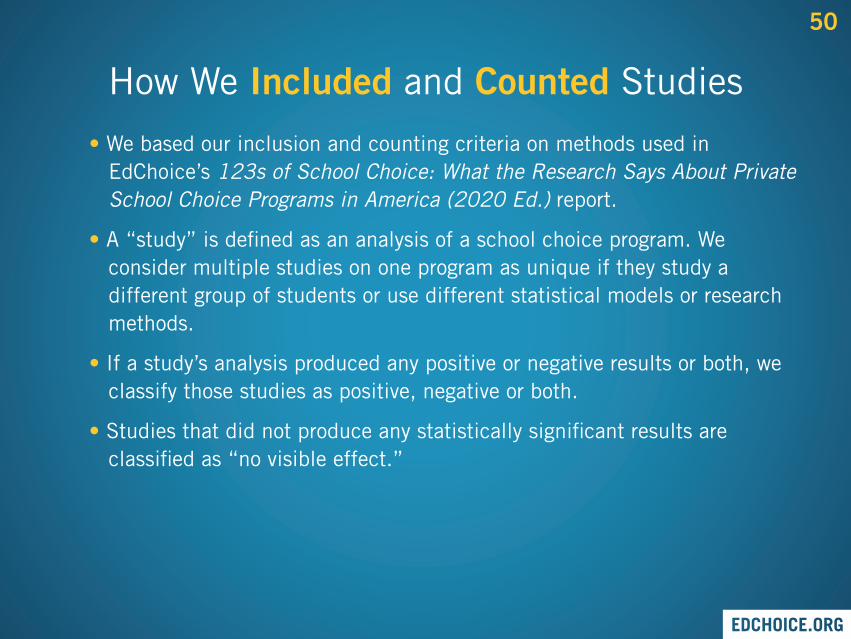
How We Included and Counted Studies
• We based our inclusion and counting criteria on methods used in EdChoice’s 123s of School Choice: What the Research Says About Private School Choice Programs in America (2020 Ed.) report.
• A “study” is defined as an analysis of a school choice program. We consider multiple studies on one program as unique if they study a different group of students or use different statistical models or research methods.
• If a study’s analysis produced any positive or negative results or both, we classify those studies as positive, negative or both.
• Studies that did not produce any statistically significant results are classified as “no visible effect.”
50
How We Included and Counted Studies
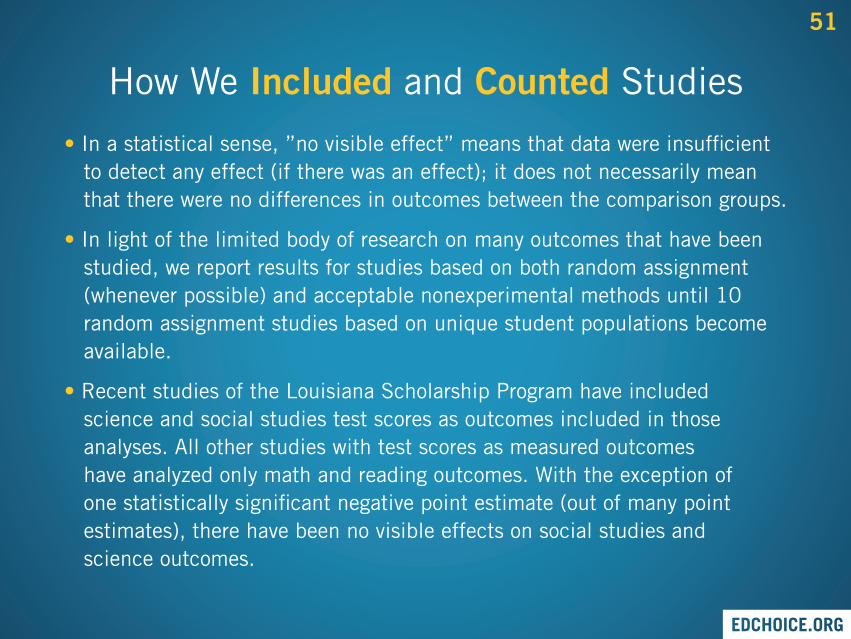
• In a statistical sense, ”no visible effect” means that data were insufficient to detect any effect (if there was an effect); it does not necessarily mean that there were no differences in outcomes between the comparison groups.
• In light of the limited body of research on many outcomes that have been studied, we report results for studies based on both random assignment (whenever possible) and acceptable nonexperimental methods until 10 random assignment studies based on unique student populations become available.
• Recent studies of the Louisiana Scholarship Program have included science and social studies test scores as outcomes included in those analyses. All other studies with test scores as measured outcomes have analyzed only math and reading outcomes. With the exception of one statistically significant negative point estimate (out of many point estimates), there have been no visible effects on social studies and science outcomes.
51
CaveatWhile these counting methods allow us to present information easily, they
can mask other important factors, such as how big an effect is or how
much of an effect is due to a certain program design.
52
�
�
�
�
�
�
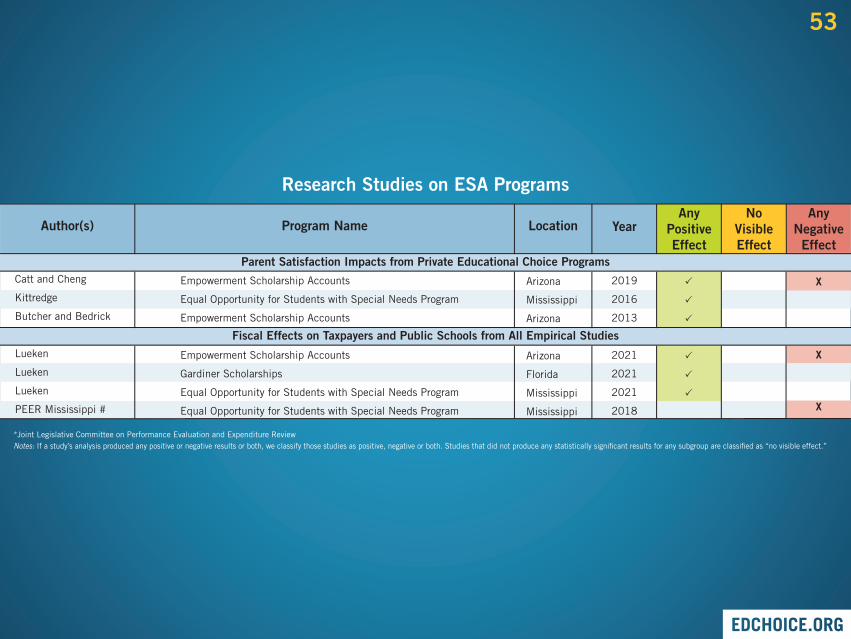
Research Studies on ESA Programs
Catt and Cheng
Kittredge
Butcher and Bedrick
Lueken
Lueken
Lueken
PEER Mississippi #
Arizona
Mississippi
Arizona
Arizona
Florida
Mississippi
Mississippi
2019
2016
2013
2021
2021
2021
2018
Author(s) Location YearAny
Positive Effect
Any Negative Effect
No Visible Effect
Program Name
*Joint Legislative Committee on Performance Evaluation and Expenditure ReviewNotes: If a study’s analysis produced any positive or negative results or both, we classify those studies as positive, negative or both. Studies that did not produce any statistically significant results for any subgroup are classified as “no visible effect.”
X
X
X
Parent Satisfaction Impacts from Private Educational Choice Programs
Fiscal Effects on Taxpayers and Public Schools from All Empirical Studies
Empowerment Scholarship Accounts
Equal Opportunity for Students with Special Needs Program
Empowerment Scholarship Accounts
Empowerment Scholarship Accounts
Gardiner Scholarships
Equal Opportunity for Students with Special Needs Program
Equal Opportunity for Students with Special Needs Program
53
Opportunity Scholarship Program
Louisiana Scholarship Program
Louisiana Scholarship Program
Opportunity Scholarship Program
Milwaukee Parental Choice Program
Milwaukee Parental Choice Program
Milwaukee Parental Choice Program
Choice Scholarship Program
Opportunity Scholarship Program
Milwaukee Parental Choice Program
Louisiana Scholarship Program
Opportunity Scholarship Program
Special Needs Scholarship Program
Choice Scholarship Program
Opportunity Scholarships
Choice Scholarship Program/School Scholarship Tax Credit
John M. McKay Scholarships for Students with Disabilities Program
Opportunity Scholarship Program
Choice Scholarship Program/School Scholarship Tax Credit
Milwaukee Parental Choice Program
John M. McKay Scholarships for Students with Disabilities Program
John M. McKay Scholarships for Students with Disabilities Program
Milwaukee Parental Choice Program
Cleveland Scholarship Program
Cleveland Scholarship Program
Cleveland Scholarship Program
Louisiana Scholarship Program
Opportunity Scholarship Program
Milwaukee Parental Choice Program
Opportunity Scholarship Program
Louisiana Scholarship Program
Choice Scholarship Program
Choice Scholarship Program/School Scholarship Tax Credit
Opportunity Scholarship Program
Milwaukee Parental Choice Program
John M. McKay Scholarships for Students with Disabilities Program
Cleveland Scholarship Program
�
�
�
�
�
�
�
�
�
�
�
�
�
�
�
�
�
�
�
�
��
��
��
��
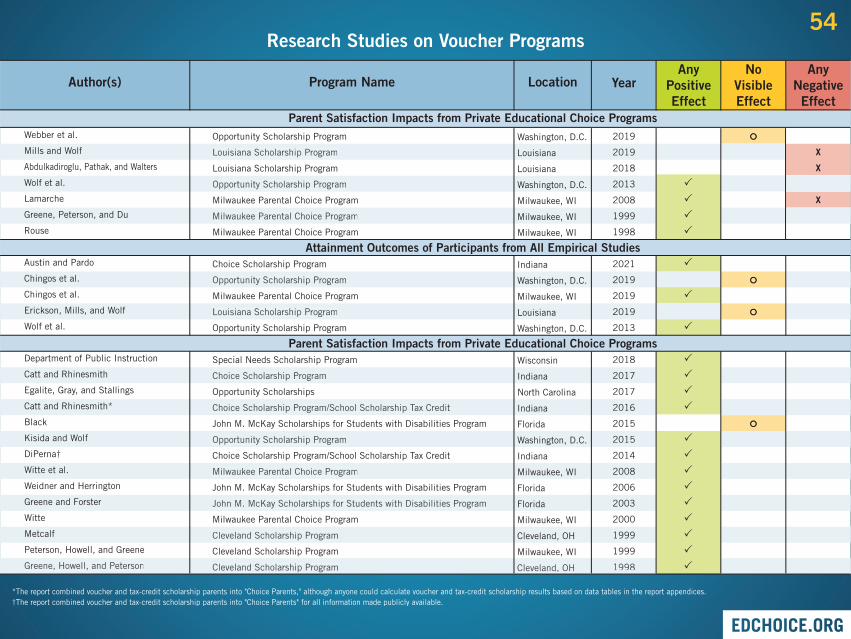
Research Studies on Voucher Programs
Webber et al.
Mills and Wolf
Abdulkadiroglu, Pathak, and Walters
Wolf et al.
Lamarche
Greene, Peterson, and Du
Rouse
Austin and Pardo
Chingos et al.
Chingos et al.
Erickson, Mills, and Wolf
Wolf et al.
Department of Public Instruction
Catt and Rhinesmith
Egalite, Gray, and Stallings
Catt and Rhinesmith*
Black
Kisida and Wolf
DiPerna†
Witte et al.
Weidner and Herrington
Greene and Forster
Witte
Metcalf
Peterson, Howell, and Greene
Greene, Howell, and Peterson
Washington, D.C.
Louisiana
Louisiana
Washington, D.C.
Milwaukee, WI
Milwaukee, WI
Milwaukee, WI
Indiana
Washington, D.C.
Milwaukee, WI
Louisiana
Washington, D.C.
Wisconsin
Indiana
North Carolina
Indiana
Florida
Washington, D.C.
Indiana
Milwaukee, WI
Florida
Florida
Milwaukee, WI
Cleveland, OH
Milwaukee, WI
Cleveland, OH
2019
2019
2018
2013
2008
1999
1998
2021
2019
2019
2019
2013
2018
2017
2017
2016
2015
2015
2014
2008
2006
2003
2000
1999
1999
1998
Author(s) Location YearAny
Positive Effect
Any Negative Effect
No Visible Effect
Program Name
X
X
X
Parent Satisfaction Impacts from Private Educational Choice Programs
Attainment Outcomes of Participants from All Empirical Studies
Parent Satisfaction Impacts from Private Educational Choice Programs
*The report combined voucher and tax-credit scholarship parents into "Choice Parents," although anyone could calculate voucher and tax-credit scholarship results based on data tables in the report appendices. †The report combined voucher and tax-credit scholarship parents into "Choice Parents" for all information made publicly available.
Cleveland Scholarship ProgramGreene, Howell, and Peterson Cleveland, OH 1998
54
�
�
�
�
�
�
�
�
�
�
�
�
�
�
�
�
�
�
�
�
�
�
�
��
����
Research Studies on Voucher Programs
Louisiana
Indiana
Ohio
Florida
Florida
Ohio
Florida
Milwaukee, WI
Milwaukee, WI
Milwaukee, WI
Ohio
Florida
Milwaukee, WI
Washington, D.C.
Florida
Florida
Florida
Milwaukee, WI
Maine
Vermont
Milwaukee, WI
Florida
Milwaukee, WI
Milwaukee, WI
Louisiana
Milwaukee, WI
Milwaukee, WI
2021
2020
2016
2014
2013
2011
2011
2010
2009
2008
2008
2008
2007
2007
2006
2006
2004
2002
2002
2002
2002
2001
2020
2018
2016
2014
2014
Author(s) Location YearAny
Positive Effect
Any Negative Effect
No Visible Effect
Program Name
X
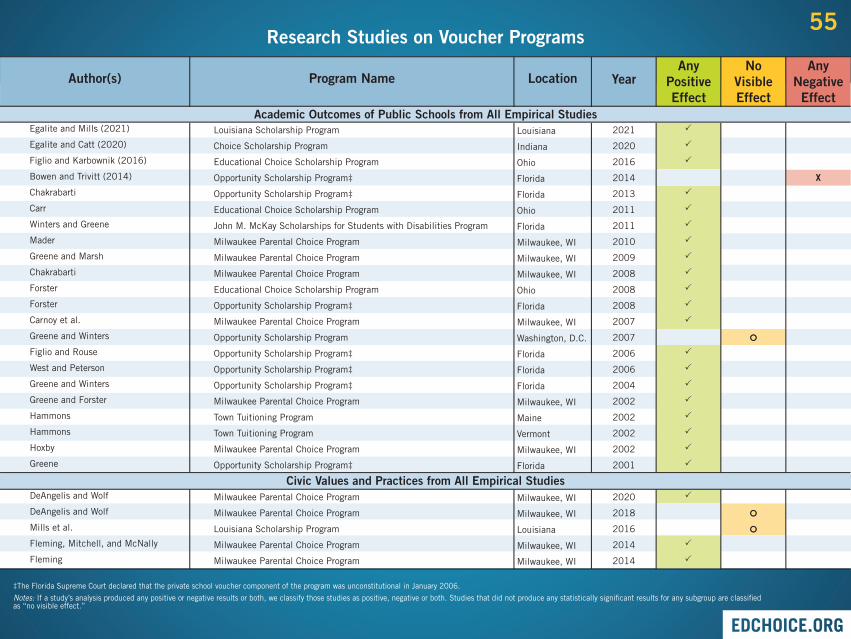
Academic Outcomes of Public Schools from All Empirical Studies
‡The Florida Supreme Court declared that the private school voucher component of the program was unconstitutional in January 2006.
Notes: If a study’s analysis produced any positive or negative results or both, we classify those studies as positive, negative or both. Studies that did not produce any statistically significant results for any subgroup are classified as “no visible effect.”
Egalite and Mills (2021)
Egalite and Catt (2020)
Figlio and Karbownik (2016)
Bowen and Trivitt (2014)
Chakrabarti
Carr
Winters and Greene
Mader
Greene and Marsh
Chakrabarti
Forster
Forster
Carnoy et al.
Greene and Winters
Figlio and Rouse
West and Peterson
Greene and Winters
Greene and Forster
Hammons
Hammons
Hoxby
Greene
DeAngelis and Wolf
DeAngelis and Wolf
Mills et al.
Fleming, Mitchell, and McNally
Fleming
Louisiana Scholarship Program
Choice Scholarship Program
Educational Choice Scholarship Program
Opportunity Scholarship Program‡
Opportunity Scholarship Program‡
Educational Choice Scholarship Program
John M. McKay Scholarships for Students with Disabilities Program
Milwaukee Parental Choice Program
Milwaukee Parental Choice Program
Milwaukee Parental Choice Program
Educational Choice Scholarship Program
Opportunity Scholarship Program‡
Milwaukee Parental Choice Program
Opportunity Scholarship Program
Opportunity Scholarship Program‡
Opportunity Scholarship Program‡
Opportunity Scholarship Program‡
Milwaukee Parental Choice Program
Town Tuitioning Program
Town Tuitioning Program
Milwaukee Parental Choice Program
Opportunity Scholarship Program‡
Milwaukee Parental Choice Program
Milwaukee Parental Choice Program
Louisiana Scholarship Program
Milwaukee Parental Choice Program
Milwaukee Parental Choice Program
Civic Values and Practices from All Empirical Studies
55
�
�
�
�
�
�
�
�
�
�
�
�
�
�
�
�
�
�
�
�
�
�
�
�
��
Research Studies on Voucher Programs
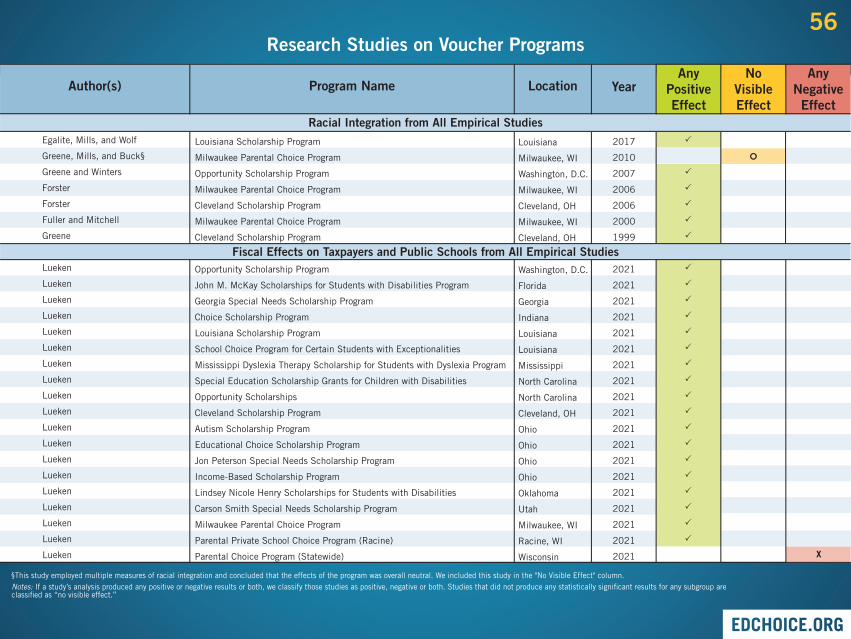
Egalite, Mills, and Wolf
Greene, Mills, and Buck§
Greene and Winters
Forster
Forster
Fuller and Mitchell
Greene
Lueken
Lueken
Lueken
Lueken
Lueken
Lueken
Lueken
Lueken
Lueken
Lueken
Lueken
Lueken
Lueken
Lueken
Lueken
Lueken
Lueken
Lueken
Lueken
2017
2010
2007
2006
2006
2000
1999
2021
2021
2021
2021
2021
2021
2021
2021
2021
2021
2021
2021
2021
2021
2021
2021
2021
2021
2021
Author(s) Location YearAny
Positive Effect
Any Negative Effect
No Visible Effect
Program Name
§This study employed multiple measures of racial integration and concluded that the effects of the program was overall neutral. We included this study in the "No Visible Effect" column.Notes: If a study’s analysis produced any positive or negative results or both, we classify those studies as positive, negative or both. Studies that did not produce any statistically significant results for any subgroup are classified as “no visible effect.”
Louisiana Scholarship Program
Milwaukee Parental Choice Program
Opportunity Scholarship Program
Milwaukee Parental Choice Program
Cleveland Scholarship Program
Milwaukee Parental Choice Program
Cleveland Scholarship Program
Opportunity Scholarship Program
John M. McKay Scholarships for Students with Disabilities Program
Georgia Special Needs Scholarship Program
Choice Scholarship Program
Louisiana Scholarship Program
School Choice Program for Certain Students with Exceptionalities
Mississippi Dyslexia Therapy Scholarship for Students with Dyslexia Program
Special Education Scholarship Grants for Children with Disabilities
Opportunity Scholarships
Cleveland Scholarship Program
Autism Scholarship Program
Educational Choice Scholarship Program
Jon Peterson Special Needs Scholarship Program
Income-Based Scholarship Program
Lindsey Nicole Henry Scholarships for Students with Disabilities
Carson Smith Special Needs Scholarship Program
Milwaukee Parental Choice Program
Parental Private School Choice Program (Racine)
Parental Choice Program (Statewide)
Louisiana
Milwaukee, WI
Washington, D.C.
Milwaukee, WI
Cleveland, OH
Milwaukee, WI
Cleveland, OH
Washington, D.C.
Florida
Georgia
Indiana
Louisiana
Louisiana
Mississippi
North Carolina
North Carolina
Cleveland, OH
Ohio
Ohio
Ohio
Ohio
Oklahoma
Utah
Milwaukee, WI
Racine, WI
Wisconsin X
Racial Integration from All Empirical Studies
Fiscal Effects on Taxpayers and Public Schools from All Empirical Studies
56
�
�
�
�
�
�
�
�
�
�
�
�
�
��
����
��
Research Studies on Voucher Programs
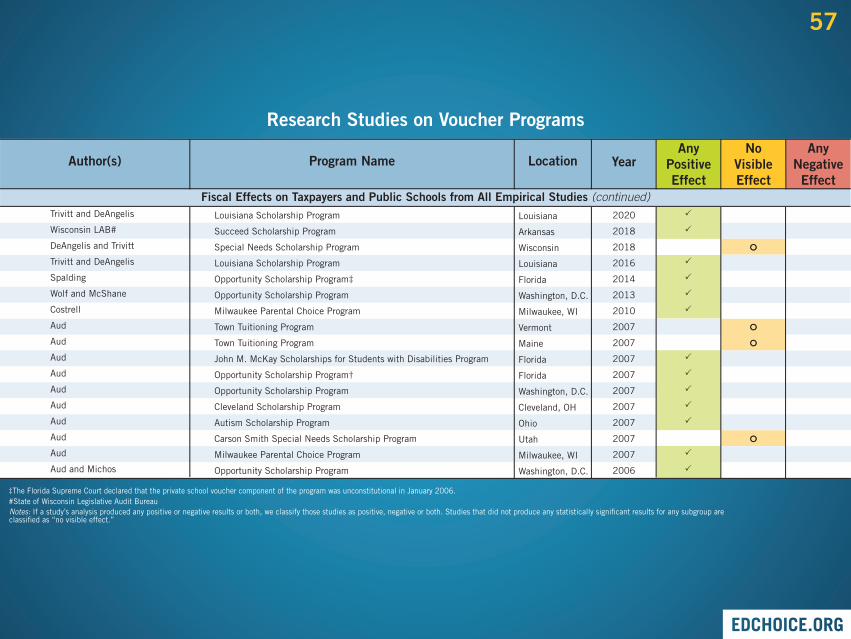
Trivitt and DeAngelis
Wisconsin LAB#
DeAngelis and Trivitt
Trivitt and DeAngelis
Spalding
Wolf and McShane
Costrell
Aud
Aud
Aud
Aud
Aud
Aud
Aud
Aud
Aud
Aud and Michos
Louisiana
Arkansas
Wisconsin
Louisiana
Florida
Washington, D.C.
Milwaukee, WI
Vermont
Maine
Florida
Florida
Washington, D.C.
Cleveland, OH
Ohio
Utah
Milwaukee, WI
Washington, D.C.
2020
2018
2018
2016
2014
2013
2010
2007
2007
2007
2007
2007
2007
2007
2007
2007
2006
Author(s) Location YearAny
Positive Effect
Any Negative Effect
No Visible Effect
Program Name
Louisiana Scholarship Program
Succeed Scholarship Program
Special Needs Scholarship Program
Louisiana Scholarship Program
Opportunity Scholarship Program‡
Opportunity Scholarship Program
Milwaukee Parental Choice Program
Town Tuitioning Program
Town Tuitioning Program
John M. McKay Scholarships for Students with Disabilities Program
Opportunity Scholarship Program†
Opportunity Scholarship Program
Cleveland Scholarship Program
Autism Scholarship Program
Carson Smith Special Needs Scholarship Program
Milwaukee Parental Choice Program
Opportunity Scholarship Program
Fiscal Effects on Taxpayers and Public Schools from All Empirical Studies (continued)
‡The Florida Supreme Court declared that the private school voucher component of the program was unconstitutional in January 2006.#State of Wisconsin Legislative Audit Bureau Notes: If a study’s analysis produced any positive or negative results or both, we classify those studies as positive, negative or both. Studies that did not produce any statistically significant results for any subgroup are classified as “no visible effect.”
57
X
X
*Results could not be broken out by program and reflect responses by parents with children attending private schools via any of Arizona’s four tax-credit scholarship programs.†The report combined voucher and tax-credit scholarship parents into “Choice Parents,” although anyone could calculate voucher and tax-credit scholarship results based on data tables in the report appendices.”‡The report combined voucher and tax-credit scholarship parents into “Choice Parents” for all information made publicly available.§LOEDR stands for Legislative Office of Economic and Demographic Research (State of Florida)#OPPAGA stands for Office of Program Policy Analysis and Government Accountability (State of Florida)Notes: If a study’s analysis produced any positive or negative results or both, we classify those studies as positive, negative or both. Studies that did not produce any statistically significant results for any subgroup are classified as “no visible effect.”
�
�
�
�
�
�
�
�
�
�
�
�
�
�
�
�
�
Research Studies on Tax-Credit Scholarship Programs
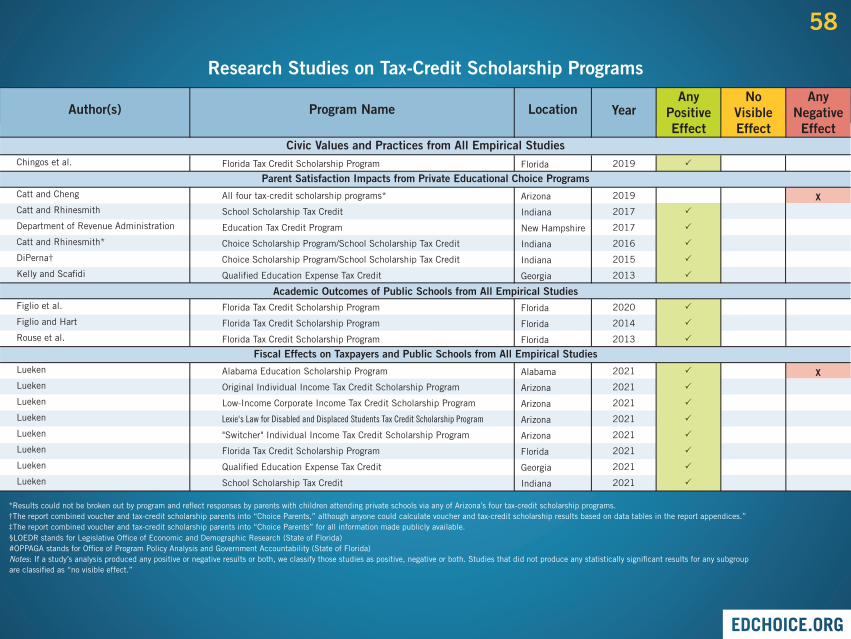
Chingos et al.
Catt and Cheng
Catt and Rhinesmith
Department of Revenue Administration
Catt and Rhinesmith*
DiPerna†
Kelly and Scafidi
Figlio et al.
Figlio and Hart
Rouse et al.
Lueken
Lueken
Lueken
Lueken
Lueken
Lueken
Lueken
Lueken
Florida
Arizona
Indiana
New Hampshire
Indiana
Indiana
Georgia
Florida
Florida
Florida
Alabama
Arizona
Arizona
Arizona
Arizona
Florida
Georgia
Indiana
2019
2019
2017
2017
2016
2015
2013
2020
2014
2013
2021
2021
2021
2021
2021
2021
2021
2021
Author(s) Location YearAny
Positive Effect
Any Negative Effect
No Visible Effect
Program Name
Florida Tax Credit Scholarship Program
All four tax-credit scholarship programs*
School Scholarship Tax Credit
Education Tax Credit Program
Choice Scholarship Program/School Scholarship Tax Credit
Choice Scholarship Program/School Scholarship Tax Credit
Qualified Education Expense Tax Credit
Florida Tax Credit Scholarship Program
Florida Tax Credit Scholarship Program
Florida Tax Credit Scholarship Program
Alabama Education Scholarship Program
Original Individual Income Tax Credit Scholarship Program
Low-Income Corporate Income Tax Credit Scholarship Program
Lexie's Law for Disabled and Displaced Students Tax Credit Scholarship Program
"Switcher" Individual Income Tax Credit Scholarship Program
Florida Tax Credit Scholarship Program
Qualified Education Expense Tax Credit
School Scholarship Tax Credit
Civic Values and Practices from All Empirical Studies
Parent Satisfaction Impacts from Private Educational Choice Programs
Academic Outcomes of Public Schools from All Empirical Studies
Fiscal Effects on Taxpayers and Public Schools from All Empirical Studies
58
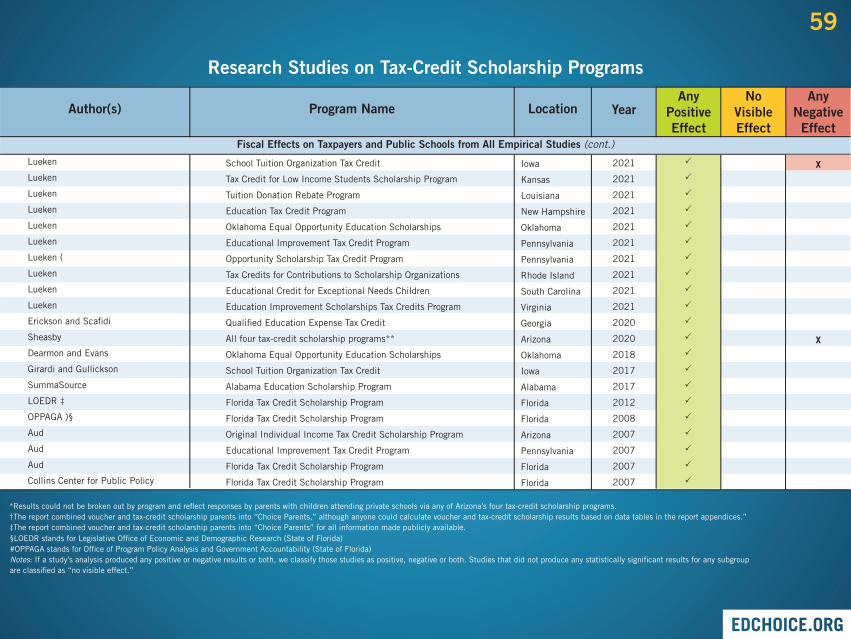
�
�
�
�
�
�
�
�
�
�
�
�
�
�
�
�
�
�
�
�
�
Research Studies on Tax-Credit Scholarship Programs
Lueken
Lueken
Lueken
Lueken
Lueken
Lueken
Lueken (
Lueken
Lueken
Lueken
Erickson and Scafidi
Sheasby
Dearmon and Evans
Girardi and Gullickson
SummaSource
LOEDR ‡
OPPAGA )§
Aud
Aud
Aud
Collins Center for Public Policy
Iowa
Kansas
Louisiana
New Hampshire
Oklahoma
Pennsylvania
Pennsylvania
Rhode Island
South Carolina
Virginia
Georgia
Arizona
Oklahoma
Iowa
Alabama
Florida
Florida
Arizona
Pennsylvania
Florida
Florida
2021
2021
2021
2021
2021
2021
2021
2021
2021
2021
2020
2020
2018
2017
2017
2012
2008
2007
2007
2007
2007
Author(s) Location YearAny
Positive Effect
Any Negative Effect
No Visible Effect
Program Name
School Tuition Organization Tax Credit
Tax Credit for Low Income Students Scholarship Program
Tuition Donation Rebate Program
Education Tax Credit Program
Oklahoma Equal Opportunity Education Scholarships
Educational Improvement Tax Credit Program
Opportunity Scholarship Tax Credit Program
Tax Credits for Contributions to Scholarship Organizations
Educational Credit for Exceptional Needs Children
Education Improvement Scholarships Tax Credits Program
Qualified Education Expense Tax Credit
All four tax-credit scholarship programs**
Oklahoma Equal Opportunity Education Scholarships
School Tuition Organization Tax Credit
Alabama Education Scholarship Program
Florida Tax Credit Scholarship Program
Florida Tax Credit Scholarship Program
Original Individual Income Tax Credit Scholarship Program
Educational Improvement Tax Credit Program
Florida Tax Credit Scholarship Program
Florida Tax Credit Scholarship Program
Fiscal Effects on Taxpayers and Public Schools from All Empirical Studies (cont.)
*Results could not be broken out by program and reflect responses by parents with children attending private schools via any of Arizona’s four tax-credit scholarship programs.†The report combined voucher and tax-credit scholarship parents into “Choice Parents,” although anyone could calculate voucher and tax-credit scholarship results based on data tables in the report appendices.”‡The report combined voucher and tax-credit scholarship parents into “Choice Parents” for all information made publicly available.§LOEDR stands for Legislative Office of Economic and Demographic Research (State of Florida)#OPPAGA stands for Office of Program Policy Analysis and Government Accountability (State of Florida)Notes: If a study’s analysis produced any positive or negative results or both, we classify those studies as positive, negative or both. Studies that did not produce any statistically significant results for any subgroup are classified as “no visible effect.”
X
X
59
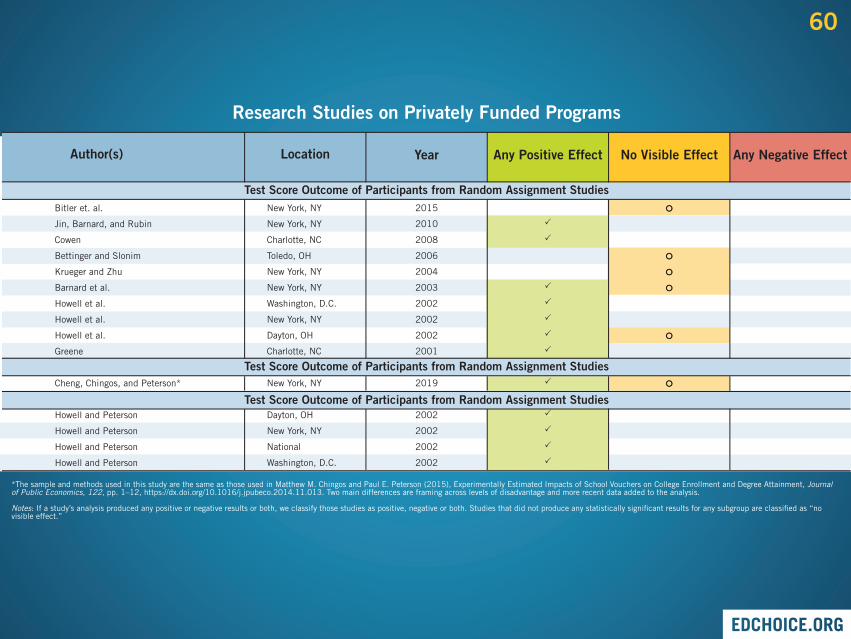
�
�
�
�
�
�
�
�
�
�
�
�
��
������
��
��
Research Studies on Privately Funded Programs
Bitler et. al.
Jin, Barnard, and Rubin
Cowen
Bettinger and Slonim
Krueger and Zhu
Barnard et al.
Howell et al.
Howell et al.
Howell et al.
Greene
Cheng, Chingos, and Peterson*
Howell and Peterson
Howell and Peterson
Howell and Peterson
Howell and Peterson
New York, NY
New York, NY
Charlotte, NC
Toledo, OH
New York, NY
New York, NY
Washington, D.C.
New York, NY
Dayton, OH
Charlotte, NC
New York, NY
Dayton, OH
New York, NY
National
Washington, D.C.
2015
2010
2008
2006
2004
2003
2002
2002
2002
2001
2019
2002
2002
2002
2002
Author(s) Location Year Any Positive Effect Any Negative EffectNo Visible Effect
Test Score Outcome of Participants from Random Assignment Studies
Test Score Outcome of Participants from Random Assignment Studies
Test Score Outcome of Participants from Random Assignment Studies
*The sample and methods used in this study are the same as those used in Matthew M. Chingos and Paul E. Peterson (2015), Experimentally Estimated Impacts of School Vouchers on College Enrollment and Degree Attainment, Journal of Public Economics, 122, pp. 1–12, https://dx.doi.org/10.1016/j.jpubeco.2014.11.013. Two main differences are framing across levels of disadvantage and more recent data added to the analysis.
Notes: If a study’s analysis produced any positive or negative results or both, we classify those studies as positive, negative or both. Studies that did not produce any statistically significant results for any subgroup are classified as “no visible effect.”
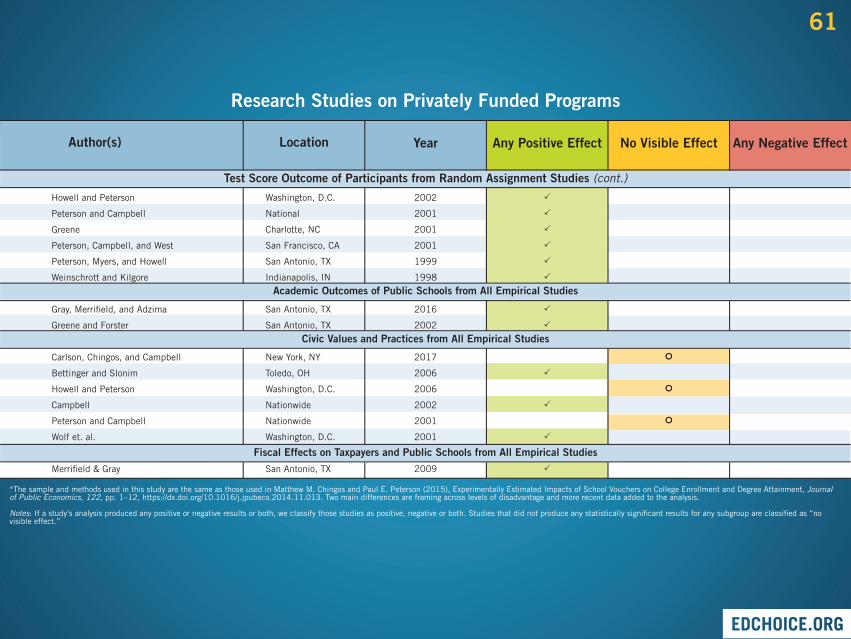
60
�
�
�
�
�
�
�
�
�
�
�
�
��
��
��
Research Studies on Privately Funded Programs
Howell and Peterson
Peterson and Campbell
Greene
Peterson, Campbell, and West
Peterson, Myers, and Howell
Weinschrott and Kilgore
Gray, Merrifield, and Adzima
Greene and Forster
Carlson, Chingos, and Campbell
Bettinger and Slonim
Howell and Peterson
Campbell
Peterson and Campbell
Wolf et. al.
Merrifield & Gray
Washington, D.C.
National
Charlotte, NC
San Francisco, CA
San Antonio, TX
Indianapolis, IN
San Antonio, TX
San Antonio, TX
New York, NY
Toledo, OH
Washington, D.C.
Nationwide
Nationwide
Washington, D.C.
San Antonio, TX
2002
2001
2001
2001
1999
1998
2016
2002
2017
2006
2006
2002
2001
2001
2009
Author(s) Location Year Any Positive Effect Any Negative EffectNo Visible Effect
Test Score Outcome of Participants from Random Assignment Studies (cont.)
Academic Outcomes of Public Schools from All Empirical Studies
Civic Values and Practices from All Empirical Studies
Fiscal Effects on Taxpayers and Public Schools from All Empirical Studies
*The sample and methods used in this study are the same as those used in Matthew M. Chingos and Paul E. Peterson (2015), Experimentally Estimated Impacts of School Vouchers on College Enrollment and Degree Attainment, Journal of Public Economics, 122, pp. 1–12, https://dx.doi.org/10.1016/j.jpubeco.2014.11.013. Two main differences are framing across levels of disadvantage and more recent data added to the analysis.
Notes: If a study’s analysis produced any positive or negative results or both, we classify those studies as positive, negative or both. Studies that did not produce any statistically significant results for any subgroup are classified as “no visible effect.”
61

Sign up for our email notifications and browse our research library at
For more on these slides, email [email protected]
WWW.EDCHOICE.ORG /123s
62