Embed Size (px)
Citation preview
1
THE INFRASTRUCTURE OPPORTUNITY :
A MACRO PERSPECTIVERajiv B. Lall
Managing Director & CEOInfrastructure Development Finance Company Limited
JAPANMAY 2007
2
The Context : India vs China
Consumption vs Investment led growth
Bottom Up vs Top Down
Private vs Government led build out of infrastructure
3
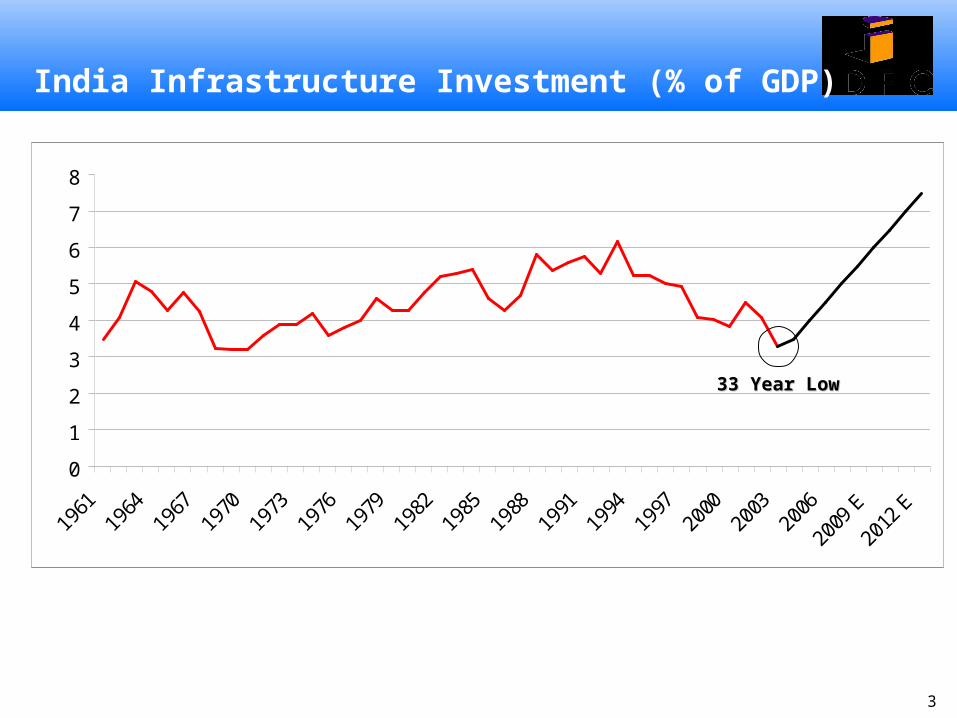
India Infrastructure Investment (% of GDP)
0
1
2
3
4
5
6
7
8
1961
1964
1967
1970
1973
1976
1979
1982
1985
1988
1991
1994
1997
2000
2003
2006
2009
E
2012
E
33 Year Low33 Year Low
4
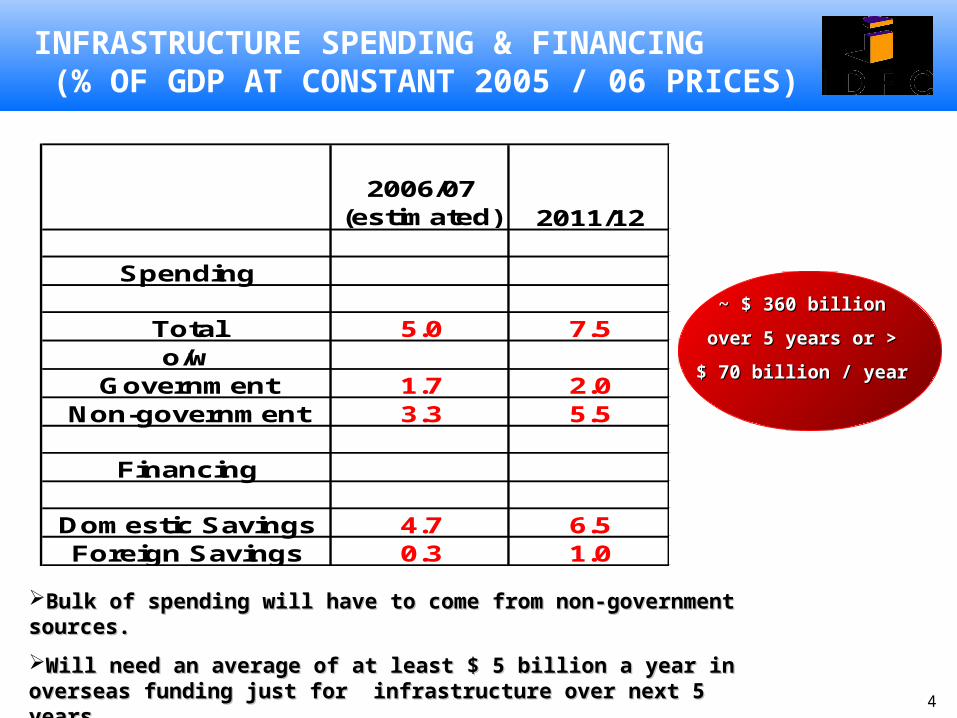
INFRASTRUCTURE SPENDING & FINANCING (% OF GDP AT CONSTANT 2005 / 06 PRICES)
Bulk of spending will have to come from non-government sources.Bulk of spending will have to come from non-government sources.
Will need an average of at least $ 5 billion a year in overseas funding Will need an average of at least $ 5 billion a year in overseas funding just for infrastructure over next 5 years.just for infrastructure over next 5 years.
2006/07 (estimated) 2011/12
Spending
Total 5.0 7.5o/w
Government 1.7 2.0Non-government 3.3 5.5
Financing
Domestic Savings 4.7 6.5Foreign Savings 0.3 1.0
~ $ 360 billion~ $ 360 billion
over 5 years or >over 5 years or >
$ 70 billion / year$ 70 billion / year
5
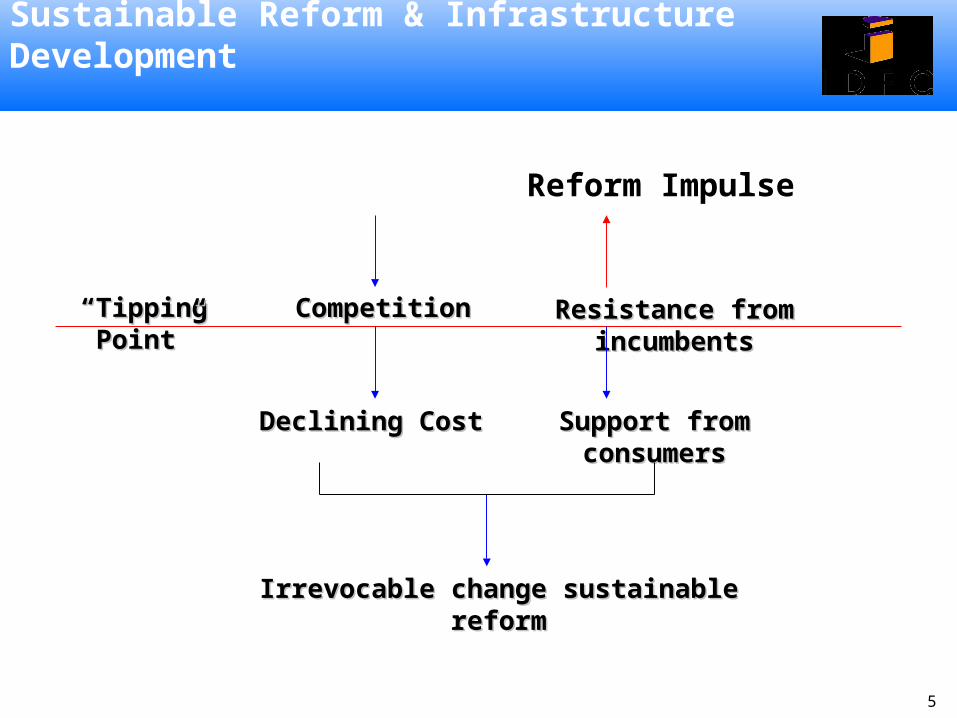
Sustainable Reform & Infrastructure Development
Reform Impulse
CompetitionCompetition Resistance from incumbentsResistance from incumbents
Declining CostDeclining Cost Support from consumersSupport from consumers
Irrevocable change sustainable reformIrrevocable change sustainable reform
““Tipping Point”Tipping Point”
6
Telecommunication Reforms
Telecommunications
In 1994 – Telecom policy – mobile phone licenses for major metros (2 in each city), followed by licenses for mobile and fixed line services in 15 circles (1 each) – major imbroglio due to unrealistic bidding
Resolved by a New Telecom Policy in 1999 – migration to a revenue share regime, more players, universal access service – challenge now is rural connectivity
Regulator (TRAI) established – initial hiccups but now functioning well Private investment has grown the market - over 200 million subscribers;
growing at over 5 million per month Prices – mobile from 37 cents per minute to 0.01 cents per minute
7
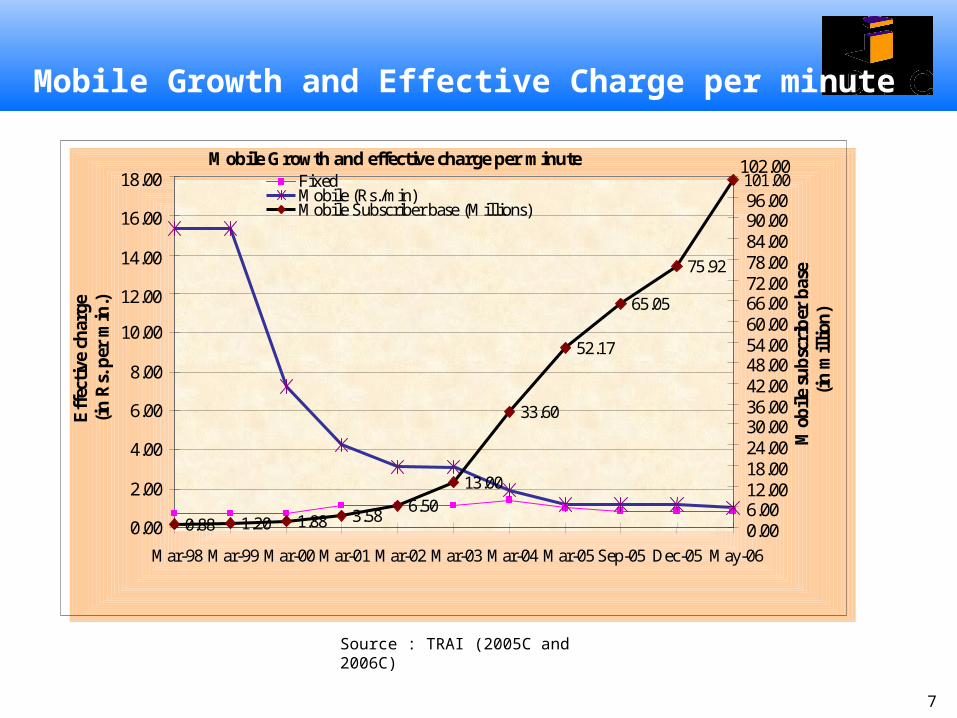
Mobile Growth and Effective Charge per minute
Source : TRAI (2005C and 2006C)
Mobile Growth and effective charge per minute
0.88 1.20 1.88 3.58 6.50
13.00
33.60
52.17
65.05
75.92
101.00
0.00
2.00
4.00
6.00
8.00
10.00
12.00
14.00
16.00
18.00
Mar-98 Mar-99 Mar-00 Mar-01 Mar-02 Mar-03 Mar-04 Mar-05 Sep-05 Dec-05 May-06
Eff
ecti
ve c
har
ge
(in
Rs.
per
min
.)
0.00 6.00 12.00 18.00 24.00 30.00 36.00 42.00 48.00 54.00 60.00 66.00 72.00 78.00 84.00 90.00 96.00
102.00
Mob
ile
sub
scri
ber
bas
e
(in
mil
lion
)
Fixed Mobile (Rs./min) Mobile Subscriber base (Millions)
8
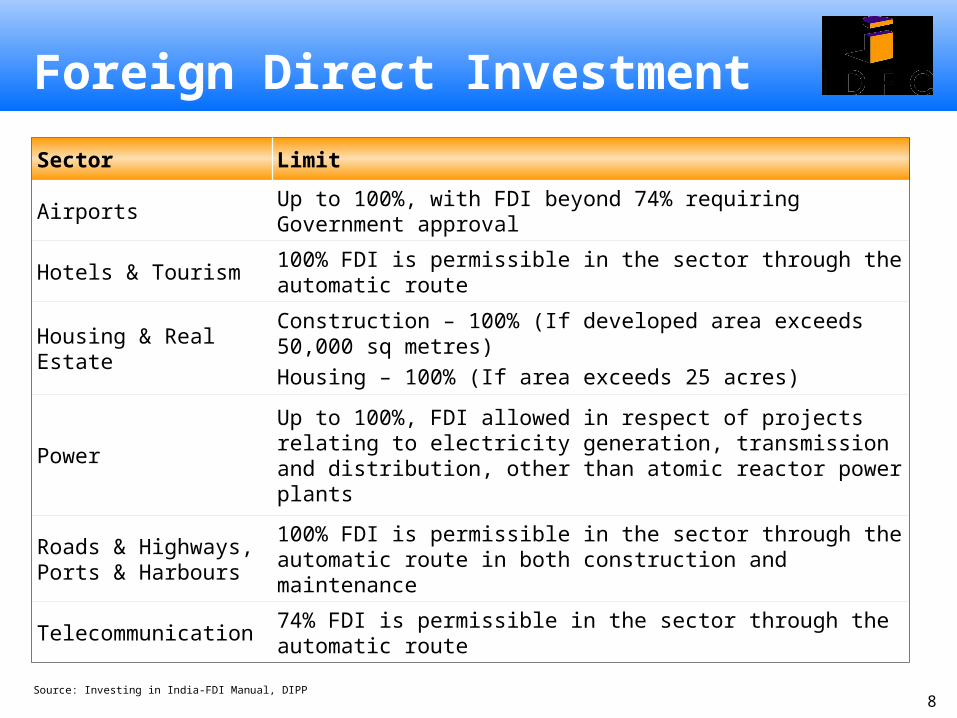
Sector Limit
AirportsUp to 100%, with FDI beyond 74% requiring Government approval
Hotels & Tourism100% FDI is permissible in the sector through the automatic route
Housing & Real Estate
Construction – 100% (If developed area exceeds 50,000 sq metres)Housing – 100% (If area exceeds 25 acres)
PowerUp to 100%, FDI allowed in respect of projects relating to electricity generation, transmission and distribution, other than atomic reactor power plants
Roads & Highways, Ports & Harbours
100% FDI is permissible in the sector through the automatic route in both construction and maintenance
Telecommunication74% FDI is permissible in the sector through the automatic route
Source: Investing in India-FDI Manual, DIPP
Foreign Direct Investment
9
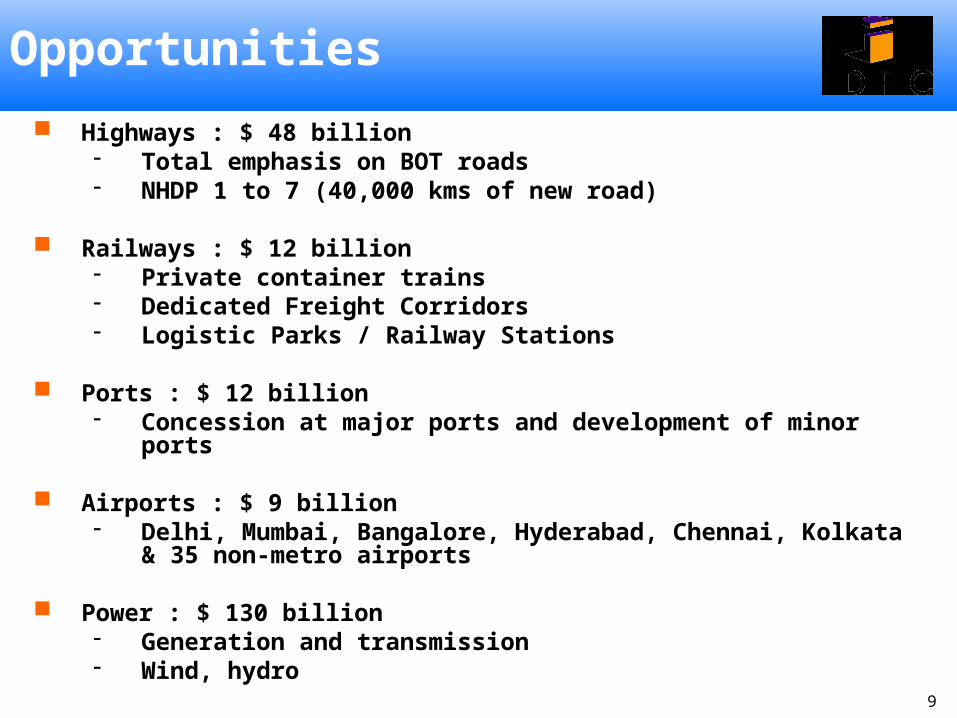
Opportunities
Highways : $ 48 billion Total emphasis on BOT roads NHDP 1 to 7 (40,000 kms of new road)
Railways : $ 12 billion Private container trains Dedicated Freight Corridors Logistic Parks / Railway Stations
Ports : $ 12 billion Concession at major ports and development of minor
ports
Airports : $ 9 billion Delhi, Mumbai, Bangalore, Hyderabad, Chennai, Kolkata
& 35 non-metro airports
Power : $ 130 billion Generation and transmission Wind, hydro
10
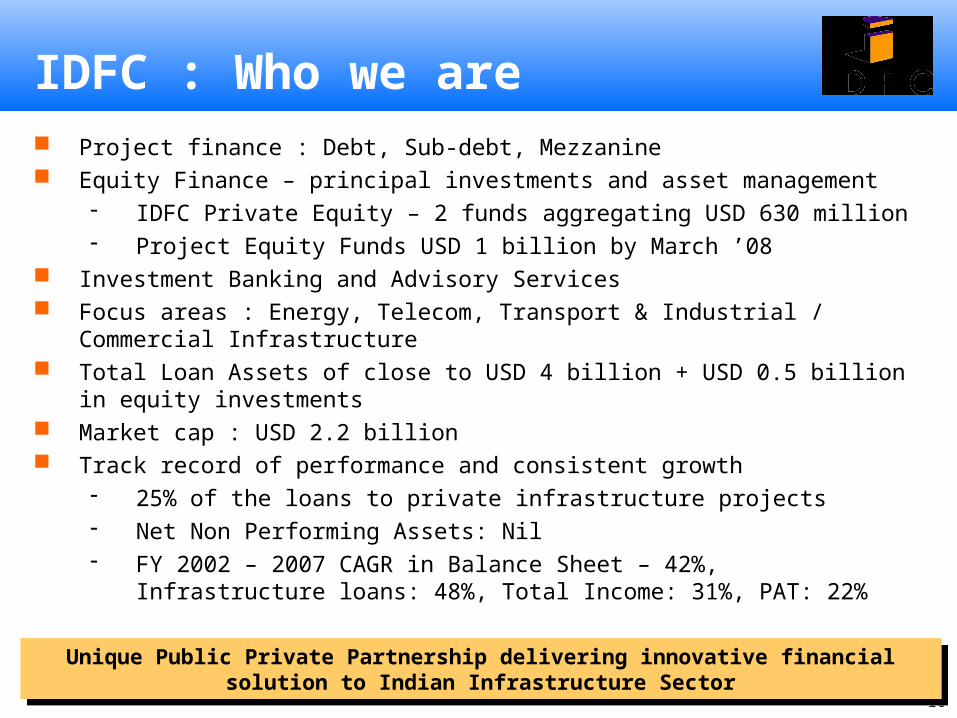
IDFC : Who we are Project finance : Debt, Sub-debt, Mezzanine Equity Finance – principal investments and asset management
IDFC Private Equity – 2 funds aggregating USD 630 million Project Equity Funds USD 1 billion by March ’08
Investment Banking and Advisory Services Focus areas : Energy, Telecom, Transport & Industrial / Commercial
Infrastructure Total Loan Assets of close to USD 4 billion + USD 0.5 billion in equity
investments Market cap : USD 2.2 billion Track record of performance and consistent growth
25% of the loans to private infrastructure projects Net Non Performing Assets: Nil FY 2002 – 2007 CAGR in Balance Sheet – 42%, Infrastructure
loans: 48%, Total Income: 31%, PAT: 22%
Unique Public Private Partnership delivering innovative financial solution to Indian Infrastructure Sector
Unique Public Private Partnership delivering innovative financial solution to Indian Infrastructure Sector