Embed Size (px)
Citation preview

1
THE REPUBLIC OF SOUTH AFRICA
Investor Presentation October 2014

Table of contents
Slide
1) Key highlights 3 2) Macro economic developments 5
2
3) Public finance 12 4) Financing of borrowing requirement 18 5) Holdings of government bonds
24

3
1. Key highlights

Summary of the MTBPS
• The budget policy framework for the next three years is designed to ensure fiscal sustainability while shifting spending towards government’s priorities as set out in the NDP and MTSF
• South Africa’s weaker-than-expected economic performance and outlook pose new fiscal challenges
• GDP growth of 1.4% is expected in 2014, rising to 3.0% in 2017
• Government proposes a fiscal package that reduces growth in spending by lowering the 2014 Budget expenditure ceiling by R25`billion over the next two years and adjusting tax policy to generate additional revenue of at least R27 billion over two years
• The fiscal package results in net debt stabilising at 45.9% of GDP by 2017/18
• Overall, public spending will rise by 7.6% a year over the medium-term, with post school education and training, housing development, social infrastructure, employment, labour affairs and social security funds receiving the largest increases
• Over the medium to long-term, a combination of these fiscal measures and the microeconomic interventions in the Medium Term Strategic Framework will place the economy on a more sustainable development path
4

5
2. Macro economic developments

Global outlook remains uneven
• Moderately improving economic growth rates in developed markets are expected to contribute to stronger global demand and international trade – but the economic outlook is fragile and uneven
• Developed economies: US recovering, but EU and Japan remain weak. There is growing monetary policy divergence.
• Emerging economies: Growth has been revised downwards due to:
− rebalancing of growth − supply side constraints and reliance on
commodity exports• Risks:
− potential financial markets volatility given different monetary policy responses
− shifting trade patterns− Vulnerability of EMs to fluctuations in
capital flows
IMF growth projections
Source: Bloomberg
Region / country 2013 2014 2015 2016 2013 2014 2015 2016
Percentage
World 3.3 3.3 3.8 4.0 3.9 3.8 3.9 3.8
Advanced economies 1.4 1.8 2.3 2.4 1.4 1.6 1.8 2.0
US 2.2 2.2 3.1 3.0 1.5 2.0 2.1 2.1
Euro area -0.4 0.8 1.3 1.7 1.3 0.5 0.9 1.2
UK 1.7 3.2 2.7 2.4 2.6 1.6 1.8 2.0
Japan 1.5 0.9 0.8 0.8 0.4 2.7 2.0 2.6
Emerging markets and developing countries
4.7 4.4 5.0 5.2 5.9 5.5 5.6 5.2
Brazil 2.5 0.3 1.4 2.2 6.2 6.3 5.9 5.6
Russia 1.3 0.2 0.5 1.5 6.8 7.4 7.3 6.0
India 5.0 5.6 6.4 6.5 9.5 7.8 7.5 6.7
China 7.7 7.4 7.1 6.8 2.6 2.3 2.5 3.0
Sub-Saharan Africa 5.1 5.1 5.8 6.0 6.6 6.7 7.0 6.5
South Africa2 1.9 1.4 2.5 2.8 5.8 6.3 5.9 5.6
1. IMF World Economic Outlook, October 20142. National Treasury forecasts
GDP projections1 Consumer price index projections1
6

The macroeconomic forecast has been revised downwards
7
Calendar year 2011 2012 2013 2014 2015 2016 2017
Actual Estimate Forecast
Percentage change unless otherwise indicated
Final household consumption 4.9 3.5 2.6 1.9 2.3 2.8 3.0
Final government consumption 4.3 4.0 2.4 1.8 1.5 1.5 1.5
Gross f ixed capital formation 4.2 4.4 4.7 2.7 3.6 4.7 5.1
Gross domestic expenditure 4.6 4.0 2.2 0.9 2.6 3.0 3.3
Exports 6.8 0.4 4.2 3.1 4.2 4.7 5.2
Imports 10.0 6.0 4.7 1.0 4.1 5.0 5.6
Real GDP growth 3.6 2.5 1.9 1.4 2.5 2.8 3.0
GDP inflation 5.9 4.5 5.8 6.1 5.8 5.7 5.6
GDP at current prices (R billion) 2 932.7 3 139.0 3 385.4 3 642.6 3 952.6 4 295.8 4 675.6
Nominal GDP growth 9.7 7.0 7.8 7.6 8.5 8.7 8.8
Headline CPI inf lation (Dec 2012 = 100) 5.0 5.7 5.8 6.3 5.9 5.6 5.4
Current account balance (% of GDP) -2.3 -5.2 -5.8 -5.6 -5.4 -5.2 -5.0
Source: Reserve Bank and National Treasury
• Growth expected to be 1.4% this year from 3.6% 2011 due to work stoppages, labour disputes, electricity constraints and other supply side shocks
• It is expected to pick up to 3.0% in 2017 as the global outlook improves, confidence returns to the economy as constraints are relieved
Macroeconomic forecast , 2011-2017

Structural imbalances and constraints have lowered domestic GDP
• South African growth has been weaker than peer countries, and has diverged from tracking the global average
• A number of domestic constraints perceived as temporary have become embedded in expectations
• Mining & manufacturing have been volatile – due to stoppages (labour relations and infrastructure)
• Manufacturing sector has also been affected by linkages to mining and infrastructure constraints
• GDP excluding mining and manufacturing is also slowing and only grew by 1.8% in 2014Q2
World, Regional and South African Growth
Source: Statistics South Africa
2000
2001
2002
2003
2004
2005
2006
2007
2008
2009
2010
2011
2012
2013
2014
2015
2016
2017
-4
-2
0
2
4
6
8
10
WorldEmerging market and developing economiesSub-Saharan AfricaSouth Africa
Per
cen
t
8

The “twin deficits” pose a risk to South Africa’s investment perception, outlook positive
9
-8
-6
-4
-2
0
2
4
6
-8 -7 -6 -5 -4 -3 -2 -1 0
Cu
rren
t acco
un
t b
ala
nce (
per
cen
t o
f G
DP
)
Fiscal balance (per cent of GDP)
India
South Africa
Argentina
Mexico
Brazil Australia
Malaysia
Poland
HungaryThailand
Romania
Canada
Indonesia
Chile
Colombia
TurkeyPeru
China
RussiaPhilippines
• The current account and the fiscal deficits remain high in comparison to “peer” countries
• The “twin” deficits, combined with electricity shortages and low growth prospects are seen as key risks by investors
• Trade and investment income outlook points to medium-term correction
Current account and fiscal balances among “peers”
Source: IMF World Economic Outlook October 2014
Percentage of GDP 2007 2008 2009 2010 2011 2012 2013 20141
Total current account -7.0 -7.2 -4.0 -2.0 -2.3 -5.2 -5.9 -5.4
Trade balance -1.8 -1.6 0.1 1.9 1.6 -1.3 -2.2 -2.5
Net services, income and transfer receipts
-5.2 -5.6 -4.1 -3.8 -3.9 -4.0 -3.7 -2.9
Source: Reserve Bank

Traditional exports are under pressure, but new opportunities are emerging
2013 20141 2000 2012 2013 20141
Contribution to export growth
% Share
EU 3.0 4.3 31.3 20.6 21.0 23.5
Germany 0.6 0.9 7.8 5.4 5.3 5.9
UK 0.6 0.9 8.9 3.9 4.0 4.4
Netherlands 0.8 0.7 3.3 3.5 3.8 4.5
India -0.3 1.2 1.4 4.3 3.6 4.8
Brazil -0.0 -0.0 0.7 0.9 0.8 0.8
China 4.0 -0.0 2.0 11.6 13.9 12.6
SADC 2.5 1.3 9.8 12.9 13.7 13.6
Mozambique 1.1 0.5 2.3 2.7 3.4 3.7
Zimbabwe 0.5 0.3 2.2 2.7 2.8 2.8
Zambia 0.6 0.4 2.0 2.9 3.1 3.2
US 0.5 -0.2 12.0 8.8 8.3 8.1
Japan 1.2 -0.7 8.1 6.3 6.7 5.7
Unallocated2 -1.4 -1.6 15.2 11.0 8.5 7.1
Other3 2.8 2.1 19.6 23.7 23.5 23.8
Total 12.4 6.5 100.0 100.0 100.0 100.0 1. First seven months of 20142. Commodities, such as gold, sold through exchanges 3. Includes Hong Kong, Korea, Singapore, Malaysia, Australia, Nigeria, Ghana, Angola, Egypt and United Arab EmiratesSource: Quantec
• Growth of exports to EU expected to be muted
• Commodity exports to China expected to be weak
• But SADC exports are diversified and grow strongly, with SADC forecast expected to grow above 5% over MTEF
• Other export opportunities emerging, with rising share of non-traditional markets (other)
• SADC becoming increasingly important export destination, especially for manufactured goods
Major export destinations for South African products
10

Risks to growth remain to the downside, but there are mitigating factors
Downside risks
• Volatility and risk of EM capital outflows• Weaker Chinese growth and lower commodity prices• Domestic supply side bottlenecks
Factors to support growth
• MTSF provides policy certainty and clear implementation plan for NDP• New emerging export destinations, especially SADC • Continued investment in infrastructure will reduce supply constraints, improve
competitiveness• The rand’s weaker real effective exchange rate, if not eroded by above productivity wage
settlements is expected to support competitiveness in tradable goods sectors• Various electricity supply options could release bottlenecks and support investments
(including private procurement, increased energy efficiency, cogeneration, imports)
11

12
3. Public Finance

Proposed fiscal package to reinforce sustainability
• In order to narrow the deficit and stabilise debt over the medium term, government proposes a fiscal package with the following five elements:
− Reduce growth in spending by lowering the 2014 Budget expenditure ceiling by R25`billion over the next two fiscal years
− Adjust tax policy and administration. Proposals will be introduced in the 2015 Budget to generate additional revenue of at least R27 billion over the next two fiscal years
− Place greater emphasis on longer-term planning and efficient resource allocation,
within a framework that links expenditure and economic growth beyond the medium term
− Freeze government personnel headcounts. Government will also review funded vacancies
− Adopt a deficit-neutral approach to the financing requirements of state-owned companies over the next two fiscal years
13

Fiscal framework including the proposed fiscal package
14
2011/12 2012/13 2013/14 2015/16 2016/17 2017/18
R billion/Percentage of GDP Outcome Budget Revised Main budget
Revenue 745.3 799.2 886.1 962.8 956.6 1,055.1 1,169.4 1,272.9
Expenditure 889.9 965.5 1,047.8 1,142.6 1,136.3 1,222.3 1,308.4 1,416.7
of which
Non-interest allocations 813.5 877.4 946.6 1,024.7 1,021.9 1,090.8 1,153.9 1,222.0
Debt-service costs 76.5 88.1 101.2 114.9 114.5 126.5 139.4 149.7
Unallocated reserves – – – 3.0 – 5.0 15.0 45.0
Main budget balance -144.6 -166.3 -161.7 -179.8 -179.7 -167.2 -139.0 -143.8
-4.9% -5.2% -4.7% -4.7% -4.8% -4.1% -3.2% -3.0%
Cash balances of social security funds, public entities and
33.8 30.1 27.0 26.7 26.5 22.7 25.0 25.0
Consolidated budgetbalance
-110.8 -136.2 -134.7 -153.1 -153.2 -144.5 -114.1 -118.7
-3.7% -4.3% -3.9% -4.0% -4.1% -3.6% -2.6% -2.5%
Medium-term estimates
2014/15
Consolidated fiscal framework, 2011/12 – 2017/18Consolidated fiscal framework, 2011/12 – 2017/18
Source: National Treasury

Spending continues to grow in real term, while reaching a primary balance within the current MTEF
15
18
20
22
24
26
28
30
1996/97
1998/99
2000/01
2002/03
2004/05
2006/07
2008/09
2010/11
2012/13
2014/15
2016/17
Per c
ent o
f GDP
RevenueNon-interest expenditure
Main budget non-interest spending Main budget primary balance
12.1
13.5
10.1 9.78.4 8.9
10.8
3.24.2
2.2 2.0 1.6 1.3 1.12.9
0
2
4
6
8
10
12
14
16
2003/04
2004/05
2005/06
2006/07
2007/08
2008/09
2009/10
2010/11
2011/12
2012/13
2013/14
2014/15
2015/16
2016/17
2017/18
Per c
ent r
eal g
row
th
Source: National Treasury

Net national government debt stabilising in 2017/18
16
• Before the proposed changes, national government’s net debt was projected to continue growing as a share of GDP beyond 2021
• The fiscal package results in net debt stabilising at 45.9% of GDP in 2017/18, while gross debt remains below 50% of GDP
20
25
30
35
40
45
50
2007/08
2008/09
2009/10
2010/11
2011/12
2012/13
2013/14
2014/15
2015/16
2016/17
2017/18
2018/19
2019/20
2020/21
Per c
ent o
f GDP
MTBPS 2012
MTBPS 2013
MTBPS 2014 before fiscal package
MTBPS 2014 including fiscal package
Projections
Net national government debt
Source: National Treasury

Risks to the proposed fiscal framework
• Economic outlook:− Rising global interest-rate cycle likely to place pressure on domestic interest rates,
increasing the costs of issuing debt− The current account deficit remains persistently high, making SA more vulnerable to shifts
in investment flows and market sentiment− A further deterioration in the GDP would require consideration of additional measures
• Government’s wage bill:− Budgets assume CPI cost-of-living adjustments and headcount numbers at current levels− Current constraints suggest limited scope for additional resources− Deviations from CPI-linked cost-of-living adjustments will require either a reallocation of
resources or a reduction in government employment
• A new framework for funding of SOCs and public entities will focus on:− Distinguishing purely commercial activities from the costs of exercising their
developmental mandates− Close monitoring to ensure efficient delivery on government priorities, while
simultaneously promoting improved commercial performance− Introducing more stringent financial reporting requirements for public entities− Capitalisation will be funded from sale of non-strategic state assets, and will not be drawn
from tax revenue
17

18
4. Financing of borrowing requirement

National government gross borrowing requirement and financing
19
Financing of national government borrowing requirement, 2013/14 – 2017/18
2013/14 2014/15 2015/16 2016/17 2017/18
R million Outcome Budget Revised Medium-term estimates
Main budget balance1 -161 701 -179 781 -179 711 -167 187 -139 016 -143 770
Financing
Domestic short-term loans (net) 23 048 23 000 10 000 13 000 24 000 40 000
Treasury bills 20 221 23 000 10 000 13 000 24 000 40 000
Corporation for Public Deposits 2 827 – – – – –
Domestic long-term loans (net) 149 414 132 098 153 926 137 712 107 694 88 845
Market loans (gross) 172 112 167 103 187 360 165 500 165 500 176 914
Loans issued for switches2 -1 135 – 243 – – – Redemptions -21 563 -35 005 -33 677 -27 788 -57 806 -88 069
Foreign loans (net) 378 1 288 8 263 5 879 3 418 12 406
Market loans (gross) 19 619 16 290 22 952 9 826 16 635 16 005
Arms procurement loan agreements – – – – – –
Redemptions (including revaluation of loans)
-19 241 -15 002 -14 689 -3 947 -13 217 -3 599
Change in cash and other balances3 -11 139 23 395 7 522 10 596 3 904 2 519
Total 161 701 179 781 179 711 167 187 139 016 143 770
Source: National Treasury
• Budget balance to moderate to R143 billion in 2017/18• Funding to be raised largely from the domestic bond market• Bond issuance remains at current levels over next 2 fiscal years increasing to R176.9 billion in
2017/18 due to higher redemptions• Loan redemptions projected to total R155 billion over medium-term

Long-term bond issuance, still the strategy
Inflation-linked bonds issuance YTD
Source: National Treasury
Fixed-rate bonds issuance YTD • The most issued bond is the R2030, with R15.7 billion in issuance
• The R2032 bond also showed good interest with R15.3 billion issued year-to- date
• Two new bonds were introduced, the R2032 and R2044
• Inflation-linked auctions also generated some good interest, issuance was spread across the five bonds
• The I2038 is the most issued bond with R8.1 billion issued
20
R2023 (2023)
R186 (2025/26/27)
R2030 (2030)
R213 (2031)
R2032 (2032)
R209 (2036)
R2037 (2037)
R214 (2041)
R2044 (2044)
R2048 (2047/48/49)0
2,0004,0006,0008,000
10,00012,00014,00016,000
3,045 2,402
15,740
3,514
15,390
2,826
8,505
3,968
9,137
12,633
R m
illi
on
R212 (2022) I2025 (2025) I2038 (2038) I2046 (2046) I2050 (2049/50/51)
–
1,000
2,000
3,000
4,000
5,000
6,000
7,000
8,000
9,000
1,765
5,470
8,165
3,082 3,726
R m
illio
n

Average bid to cover ratio of fixed-rate bond auctions
21
Source: SA National Treasury
R208
R202
3
R186
• Issuance was across the curve- Fixed-rate bond auctions
remains over-subscribed.- The R209 bond and the
R2044 bond has the highest subscription rates
• Healthy demand in inflation-linked bonds auctions
- The I2050 has the highest subscription rate of all inflation-linked bonds.
- The I2038 is the most issued bond
Average bid to cover ratio of Inflation- linked bond auctions
Government auctions remain well subscribed
0
5,000
10,000
15,000
20,000
25,000
30,000
0
1
2
3
4
5
2.9 3.1 2.8 2.83.2
3.9
3.0 2.7
3.8
2.8
Amount Bid-to-coverYears
R m
illi
on
Bid
-to
-co
ver
rati
o
R2048
R186
R2
03
0
R213
R203
7
R209
R2
14
R2
02
3
R203
2
R204
4
10.3 13.4 23.3 31.5 36.2
0
1,000,000,000
2,000,000,000
3,000,000,000
4,000,000,000
5,000,000,000
6,000,000,000
7,000,000,000
8,000,000,000
0
1
2
3
1.6 1.61.8 1.9 2.0
Amount Average bid-to-cover ratioYears
R m
illi
on
Bid
-to
-co
ver
rati
o
I205
0
R21
2
I203
8
I204
6
I202
5

Non-competitive auctions performance per funding instrument
22
Source: SA National Treasury
R208
R202
3
R186
• R21 billion raised through non- competitive auction as at end of September
• The highest amount of R5 billion was taken-up in August
• The non-comps we increased from 50% to 100% on the new R2032 and R2044 bonds until the outstanding amount reached R10 billion
- R4.8 billion raised on the R2032 bond and R3.3 billion on the R2044 bond
Monthly take-up of non-competitive auctions
Non-competitive auctions well taken-up
0
1,000
2,000
3,000
4,000
5,000
6,000
Years
R m
illi
on
R204
8
R186 R2
030
R213
R203
7R209
R214R2
023
R204
4
R203
2
Apr-14 May-14 June-14 July-14 Aug-14 Sept-140
1,000
2,000
3,000
4,000
5,000
6,000
R m
illi
on

Fixed-rate bond yield curve movement
23
Source: SA National Treasury
R208
R202
3
R186
• Long-end of the curve flattening but
remains steep on the short-end.
- Foreign and local demand for the long
end
• Yields have strengthened since April
2014
- Fixed-rate bonds by about 18 basis
points
- Inflation-linked bonds by about 5 basis
points
• Strategy to issue long adopted in order to- Minimize refinancing risk and
- Accommodate the elevated funding
requirement
• Strategy consistent with borrowing for
infrastructure and adheres to inter-
generational equity principle
Inflation-linked bond yield curve movement
Stabilised borrowing costs since April 2014

24
5. Holdings of government bonds
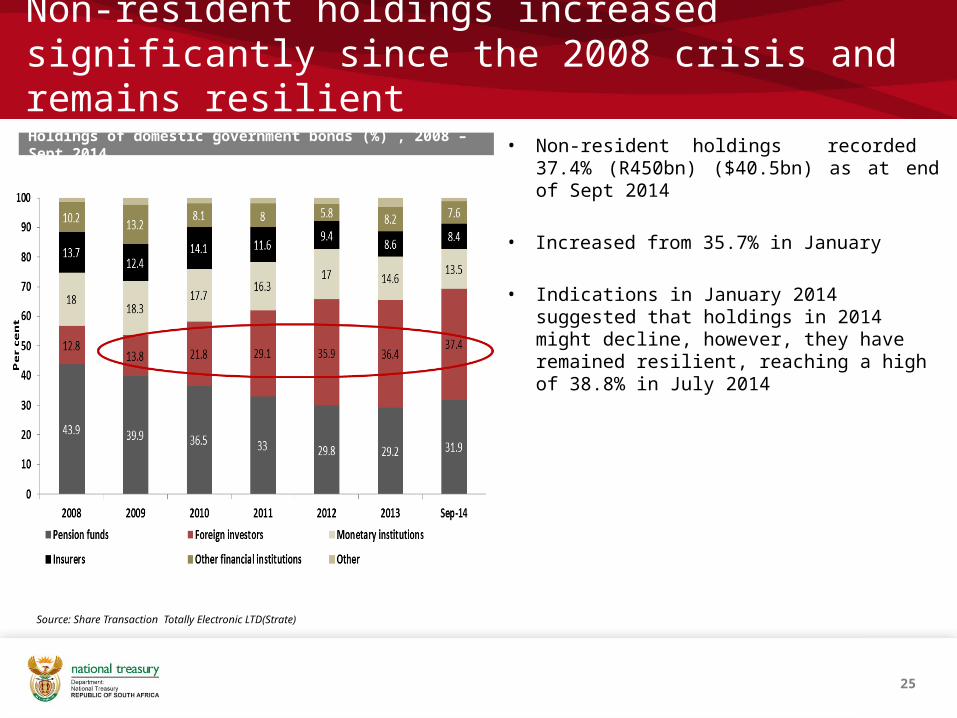
Non-resident holdings increased significantly since the 2008 crisis and remains resilient
• Non-resident holdings recorded 37.4% (R450bn) ($40.5bn) as at end of Sept 2014
• Increased from 35.7% in January
• Indications in January 2014 suggested that holdings in 2014 might decline, however, they have remained resilient, reaching a high of 38.8% in July 2014
Holdings of domestic government bonds (%) , 2008 – Sept 2014
Source: Share Transaction Totally Electronic LTD(Strate)
25

Holdings of fixed-rate government bonds
Ownership of fixed-rate bonds by maturity area
Source: STRATE, SA National Treasury
Ownership of fixed-rate bonds by sector, Sept 2014 • Non-residents account for 46% of fixed-rate bonds holdings
– Non-resident are overweight in the short to mid end of the curve, owning more than 50% of R203, R204 ,R207, R208 bonds and R2023
– Also starting to buy the long of the curve, owning more than 50% of the R214
• Official pension funds own 21% of fixed-rate bonds
– Together the pension funds sector owns about 24% of the bonds across the curve
• As expected long-term insurers overweight at the long-end of the curve
26
Foreign sector, 46%
Monetary authorities; 13%
Long-term insurers; 9%Short-term insurers; 0%
Private self-admin-istered funds; 3%
Official pension funds ; 21%
Other financial institutions; 7% Other sector ; 0.8%
R201 (2014)
R158 (2015)
R204 (2018)
R208 (2021)
R186 (2026)
R213 (2031)
R209 (2036)
R214 (2041)
R2048 (2048)0%
10%20%30%40%50%60%70%80%90%
100%
Foreign sector Monetary authorities Long-term insurersShort-term insurers Private self-administered funds Official pension funds Other financial institutions Other sector

Holdings of inflation-linked government bonds
• The bulk of the inflation-linked bonds are owned by pension funds and monetary institutions – Together accounting for about 65% of the
total outstanding
• Non-residents only owning 4% of the total outstanding
• Long-term and short-term insurers are underweight inflation linkers with combined ownership of 5%
Ownership of inflation-linked bonds by maturity area, Sept 2014
Ownership of inflation-linked bonds by sector, Sept 2014
27
Source: Share Transaction Totally Electronic LTD(Strate)
Foreign sector; 4%
Monetary authorities; 17%
Long-term insurers, 4%
Short-term insurers, 1%
Private self-adminis-tered funds; 17%
Official pension funds ; 48%
Other financial institu-tions; 9%
Other sector ; 0.7%
R211 (2017)
R212 (2022)
R197 (2023)
I2025 (2025)
R210 (2028)
R202 (2033)
I2038 (2038)
I2046 (2046)
I2050 (2050)0%
10%20%30%40%50%60%70%80%90%
100%
Foreign sector Monetary authorities Long-term insurersShort-term insurers Private self-administered funds Official pension funds Other financial institutions Other sector

THANK YOU
28