Embed Size (px)
Citation preview

1
The Root Causes of the Crisis:What have We Learned?
Bob DeYoung Capitol Federal Professor
University of Kansas School of Business
Summer Teacher InstituteUniversity of Chicago
June 2009

2
Case-Shiller Home Price Index
0
50
100
150
200
25019
87
1988
1989
1990
1991
1992
1993
1994
1995
1996
1997
1998
1999
2000
2001
2002
2003
2004
2005
2006
2007
2008
2009
From 1997 to 2006, home prices increased at a 9.1% annual rate.
Home prices have declined
more than 25% since 2006.

3
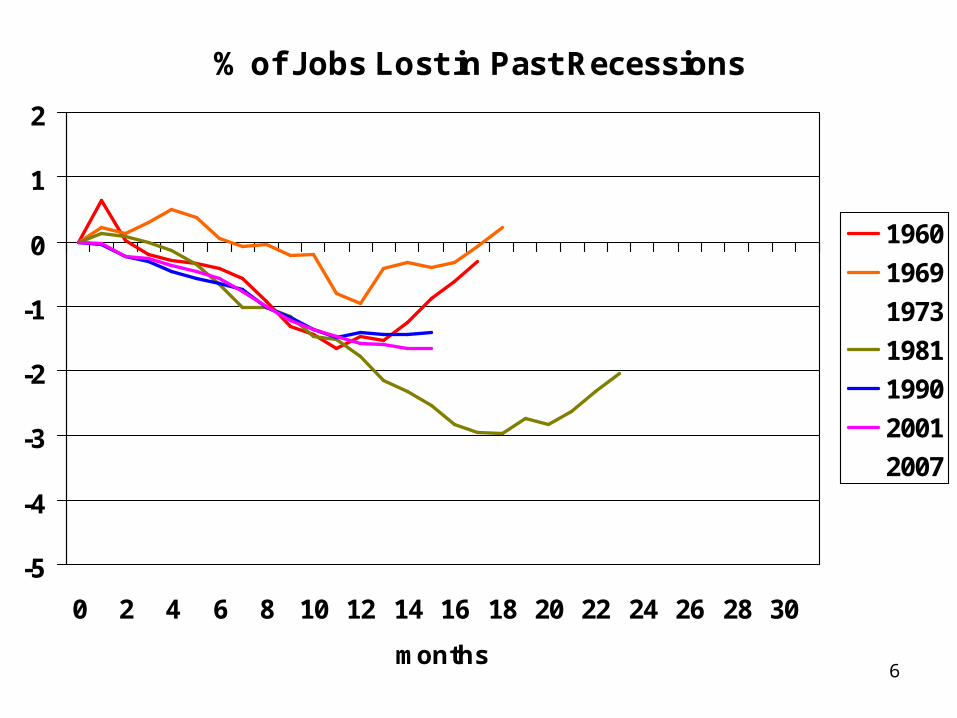
% of Jobs Lost in Past Recessions
-5
-4
-3
-2
-1
0
1
2
0 2 4 6 8 10 12 14 16 18 20 22 24 26 28 30
months
1960
1969
1973
1981
1990
2001
2007

4
% of Jobs Lost in Past Recessions
-5
-4
-3
-2
-1
0
1
2
0 2 4 6 8 10 12 14 16 18 20 22 24 26 28 30
months
1960
1969
1973
1981
1990
2001
2007

5
% of Jobs Lost in Past Recessions
-5
-4
-3
-2
-1
0
1
2
0 2 4 6 8 10 12 14 16 18 20 22 24 26 28 30
months
1960
1969
1973
1981
1990
2001
2007
6
% of Jobs Lost in Past Recessions
-5
-4
-3
-2
-1
0
1
2
0 2 4 6 8 10 12 14 16 18 20 22 24 26 28 30
months
1960
1969
1973
1981
1990
2001
2007

7
% of Jobs Lost in Past Recessions
-5
-4
-3
-2
-1
0
1
2
0 2 4 6 8 10 12 14 16 18 20 22 24 26 28 30
months
1960
1969
1973
1981
1990
2001
2007

8
% of Jobs Lost in Past Recessions
-5
-4
-3
-2
-1
0
1
2
0 2 4 6 8 10 12 14 16 18 20 22 24 26 28 30
months
1960
1969
1973
1981
1990
2001
2007

9
% of Jobs Lost in Past Recessions
-5
-4
-3
-2
-1
0
1
2
0 2 4 6 8 10 12 14 16 18 20 22 24 26 28 30
months
1960
1969
1973
1981
1990
2001
2007

10
My talk today
All recessions are different. This recession was caused by a collapse in residential real estate values.
Real economy: Home prices fell Housing sector collapsed Aggregate spending declined.
• This is a demand-side story.
• Reduced spending on houses and related items.
Financial sector: Mortgage defaults Big losses on mortgage-backed securities Investor uncertainty.
• This is a supply-side story.
• Less credit available for businesses and households.

11
My talk today
1. Root causes of the recession:– A bubble in the housing market.– A new lending model (which performed poorly).– A history of short-sighted economic, financial, and
social policies. – Bad financial behavior by households.
2. What have we learned? – Have the responses of policymakers been appropriate? – Have households changed behavior?

12
Root Causes of the Crisis:
• Housing bubble.
• A new banking model.
• Poor historical public policy.
• Poor household finance.

13
Rate of Homeownership in U.S.
35%
40%
45%
50%
55%
60%
65%
70%
75%19
00
1920
1940
1960
1980
2000
2002
2004
2006
2008
• GI Bill
• Automobile/Suburbs
• High income tax rates.

14
Rate of Homeownership in U.S.
35%
40%
45%
50%
55%
60%
65%
70%
75%19
00
1920
1940
1960
1980
2000
2002
2004
2006
2008
• Affordable home policies.
• Easier access to mortgage credit.

15
Case-Shiller Home Price Index
0
50
100
150
200
25019
87
1988
1989
1990
1991
1992
1993
1994
1995
1996
1997
1998
1999
2000
2001
2002
2003
2004
2005
2006
2007
2008
2009
From 1997 to 2006, home prices increased at a 9.1% annual rate.

16
Home Price
Home Sales
Increased House Demand
• Easy Federal Reserve monetary policy.
• Mortgage interest tax deduction.
• Policies to provide "affordable housing."
• Ownership Society.
• Originate-to-Securitize banking model.

17
1970 2007
Depository Institutions(banks, thrifts, credit unions)
54.4%
Insurance Companies(life, property & casualty)
17.4
Pension Funds(public, private)
14.6
Mortgage and Consumer Finance(GSEs, finance companies,
REITs, securitized asset pools)8.8
Mutual Funds(stock, bond, money market)
3.7
Securities Firms(brokers, dealers, funding corps.)
1.2
Distribution of Assets held at Financial Intermediaries in the U.S.
Banks were the center for: • Personal savings
• Business credit
• Payments

18
1970 2007
Depository Institutions(banks, thrifts, credit unions)
54.4% 22.8%
Insurance Companies(life, property & casualty)
17.4 10.5
Pension Funds(public, private)
14.6 16.9
Mortgage and Consumer Finance(GSEs, finance companies,
REITs, securitized asset pools)8.8 23.3
Mutual Funds(stock, bond, money market)
3.7 18.5
Securities Firms(brokers, dealers, funding corps.)
1.2 7.9
Distribution of Assets held at Financial Intermediaries in the U.S.

19
0%
10%
20%
30%
40%
50%
60%
20072000199019801970
0.0%
0.5%
1.0%
1.5%
Asset share of banks, thrifts, credit unions
Bank profits as % of GDP

20
Bank asset shares plunged, but bank profits soared. Why?
• A new business model for large banks emerged.
• The new model exploits post-1980s information technologies, financial products, and regulations.
– Much activity at banks moved off the balance sheet.
– Much income at banks now comes from fees, not from interest.
• This new model is highly efficient, highly profitable, but riskier than most of us thought.

21
Traditional Mortgage Finance
Agents with excess funds
Agents that need funds
DepositorsHome Buyers
Bank or Thrift
mortgages deposits
$ funds $ $ funds $
Bank earns profits from
interest margins.
22
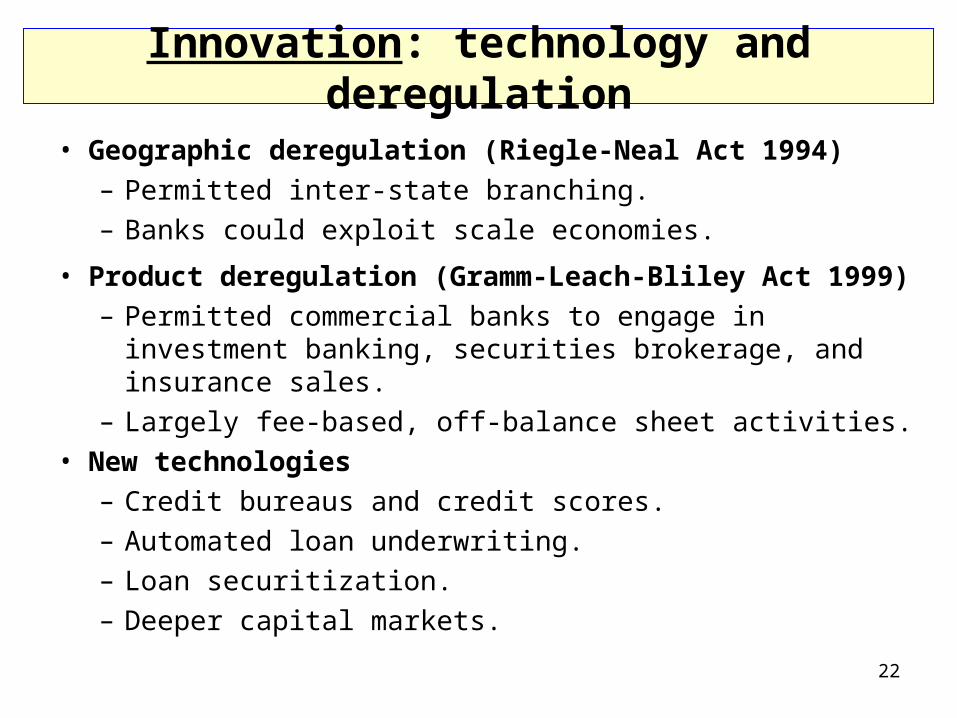
Innovation: technology and deregulation
• Geographic deregulation (Riegle-Neal Act 1994) – Permitted inter-state branching.– Banks could exploit scale economies.
• Product deregulation (Gramm-Leach-Bliley Act 1999)– Permitted commercial banks to engage in investment
banking, securities brokerage, and insurance sales.– Largely fee-based, off-balance sheet activities.
• New technologies– Credit bureaus and credit scores.– Automated loan underwriting.– Loan securitization. – Deeper capital markets.

23
Traditional Mortgage Finance
Agents with excess funds
Agents that need funds
DepositorsHome Buyers
Bank or Thrift
mortgages deposits
$ funds $ $ funds $
Bank earns profits from
interest margins.

24
Traditional Mortgage Finance
Agents with excess funds
Agents that need funds
DepositorsHome Buyers
Bank or Thrift
mortgages deposits
$ funds $ $ funds $

25
Mortgage SecuritizationBank or
Thrift
mortgages deposits

26
Mortgage Securitization
Mortgage Pool(off-Balance Sheet)
$$$
mortgages
Bank or Thrift
mortgages depositscash
mortgages

27
Mortgage Securitization
Mortgage Pool(off-Balance Sheet)
$$$
mortgages
$$$
MBS
Bank or Thrift
mortgages deposits
Institutional Investors
MBSscash
mortgages mortgage-backed securities (MBS)mortgages
MBS

28
Mortgage Securitization
mortgages mortgage-backed securities (MBS)
Bank or Thrift
mortgages deposits
Loan servicer (often the bank or the securitizer)
withholds a small fee from each mortgage payment.
Mortgage payments
from Households
cash
Mortgage Pool(off-Balance Sheet)
mortgages
Institutional Investors
MBSsMBS
Payments go to investors based on terms of the MBS contract.

29
Mortgage Securitization
Mortgage Pool(off-Balance Sheet)
$$$
mortgages
$$$
MBS
Bank or Thrift
mortgages deposits
Bank earns profits from origination fees, securitization fees,
servicing fees.
cash
MBS rated by Moody's,
S&P or Fitch.
mortgages mortgage-backed securities (MBS)mortgages
Investors get the principal & interest
payments.
Credit scoring allows a bank to make more loans faster.
Institutional Investors
MBSsMBS

30
This model increased risk at large banks.• Increasing reliance on fee income.
– Fee income is often more volatile than interest income.– Fee-based activities require higher operating leverage.– Fee-based activities are off-balance sheet, allowing banks to use
more financial leverage. – Fee income has not yielded expected diversification benefits.
• Increasing reliance on third-party information.– All lenders have same information (credit bureaus).– Investors (firms and funds that own the MBS) rely on bond raters.
• Fundamentally poor financial management.– A lack of diversification.– Excess reliance on financial leverage for earnings.– Too much interest rate risk.– Modeling risk without adequate historical data. – Why? Did large banks know they were Too-Big-To-Fail?

31
Model gives banks incentives to make riskier loans…that others will hold!
• Credit underwriting separated from risk-bearing.
– Incentives for lenders to make riskier loans.
• Securitization separated from risk-bearing.
– Incentives for investment banks to engineer riskier MBS.
• Loan monitoring separated from risk-bearing.
– Investors must rely on opinions of rating firms…and the rating firms get paid by the securitizing banks.
• Control rights separated from risk-bearing.
– Fractured ownership of mortgages impedes the modification of nonperforming mortgage loans.

32
Bad banking model? Or bad policy?
• Regulation did not evolve with banking practices.– Bank moved activity off of their balance sheets.– This circumvented capital rules; increased leverage.
• SEC reduced capital requirements for largest five investment banks in 2004.
• Regulators did nothing to rein in "Too-Big-To-Fail."
• SEC limits competition in securities rating business.– Only three main NRSROs (Moodys, S&P, Fitch) have
been licensed to rate these securities.

33
Bad banking model? Or bad policy?
• Congress made sure that OFHEO was a weak regulator of Fannie Mae and Freddie Mac.
– Congress wanted more "affordable mortgages."
– Pressured Fannie and Freddie into providing funds for subprime mortgage securitizations.

34
Many households also at fault.
• Too much mortgage debt.
– Bigger houses
– Small down payments
– Home equity loans

35
Household Financial Obligations(% of Disposable Income)
0%
5%
10%
15%
20%
25%
30%
35%1
98
0
19
83
19
86
19
89
19
92
19
95
19
98
20
01
20
04
20
07
Renters
All households
Homeowners
Mortgage Debt

36
Subprime mortgage lending
• A typical subprime mortgage scenario in mid-2000s:
– Borrower cannot qualify for a conforming mortgage.
– Gets a 3-year ARM: 0% down and a teaser rate.
– Borrower can just afford the payments in years 1-3.
– Borrower cannot afford the payments after year 3.
• Deal works out only if home prices keep increasing.
– As prices rise, borrower builds up equity in home.
– Borrower builds credit rating with a good payment record during first 3 years.
– At year 3, borrower refinances with a conforming loan at a low fixed rate.
• But what if prices stop going up?

37
Case-Shiller Home Price Index
0
50
100
150
200
25019
87
1988
1989
1990
1991
1992
1993
1994
1995
1996
1997
1998
1999
2000
2001
2002
2003
2004
2005
2006
2007
2008
2009
Home prices have declined more than 25%
since 2006.
A profound effect on the economy.

38
Reduced House Demand
• Prices stop rising…• Levered homeowners
stop building equity.• Refinancing is no
longer possible.
• As these homeowners default on mortgages…• Investors wary and
stop financing MBS.• Mortgage loans
become scarce.• As prices fall, buyers
wait for a good deal.
Home
Price
Home
Sales
Excess Supply

39
Single-family Housing Starts(thousands per quarter)
0
100
200
300
400
500
600
2002 2003 2004 2005 2006 2007 2008
NAHB estimates: Building one single-family home generates about 3.5 jobs.
Rough calculation: The annual decline in starts since 2006 implies 4.2 million fewer jobs…an approximate 3% reduction in jobs.

40
% Change in Aggregate Spending
-30%
-25%
-20%
-15%
-10%
-5%
0%
5%
10%
15%
20%
2006 2007 2008
ConsumptionSpending
NonresidentialInvestment
ResidentialInvestment
(Annualized change from previous quarter, seasonally adjusted)

41
% Change in Aggregate Spending
-30%
-25%
-20%
-15%
-10%
-5%
0%
5%
10%
15%
20%
2006 2007 2008
ConsumptionSpending
NonresidentialInvestment
ResidentialInvestment
(Annualized change from previous quarter, seasonally adjusted)

42
% Change in Aggregate Spending
-30%
-25%
-20%
-15%
-10%
-5%
0%
5%
10%
15%
20%
2006 2007 2008
ConsumptionSpending
NonresidentialInvestment
ResidentialInvestment
(Annualized change from previous quarter, seasonally adjusted)

43
Impact on the Financial Sector
• Large capital losses at banks.
– U.S. banks will suffer at least $2 trillion from MBS losses.
– About $1 trillion of these losses remain to be taken.– Based on estimates from IMF; Goldman Sachs; Nouriel Roubini.
– Largest U.S. banks propped up by the tax payers.
• Massive operating losses at mono-line mortgage firms.
– Novastar, Countrywide, American Century, WAMU, IndyMac, and others have failed.
• Lender losses created uncertainty in financial markets.
– No new private mortgage securitizations in over a year.
– BX 2007 AAA-rated subprime trading at 24¢.

44
% Delinquencies at U.S. Commercial Banks
0%
2%
4%
6%
8%
10%
12%
14%
1991
Q1
1992
Q2
1993
Q3
1994
Q4
1996
Q1
1997
Q2
1998
Q3
1999
Q4
2001
Q1
2002
Q2
2003
Q3
2004
Q4
2006
Q1
2007
Q2
2008
Q3
Credit cards
Business Loans
Single-family mortgages
Commercial mortgages

45
Subprime Mortgage Delinquencies
NOTE: Most subprime mortgages written by non-banks.

46
Lending at U.S. Banks ($ billions)
$0$200$400$600$800
$1,000$1,200$1,400$1,600$1,800
Jan-06
Jul-06
Jan-07
Jul-07
Jan-08
Jul-08
Jan-09
CommercialLoans
InterbankLoans

47
Rates on 3-month financial securities
0%
1%
2%
3%
4%
5%
6%
7%
1997
-01
1998
-01
1999
-01
2000
-01
2001
-01
2002
-01
2003
-01
2004
-01
2005
-01
2006
-01
2007
-01
2008
-01
2009
-01
Financial CP
Non-Financial CP
Treasury Bills

48
Daily New Issues of Financial Commercial Paper, 2006-2009
0
50
100
150
200
250
300
350
400
2006
-01-
02
2006
-02-
20
2006
-04-
10
2006
-05-
29
2006
-07-
17
2006
-09-
04
2006
-10-
23
2006
-12-
11
2007
-01-
29
2007
-03-
19
2007
-05-
07
2007
-06-
25
2007
-08-
13
2007
-10-
01
2007
-11-
19
2008
-01-
07
2008
-02-
25
2008
-04-
14
2008
-06-
02
2008
-07-
22
2008
-09-
10
2008
-10-
30
2008
-12-
22
2009
-02-
10

49
What Have We Learned?
• Have the policy responses been appropriate?
• Have households responded appropriately?

50
Congress• Silly populist legislation:
– Tax AIG bonuses (ex post).
– Limit executive pay (ex post).
– Tank the corporate jet market.
• Efforts to modify mortgages.
– Gives households moral hazard incentives.
– OCC study: High recidivism rate.
• "TARP-plus" funding.
– A $115 billion ransom payment to get bill passed.
• Hair of the dog:
– $8,000 tax credit for first-time home buyers.
– 3% down payments for VA, FHA and FMHA loans.

51
SEC
• Largely a bystander in the post-crisis policy response.

52
FDIC
• New FDIC guarantees:
– Deposits up to $250,000
– Pre-existing MMMF accounts
– Newly issued corporate debt
• Failed bank resolutions:
– Allowed historically large bank failures.
– An hour away from arranging a subsidized purchase of Wachovia by CitiGroup.
• Financing the insurance fund:
– Increased deposit insurance premiums paid by banks.
– $500 billion line of credit from Treasury.
• Leading the charge on modifying mortgages.

53
Federal Reserve
• New lending facilities:– Term Auction Facility– Commercial Paper Funding Facility– Term Securities Lending Facility– Primary Dealer Credit Facility
• Aggressive monetary policy response– Fed funds target rate is near 0%.– M1 and M2 have exploded.
• Co-conspirator with Treasury on "bailouts"– Fannie and Freddie (discount window loans)– AIG ($152 billion credit facility)– Bear Stearns ($29 billion loan to J.P.Morgan Chase)

54
• Bailouts– Fannie and Freddie; AIG; Bear Stearns…not Lehman?
• TARP (Troubled Asset Relief Program)– Still hasn't bought a single $1 of troubled assets…but it
is keeping Citi and BofA afloat.
• The Hotel Geithner
• Son of TARP1.Public-Private investment partnerships to purchase
troubled assets.2. Inject more capital (as previous TARP is paid off).3.Loan modifications4.Provide funding in ABS markets (w/ FDIC and Fed)
Treasury

55
• Announced on Wednesday, June 17. • Five point plan:
– Federal Reserve becomes the regulator of all large or systemically important financial firms.
– Requires reforms in securities markets (ratings firms, securitized loans, derivatives).
– Creates the Consumer Financial Protection Agency (CFPA).
– Established procedures for federal government to takeover and "unwind" large failing financial firms.
– Encourages other countries to do this, too.• Details to come…
The New Administration Proposal
56
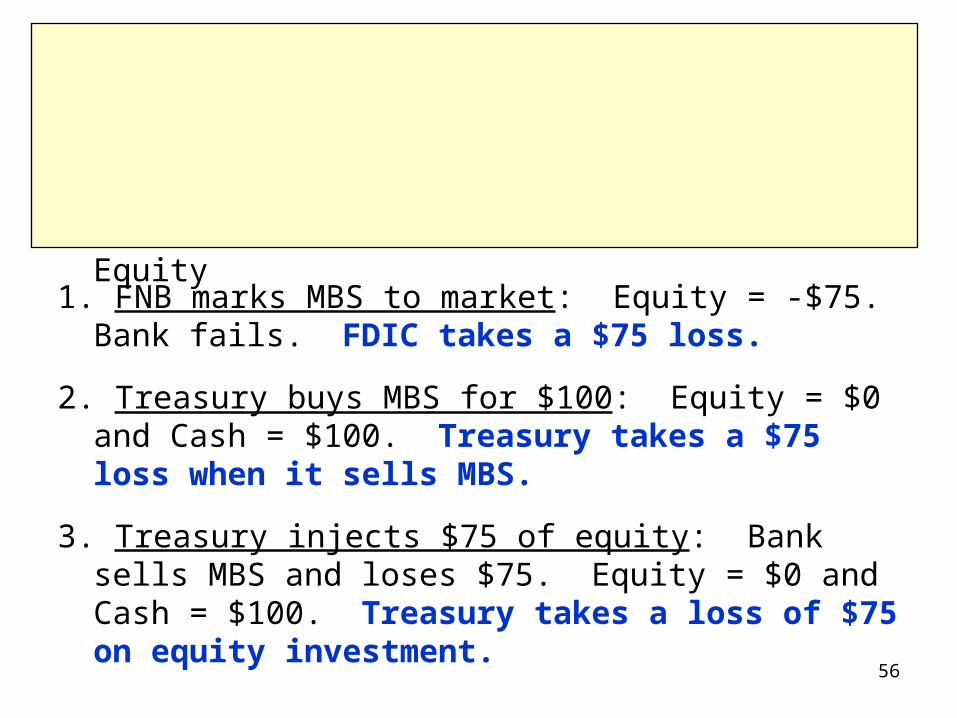
MBS $100 $1,000 Deposits
Loans $900 $ 0 Equity
First National Too-Big-To-Fail Bank
1. FNB marks MBS to market: Equity = -$75. Bank fails. FDIC takes a $75 loss.
2. Treasury buys MBS for $100: Equity = $0 and Cash = $100. Treasury takes a $75 loss when it sells MBS.
3. Treasury injects $75 of equity: Bank sells MBS and loses $75. Equity = $0 and Cash = $100. Treasury takes a loss of $75 on equity investment.
MBS $100 ($25 market) $1,000 Deposits
Loans $900 $ 0 Equity

57
Household Behavior
A 14-year high level of household
savings.
58
The Root Causes of the Crisis:What have We Learned?
Bob DeYoung Capitol Federal Professor
University of Kansas School of Business
Summer Teacher InstituteUniversity of Chicago
June 2009