Embed Size (px)
Citation preview
1
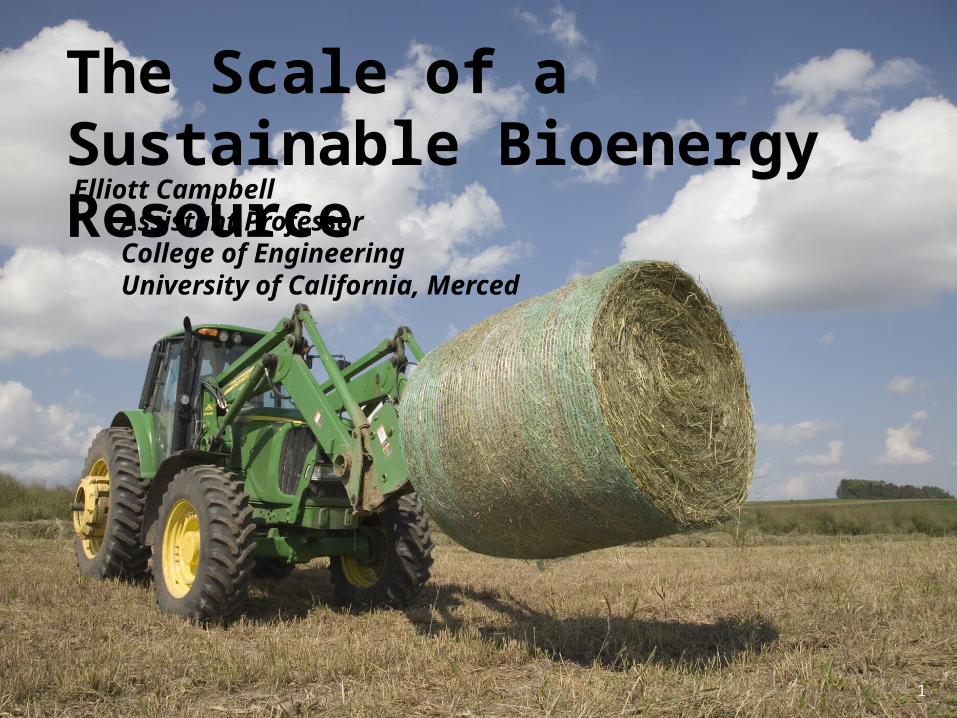
The Scale of a Sustainable Bioenergy Resource Elliott Campbell
Assistant ProfessorCollege of EngineeringUniversity of California, Merced
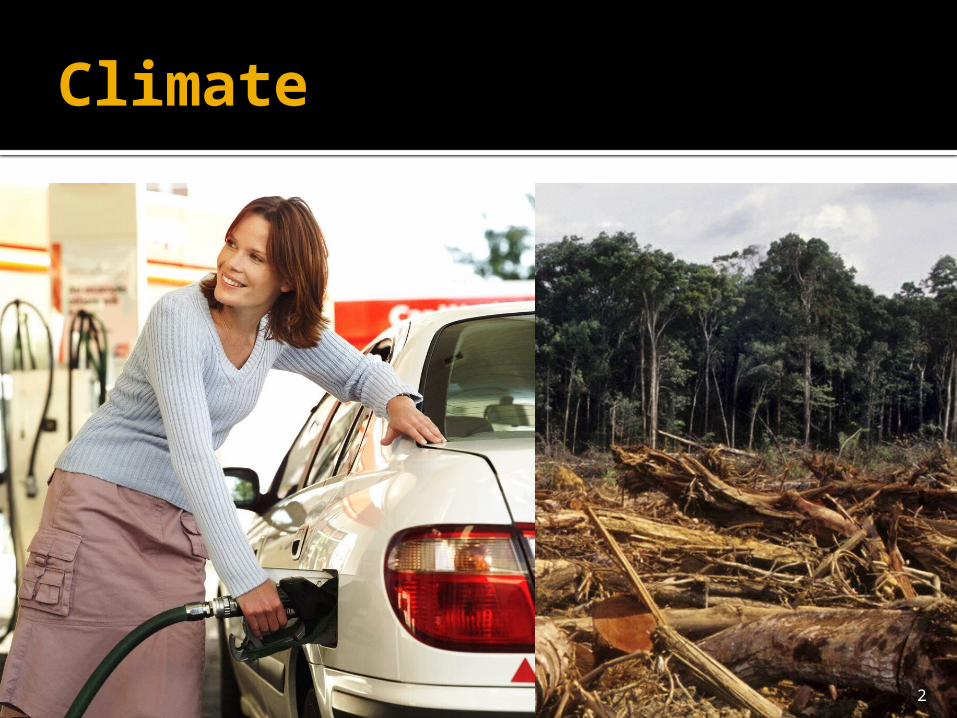
Climate
2

Economies
3

Water
4
5
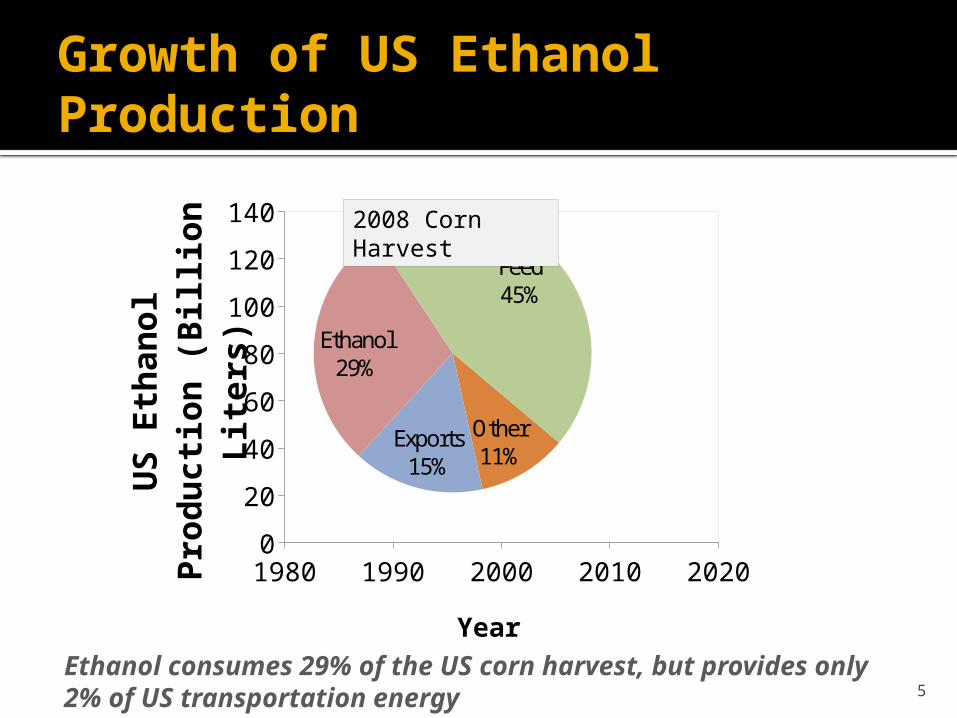
Growth of US Ethanol Production
1980 1990 2000 2010 20200
20
40
60
80
100
120
140
Year
US
Eth
anol P
ro-
ducti
on (
Billion
Lit
ers
)
Other11%
Exports15%
Ethanol29%
Feed45%
2008 Corn Harvest
Ethanol consumes 29% of the US corn harvest, but provides only 2% of US transportation energy
6
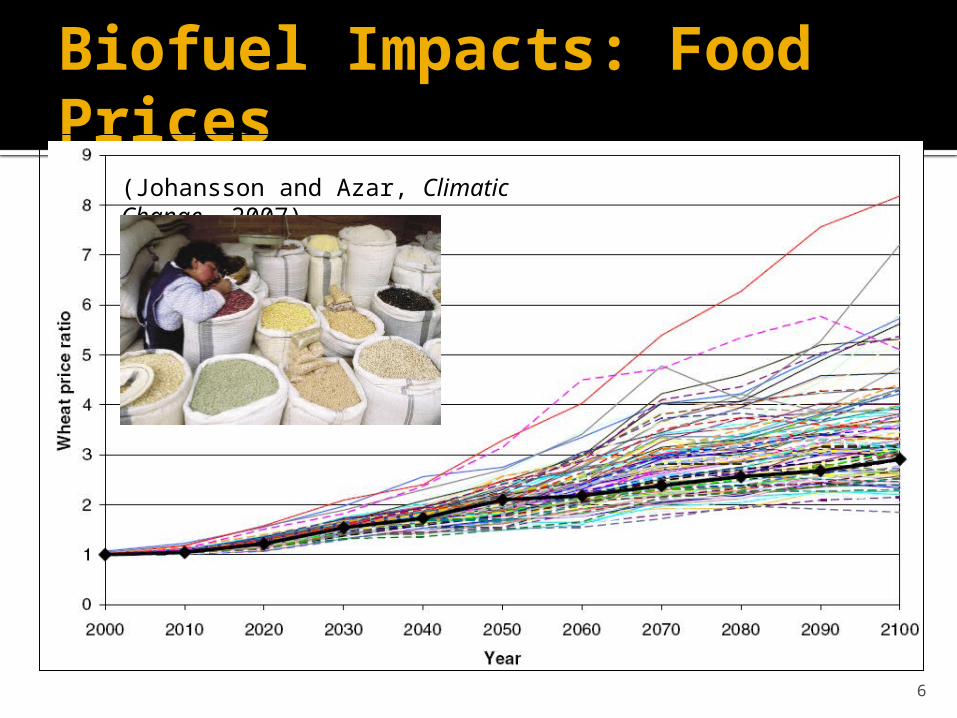
Biofuel Impacts: Food Prices
(Johansson and Azar, Climatic Change, 2007)
7
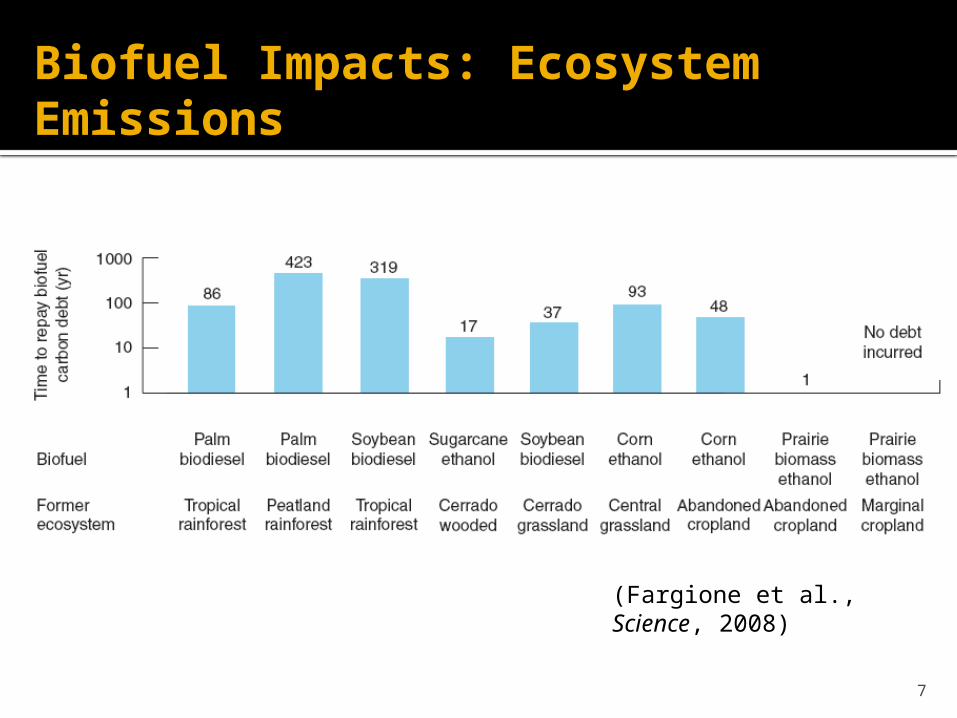
Biofuel Impacts: Ecosystem Emissions
(Fargione et al., Science, 2008)

8
Roadmap
1) Scale of the Resource2) Crop Yields3) Land Areas4) Energy Conversion Pathways
9
1) Scale of the Resource

10
Integrated Assessment Method1700
17101720
1) Abandoned agriculture areas from historical land use data (HYDE, SAGE)
2) Exclude agriculture-to-forest and agriculture-to-urban (MODIS12C1)
3) High estimate of potential yields from ecosystem model (CASA)
4) Regional bioenergy potential on abandoned agriculture lands.

11
Area of Abandoned Agriculture
(Campbell, Lobell, & Field, ES&T, 2008)
12
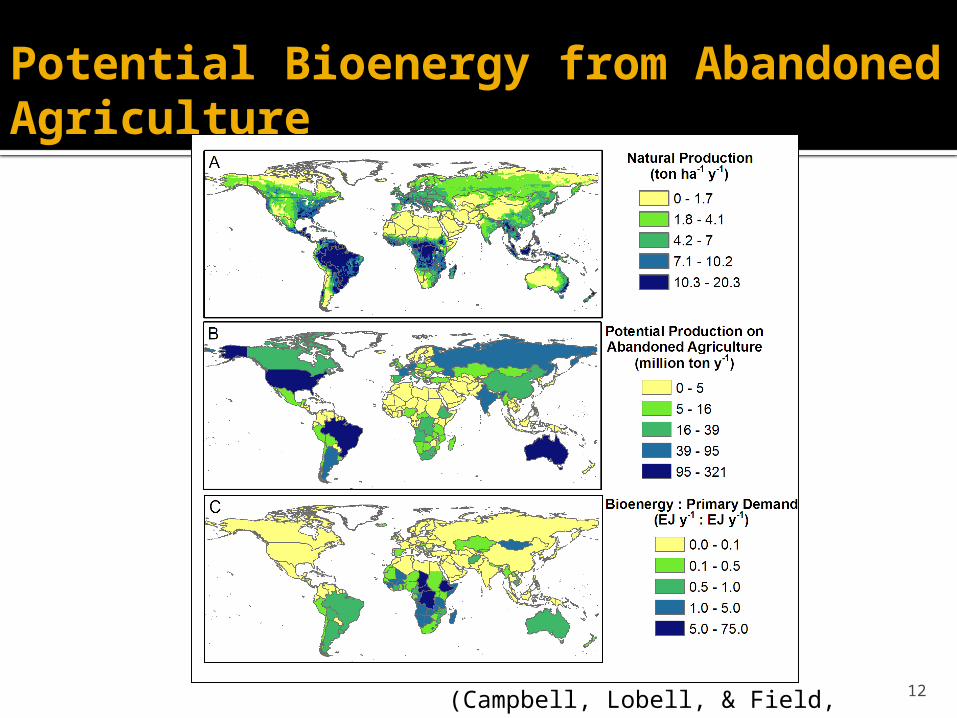
Potential Bioenergy from Abandoned Agriculture
(Campbell, Lobell, & Field, ES&T, 2008)
13
2) Crop Yield•Field Trials•Unplanned Experiments•EBI Model Inter-comparison•Top-Down Yields from Carbonyl Sulfide
14
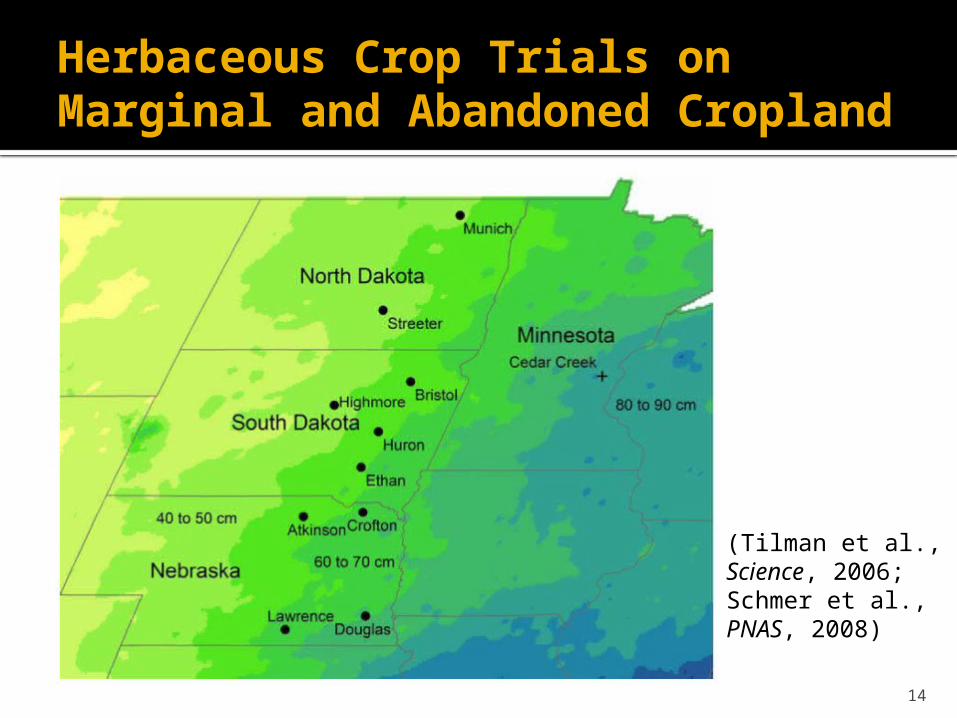
Herbaceous Crop Trials on Marginal and Abandoned Cropland
(Tilman et al., Science, 2006; Schmer et al., PNAS, 2008)
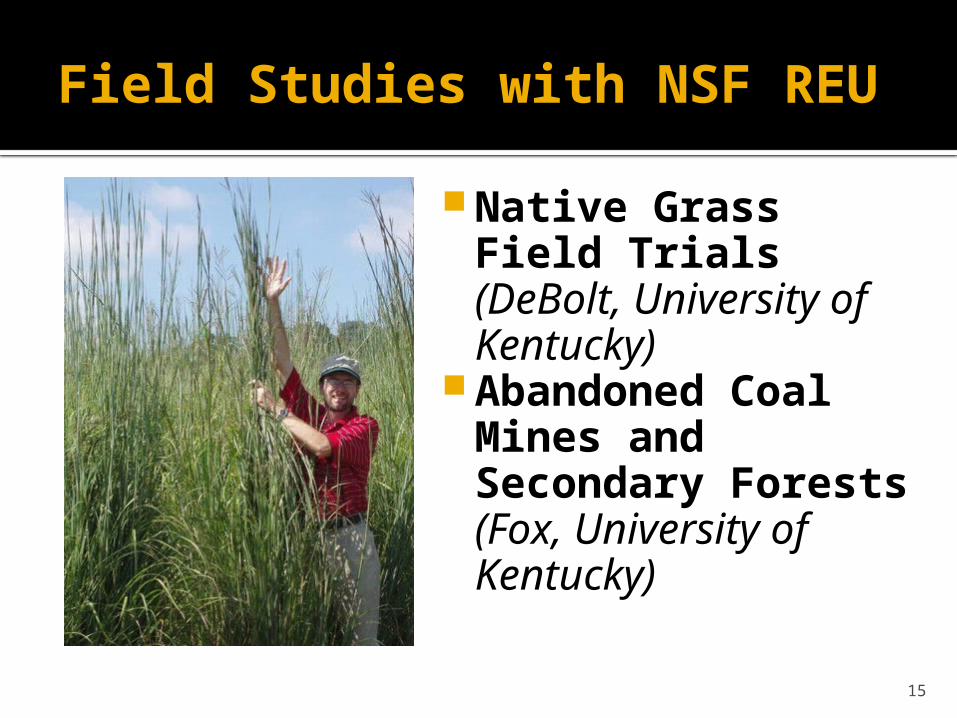
Native Grass Field Trials (DeBolt, University of Kentucky)
Abandoned Coal Mines and Secondary Forests (Fox, University of Kentucky)
15
Field Studies with NSF REU
16
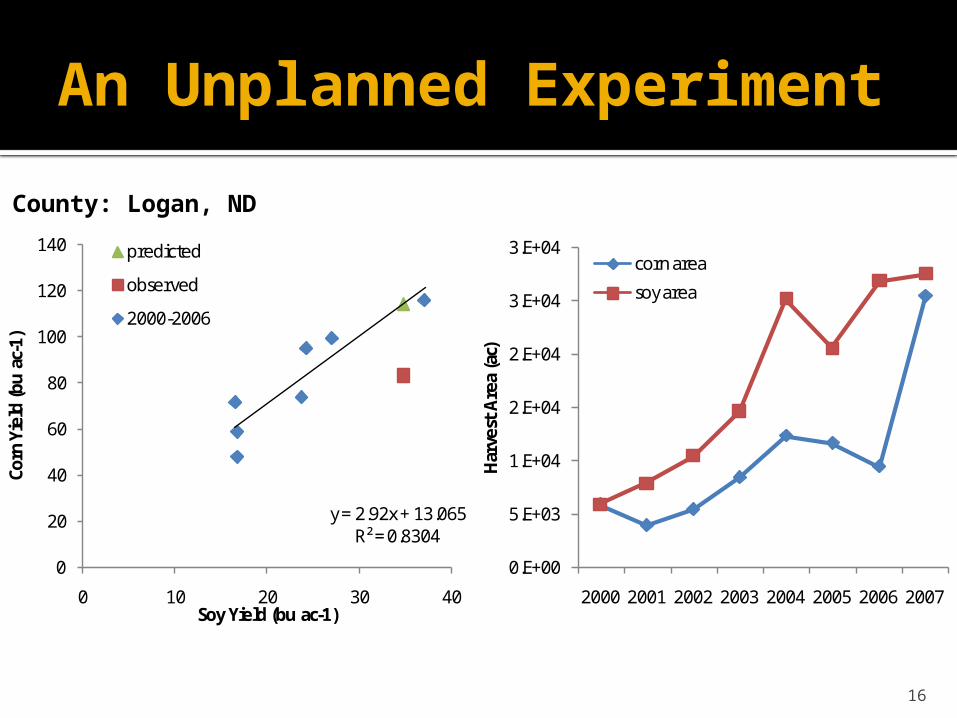
An Unplanned Experiment…
0.E+00
5.E+03
1.E+04
2.E+04
2.E+04
3.E+04
3.E+04
2000 2001 2002 2003 2004 2005 2006 2007
Har
vest
Are
a (a
c)
corn area
soy area
0
5
10
15
20
25
30
35
40
0
20
40
60
80
100
120
140
2000 2001 2002 2003 2004 2005 2006 2007
corn yield
soy yieldy = 2.92x + 13.065
R² = 0.8304
0
20
40
60
80
100
120
140
0 10 20 30 40
Corn
Yie
ld (b
u ac
-1)
Soy Yield (bu ac-1)
predicted
observed
2000-2006
County: Logan, ND
An Unplanned Experiment
17
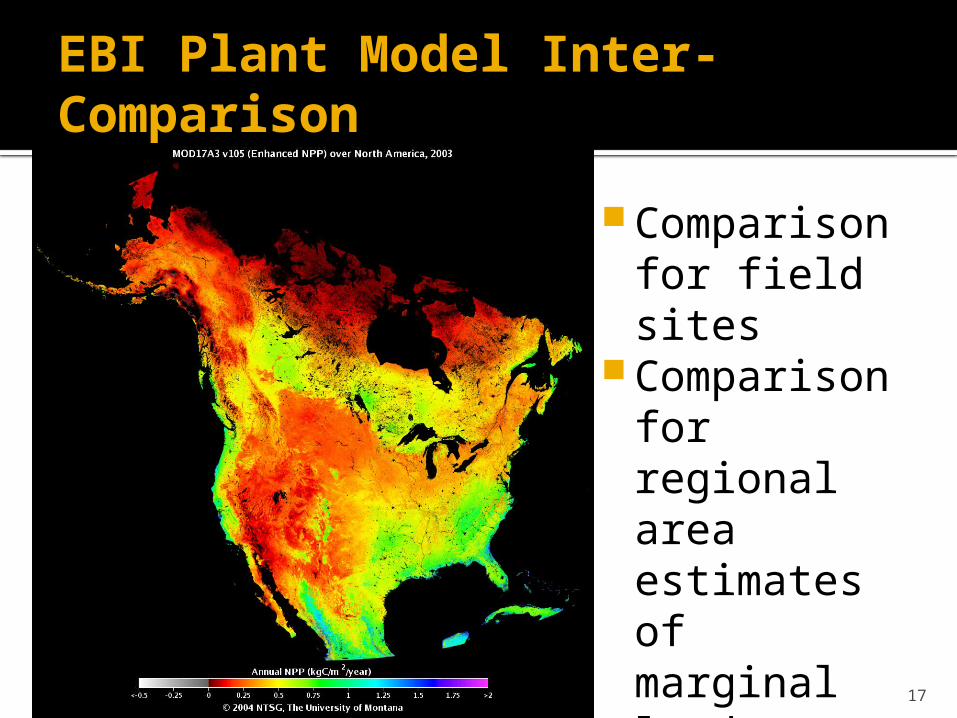
EBI Plant Model Inter-Comparison
Comparison for field sites
Comparison for regional area estimates of marginal lands
18
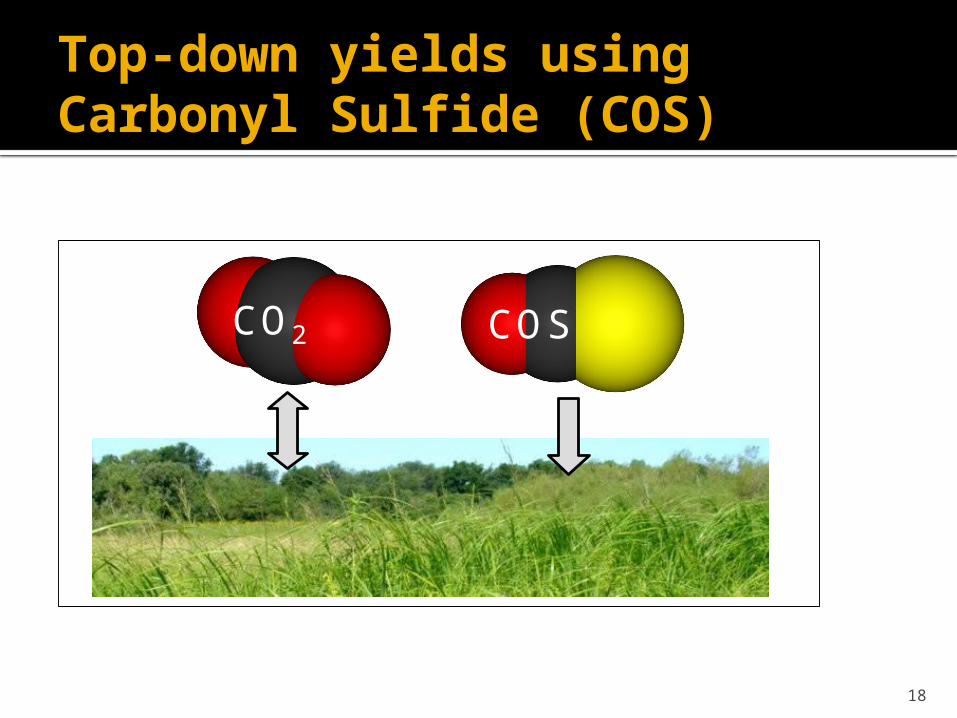
Top-down yields using Carbonyl Sulfide (COS)
CO2 COS
Fig. 1. The dominant land fluxes of CO2 are photosynthesis and respiration while OCS uptake is influenced by a process linked to photosynthesis.
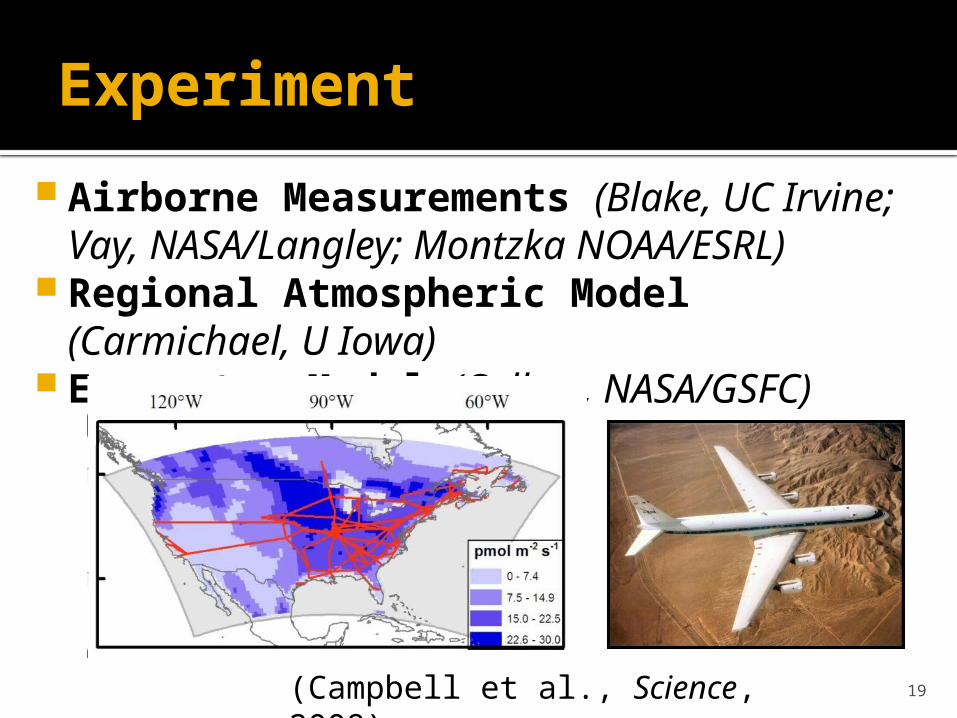
Airborne Measurements (Blake, UC Irvine; Vay, NASA/Langley; Montzka NOAA/ESRL)
Regional Atmospheric Model (Carmichael, U Iowa)
Ecosystem Model (Collatz, NASA/GSFC)
19
Experiment
(Campbell et al., Science, 2008)
20
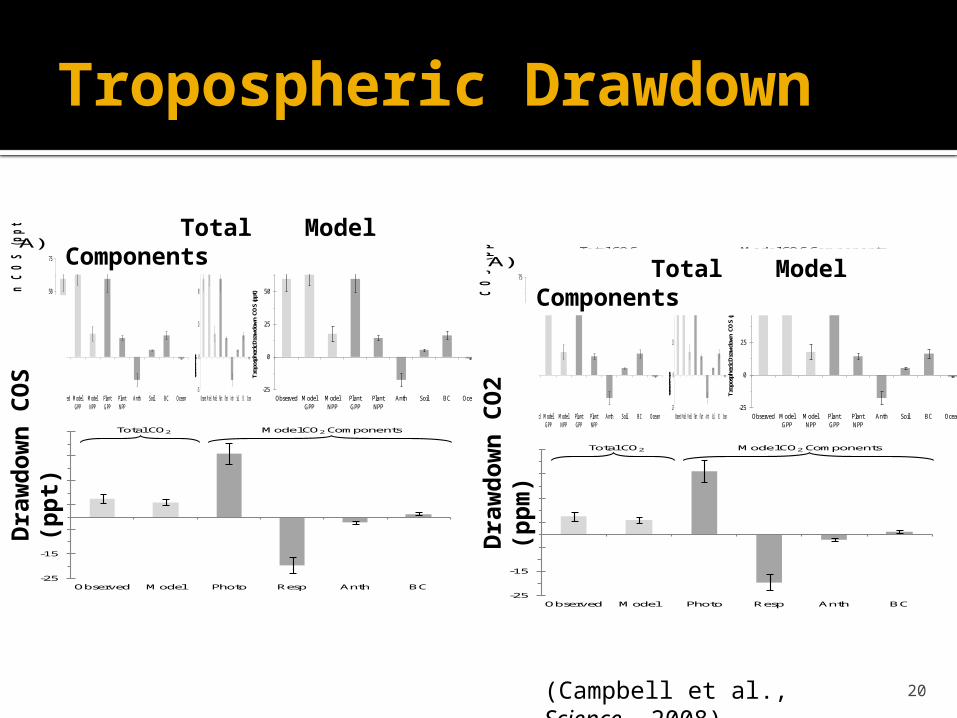
Tropospheric Drawdown
Total COS Model COS Components
A)
-25
-15
-5
5
15
25
35
Observed Model Photo Resp Anth BC
Tro
po
sp
heric D
ra
wd
ow
n C
O2(p
pm
) Total CO2 Model CO2 ComponentsB)
Dra
wd
ow
n C
OS
(p
pt)
Dra
wd
ow
n C
O2(p
pm
)
-25
0
25
50
75
Observed Model GPP
Model NPP
Plant GPP
Plant NPP
Anth Soil BC Ocean
Tropo
spheri
c Draw
down C
OS (p
pt)
-25
0
25
50
75
Observed Model GPP
Model NPP
Plant GPP
Plant NPP
Anth Soil BC Ocean
Tropospheric
Drawdown C
OS (ppt)
-25
0
25
50
75
Observed Model GPP
Model NPP
Plant GPP
Plant NPP
Anth Soil BC Ocean
Trop
osph
eric
Dra
wdow
n CO
S (p
pt)
Total COS Model COS Components
A)
-25
-15
-5
5
15
25
35
Observed Model Photo Resp Anth BC
Tro
po
sp
heric D
ra
wd
ow
n C
O2(p
pm
) Total CO2 Model CO2 ComponentsB)
Dra
wd
ow
n C
OS
(p
pt)
Dra
wd
ow
n C
O2(p
pm
)
Total COS Model COS Components
A)
-25
-15
-5
5
15
25
35
Observed Model Photo Resp Anth BC
Tro
po
sp
heric D
ra
wd
ow
n C
O2(p
pm
) Total CO2 Model CO2 ComponentsB)
Dra
wd
ow
n C
OS
(p
pt)
Dra
wd
ow
n C
O2(p
pm
)
Total COS Model COS Components
A)
-25
-15
-5
5
15
25
35
Observed Model Photo Resp Anth BC
Tro
po
sp
heric D
ra
wd
ow
n C
O2(p
pm
) Total CO2 Model CO2 ComponentsB)
Dra
wd
ow
n C
OS
(p
pt)
Dra
wd
ow
n C
O2(p
pm
)
-25
0
25
50
75
Observed Model GPP
Model NPP
Plant GPP
Plant NPP
Anth Soil BC Ocean
Trop
ospher
ic Draw
down
COS
(ppt)
-25
0
25
50
75
Observed Model GPP
Model NPP
Plant GPP
Plant NPP
Anth Soil BC Ocean
Tropospheri
c Drawdown
COS (ppt)
-25
0
25
50
75
Observed Model GPP
Model NPP
Plant GPP
Plant NPP
Anth Soil BC Ocean
Tro
posp
heri
c Dra
wdo
wn
CO
S (p
pt)
(Campbell et al., Science, 2008)
Dra
wd
ow
n C
OS
(p
pt)
Dra
wd
ow
n C
O2
(pp
m)
Total Model Components Total Model
Components

21
3) Land Area
•County-Level Areas•Tracking Current Expansion
22
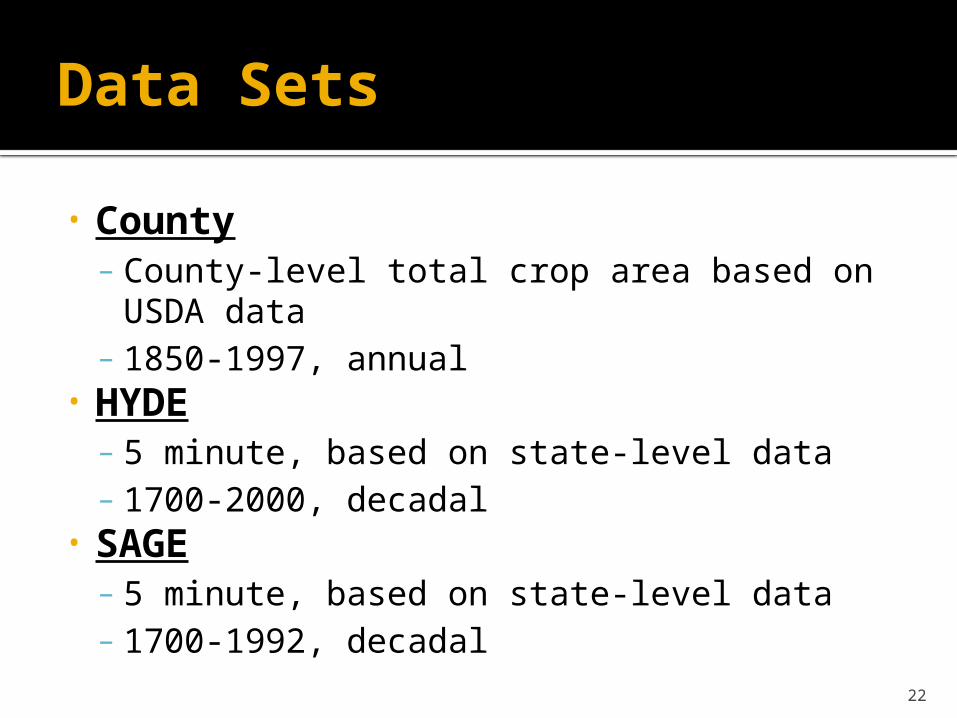
Data Sets
• County– County-level total crop area based on USDA
data– 1850-1997, annual
• HYDE– 5 minute, based on state-level data– 1700-2000, decadal
• SAGE– 5 minute, based on state-level data– 1700-1992, decadal
23
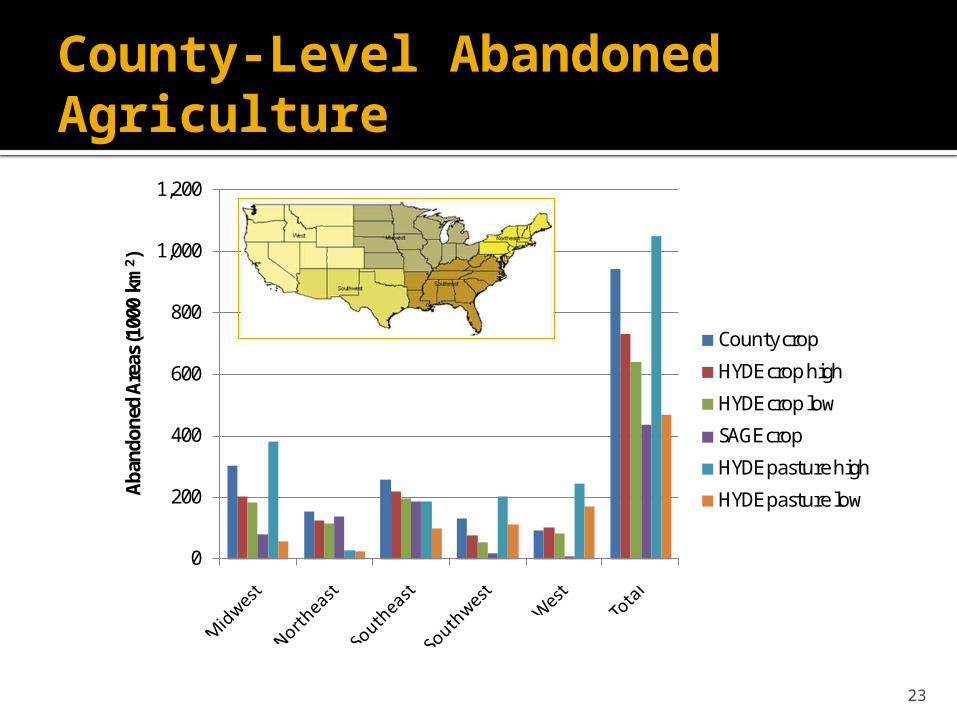
County-Level Abandoned Agriculture
0
200
400
600
800
1,000
1,200
Aban
done
d Ar
eas (
1000
km
2 )
County crop
HYDE crop high
HYDE crop low
SAGE crop
HYDE pasture high
HYDE pasture low
24
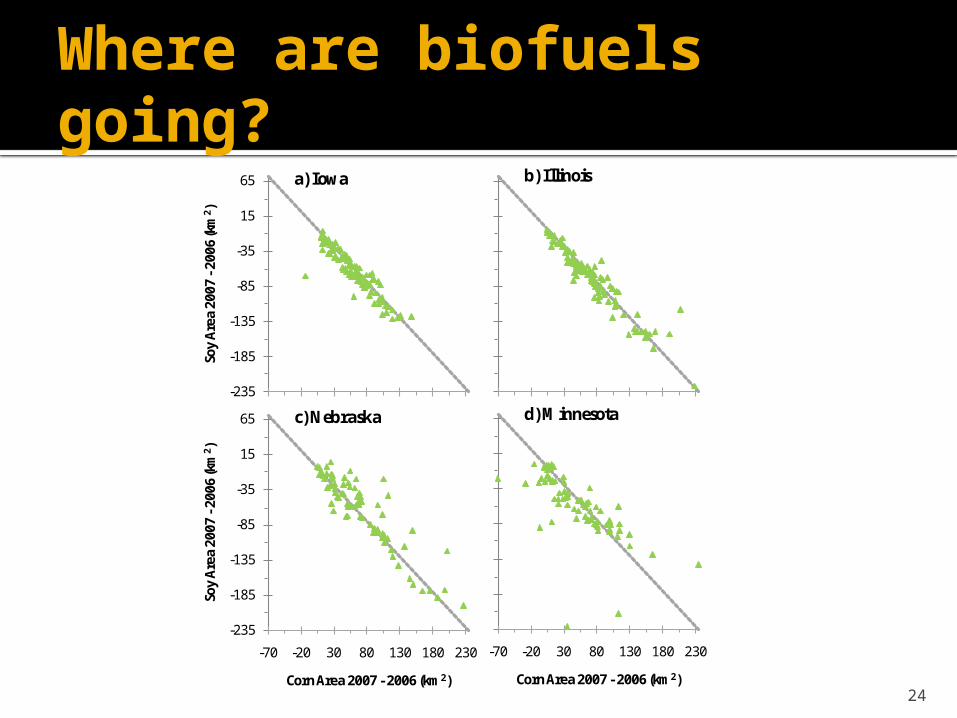
Where are biofuels going?
-235
-185
-135
-85
-35
15
65
-70 -20 30 80 130 180 230
Soy
Are
a 20
07 -
2006
(km
2 )Corn Area 2007 - 2006 (km2)
-235
-185
-135
-85
-35
15
65
-70 -20 30 80 130 180 230
Soy
Are
a 20
07 -
2006
(km
2 )
Corn Area 2007 - 2006 (km2)
-235
-185
-135
-85
-35
15
65
-70 -20 30 80 130 180 230
Soy
Are
a 20
07 -
2006
(km
2 )
Corn Area 2007 - 2006 (km2)
-235
-185
-135
-85
-35
15
65
-70 -20 30 80 130 180 230
Soy
Are
a 20
07 -
2006
(km
2 )
Corn Area 2007 - 2006 (km2)
a) Iowa b) Illinois
c) Nebraska d) Minnesota
25
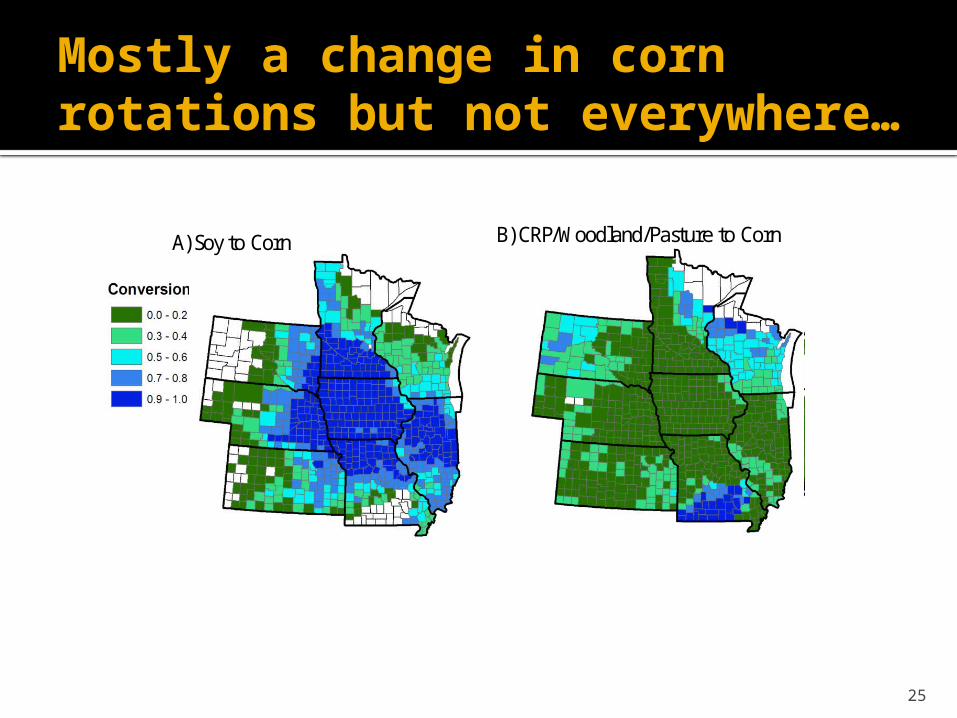
Mostly a change in corn rotations but not everywhere…
A) Soy to Corn B) CRP/Woodland/Pasture to CornA) Soy to Corn B) CRP/Woodland/Pasture to CornA) Soy to Corn B) CRP/Woodland/Pasture to Corn

26
4) Energy Pathway

27
Land use efficiencies of bioenergy alternatives
0.1-1.0%
97%
30-40% 92% 80-90% 75%
45-47% 20%

28
0
10,000
20,000
30,000
40,000
50,000
Gro
ss E
lect
ricity
Out
put
Fuel
Cyc
le E
lect
ric I
nput
Fuel
Cyc
le G
asol
ine
Inpu
t
Veh
icle
Cyc
le E
lect
ric I
nput
Veh
icle
Cyc
le G
asol
ine
Inpu
t
Net
Out
put
0
10
20
30
40
50
Gro
ss E
than
ol O
utpu
t
Fuel
Cyc
le E
lect
ric I
nput
Fuel
Cyc
le G
asol
ine
Inpu
t
Veh
icle
Cyc
le E
lect
ric I
nput
Veh
icle
Cyc
le G
asol
ine
Inpu
t
Net
Out
put
Tra
nspo
rtat
ion
Mil
eage
(10
3m
i ha
-1y-1
)
a) Ethanol b) Bioelectricity
(Campbell, Lobell, & Field, Science, In Review)

29
0
20
40
60
Small Car Midsize Car
Small SUV
Fullsize SUV
Gro
ss T
rans
pora
tion
(1
03m
i ha
-1 y
-1)
0
10
20
30
40
50
60
Small Car
Midsize Car
Small SUV
Large SUV
Gro
ss T
rans
port
atio
n (1
03m
i ha
-1) Ethanol-City
Bioelectricity-City
Ethanol-Highway
Bioelectricity-Highway
Corn Switchgrass
0
20
40
60
Small Car Midsize Car
Small SUV
Fullsize SUV
Gro
ss T
rans
pora
tion
(1
03m
i ha
-1 y
-1)
0
10
20
30
Small Car Midsize Car
Small SUV
Fullsize SUV
Net
Tra
nspo
rati
on
(103
mi
ha-1
y-1
)
0
10
20
30
Small Car Midsize Car
Small SUV
Fullsize SUV
Net
Tra
nspo
rati
on
(103
mi
ha-1
y-1
)
(Campbell, Lobell, & Field, Science, In Review)

30
0
10
20
30
40
50
60
Small Car
Midsize Car
Small SUV
Large SUV
Gro
ss T
rans
port
atio
n (1
03m
i ha
-1) Ethanol-City
Bioelectricity-City
Ethanol-Highway
Bioelectricity-Highway
Corn Switchgrass
0
10
20
30
Small Car Midsize Car
Small SUV
Fullsize SUV
Gro
ss G
HG
Off
set
(Mg
CO
2e h
a-1 y
-1)
0
10
20
30
Small Car Midsize Car
Small SUV
Fullsize SUV
Gro
ss G
HG
Off
set
(Mg
CO
2e h
a-1 y
-1)
0
10
20
Small Car Midsize Car
Small SUV
Fullsize SUV
Net
GH
G O
ffse
t (M
g C
O2e
ha-1
y-1
)
0
10
20
Small Car Midsize Car
Small SUV
Fullsize SUV
Net
GH
G O
ffse
t (M
g C
O2e
ha-1
y-1
)
(Campbell, Lobell, & Field, Science, In Review)
31
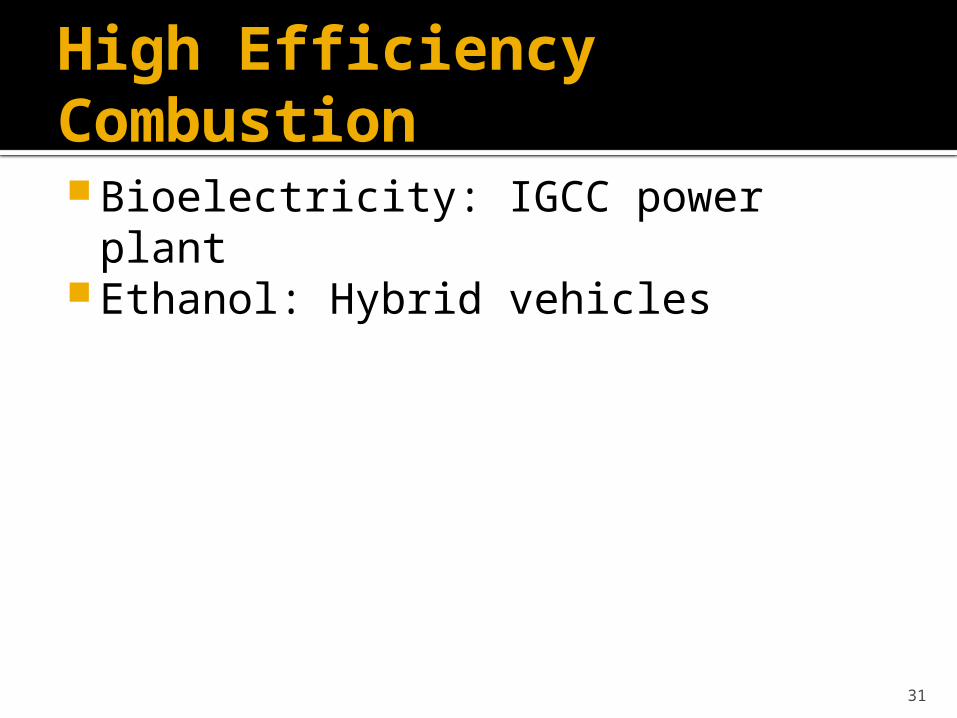
High Efficiency Combustion Bioelectricity: IGCC power plant Ethanol: Hybrid vehicles

32
High Efficiency Combustion Bioelectricity: IGCC power plant Ethanol: Hybrid vehicles
Ethanol
Bio-electr
ic
33
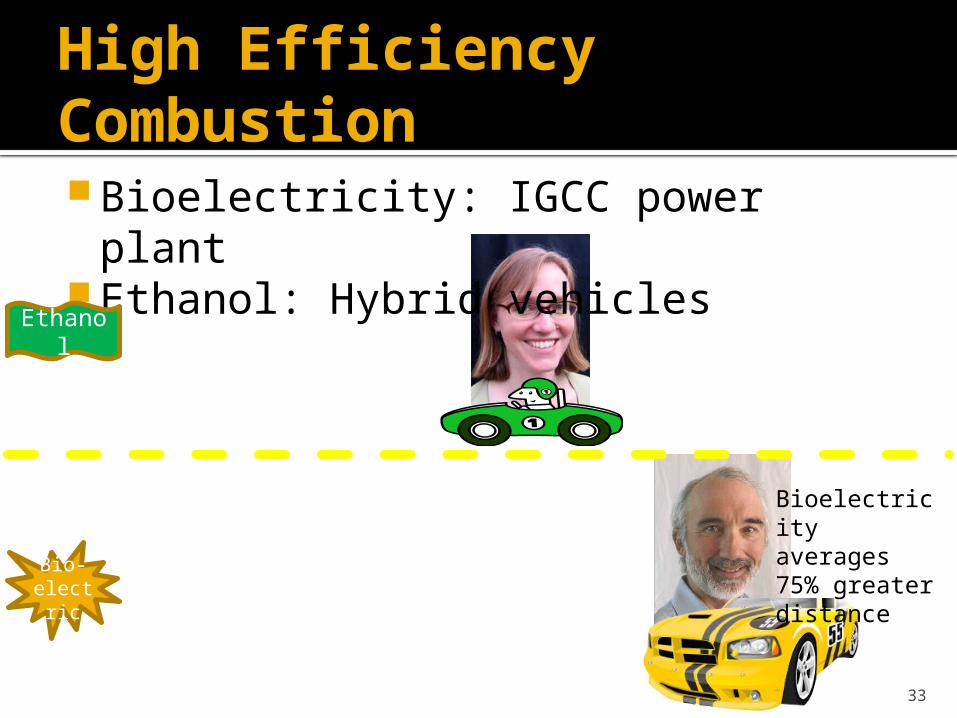
High Efficiency Combustion Bioelectricity: IGCC power plant Ethanol: Hybrid vehicles
Ethanol
Bio-electr
ic
Bioelectricity averages 75% greater distance

34
UC Merced Service Learning and the EPA P3 Sustainability Competition
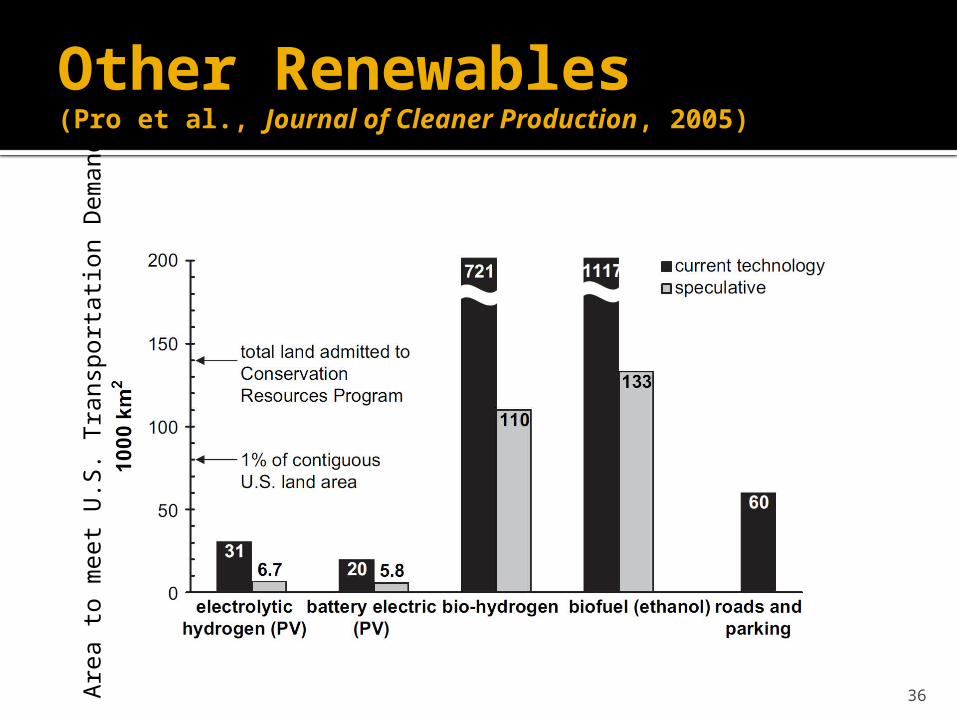
36
Other Renewables (Pro et al., Journal of Cleaner Production, 2005)
Are
a t
o m
eet
U.S
. Tr
ansp
ort
ati
on D
em
and