Embed Size (px)
Citation preview
1
The Search for Self Reliance
A presentation
at ADMINISTRATIVE STAFF COLLEGE ,
Hyderabad
20 September 2005
India’s Energy Future
T L Sankar
ADMINISTRATIVE STAFF COLLEGE OF INDIA Bella Vista :: Hyderabad-500 082
My e-mail : [email protected]@ rediff.com
2
Purpose of the Presentation
Economic Growth calls for increase in supply of energy. While India has registered a commendable rate of economic growth in the recent past, this has been achieved with unsatisfactory supply of energy.The energy supply situation
is causing anxiety.Many fear that India’s aspiration to achieve 8% per year GDP Growth in the next decade may be constrained by lack of energy supplies.
This presentation seeks to probe ways in which India could meet its energy demand to support such a high rate of growth . India achieved, against several odds , self-reliance in food and foreign exchange. Can this be repeated in the case of Fuels?
3
Structure of the presentation
• Presentation will be in three parts:
• Part I would examine the long term energy
needs of India in the next 25 years and what
strategic choice alternatives are available.
• Part II would deal with our current concerns-
Action To-day to realize the chosen future.
• Part III my vision –a personal statement.
4
GDP Growth – Story so far
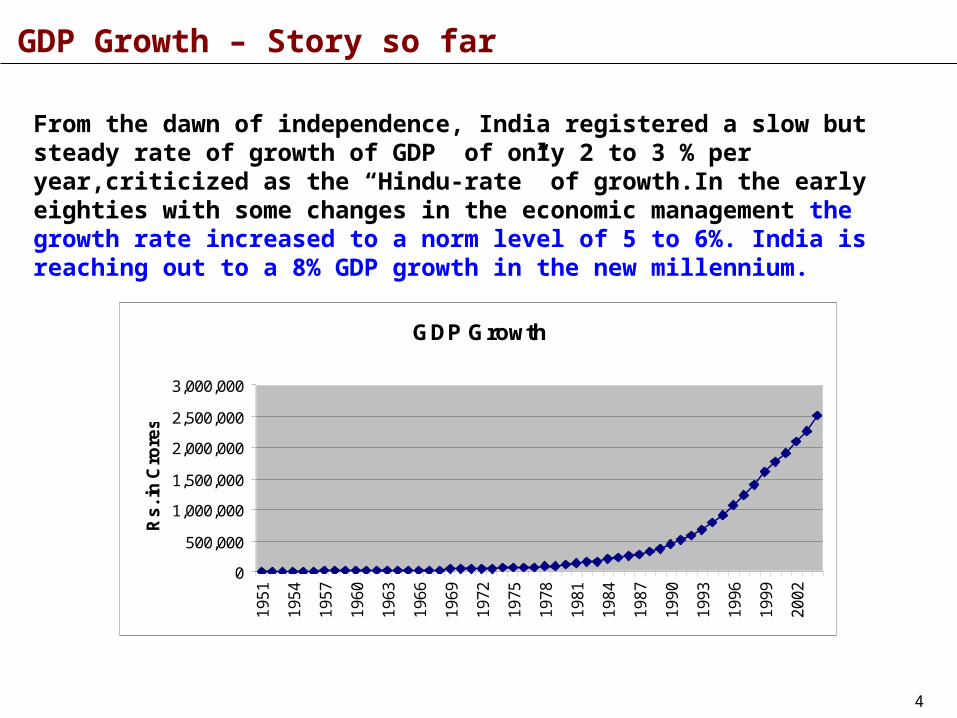
From the dawn of independence, India registered a slow but steady rate of growth of GDP of only 2 to 3 % per year,criticized as the “Hindu-rate” of growth.In the early eighties with some changes in the economic management the growth rate increased to a norm level of 5 to 6%. India is reaching out to a 8% GDP growth in the new millennium.
GDP Growth
0
500,000
1,000,000
1,500,000
2,000,000
2,500,000
3,000,000
1951
1954
1957
1960
1963
1966
1969
1972
1975
1978
1981
1984
1987
1990
1993
1996
1999
2002
Rs
. in
Cro
res
5
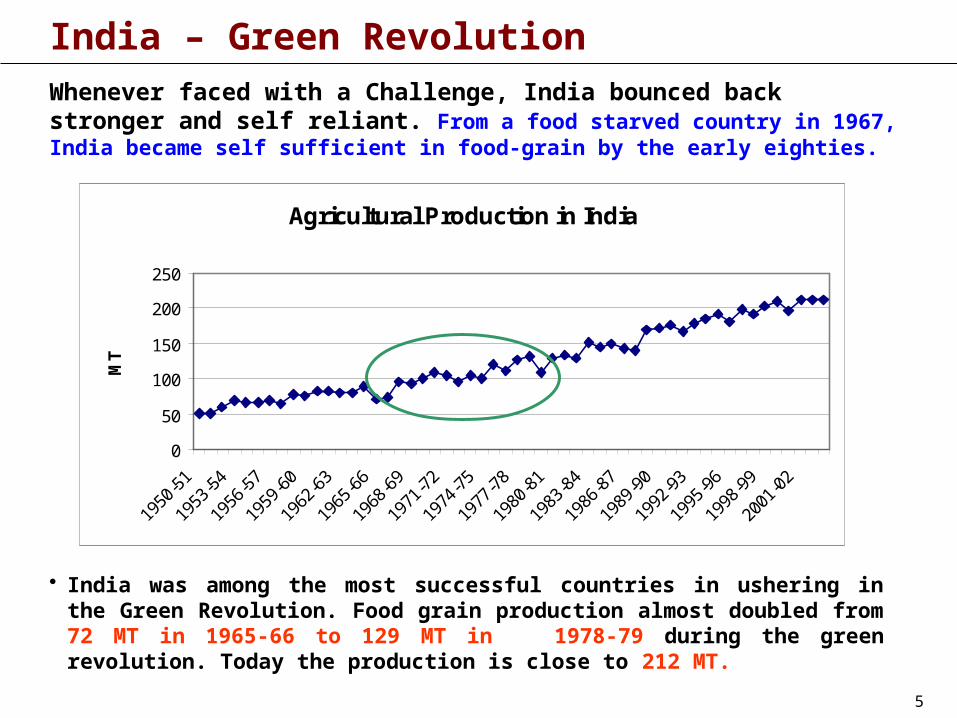
India – Green Revolution
• India was among the most successful countries in ushering in the Green Revolution. Food grain production almost doubled from 72 MT in 1965-66 to 129 MT in 1978-79 during the green revolution. Today the production is close to 212 MT.
Agricultural Production in India
0
50
100
150
200
250
MT
Whenever faced with a Challenge, India bounced back stronger and self reliant. From a food starved country in 1967, India became self sufficient in food-grain by the early eighties.
6
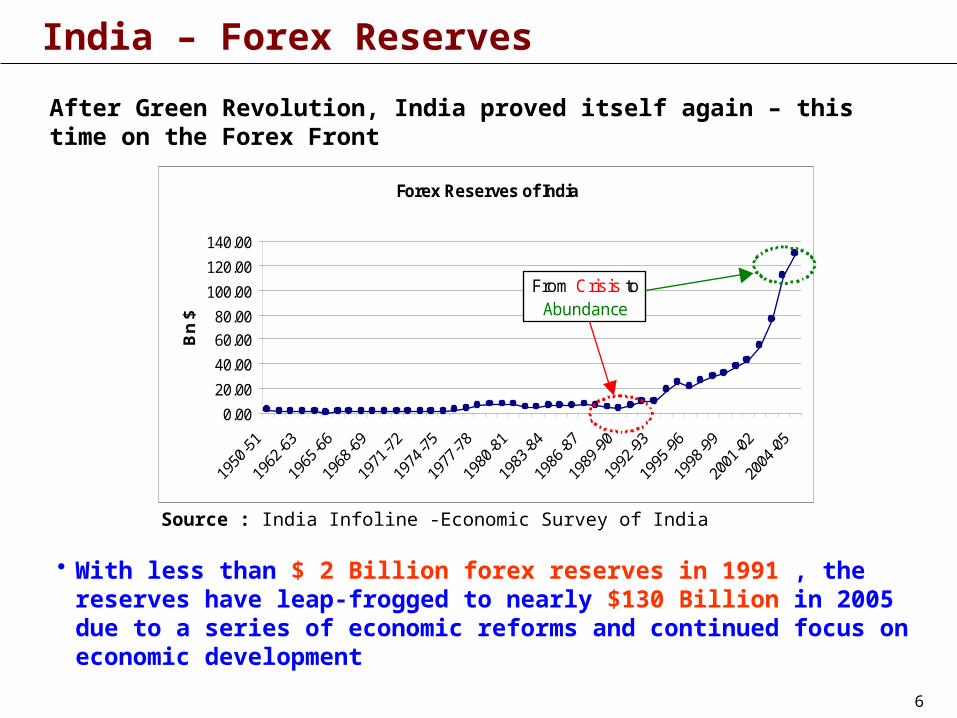
India – Forex Reserves
• With less than $ 2 Billion forex reserves in 1991 , the reserves have leap-frogged to nearly $130 Billion in 2005 due to a series of economic reforms and continued focus on economic development
After Green Revolution, India proved itself again – this time on the Forex Front
Forex Reserves of India
0.00
20.00
40.00
60.00
80.00
100.00
120.00
140.00
Bn
$
From Crisis to Abundance
Source : India Infoline -Economic Survey of India
7
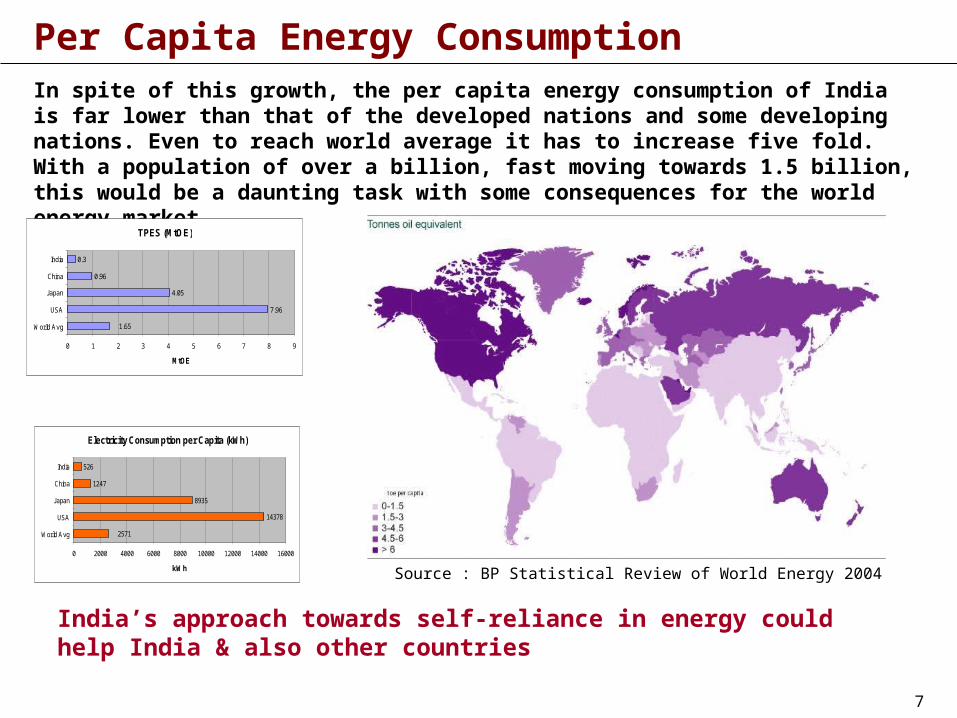
Per Capita Energy Consumption
Source : BP Statistical Review of World Energy 2004
In spite of this growth, the per capita energy consumption of India is far lower than that of the developed nations and some developing nations. Even to reach world average it has to increase five fold. With a population of over a billion, fast moving towards 1.5 billion, this would be a daunting task with some consequences for the world energy market.
TPES (MtOE)
7.96
4.05
0.96
0.3
1.65
0 1 2 3 4 5 6 7 8 9
World Avg
USA
Japan
China
India
MtOE
Electricity Consumption per Capita (kWh)
14378
8935
1247
526
2571
0 2000 4000 6000 8000 10000 12000 14000 16000
World Avg
USA
Japan
China
India
kWh
India’s approach towards self-reliance in energy could help India & also other countries
8
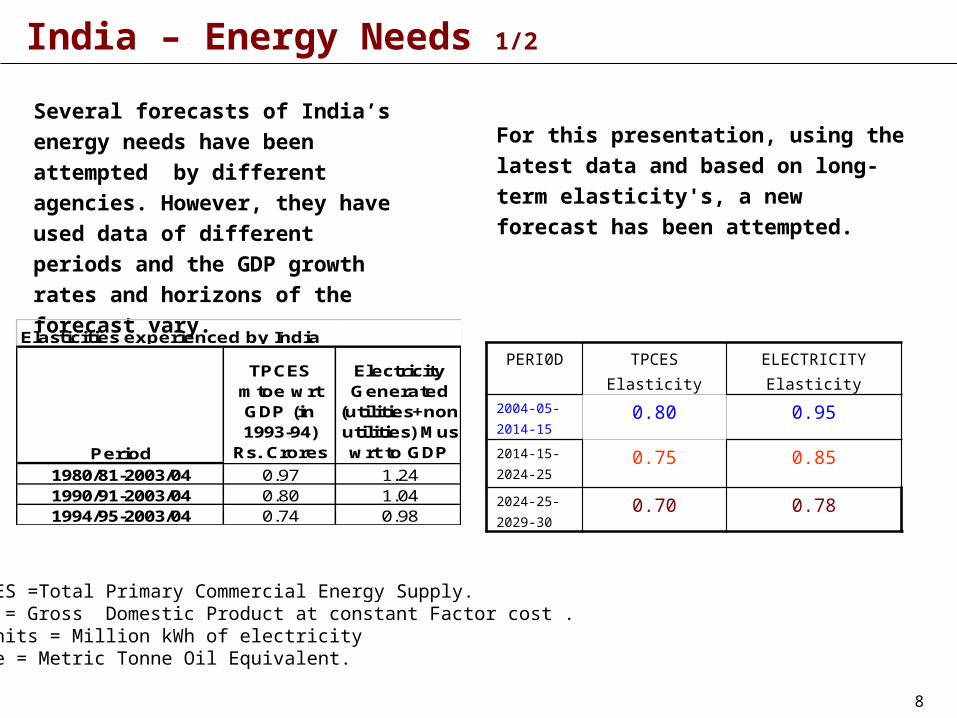
India – Energy Needs 1/2
Several forecasts of India’s energy
needs have been attempted by
different agencies. However, they
have used data of different periods
and the GDP growth rates and
horizons of the forecast vary.
For this presentation, using the latest
data and based on long-term elasticity's,
a new forecast has been attempted.
Period
TPCES mtoe wrt GDP (in 1993-94)
Rs. Crores
Electricity Generated
(utilities+non utilities) Mus wrt to GDP
1980/81-2003/04 0.97 1.241990/91-2003/04 0.80 1.041994/95-2003/04 0.74 0.98
Elasticities experienced by India
TCPES =Total Primary Commercial Energy Supply.GDP = Gross Domestic Product at constant Factor cost .M Units = Million kWh of electricity mtoe = Metric Tonne Oil Equivalent.
PERI0D TPCESElasticity
ELECTRICITYElasticity
2004-05-2014-15
0.80 0.95
2014-15-2024-25
0.75 0.85
2024-25-2029-30
0.70 0.78
9
India – Energy Needs 2/2
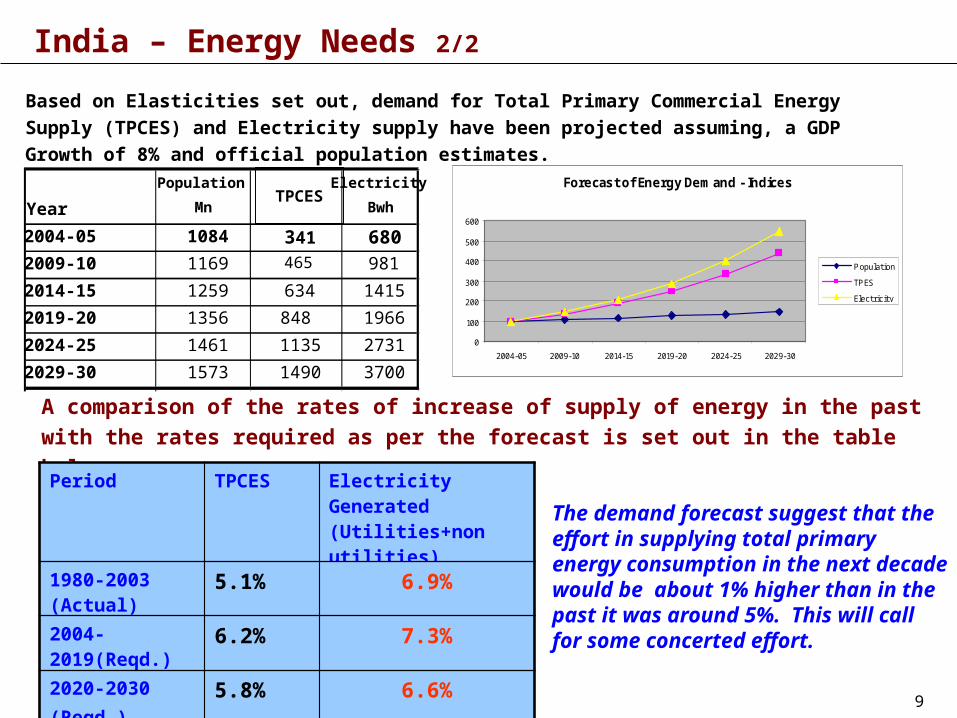
Based on Elasticities set out, demand for Total Primary Commercial Energy Supply (TPCES) and
Electricity supply have been projected assuming, a GDP Growth of 8% and official population
estimates.
Year
Population
Mn
Electricity
Bwh
2004-05 1084 341 6802009-10 1169 465 981
2014-15 1259 634 1415
2019-20 1356 848 1966
2024-25 1461 1135 2731
2029-30 1573 1490 3700
A comparison of the rates of increase of supply of energy in the past with the rates
required as per the forecast is set out in the table below :
Period TPCES Electricity Generated (Utilities+non utilities)
1980-2003 (Actual)
5.1% 6.9%
2004-2019(Reqd.)
6.2% 7.3%
2020-2030(Reqd.)
5.8% 6.6%
The demand forecast suggest that the effort in supplying total primary energy consumption in the next decade would be about 1% higher than in the past it was around 5%. This will call for some concerted effort.
Forecast of Energy Demand - Indices
0
100
200
300
400
500
600
2004-05 2009-10 2014-15 2019-20 2024-25 2029-30
Population
TPES
Electricity
TPCES
10
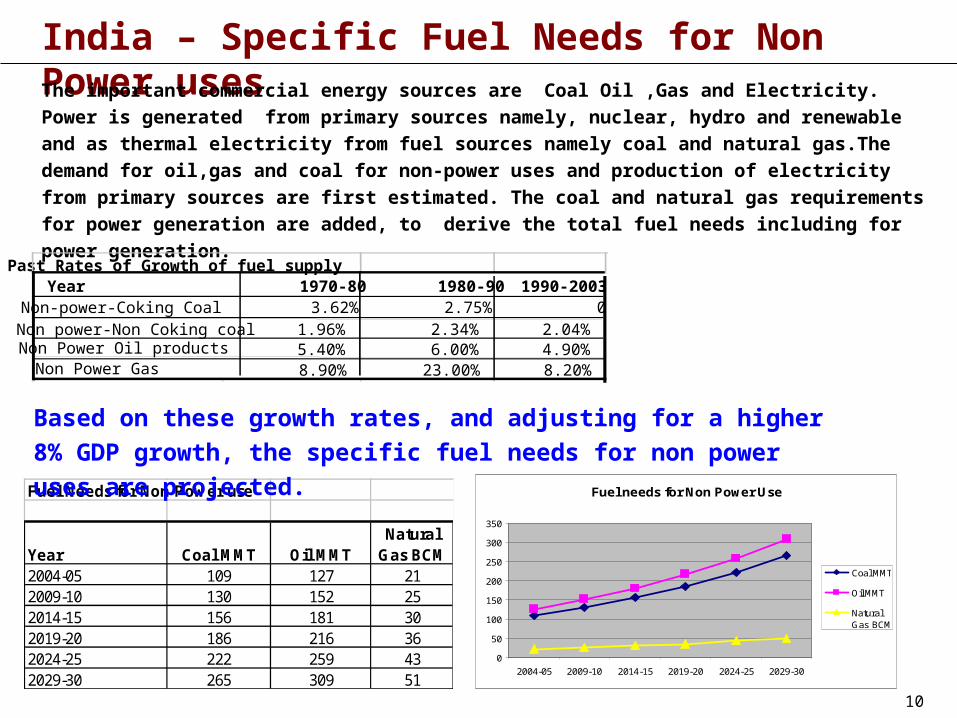
India – Specific Fuel Needs for Non Power usesThe important commercial energy sources are Coal Oil ,Gas and Electricity. Power is generated
from primary sources namely, nuclear, hydro and renewable and as thermal electricity from fuel
sources namely coal and natural gas.The demand for oil,gas and coal for non-power uses and
production of electricity from primary sources are first estimated. The coal and natural gas
requirements for power generation are added, to derive the total fuel needs including for power
generation.
Fuel Needs for Non Power use
Year Coal MMT Oil MMTNatural
Gas BCM2004-05 109 127 212009-10 130 152 252014-15 156 181 302019-20 186 216 362024-25 222 259 432029-30 265 309 51
Past Rates of Growth of fuel supplyYear 1970-80 1980-90 1990-2003
Non-power-Coking Coal 3.62% 2.75% 0Non power-Non Coking coal 1.96% 2.34% 2.04%Non Power Oil products 5.40% 6.00% 4.90%
Based on these growth rates, and adjusting for a higher 8% GDP
growth, the specific fuel needs for non power uses are projected.
Fuel needs for Non Power Use
0
50
100
150
200
250
300
350
2004-05 2009-10 2014-15 2019-20 2024-25 2029-30
Coal MMT
Oil MMT
NaturalGas BCM
Non Power Gas 8.90% 23.00% 8.20%
11
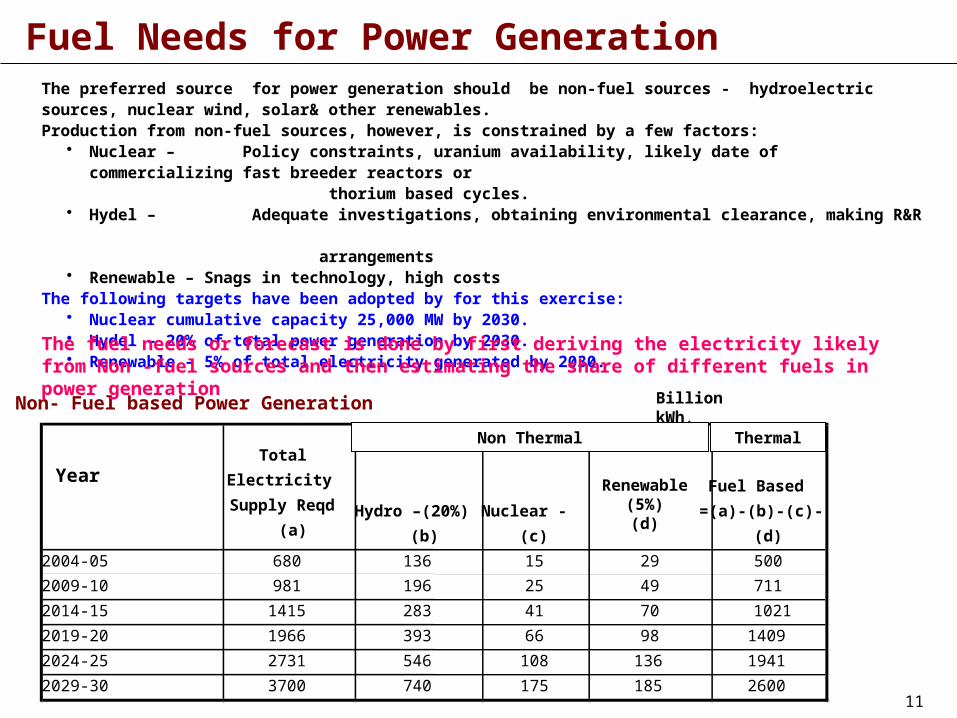
Fuel Needs for Power GenerationThe preferred source for power generation should be non-fuel sources - hydroelectric sources, nuclear wind, solar& other renewables. Production from non-fuel sources, however, is constrained by a few factors:
• Nuclear – Policy constraints, uranium availability, likely date of commercializing fast breeder reactors or thorium based cycles.
• Hydel – Adequate investigations, obtaining environmental clearance, making R&R arrangements
• Renewable – Snags in technology, high costsThe following targets have been adopted by for this exercise:
• Nuclear cumulative capacity 25,000 MW by 2030.• Hydel – 20% of total power generation by 2030.• Renewable – 5% of total electricity generated by 2030.
Non- Fuel based Power Generation
Total
Electricity
Supply Reqd (a)
Hydro –(20%)
(b)
Nuclear -
(c)
Fuel Based
=(a)-(b)-(c)-
(d)
2004-05 680 136 15 29 500
2009-10 981 196 25 49 711
2014-15 1415 283 41 70 1021
2019-20 1966 393 66 98 1409
2024-25 2731 546 108 136 1941
2029-30 3700 740 175 185 2600
Year
Billion kWh.
Renewable(5%)(d)
Non Thermal Thermal
The fuel needs or forecast is done by first deriving the electricity likely from Non -fuel sources and then estimating the share of different fuels in power generation
12
• Coal Oil & Gas could be used. At each Plant location the cost of fuel, capital-cost of the plant ,availability and reliability determines the fuel choice.
• Oil has priced itself out.The real choice is between coal & gas.
• A coal-based power plant costs about Rs.4.2 crores/MW resulting in a Fixed cost of Rs.1.20 per Kwhr of electricity.Coal delivered to a power plant at 600 kms would cost Rs 1500/tonne leading to a fuel cost of Rs 1.05 per .Power cost =Rs.2.25/unit.
* A gas based combined cycle plant would cost Rs.3.0 crores/mw resulting in Rs.0.95 per Kwhr. Even if the cost of gas delivered at the plant-gate is $4.00 per million btu, the foel cost would be Rs.1.40 which makes power cost Rs.2.35 >than coal based power.
• Further, imported gas price may be indexed to oil price,leading to uncertainty and volatility of future price.If on a later date Gas price rises very high,the variable cost of the plant might reduce the dispatch level.
• If Coal is available at Rs.1500/t gas – for- power cannot be more than $4.00/mmbtu.
Choice of Fuel for Power Generation- Relative Price & Availability
13
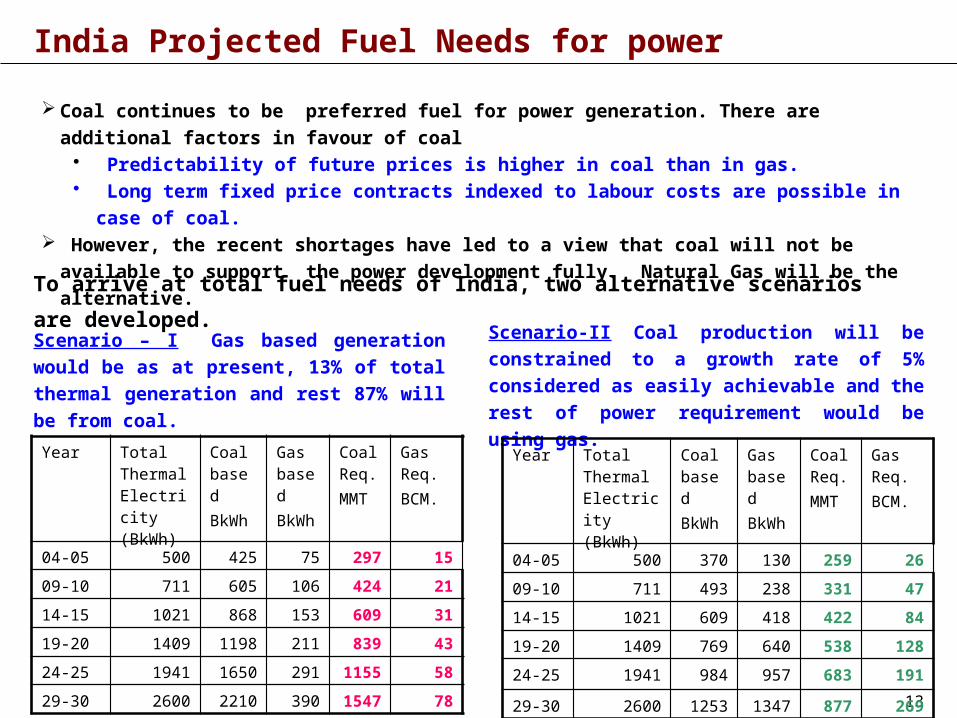
India Projected Fuel Needs for power
Coal continues to be preferred fuel for power generation. There are additional factors in favour of
coal • Predictability of future prices is higher in coal than in gas.• Long term fixed price contracts indexed to labour costs are possible in case of coal.
However, the recent shortages have led to a view that coal will not be available to support the
power development fully. Natural Gas will be the alternative.
Scenario – I Gas based generation would be
as at present, 13% of total thermal generation
and rest 87% will be from coal.
Year Total Thermal Electricity (BkWh)
Coal based BkWh
Gas basedBkWh
Coal Req.MMT
Gas Req. BCM.
04-05 500 425 75 297 15
09-10 711 605 106 424 21
14-15 1021 868 153 609 31
19-20 1409 1198 211 839 43
24-25 1941 1650 291 1155 58
29-30 2600 2210 390 1547 78
Scenario-II Coal production will be constrained
to a growth rate of 5% considered as easily
achievable and the rest of power requirement
would be using gas.
To arrive at total fuel needs of India, two alternative scenarios are developed.
Year Total Thermal Electricity (BkWh)
Coal based BkWh
Gas basedBkWh
Coal Req.MMT
Gas Req. BCM.
04-05 500 370 130 259 26
09-10 711 493 238 331 47
14-15 1021 609 418 422 84
19-20 1409 769 640 538 128
24-25 1941 984 957 683 191
29-30 2600 1253 1347 877 269
14
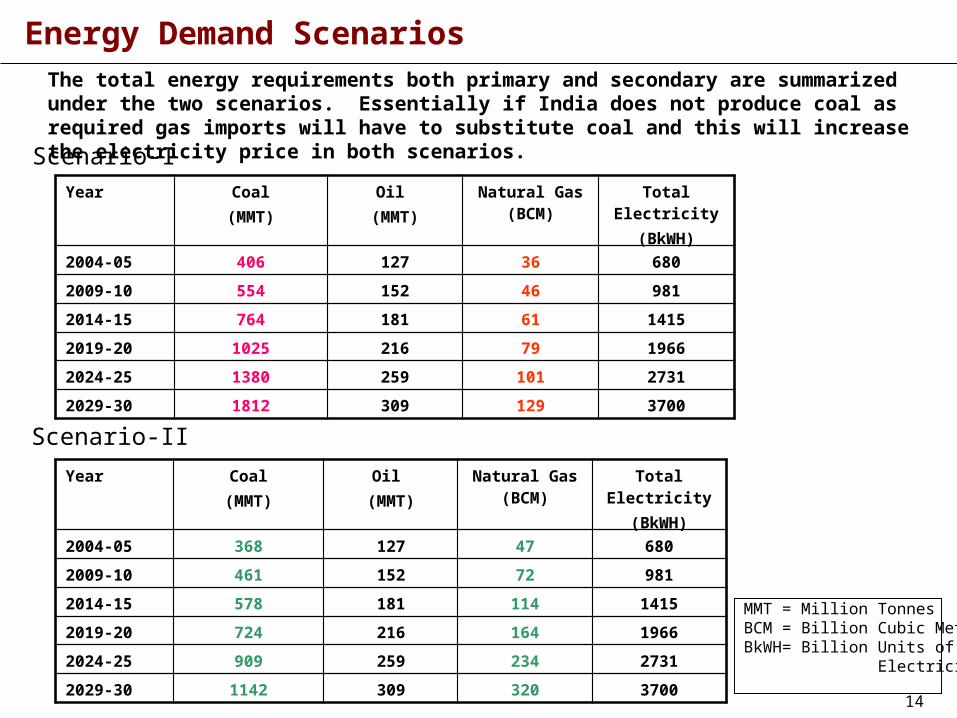
Energy Demand Scenarios The total energy requirements both primary and secondary are summarized under the two scenarios. Essentially if India does not produce coal as required gas imports will have to substitute coal and this will increase the electricity price in both scenarios.
Scenario-I
Scenario-II
Year Coal(MMT)
Oil (MMT)
Natural Gas (BCM)
Total Electricity
(BkWH)
2004-05 406 127 36 680
2009-10 554 152 46 981
2014-15 764 181 61 1415
2019-20 1025 216 79 1966
2024-25 1380 259 101 2731
2029-30 1812 309 129 3700
Year Coal(MMT)
Oil (MMT)
Natural Gas (BCM)
Total Electricity
(BkWH)
2004-05 368 127 47 680
2009-10 461 152 72 981
2014-15 578 181 114 1415
2019-20 724 216 164 1966
2024-25 909 259 234 2731
2029-30 1142 309 320 3700
MMT = Million TonnesBCM = Billion Cubic MetersBkWH= Billion Units of Electricity.
15
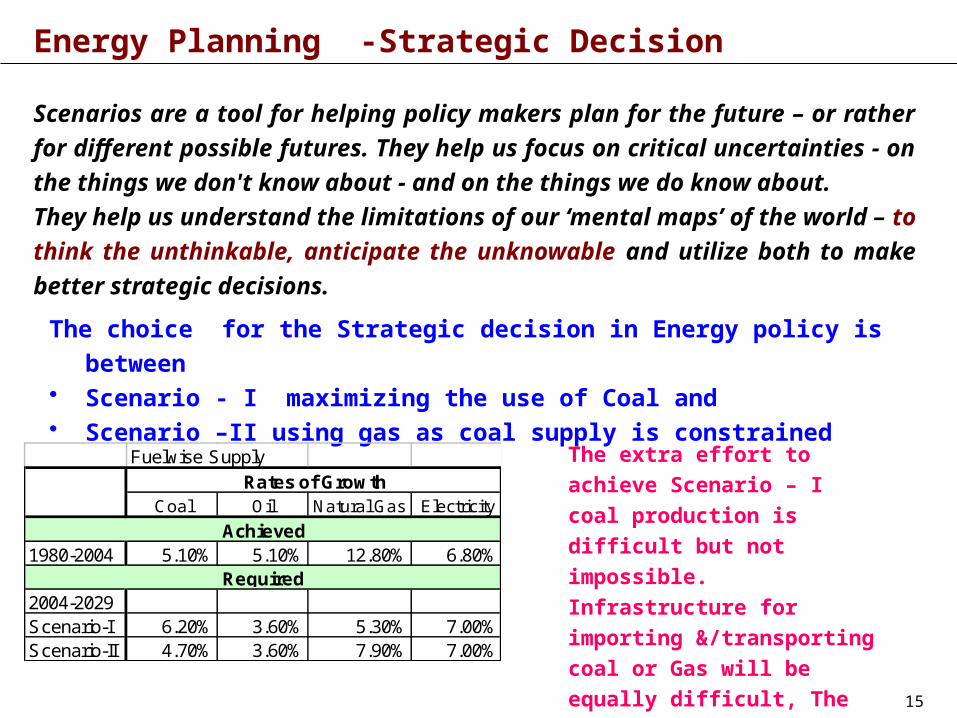
Energy Planning -Strategic Decision
Scenarios are a tool for helping policy makers plan for the future – or rather
for different possible futures. They help us focus on critical uncertainties - on
the things we don't know about - and on the things we do know about.
They help us understand the limitations of our ‘mental maps’ of the world –
to think the unthinkable, anticipate the unknowable and utilize both to make
better strategic decisions.
The choice for the Strategic decision in Energy policy is between • Scenario - I maximizing the use of Coal and • Scenario –II using gas as coal supply is constrained
Fuelwise Supply
Coal Oil Natural Gas Electricity
1980-2004 5.10% 5.10% 12.80% 6.80%
2004-2029Scenario-I 6.20% 3.60% 5.30% 7.00%Scenario-II 4.70% 3.60% 7.90% 7.00%
Rates of Growth
Achieved
Required
The extra effort to achieve
Scenario – I coal production is
difficult but not impossible.
Infrastructure for importing
&/transporting coal or Gas will
be equally difficult, The Forex
and employment implications
are clear.
16
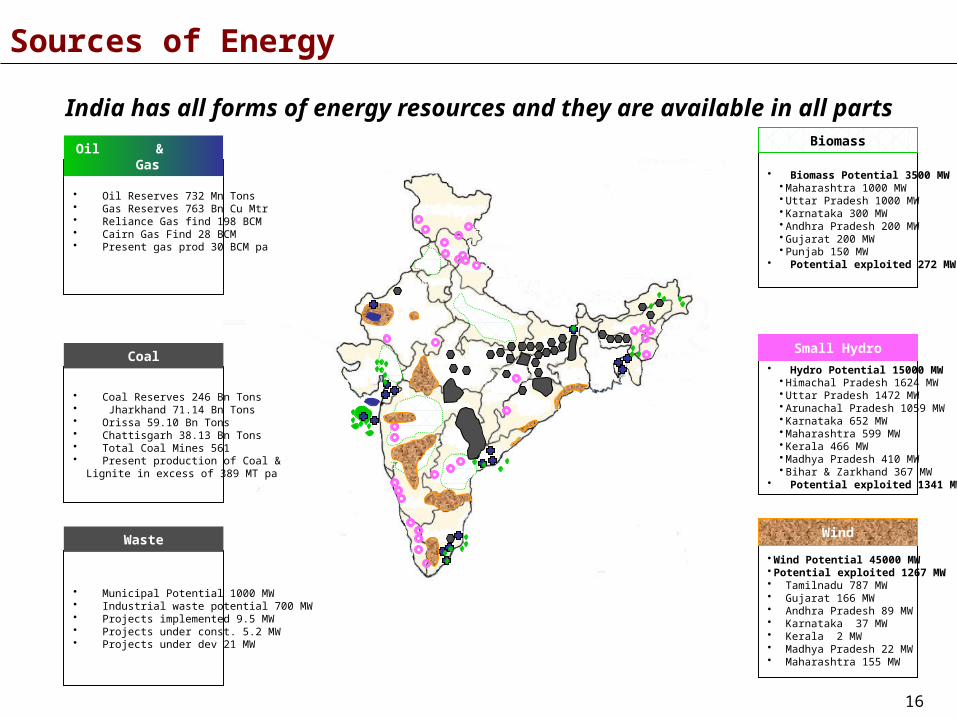
• Wind Potential 45000 MW• Potential exploited 1267 MW• Tamilnadu 787 MW• Gujarat 166 MW• Andhra Pradesh 89 MW• Karnataka 37 MW• Kerala 2 MW • Madhya Pradesh 22 MW • Maharashtra 155 MW
• Hydro Potential 15000 MW• Himachal Pradesh 1624 MW• Uttar Pradesh 1472 MW• Arunachal Pradesh 1059 MW• Karnataka 652 MW• Maharashtra 599 MW• Kerala 466 MW• Madhya Pradesh 410 MW• Bihar & Zarkhand 367 MW
• Potential exploited 1341 MW
• Oil Reserves 732 Mn Tons• Gas Reserves 763 Bn Cu Mtr• Reliance Gas find 198 BCM• Cairn Gas Find 28 BCM• Present gas prod 30 BCM pa
Oil & Gas
• Coal Reserves 246 Bn Tons• Jharkhand 71.14 Bn Tons• Orissa 59.10 Bn Tons• Chattisgarh 38.13 Bn Tons• Total Coal Mines 561• Present production of Coal & Lignite in excess of 389 MT pa
Coal
• Biomass Potential 3500 MW• Maharashtra 1000 MW• Uttar Pradesh 1000 MW• Karnataka 300 MW• Andhra Pradesh 200 MW• Gujarat 200 MW• Punjab 150 MW
• Potential exploited 272 MW
Biomass
Small Hydro
Wind
• Municipal Potential 1000 MW• Industrial waste potential 700 MW• Projects implemented 9.5 MW• Projects under const. 5.2 MW• Projects under dev 21 MW
Waste
Sources of Energy
India has all forms of energy resources and they are available in all parts
17
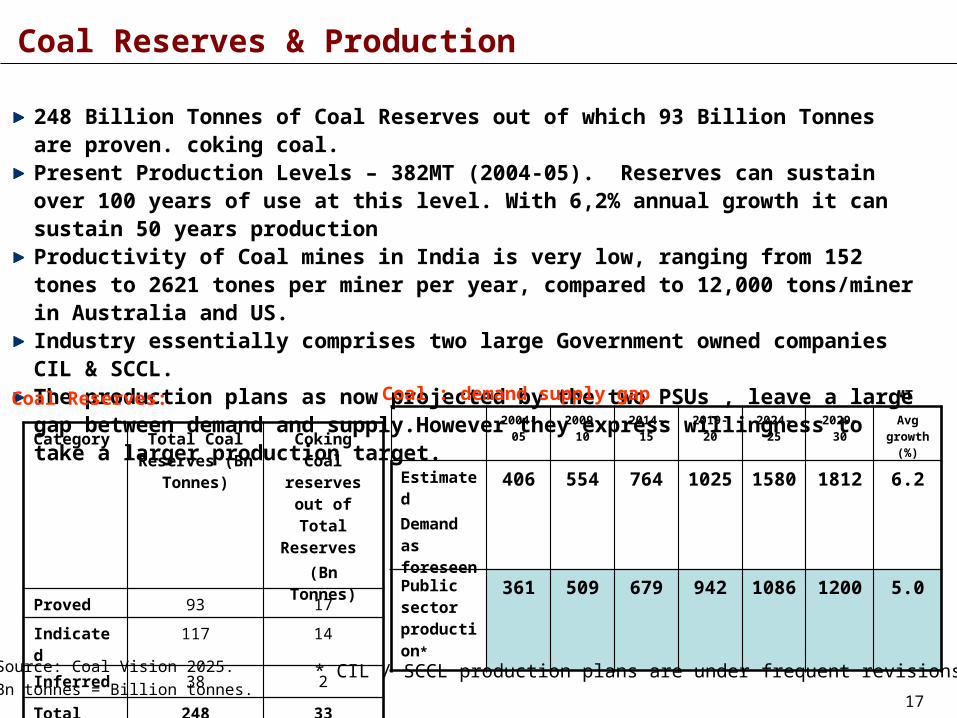
Coal Reserves & Production
248 Billion Tonnes of Coal Reserves out of which 93 Billion Tonnes are proven. coking coal.Present Production Levels – 382MT (2004-05). Reserves can sustain over 100 years of use at this level. With 6,2% annual growth it can sustain 50 years productionProductivity of Coal mines in India is very low, ranging from 152 tones to 2621 tones per miner per year, compared to 12,000 tons/miner in Australia and US. Industry essentially comprises two large Government owned companies CIL & SCCL.The production plans as now projected by the two PSUs , leave a large gap between demand and supply.However they express willingness to take a larger production target.
Coal Reserves:
Source: Coal Vision 2025.
Bn tonnes = Billion tonnes.
Category Total Coal Reserves (Bn
Tonnes)
Coking Coal reserves out
of Total Reserves
(Bn Tonnes)
Proved 93 17
Indicated 117 14
Inferred 38 2
Total 248 33
2004-05 2009-10 2014-15 2019-20 2024-25 2029-30 Avg growth
(%)
EstimatedDemand as foreseen
406 554 764 1025 1580 1812 6.2
Public sector production*
361 509 679 942 1086 1200 5.0
MTCoal : demand supply gap
* CIL / SCCL production plans are under frequent revisions.
18
Coal Sector – Strategies for Future
A committee under T L Sankar is examining the following:* India is the third largest producer of coal with 400 mt/yr. China leads with
2000mt/yr distantly followed by USA as second with 1100mt/yr. All three are planning to increase coal production in the next two decades. If India produce and uses 1800mt in 2029-30, the CO2 emission would be about 5.5 billion tonnes – lower than current US pollution and one third of US in per-capita terms.India should use more coal but produce and use it in a responsible manner, keeping local and global pollution efforts to the minimum.
* Pending the Parliament passing the Coal Mines Nationalization(Amendment) Bill,various measures for liberalizing captive coal mining provisions.
• Use of modern technology to augment productivity and quality• Adoption of clean coal technologies, such as IGCC, Carbon sequestration etc.• Create competition among public sector coal companies at the State and Central
level.• Rationalization of railway freights• Creating a vibrant coal trade involving imports exports and internal trade
through e-auction and commodity trade channels.
19
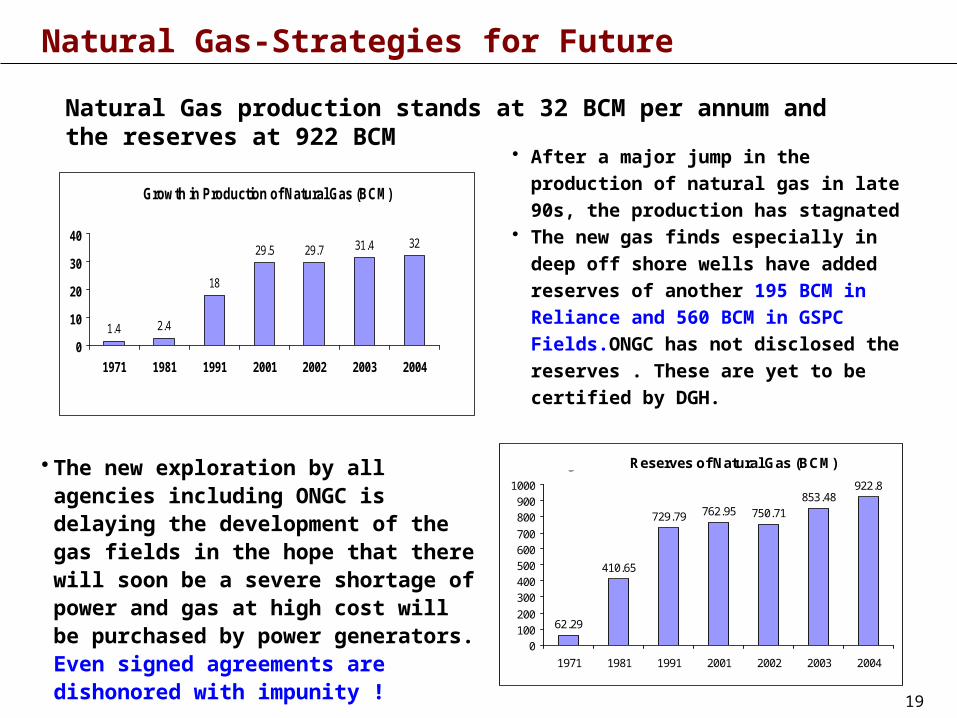
Natural Gas-Strategies for Future
Natural Gas production stands at 32 BCM per annum and the reserves at 922 BCM
Growth in Production of Natural Gas (BCM)
1.4 2.4
18
29.5 29.7 31.4 32
0
10
20
30
40
1971 1981 1991 2001 2002 2003 2004
Figure 3.5: Reserves of Natural Gas (BCM)
62.29
410.65
729.79 762.95 750.71853.48
922.8
0100200
300400500600700
800900
1000
1971 1981 1991 2001 2002 2003 2004
• After a major jump in the production of
natural gas in late 90s, the production has
stagnated• The new gas finds especially in deep off
shore wells have added reserves of
another 195 BCM in Reliance and 560 BCM
in GSPC Fields.ONGC has not disclosed
the reserves . These are yet to be certified
by DGH.
• The new exploration by all agencies including ONGC is delaying the development of the gas fields in the hope that there will soon be a severe shortage of power and gas at high cost will be purchased by power generators. Even signed agreements are dishonored with impunity !
20
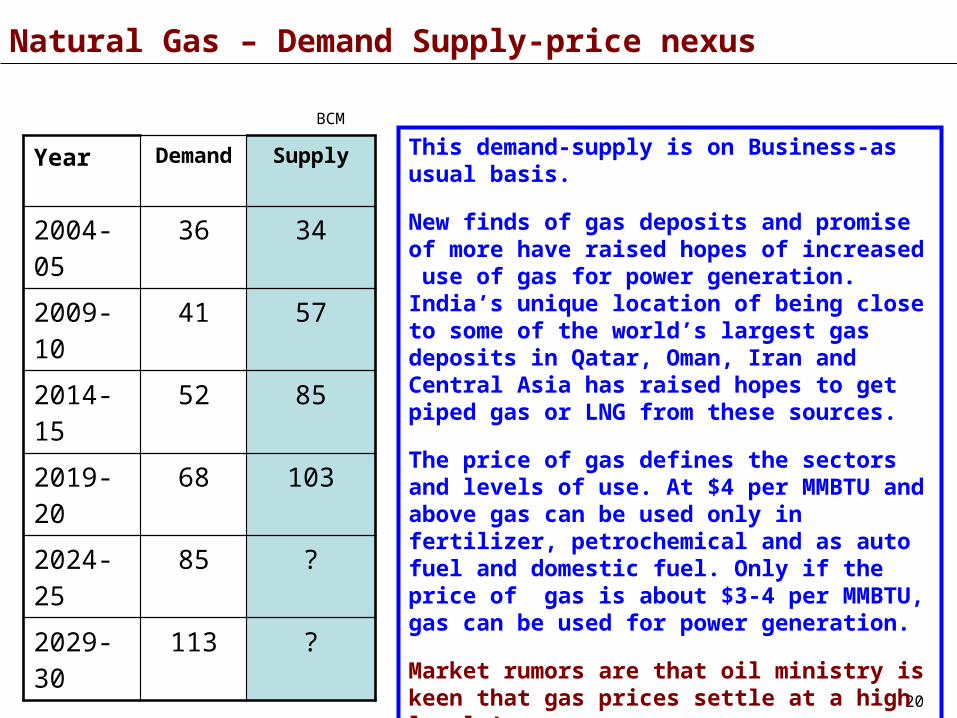
Natural Gas – Demand Supply-price nexus
Year Demand Supply
2004-05
36 34
2009-10
41 57
2014-15
52 85
2019-20
68 103
2024-25
85 ?
2029-30
113 ?
This demand-supply is on Business-as usual basis.
New finds of gas deposits and promise of more have raised hopes of increased use of gas for power generation. India’s unique location of being close to some of the world’s largest gas deposits in Qatar, Oman, Iran and Central Asia has raised hopes to get piped gas or LNG from these sources.
The price of gas defines the sectors and levels of use. At $4 per MMBTU and above gas can be used only in fertilizer, petrochemical and as auto fuel and domestic fuel. Only if the price of gas is about $3-4 per MMBTU, gas can be used for power generation.
Market rumors are that oil ministry is keen that gas prices settle at a high level !
BCM
21
Petroleum
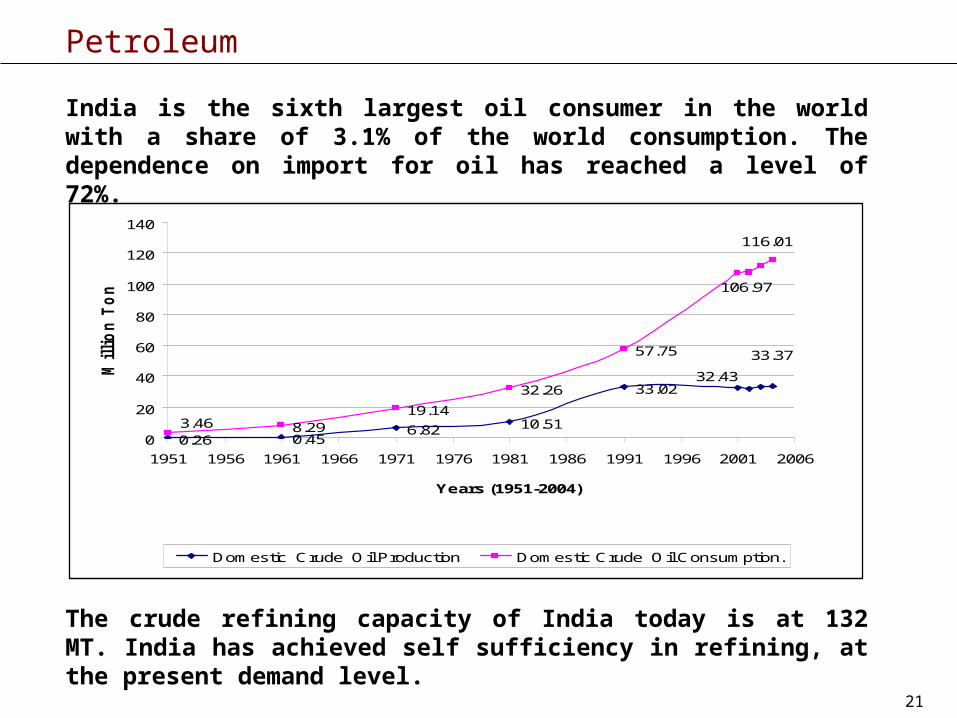
India is the sixth largest oil consumer in the world with a share of 3.1% of the world consumption. The dependence on import for oil has reached a level of 72%.
The crude refining capacity of India today is at 132 MT. India has achieved self sufficiency in refining, at the present demand level.
0.26 0.456.82 10.51
33.02
8.2919.14
32.26
57.75 33.37
32.43
3.46
106.97
116.01
0
20
40
60
80
100
120
140
1951 1956 1961 1966 1971 1976 1981 1986 1991 1996 2001 2006
Years (1951-2004)(Production and Consumption Figures Pertain to the Year Ending of the Concerned Financial
Year)
Millio
n T
on
nes
Domestic Crude Oil Production Domestic Crude Oil Consumption.
22
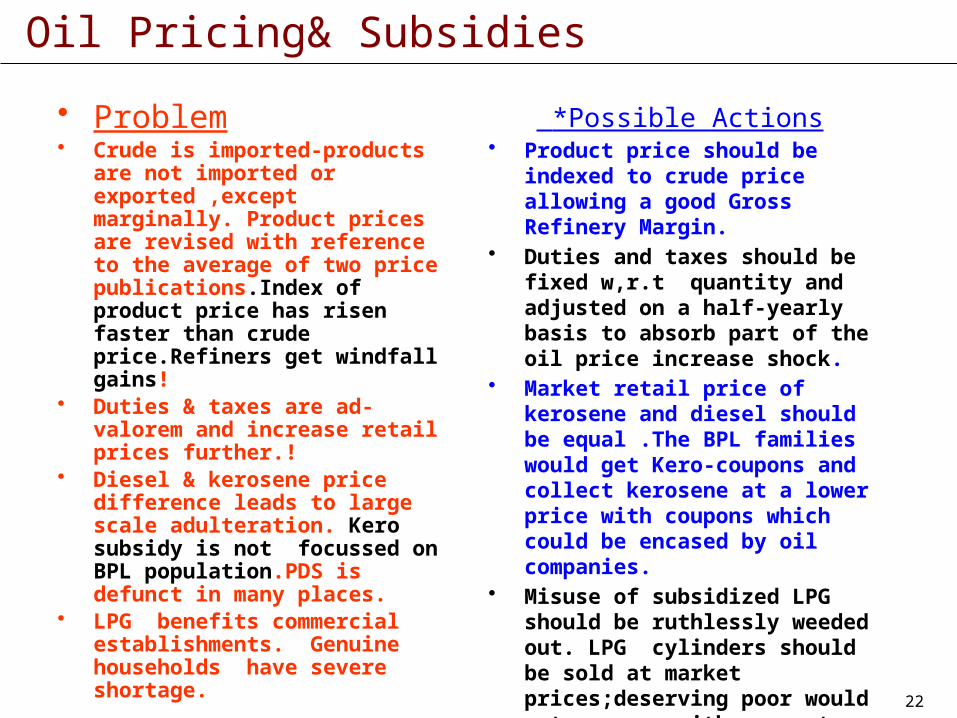
Oil Pricing& Subsidies
• Problem• Crude is imported-products are
not imported or exported ,except marginally. Product prices are revised with reference to the average of two price publications.Index of product price has risen faster than crude price.Refiners get windfall gains!
• Duties & taxes are ad-valorem and increase retail prices further.!
• Diesel & kerosene price difference leads to large scale adulteration. Kero subsidy is not focussed on BPL population.PDS is defunct in many places.
• LPG benefits commercial establishments. Genuine households have severe shortage.
*Possible Actions• Product price should be indexed
to crude price allowing a good Gross Refinery Margin.
• Duties and taxes should be fixed w,r.t quantity and adjusted on a half-yearly basis to absorb part of the oil price increase shock.
• Market retail price of kerosene and diesel should be equal .The BPL families would get Kero-coupons and collect kerosene at a lower price with coupons which could be encased by oil companies.
• Misuse of subsidized LPG should be ruthlessly weeded out. LPG cylinders should be sold at market prices;deserving poor would get coupons with a monetary value.
23
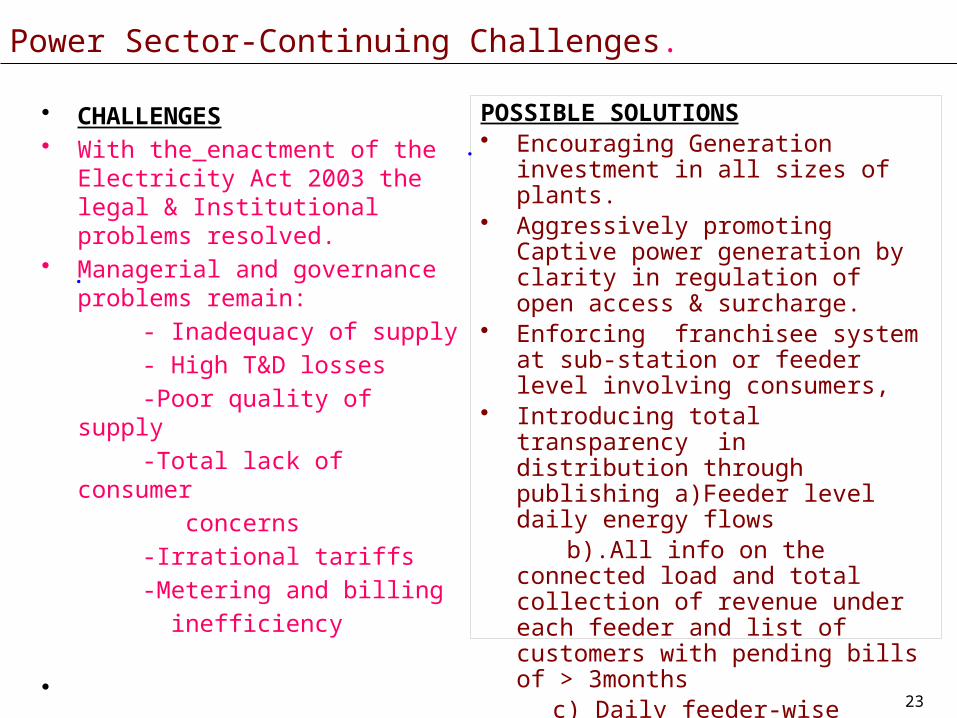
Power Sector-Continuing Challenges.
.
.
• CHALLENGES• With the enactment of the Electricity
Act 2003 the legal & Institutional problems resolved.
• Managerial and governance problems remain:
- Inadequacy of supply
- High T&D losses
-Poor quality of supply
-Total lack of consumer
concerns
-Irrational tariffs
-Metering and billing
inefficiency
•
POSSIBLE SOLUTIONS• Encouraging Generation investment in
all sizes of plants.• Aggressively promoting Captive power
generation by clarity in regulation of open access & surcharge.
• Enforcing franchisee system at sub-station or feeder level involving consumers,
• Introducing total transparency in distribution through publishing a)Feeder level daily energy flows
b).All info on the connected load and total collection of revenue under each feeder and list of customers with pending bills of > 3months
c) Daily feeder-wise interruption report CAIDI should be published.• Spot billing with instantaneous printing.
*
24
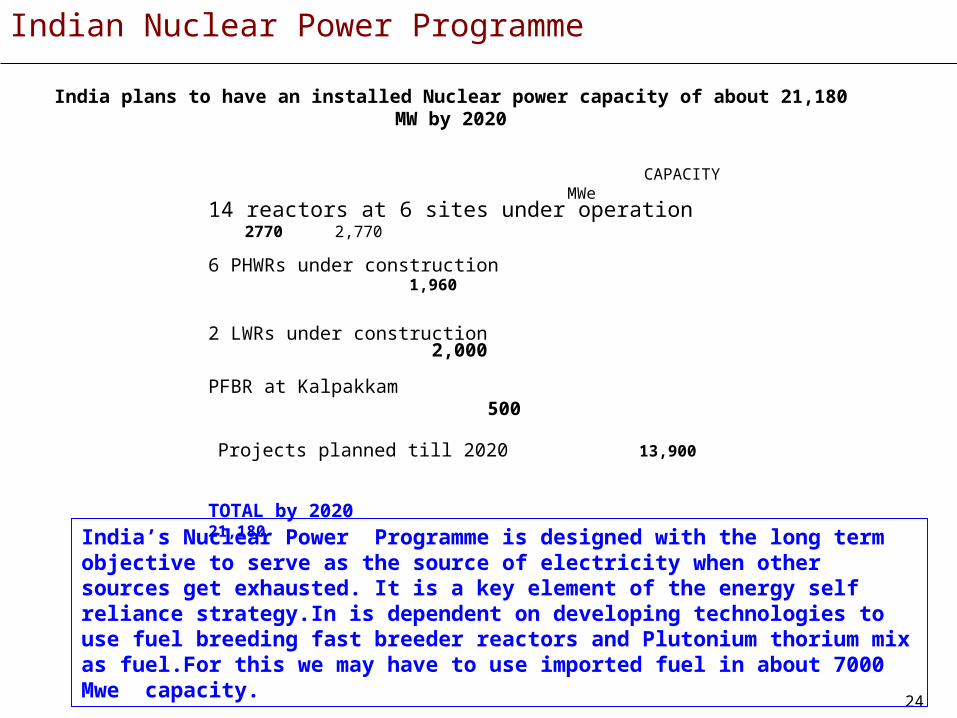
Indian Nuclear Power Programme
14 reactors at 6 sites under operation 2770 2,770
6 PHWRs under construction 1,960
2 LWRs under construction 2,000
PFBR at Kalpakkam 500
Projects planned till 202013,900
TOTAL by 2020 21,180
CAPACITY MWe
India plans to have an installed Nuclear power capacity of about 21,180 MW by 2020
India’s Nuclear Power Programme is designed with the long term objective to serve as the source of electricity when other sources get exhausted. It is a key element of the energy self reliance strategy.In is dependent on developing technologies to use fuel breeding fast breeder reactors and Plutonium thorium mix as fuel.For this we may have to use imported fuel in about 7000 Mwe capacity.
25
Hydro Power
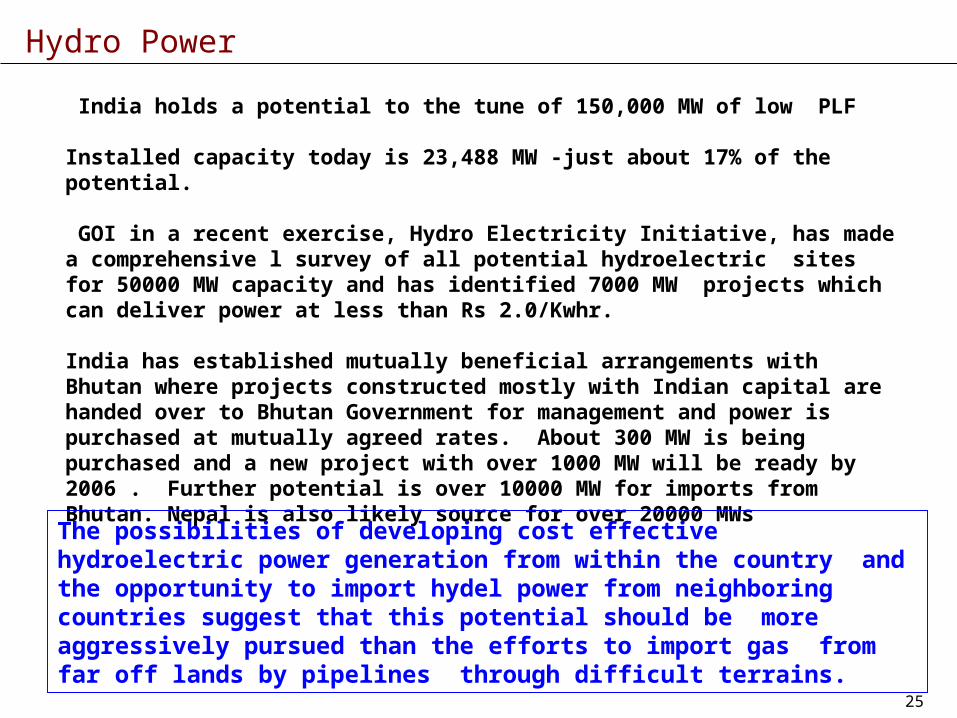
India holds a potential to the tune of 150,000 MW of low PLF
Installed capacity today is 23,488 MW -just about 17% of the potential.
GOI in a recent exercise, Hydro Electricity Initiative, has made a comprehensive l survey of all potential hydroelectric sites for 50000 MW capacity and has identified 7000 MW projects which can deliver power at less than Rs 2.0/Kwhr.
India has established mutually beneficial arrangements with Bhutan where projects constructed mostly with Indian capital are handed over to Bhutan Government for management and power is purchased at mutually agreed rates. About 300 MW is being purchased and a new project with over 1000 MW will be ready by 2006 . Further potential is over 10000 MW for imports from Bhutan. Nepal is also likely source for over 20000 MWs
The possibilities of developing cost effective hydroelectric power generation from within the country and the opportunity to import hydel power from neighboring countries suggest that this potential should be more aggressively pursued than the efforts to import gas from far off lands by pipelines through difficult terrains.
26
Alternative Fuels
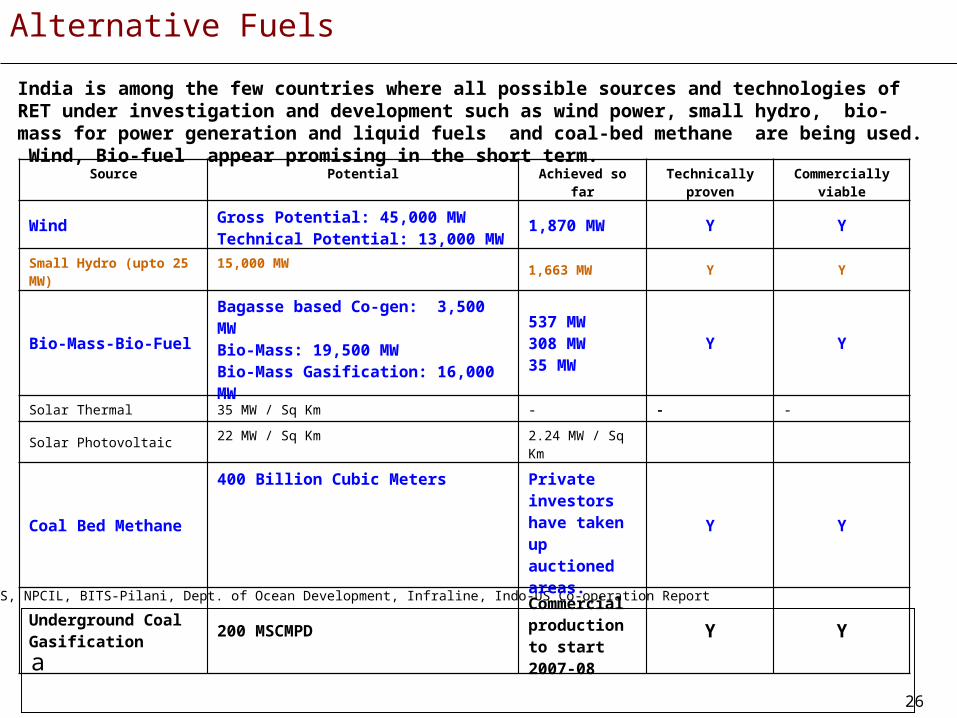
India is among the few countries where all possible sources and technologies of RET under investigation and development such as wind power, small hydro, bio-mass for power generation and liquid fuels and coal-bed methane are being used. Wind, Bio-fuel appear promising in the short term.
Sources: MNES, NPCIL, BITS-Pilani, Dept. of Ocean Development, Infraline, Indo-US Co-operation Report
Source Potential Achieved so far Technically proven Commercially viable
WindGross Potential: 45,000 MWTechnical Potential: 13,000 MW 1,870 MW Y Y
Small Hydro (upto 25 MW) 15,000 MW 1,663 MW Y Y
Bio-Mass-Bio-FuelBagasse based Co-gen: 3,500 MWBio-Mass: 19,500 MWBio-Mass Gasification: 16,000 MW
537 MW308 MW35 MW
Y Y
Solar Thermal 35 MW / Sq Km - - -
Solar Photovoltaic22 MW / Sq Km
2.24 MW / Sq Km
Coal Bed Methane
400 Billion Cubic Meters Private investors have taken up auctioned areas.
Y Y
Underground Coal Gasification
200 MSCMPDCommercial production to start 2007-08
Y Y
a
27
Today the energy scene in India is admittedly disappointing. A crisis is brewing.
The wakeup call has been given India has started responding.
We have the material resources. We have a competent technical man-power of adequate quality and
quantity. We have the appropriate leadership at the top. India’s Prime Minister is arguably the most
erudite and honest leader in the World. He has the reputation for having steered India over the forex
crisis.
We are acutely aware that managing the emerging Energy Crisis involves:
-managing Oil imports – how much would depend on actions taken towards conservation of
oil in transport sector, introduction of new mass transport, and development of environment
friendly cost effective bio-liquid fuels.
- improving efficiency of power sector,in respect of governance, modernization and
professionalization and
- introducing appropriate reforms in the coal sector including environment policies to
accelerate coal production.
Achieving these would not be easy.
But,
The will to overcome the crisis is emerging .
Summing up
28
My Vision : India Energy 2050
• There will be adequate power of appropriate quality sold by competing producers, traders and suppliers. Poor householders and agriculturalists will have coupons with a monetary value given to them personally which they can use to purchase from any source. All consumers can have a choice of suppliers.
• All renewable energy technologies will be viable. India will produce power from Wind,water and sun in plants of all sizes. Large power plants using hydro electric resources, Coal and safe Nuclear technologies using Thorium will produce huge quantities of power.
• Open access will be available on all EHV,HV and even major distribution lines.Transmitting power will be like traveling along Highways with tolls.
• Utilities will sell power to groups of consumers under a feeder line.This group can choose to buy from a number of any competing power supplier.
• Oil use will be reduced to the maximum by use of fuel efficient and hydrogen based cars and by Bio-fuels which by then could totally replace petrol and diesel.
• Energy use will adopt 100% efficient practices in all sectors.• Every drop of water will be used wisely.• Every adult would have a useful employment and public role.
29
Last Words.
We were challenged by Hindu-rate of growth, we have over come !
We were challenged by Food Crisis, We have overcome !
We were challenged by Forex Crisis, We have overcome !
Now, we are being challenged by Energy Crisis,
We shall overcome !
THANKS
I can only end with the hope which keeps me going.