Embed Size (px)
Citation preview
1
Article type: Original research paper
To submit: Exp Appl Acarol
Title: Isolation and characterization of polymorphic microsatellite markers in
Tetranychus urticae and cross amplification in other Tetranychidae and
Phytoseiidae species of economical importance.
Sabater-Muñoz, B.1; Pascual-Ruiz, S.2; Gómez-Martínez, M.A. 2; Jacas, J.A.2; Hurtado,
M.A.2
1Unidad Asociada de Entomología UJI-IVIA;
Instituto Valenciano de Investigaciones Agrarias (IVIA); Centro de Protección Vegetal
y Biotecnología; Ctra. Moncada-Náquera km 4.5; 46113 Moncada (Spain) 2 Universitat Jaume I; Unitat Associada d’Entomologia; Departament de Ciències
Agràries i del Medi Natural; Campus del Riu Sec; 12071 Castelló de la Plana (Spain).
*Address for correspondence:
Unidad Asociada Entomología UJI-IVIA
Centro de Protección Vegetal y Biotecnología
Instituto Valenciano de Investigaciones Agrarias (IVIA).
Ctra. Moncada - Náquera Km. 4.5
46113 Moncada, Valencia (SP)
Tel: +34 963424000
Fax: +34 963424001
E-mail: [email protected], [email protected]
2
Abstract
Tetranychus urticae Koch is a cosmopolitan phytophagous mite considered as the
most polyphagous species among spider mites. This mite constitutes one of the key
pests of clementine mandarins in the region of La Plana, where Spanish clementine
production concentrates. Population genetic studies using molecular markers such as
microsatellites have been proved to be extremely informative to address questions about
population structure, phylogeography and host preferences. The aim of this study was to
develop new microsatellite markers to differentiate T. urticae populations occurring in
citrus orchards, in both the trees and weeds. Five different microsatellite DNA libraries
were developed using probes with the motives CT, CTT, GT and CAC following the
FIASCO protocol. Positive clones, those that included the insert with the microsatellite,
were detected using the PIMA-PCR technique. On 22 of 32 new microsatellites loci
combinations of primers were designed and their polymorphism was tested in four
populations sampled along the eastern coast of Spain, obtaining 11 successful
amplification. Cross amplification was tested in T. turkestani, T. evansi, T. okinawanus,
Panonychus citri, Eutetranychus orientalis, E. banksi, Oligonychus perseae and
Aphlonobia histricina, species belonging to the same Tetranychidae family, and in
Typhlodromus phialatus, Neoseiulus californicus, N. barkeri, Euseius stipulatus,
Phytoseiulus persimilis, Amblyseius swirskii, A. cucumeris and A. andersoni belonging
to the Phytoseiidae family, obtaining 8 successful cross amplifications.
The final goal of our research was to increase the available molecular tools to gain
insight into the genetic structure of T. urticae populations of citrus orchards, which
might help in its management.
Keywords: Citrus clementina, microsatellites, SSRs, IPM
3
Introduction
Tetranychus urticae Koch (Acari: Tetranychidae) is an important pest of citrus in Spain
(Aucejo-Romero et. al. 2004; Ansaloni et al. 2007; Aguilar-Fenollosa et al. 2011) as
well as in some citrus growing areas, especially on mandarins under Mediterranean
climate (Bodenheimer, 1951; Talhouk, 1975; Swirski, 1977; McMurtry, 1985; Vacante,
1986; Hmimina et al. 1995; Souliotis et al. 1997). This mite constitutes the key pest of
Clementine mandarins, Citrus clementina Hort. ex Tan., in the region of La Plana, the
area around the city of Castelló de la Plana (39º 59’N; 00º 02’W), where Spanish
Clementine production concentrates (around 1.5 106 tons; 60 103 ha). Mite infestations
in Clementine varieties result in chlorotic spots on leaves, but more importantly, in fruit
scarring, which decreases its commercial value. Our main goal is to study the genetic
variation of this important pest in terms of host specialization, adaptation to different
production systems (organic vs IPM), and phylogenetic relationships. The study of the
genetic structure of populations of T. urticae in citrus groves appears as a powerful
approach to estimate gene flow among mites infesting different plants in the
agroecosystem. Different molecular techniques, such as microsatellite markers, isolated
in T. urticae and other related mite species (Navajas et al. 1998a, 2000; Nishimura et al.
2003, Uesugi et al. 2007, Abercrombie et al. 2009 and Hinomoto et al. 2010), and the
sequence of mitochondrial DNA gene coding for cytochrome oxidase I (COI) have
already been used in tetranychid mites to study both inter- and intraspecific variation
among populations (Navajas, 1998; Navajas et al. 1998b, 1999, 2000; Navajas and
Fenton 2000; Hinomoto and Takafuji 2001; Tixier et al. 2002a,b; Bailly et al. 2004; Xie
et al. 2006; Ben-David et al. 2007; Carbonelle et al. 2007; Uesugi et al. 2009a,b; Li et
al. 2009). Microsatellite markers have become one of the most popular genetic markers
and they have been chosen in ecological studies because of their high polymorphism.
The enormous adaptability of T. urticae to different host plants (Gould, 1979; Fry,
1989, 1992; Agrawal, 2000), and the fact that in the citrus agrosystem, this mite can be
found feeding on many plant species (Aucejo et al. 2003; Aguilar-Fenollosa et al.
2011), have stirred our interest in determining the existence of host races of this species.
Using the microsatellites developed by Navajas et al. (2002) in T. urticae populations of
citrus orchards from Eastern Spain, we have found a low level of polymorphism in these
populations. Only phylogeographic differences have been established in our populations
(Hurtado et al. 2008a), with two T. urticae metapopulations: inland and coastal
4
populations. The massive use of acaricides in commercial citrus orchards may explain
these results, which would result in genetic bottlenecks in founder populations and
reduced genetic variability in the populations. The development of new microsatellites
for T. urticae will increase the number of tools for genetic differentiation of mite
populations, which may help in refining the management of this pest species. Moreover,
these new microsatellite loci could prove useful in other economically important mite
species like Phytoseiidae and other Tetranychidae. Bailly et al. (2004) used the T.
urticae microsatellites developed by Navajas et al. (2002) in a closely related species,
Tetranychus turkestani, and found geographical differences in this case, as well. Li at al.
(2009) studied the genetic differences between T. urticae and T. cinnabarinus using the
microsatellites developed by Navajas et al. (2002) and Uesugi and Osakabe (2007),
having no amplification with the last ones loci, despite that in a more recent work the
species status of T. cinnabarinus has been revised and assigned to the T. urticae species
(de Mendoça et al. 2011). The genetic study of mite species can also address questions
about mite genetic adaptation, which can be useful to understand the relationships
between the mites present in a specific agroecosystem in order to develop suitable
Biological Control strategies.
In summary, our goal is to develop microsatellite markers for mites using T. urticae as
model species.
Materials and Methods
Unless otherwise indicated, all molecular techniques and solutions were performed as
described by Sambrook et al. (1989).
Biological material
Tetranychus urticae Koch were collected from a laboratory colony maintained at the
Entomology unit of IVIA (Valencia, Spain) which originated from the stock colony of
Universitat Jaume I (UJI). This colony was started in 2001 from field collected material
in the Castelló area.
Other mites (table 1) were field collected at different locations, individualized in
eppendorf tubes and stored at -20ºC till DNA extraction.
DNA extraction
5
Tetranychus urticae total DNA was isolated following ‘Salting out’ protocol (Sunnucks
and Hales, 1996) from a pool of 100 individuals (both sexes) for the generation of
enriched libraries.
For testing the markers in all the species individualized extractions were performed
following the same protocol.
Enriched library
T. urticae total DNA was enriched for microsatellite motifs CT, CTT, GT and CAC
following the FIASCO protocol (Zane et al. 2002) using MseI and AluI as restriction
enzymes for the genome fractionation. Enriched DNA fractions were cloned into
pGEM-T easy (Promega Biotech Ibérica SL., Madrid, Spain) and transformed into
DH5α electrocompetent E. coli cells (Invitrogen S.A., Barcelona, Spain) to obtain the
libraries.
Library screening
Each library was plated on selective LB agar plates, white colonies were transferred to
v-well plates containing 150 µl of liquid TB-glycerol medium with 50µg/ml ampiciline.
Cultures were set at 37ºC, overnight without agitation. Cultured plates were stored at -
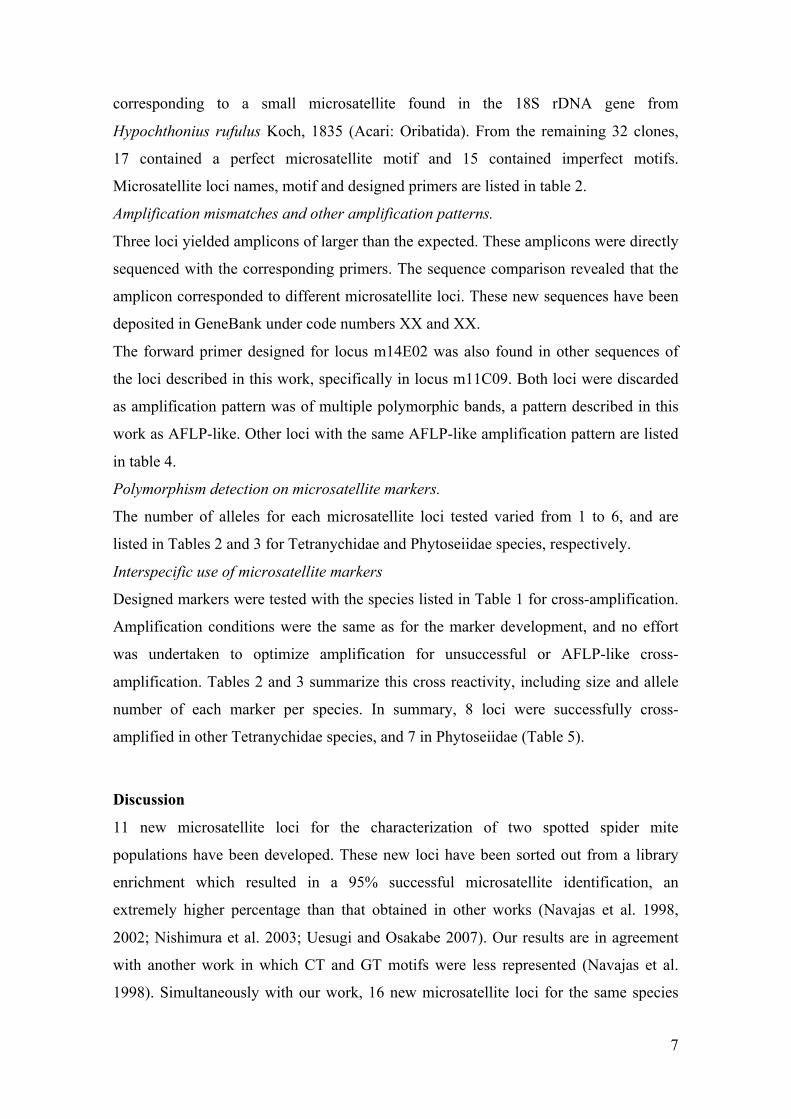
80ºC till used. Plates were subjected to colony PCR (Sabater-Muñoz et al. 2006) and
PIMA-PCR technique (Lunt et al. 1999) to select clones with microsatellite motif
(Figure 1). Positive clones, those that have included the insert with the microsatellite,
were reamplified with M13 universal primers, purified with Sephadex G-50 superfine
(GE-Amersham Healthcare, Chalfont St. Giles, UK) and verified by gel electrophoresis
on a 2% agarose gel (Pronadisa, Sumilab S.L., Madrid, España). Purified PCR products
were directly sequenced at Servicio Central de Soporte a la Investigación Experimental
(SCSIE) at Universitat de València using Bigdye® v3.1 chemistry (Applied
Biosystems, Foster City, CA, USA) with primers T7 and SP6 in 1/16 of the
recommended reaction volume.
Microsatellite markers design
Electropherograms were checked and assembled into consensus sequences by using
Staden package software (Staden et al. 2003) for each clone. Each consensus sequence
was compared to GenBank by blast using blastN as implemented in NCBI web page to
compare with other mite sequences. The sequences reported in this work have been
deposited into GenBank at NCBI (National Center for Biotechnology Information)
under accession numbers GU339354 to GU339386.
6
After these comparisons, primers were designed in conserved regions of 21
microsatellite loci using Oligo software version v4.0 (Rychlik, 1991), amplification
conditions were set up for each marker. Final successful conditions were 1x Taq pol
buffer (Roche, Applied Science, Mannheim Germany), dNTPs, 2mM MgCl2, 0.2 µM
primers, 1 u. Taq pol (Roche, Applied Science, Mannheim Germany) and 1µl of DNA
template. Microsatellite makers were tested with ten individuals of the following
populations: (1) the original T. urticae colony (2) Llíria (inland population; 39º38’N
0º36’W), (3) Callosa d’En Sarrià (coastal population; 38º39’05’’N, 0º07’22’’W), (4)
Vinaròs (coastal population; 40º28’N 0º29’E) and (5) Inca (Mallorca Island; 39º43’N
2º54’E), as well as with 10 individuals from each of the species listed in Table 1.
Thermal profile was: a first denaturation at 94ºC for 2 min, 40 cycles at 94ºc for 15 sec,
55-50ºC for 15 sec , and 72ºC for 15 sec, followed by a last cycle at 72ºC for 1 min, and
a hold step at 4ºC. Amplification was performed in a PTC-200 thermal cycler (MJ
Research, Bio-Rad Inc., Hercules, CA, USA). Several other manufactures (PCR
reagents and thermocyclers) have been also tested positively.
Amplification was verified either by acrylamide gel electrophoresis with silver staining
or, when forward primer was labelled with FAM-6 analyzed in an ABI/PE 3130
GeneAnalyzer (Applied Biosystems). Genotyping was performed using Peak Scanner
v1.0 (Applied Biosystems 2006).
Results
Microsatellite markers design
The FIASCO enrichment performed resulted in a total of 1,786 independent clones
isolated from the six cDNA libraries, from which 407 clones were PIMA-PCR selected
and single-pass sequenced. After sequence confirmation of microsatellite presence,
bidirectional sequencing was performed for 34 clones. Only 2 out of the 34 selected
clones by PIMA methodology did not contain a microsatellite sequence (but contained
several bi or tri-repeats of the motifs which could not be set as a real microsatellite),
which means that this methodology is a 95% successful in microsatellite detection.
Microsatellite distribution in libraries was 40 % and 34 % from CAC and CTT libraries,
respectively. The remaining 26% corresponded to CT and GT libraries.
Blast comparisons showed that none of the clones obtained were already present in the
data base. Only one clone produced a significant blast similarity with a mite sequence,
7
corresponding to a small microsatellite found in the 18S rDNA gene from
Hypochthonius rufulus Koch, 1835 (Acari: Oribatida). From the remaining 32 clones,
17 contained a perfect microsatellite motif and 15 contained imperfect motifs.
Microsatellite loci names, motif and designed primers are listed in table 2.
Amplification mismatches and other amplification patterns.
Three loci yielded amplicons of larger than the expected. These amplicons were directly
sequenced with the corresponding primers. The sequence comparison revealed that the
amplicon corresponded to different microsatellite loci. These new sequences have been
deposited in GeneBank under code numbers XX and XX.
The forward primer designed for locus m14E02 was also found in other sequences of
the loci described in this work, specifically in locus m11C09. Both loci were discarded
as amplification pattern was of multiple polymorphic bands, a pattern described in this
work as AFLP-like. Other loci with the same AFLP-like amplification pattern are listed
in table 4.
Polymorphism detection on microsatellite markers.
The number of alleles for each microsatellite loci tested varied from 1 to 6, and are
listed in Tables 2 and 3 for Tetranychidae and Phytoseiidae species, respectively.
Interspecific use of microsatellite markers
Designed markers were tested with the species listed in Table 1 for cross-amplification.
Amplification conditions were the same as for the marker development, and no effort
was undertaken to optimize amplification for unsuccessful or AFLP-like cross-
amplification. Tables 2 and 3 summarize this cross reactivity, including size and allele
number of each marker per species. In summary, 8 loci were successfully cross-
amplified in other Tetranychidae species, and 7 in Phytoseiidae (Table 5).
Discussion
11 new microsatellite loci for the characterization of two spotted spider mite
populations have been developed. These new loci have been sorted out from a library
enrichment which resulted in a 95% successful microsatellite identification, an
extremely higher percentage than that obtained in other works (Navajas et al. 1998,
2002; Nishimura et al. 2003; Uesugi and Osakabe 2007). Our results are in agreement
with another work in which CT and GT motifs were less represented (Navajas et al.
1998). Simultaneously with our work, 16 new microsatellite loci for the same species
8
have been developed based on the CT and GT motifs (Uesugi and Osakabe 2007). In
other closely related species, T. kanzawai, the motives CT and GT were also the targets
for microsatellite characterization (Nishimura et al. 2003).
We have obtained a similar rate of loci discarding as other authors (Navajas et al. 2002,
Nishimura et al. 2003 and Uesugi et al. 2007). We were able to design 22 combinations
of primers from the 32 microsatellite clones obtained. However, after amplification only
11 microsatellite markers were selected. Li et al. (2009) used in their studies the
microsatellites developed by Uesugi and Osakabe (2007) and got no amplification.
Nevertheless, we have tested some of them (TuCA12, TuCA25, TuCA72, TuCA83,
TuCA96, TuCT04, TuCT17, TuCT18, TuCT26, TuCT73 and TkMS015) in our
populations (table 1) and obtained successful amplifications with at least two different
alleles each. We have also included a population sampled in Florida (USA), which
showed no amplification with our loci but which presented successful amplification in 9
of the 11 Japanese loci tested (Nishimura et al. 2003, Uesugi and Osakabe 2007) (data
not shown). These results address questions about the difficulty in transferring the T.
urticae microsatellite markers between continents. Despite that Japan and Spain belong
to the Palaearctic Region, whereas USA belongs to the Nearctic Region, the results
obtained with these primers show a close relationship between Japanese and USA T.
urticae populations than between those in the same biogeographical region. This
question appeared also when ITS (Hurtado et al. 2008) and COI gene (Navajas et al.
1998, Hinomoto et al. 2001) were analyzed and it deserves further research.
Microsatellite markers in T. urticae are hard to obtain. In the present study
microsatellites were not only isolated, but also characterized and tested in populations
of T. urticae originating from different areas of the Mediterranean Western coast, as
well as in other mite species of economical importance, such as predatory Phytoseiidae
mites. The transfer of markers to other species is a key point, since they can be useful
for population studies, including detection of the origin of invasive species such as
Eutetranychus orientalis, E. banksi, or Olygonychus perseae, which have been recently
introduced in Spain.
The transference of microsatellites from the source species to closely related species is a
subject of interest due to the difficulties and economical investment needed irrespective
of the taxons studied (Bech et al. 2010, Canales-Aguirre et al. 2010, Olivatti et al. 2011
or Telles et al. 2011). In Tephritid flies, a species group of economical interest in
agriculture as the mites used in this work, microsatellites are transferable between
9
species with variable degree, ranging from 49% to as less as 24% when species belong
to different genera from the one of the source species (Augustinos et al. 2008). In this
work, the authors reported a locus size mean difference of less than 50 bp, estimated by
agarose gel electrophoresis, between species when considering the same locus. This
degree of PCR product size conservation was variable and also linked to the relatedness
of species. Although we obtained similar results of cross-species transferability, our
results taking into account percentage of functional primers and expected size, are not
indicative of the phylogenetic history of the mite species, as proposed with Tephritidae.
We obtained a similar percentage of cross amplification in phytophagous and predatory
mites, which keep far phylogenetic relationships (Navajas et al. 1998b, 1999). This
close “clustering” of cross amplification may be related to a parallel evolution or co-
evolution of phytophagous (prey) and entomophagous (predator) mites. In relation to
this issue (predator-prey relationship) we made sure that the cross-amplification was
true and not an artefact due to the presence of phytophagous DNA (prey) in the
phytoseid gut (predator) by PCR based methods developed by our group (same authors,
not yet published results).
The usefulness of the markers presented in this study is obvious both from a basic (e.g.
population studies, assessment of predation, etc.) and an applied (e.g. quality control in
commercial insectaries) points of view. As stated before, due to the difficulties and the
high economical investment needed to develop species specific microsatellite markers,
the transference of microsatellite markers among species (heterologous amplification) is
a very interesting alternative.
Acknowledgments
This work was partially funded by Ministerio de Ciencia e Innovación (MICINN)
projects AGL2005-07155-C03/AGR and AGL2008-05287-C04/AGR and by the
Fundació BANCAIXA – Universitat Jaume I projects P1-1A2005-03 and P11B2008-
02.
10
References
Abercrombie LG, et. al. (2009) Permanent Genetic Resources added to Mol Ecol Resour database 1 January 2009-30 April 2009 Mol Ecol Resour 9: 1375-1379
Agrawal AA (2000) Host-range evolution: adaptation and trade-offs in fitness of mites on alternative hosts. Ecology 81: 500-508
Aguilar-Fenollosa E, Ibáñez-Gual MV, Pascual-Ruíz S, Hurtado MA, Jacas, JA (2011) Effect of Ground-Cover Management on Spider Mites and their Phytoseiid Natural Enemies in Clementine Mandarin Orchards (I): Bottom-Up Regulation Mechanisms. Biol Control doi:10.1016/j.biocontrol.2011.06.013
Ansaloni T, Aucejo S, Jacas JA (2007) Estimating the intrinsic rate of increase of Tetranychus urticae: which is the minimum number of immature individuals to consider? Exp Appl Acarol 41: 55-59 Aucejo S, Foó M, Gimeno E, Gómez-Cadenas A, Monfort R, Obiol F, Prados E, Ramis M, Ripollés JL, Tirado V, Zaragozà L, Jacas J, Martínez-Ferrer MT (2003) Management of Tetranychus urticae in citrus in Spain: acarofauna associated to weeds. Bulletin OILB / IOBC Bulletin 26: 213-220 Aucejo S, Gómez-Cadenas A, Jacas JA (2004) Effects of NaCl-stressed citrus plants on life history of Tetranychus urticae (Acari: Tetranychidae). Exp Appl Acarol 33: 55-67 Augustinos AA, Stratikopoulos EE, Drosopoulou E, Kakani EG, Mavragani-Tsipidou P, Zacharopoulou A, Mathiopoulos KD (2008) Isolation and characterization of microsatellite markers from the olive fly, Bactrocera oleae, and their cross-species amplification in the Tephritidae family. BMC Genomics 9: 618 doi:10.1186/1471-2164-9-618
Bailly X, Migeon A, Navajas M (2004) Analysis of microsatellite variation in the spider mite Tetranychus turkestani (Acari: Tetranychidae) reveals population genetic structure and raises questions about related ecological factors. Biological Journal of the Linnean Society 82: 69-78
Bech N, Novoa C, Allienne JF, Boissier J (2010) Transferability of microsatellite markers among economically and ecologically important galliform birds. Gen. Mol. Res. 9(2): 1121-1129 Ben-David T, Melamed S, Gerson U, Morin S (2007) ITS2 sequences as barcodes for identifying and analyzing spider mites (Acari: Tetranychidae). Exp Appl Acarol 41: 169-181
Bodenheimer FS (1951) Citrus entomology Dr. W Junk Publishers Canales-Aguirre CB, Ferrada S, Hernández CE, Galleguillos R (2010) Usefulness of heterologous microsatellites obtained from Genypterus blacodes (Schneider 1801) in species Genypterus off the Southeast Pacific. Gayana 74(1): 74-77
Carbonnelle S, Hance T, Migeon A, Baret P, Cros-Arteil S, Navajas M (2007) Microsatellite markers reveal spatial genetic structure of Tetranychus urticae (Acari : Tetranychidae) populations along a latitudinal gradient in Europe. Exp Appl Acarol 41: 225-241
11
De Mendoça RS, Navia D, Diniz IR, Auger P, Navajas M (2011) A critical review on some closely related species of Tetranychus sensu stricto (Acari: Tetranychidae) in the public DNA sequences databases. Exp Appl Acarol 55(1): 1-23
Hinomoto N, Osakabe M, Gotoh T, Takafuji A (2001) Phylogenetic analysis of green and red forms of the two-spotted spider mite, Tetranychus urticae Koch (Acari: Tetranychidae), in Japan, based on mitochondrial cytochrome oxidase subunit I sequences. Appl Entomol Zool 36: 459-464
Fry JD (1989) Evolutionary adaptation to host plants in a laboratory population of the phytophagous mite Tetranychus urticae Koch. Oecologia 81: 559-565
Fry JD (1992) On the maintenance of genetic variation by disruptive selection among hosts in a phytophagous mite. Evolution 46: 279-283
Gould F (1979) Rapid host range evolution in a population of the phytophagous mite Tetranychus urticae Koch. Evolution 33: 791-802
Hinomoto N, Todokoro Y, Higaki T (2010) Population structure of the predatory mite Neoseiulus womersleyi in a tea field based on an analysis of microsatellite DNA markers. Exp Appl Acarol 53: 1-15. Hmimina M, Allam L, Ougass Y, Marmouche A (1995) Circonstances des pullulations de Tetranychus urticae Koch (Tetranychidae: Acarina) en verger d'agrumes. IOBC Bulletin 18: 28-35
Hurtado MA, Ansaloni T, Jacas JA, Navajas M (2008a) Structure of Tetranychus urticae (Acari: Prostigmata) populations occurring in Spanish orchards (Citrus reticulata Blanco) and its relevance for pest management. IOBC wprs Bulletin OILB srop. 38: 243 Hurtado MA, Ansaloni T, Cros-Arteil S, Jacas JA, Navajas M (2008b) Sequence analysis of the ribosomal Internal Transcribed Spacers region in spider mites (Prostigmata: Tetranychidae) occurring in citrus orchards in Eastern Spain: use for species discrimination. Ann Appl Biol 153: 167-174 Li T, Chen X-L, Hong XY (2009) Population genetic structure of Tetranychus urticae and its sibling Species Tetranychus cinnabaribus (Acari: Tetranychidae) in China as inferred from microsatellite data. Ann Entomol Soc Am 102(4): 674-683
Lunt DH, Hutchinson WF, Carvalho GR (1999) An efficient method for PCR-based isolation of microsatellite arrays (PIMA). Molecular Ecology 8: 891-893 Martínez-Ferrer M, Jacas JA, Ripollés JL, Aucejo S (2006) Approaches for sampling the two spotted spider mite Tetranychus urticae on clementines in Spain. J Econ Entomol 99: 1490-1499 McMurtry JA (1985) Citrus. In Spider Mites. Their Biology, Natural Enemies and Control, Vol IB, pp. 339–347. Eds. W. Helle and M.W. Sabelis. Amsterdam, The Netherlands: Elsevier.
Navajas M (1998) Host plant associations in the spider mite Tetranychus urticae (Acari: Tetranychidae): insights from molecular phylogeography. Exp Appl Acarol 22: 201-214
Navajas MJ, Thistlewood HMA, Lagnel J, Hughes C (1998a) Microsatellite sequences are under-represented in two mite genomes. Insect Molecular Biology 7: 249-256
Navajas M, Lagnel J, Gutierrez J, Boursot P (1998b) Species-wide homogeneity of nuclear ribosomal ITS2 sequences in the spider mite Tetranychus urticae contrasts with extensive mitochondrial COI polymorphism. Heredity 80: 742-752
12
Navajas M, Lagnel J, Fauvel G, De Moraes G (1999) Sequence variation of ribosomal Internal Transcribed Spacers (ITS) in commercially important Phytoseiidae mites. Exp Appl Acarol 23: 851-859
Navajas, M, Fenton B (2000) The application of molecular markers in the study of diversity in acarology: A review. Exp Appl Acarol 24: 751-774
Navajas M, Perrot-Minnot M J, Lagnel J, Migeon A, Bourse T, Cornuet JM (2002) Genetic structure of a greenhouse population of the spider mite Tetranychus urticae: spatio-temporal analysis with microsatellite markers. Insect Mol Biol 11:157-165 Nishimura S, Hinomoto N, Takafuji A (2003) Isolation, characterization, inheritance and linkage of microsatellite markers in Tetranychus kanzawai (Acari: Tetranychidae). Exp Appl Acarol 31: 93-103 Olivatti AM, Boni TA, Silva-Júnior NJ, Resende LV, Gouveia FO, Telles MPC (2011) Heterologous amplification and characterization of microsatellite markers in the Neotropical fish Leporinus friderici. Genet. Mol. Res. 10(3): 1403-1408 Talhouk AS (1975) Citrus pests throughout the world. In: Ha¨fliger E. (ed) Citrus, Ciba-Geigy, Basel, Switzerland, pp. 23–27. Tixier M-S, Kreiter S, Barbar Z, Ragusa S, Cheval B (2006) The status of two cryptic species: Typhlodromus exhilaratus Ragusa and Typhlodromus phialatus Athias-Henriot (Acari: Phytoseiidae): consequences for taxonomy. Zool Scr 35: 115-122
Tixier M-S, Kreiter S, Ferragut F, Cheval B (2006) Morphological and molecular evidences for the synonymy of Kampimodromus hmiminai McMurtry and Bounfour and K. adrianae Ferragut and Pena-Estevez (Acari: Phytoseiidae). Canadian Journal of Zoology 84 (8): 1216-1222
Uesugi R, Osakabe M (2007) Isolation and characterization of microsatellite loci in the two-spotted spider mite, Tetranychus urticae (Acari : Tetranychidae). Mol Ecol Resour 7: 290-292 Uesugi R, Kunimoto Y, Osakabe M (2009a) The fine-scale genetic structure of the two-spotted spider mite in a commercial greenhouse. Exp Appl Acarol 47: 99-109 Uesugi R, Sasawaki T, Osakabe M (2009b) Evidence of a high level of gene flow among apple trees in Tetranychus urticae. Exp Appl Acarol 49: 281-290 Rychlik W (1992) OLIGO 4.06, Primer Analysis Software. National Biosciences Inc. Publishers, Plymouth, USA Sabater-Muñoz B et.al. (2006) Large-scale gene discovery in the pea aphid Acyrthosiphon pisum (Hemiptera). Genome Biol 7(3): R21
Sambrook J, Fritsch EF, Maniatis T (Eds.), (1989) Molecular cloning. A Laboratory manual. Cold Spring Harbor Press, Cold Spring Harbor, NY, USA
Sunnucks P, Hales DF (1996) Numerous transposed sequences of mitochondrial cytochrome oxidase I-II in aphids of the genus Sitobion (Hemiptera: Aphididae). Mol Biol and Evol 13: 510-524
Souliotis P, Tsagkarakou A, Nomikou M (1997) Field observations and eco-ethological aspects of Phytoseiid mites in greek citrus groves. Acarologia XXXVIII: 29-37
13
Staden R, Beal KF, Bonfield JK (1998) The Staden Package, 1998. In: Misener, S., Krawetz, S.A. (Eds.) Computer Methods in Molecular Biology, vol 132, Bioinformatics Methods and Protocols. The Humana Press Inc., Totowa, USA, pp. 115-130
Swirski E (1977) Integrated control of mites in Israel, in ‘O. Carpens (Ed.), I Congreso Mundial de Citricultura, CEBAS Murcia-Valencia 1973’ 2: 477-480
Vacante V (1986) Influence of white mineral oil treatments on Eastern Sicily. CEC Experts Meeting. Acireale 1985. In ‘Integrated Pest Control in Citrus Groves’. Balkema, Rotterdam. pp. 423-431. Telles MPC, Peixoto FP, Lima JS, Resende LV, Vianello RP, Walter MEMT, Collevatti RG (2011) Development of microsatellite markers for the endagered Neotropical tree species Tibouchina papyrus (Melastomataceae). Genet. Mol. Res. 10(1): 321-325
Xie L, Hong XY, Xue XF (2006) Population genetic structure of the two-spotted spider mite (Acari: Tetranychidae) from China. Ann Entomol Soc Am 99: 959-965
Zane L, Bargelloni L, Patarnello T (2002) Strategies for microsatellite isolation; a review. Mol Ecol 11: 1-16
14
FIGURES and Tables LEGENDS
Fig. 1 Amplification pattern of clones containing microsatellites by using PIMA. First
and last lanes correspond to molecular weight marker (100bp ladder, Invitrogen). Some
lanes marked with a white arrow corresponded to clones containing microsatellites, as
the two PCR products are formed by combination of universal M13 primers and
microsatellite motif PIMA primer.
Table 1. Mites species used in this work
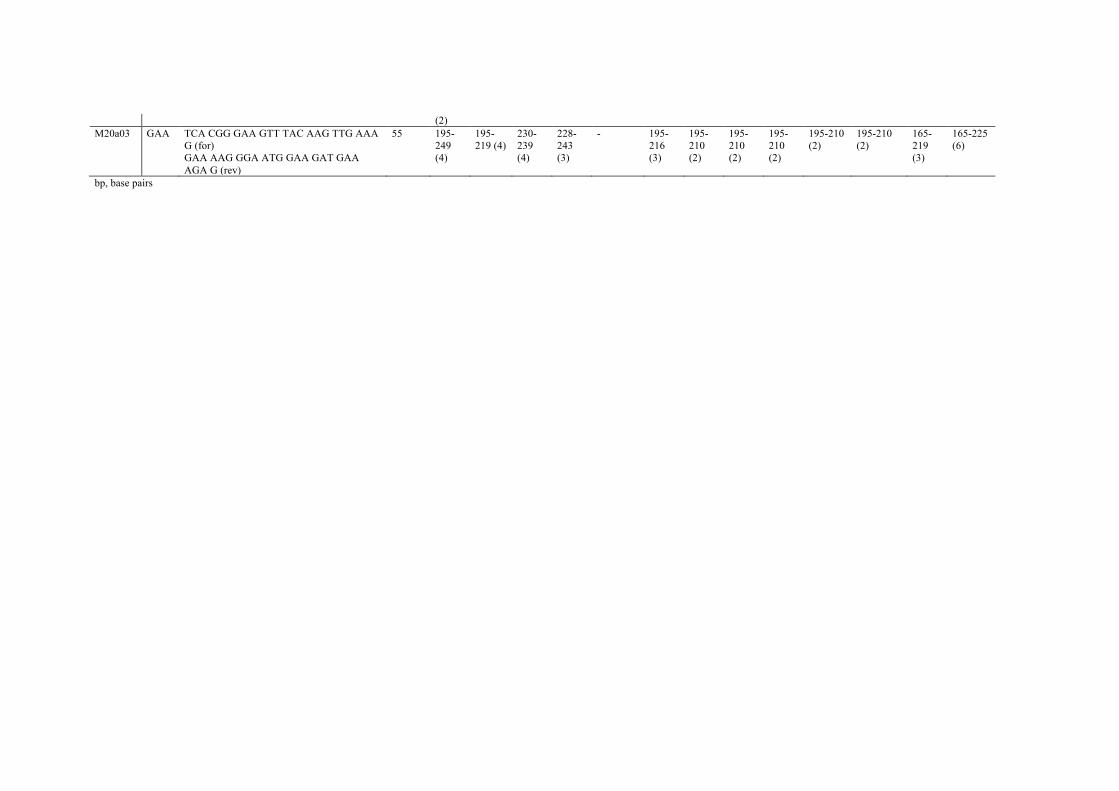
Table 2. Characteristics of loci microsatellite developed in Tetranychus urticae and
cross amplification in other Tetranychidae species. Primer sequences for each locus are
indicated for forward (for) and reverse (rev), with indication of the annealing
temperature for each locus. For cross amplification, allele size range (in base pairs) and
number of alleles (within brackets) are indicated.
Table 3. Characteristics of new Tetranychus urticae microsatellite loci in cross
amplification in Phytoseiidae species. Allele size range (in base pairs) and number of
alleles (within brackets) or amplification pattern are indicated.
Table 4. Loci discarded by amplification failure or multiple banding results (AFLP-like
loci) in Tetranychus urticae samples
Table 5. Summary of cross-species amplification of T. urticae microsatellite markers in
17 mite species.
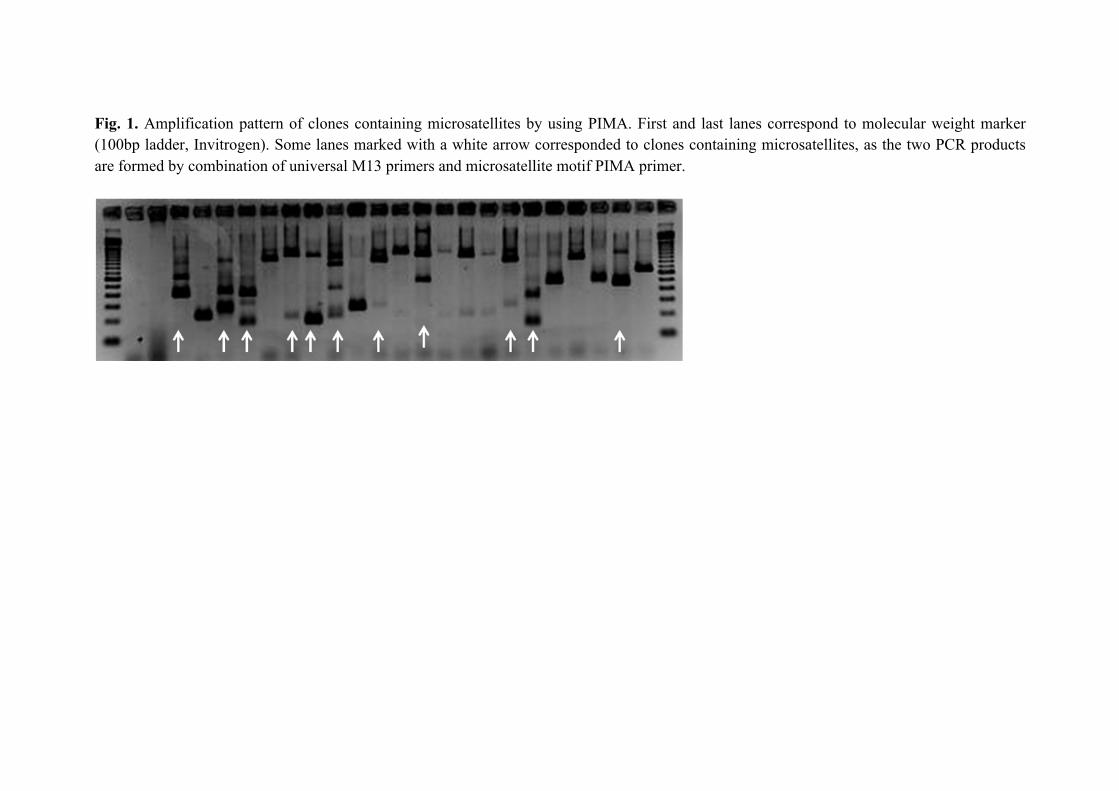
Fig. 1. Amplification pattern of clones containing microsatellites by using PIMA. First and last lanes correspond to molecular weight marker (100bp ladder, Invitrogen). Some lanes marked with a white arrow corresponded to clones containing microsatellites, as the two PCR products are formed by combination of universal M13 primers and microsatellite motif PIMA primer.
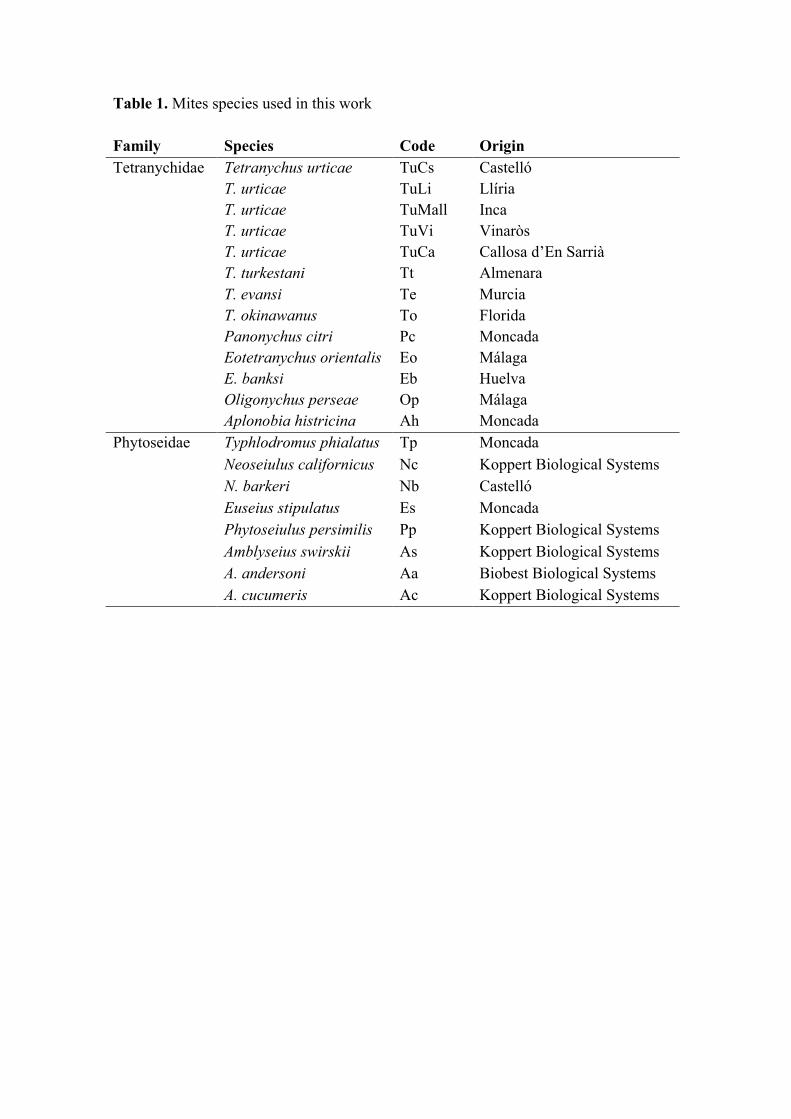
Table 1. Mites species used in this work Family Species Code Origin Tetranychidae Tetranychus urticae TuCs Castelló
T. urticae TuLi Llíria T. urticae TuMall Inca T. urticae TuVi Vinaròs T. urticae TuCa Callosa d’En Sarrià T. turkestani Tt Almenara T. evansi Te Murcia T. okinawanus To Florida Panonychus citri Pc Moncada Eotetranychus orientalis Eo Málaga E. banksi Eb Huelva Oligonychus perseae Op Málaga Aplonobia histricina Ah Moncada
Phytoseidae Typhlodromus phialatus Tp Moncada Neoseiulus californicus Nc Koppert Biological Systems N. barkeri Nb Castelló Euseius stipulatus Es Moncada Phytoseiulus persimilis Pp Koppert Biological Systems Amblyseius swirskii As Koppert Biological Systems A. andersoni Aa Biobest Biological Systems A. cucumeris Ac Koppert Biological Systems
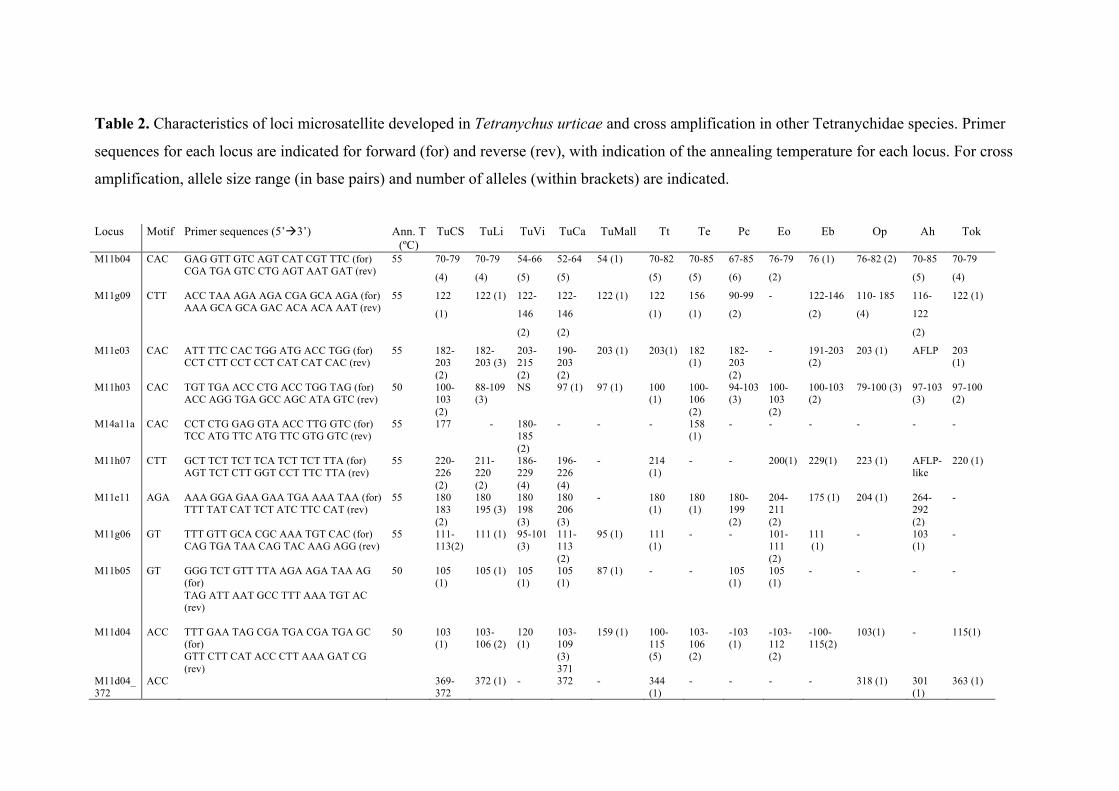
Table 2. Characteristics of loci microsatellite developed in Tetranychus urticae and cross amplification in other Tetranychidae species. Primer
sequences for each locus are indicated for forward (for) and reverse (rev), with indication of the annealing temperature for each locus. For cross
amplification, allele size range (in base pairs) and number of alleles (within brackets) are indicated.
Locus Motif Primer sequences (5’à3’) Ann. T
(ºC) TuCS TuLi TuVi TuCa TuMall Tt Te Pc Eo Eb Op Ah Tok
M11b04 CAC GAG GTT GTC AGT CAT CGT TTC (for) CGA TGA GTC CTG AGT AAT GAT (rev)
55 70-79
(4)
70-79
(4)
54-66
(5)
52-64
(5)
54 (1) 70-82
(5)
70-85
(5)
67-85
(6)
76-79
(2)
76 (1) 76-82 (2) 70-85
(5)
70-79
(4)
M11g09 CTT ACC TAA AGA AGA CGA GCA AGA (for) AAA GCA GCA GAC ACA ACA AAT (rev)
55 122
(1)
122 (1) 122-
146
(2)
122-
146
(2)
122 (1) 122
(1)
156
(1)
90-99
(2)
- 122-146
(2)
110- 185
(4)
116-
122
(2)
122 (1)
M11e03 CAC ATT TTC CAC TGG ATG ACC TGG (for) CCT CTT CCT CCT CAT CAT CAC (rev)
55 182-203 (2)
182-203 (3)
203-215 (2)
190-203 (2)
203 (1) 203(1) 182 (1)
182-203 (2)
- 191-203 (2)
203 (1)
AFLP 203 (1)
M11h03 CAC TGT TGA ACC CTG ACC TGG TAG (for) ACC AGG TGA GCC AGC ATA GTC (rev)
50 100-103 (2)
88-109 (3)
NS 97 (1) 97 (1) 100 (1)
100-106 (2)
94-103 (3)
100-103 (2)
100-103 (2)
79-100 (3) 97-103 (3)
97-100 (2)
M14a11a CAC CCT CTG GAG GTA ACC TTG GTC (for) TCC ATG TTC ATG TTC GTG GTC (rev)
55 177 - 180-185 (2)
- - - 158 (1)
- - - - - -
M11h07 CTT GCT TCT TCT TCA TCT TCT TTA (for) AGT TCT CTT GGT CCT TTC TTA (rev)
55 220-226 (2)
211-220 (2)
186-229 (4)
196-226 (4)
- 214 (1)
- - 200(1) 229(1) 223 (1) AFLP-like
220 (1)
M11e11 AGA AAA GGA GAA GAA TGA AAA TAA (for) TTT TAT CAT TCT ATC TTC CAT (rev)
55 180 183 (2)
180 195 (3)
180 198 (3)
180 206 (3)
- 180 (1)
180 (1)
180-199 (2)
204-211 (2)
175 (1) 204 (1) 264-292 (2)
-
M11g06 GT TTT GTT GCA CGC AAA TGT CAC (for) CAG TGA TAA CAG TAC AAG AGG (rev)
55 111-113(2)
111 (1) 95-101 (3)
111-113 (2)
95 (1) 111 (1)
- - 101-111 (2)
111 (1)
- 103 (1)
-
M11b05 GT GGG TCT GTT TTA AGA AGA TAA AG (for) TAG ATT AAT GCC TTT AAA TGT AC (rev)
50 105 (1)
105 (1) 105 (1)
105 (1)
87 (1) - - 105 (1)
105 (1)
- - - -
M11d04 ACC TTT GAA TAG CGA TGA CGA TGA GC (for) GTT CTT CAT ACC CTT AAA GAT CG (rev)
50 103 (1)
103-106 (2)
120 (1)
103-109 (3) 371
159 (1) 100-115 (5)
103-106 (2)
-103 (1)
-103-112 (2)
-100-115(2)
103(1) - 115(1)
M11d04_372
ACC 369-372
372 (1) - 372 - 344 (1)
- - - - 318 (1) 301 (1)
363 (1)
(2) M20a03 GAA TCA CGG GAA GTT TAC AAG TTG AAA
G (for) GAA AAG GGA ATG GAA GAT GAA AGA G (rev)
55 195-249 (4)
195-219 (4)
230-239 (4)
228-243 (3)
- 195- 216 (3)
195-210 (2)
195-210 (2)
195-210 (2)
195-210 (2)
195-210 (2)
165-219 (3)
165-225 (6)
bp, base pairs
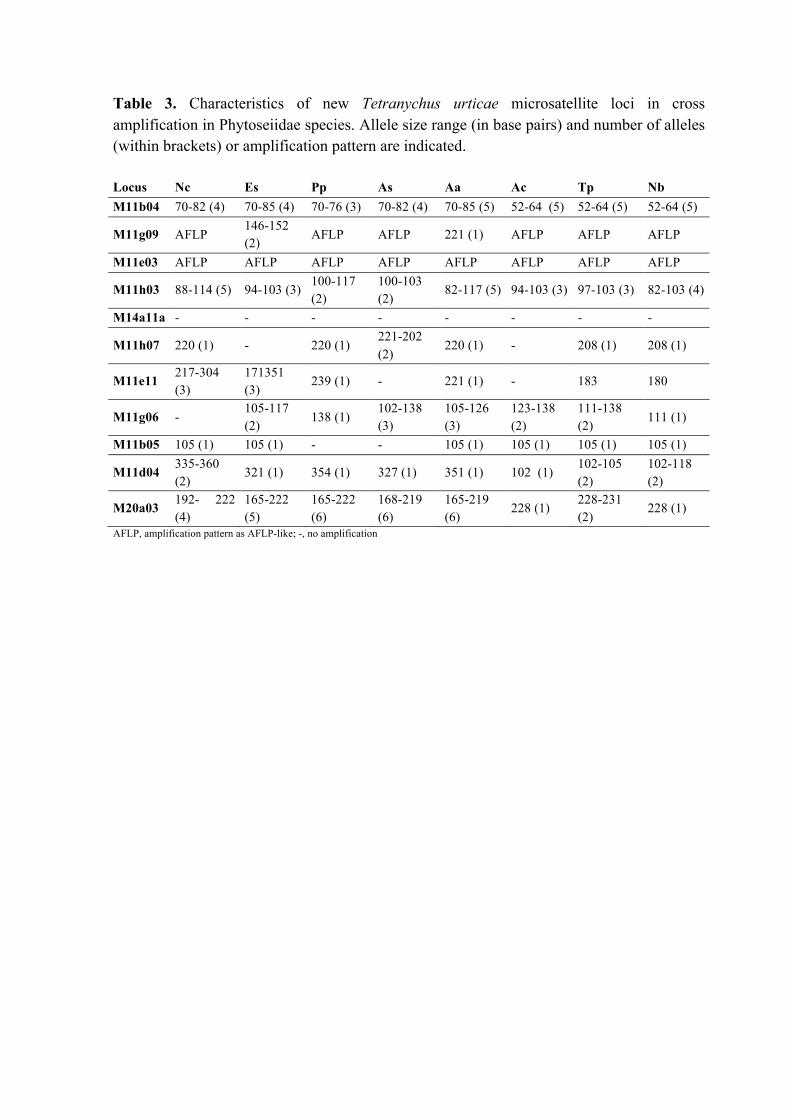
Table 3. Characteristics of new Tetranychus urticae microsatellite loci in cross amplification in Phytoseiidae species. Allele size range (in base pairs) and number of alleles (within brackets) or amplification pattern are indicated. Locus Nc Es Pp As Aa Ac Tp Nb M11b04 70-82 (4) 70-85 (4) 70-76 (3) 70-82 (4) 70-85 (5) 52-64 (5) 52-64 (5) 52-64 (5)
M11g09 AFLP 146-152 (2)
AFLP AFLP 221 (1) AFLP AFLP AFLP
M11e03 AFLP AFLP AFLP AFLP AFLP AFLP AFLP AFLP
M11h03 88-114 (5) 94-103 (3) 100-117 (2)
100-103 (2)
82-117 (5) 94-103 (3) 97-103 (3) 82-103 (4)
M14a11a - - - - - - - -
M11h07 220 (1) - 220 (1) 221-202 (2)
220 (1) - 208 (1) 208 (1)
M11e11 217-304 (3)
171351 (3)
239 (1) - 221 (1) - 183 180
M11g06 - 105-117 (2)
138 (1) 102-138 (3)
105-126 (3)
123-138 (2)
111-138 (2)
111 (1)
M11b05 105 (1) 105 (1) - - 105 (1) 105 (1) 105 (1) 105 (1)
M11d04 335-360 (2)
321 (1) 354 (1) 327 (1) 351 (1) 102 (1) 102-105 (2)
102-118 (2)
M20a03 192- 222 (4)
165-222 (5)
165-222 (6)
168-219 (6)
165-219 (6)
228 (1) 228-231 (2)
228 (1)
AFLP, amplification pattern as AFLP-like; -, no amplification
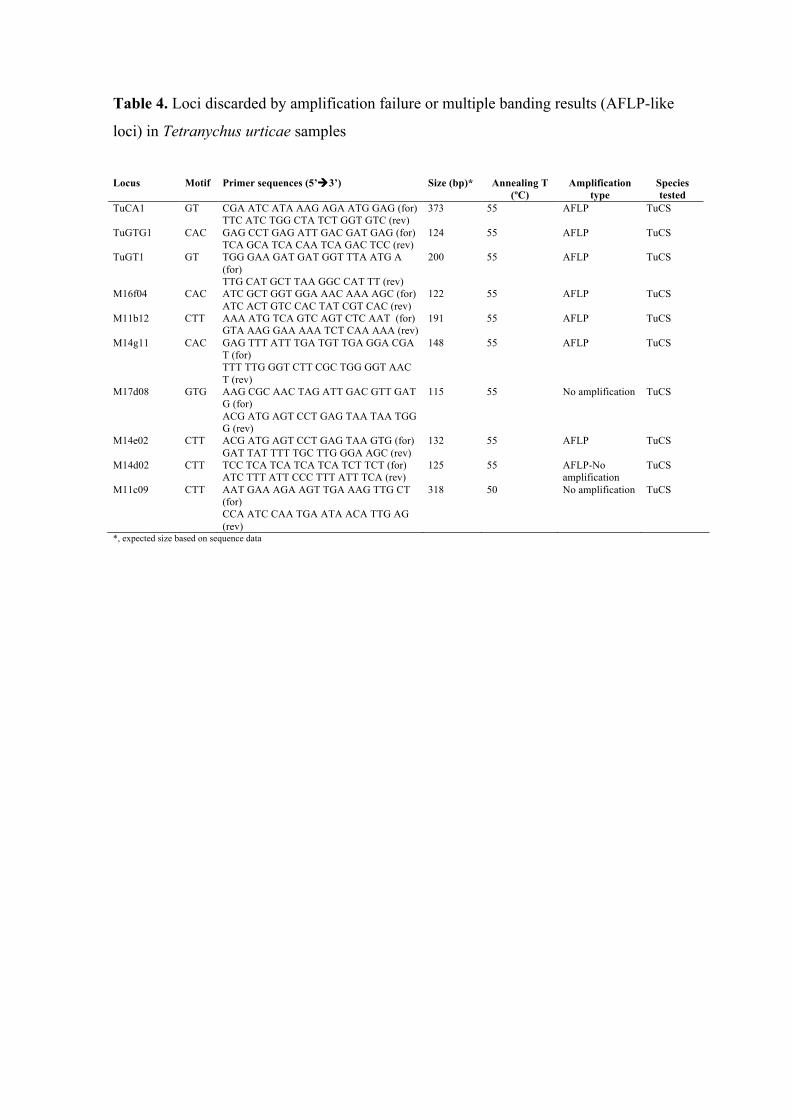
Table 4. Loci discarded by amplification failure or multiple banding results (AFLP-like
loci) in Tetranychus urticae samples
Locus Motif Primer sequences (5’à3’) Size (bp)* Annealing T
(ºC) Amplification
type Species tested
TuCA1 GT CGA ATC ATA AAG AGA ATG GAG (for) TTC ATC TGG CTA TCT GGT GTC (rev)
373 55 AFLP TuCS
TuGTG1 CAC GAG CCT GAG ATT GAC GAT GAG (for) TCA GCA TCA CAA TCA GAC TCC (rev)
124 55 AFLP TuCS
TuGT1 GT TGG GAA GAT GAT GGT TTA ATG A (for) TTG CAT GCT TAA GGC CAT TT (rev)
200 55 AFLP TuCS
M16f04 CAC ATC GCT GGT GGA AAC AAA AGC (for) ATC ACT GTC CAC TAT CGT CAC (rev)
122 55 AFLP TuCS
M11b12 CTT AAA ATG TCA GTC AGT CTC AAT (for) GTA AAG GAA AAA TCT CAA AAA (rev)
191 55 AFLP TuCS
M14g11 CAC GAG TTT ATT TGA TGT TGA GGA CGA T (for) TTT TTG GGT CTT CGC TGG GGT AAC T (rev)
148 55 AFLP TuCS
M17d08 GTG AAG CGC AAC TAG ATT GAC GTT GAT G (for) ACG ATG AGT CCT GAG TAA TAA TGG G (rev)
115 55 No amplification TuCS
M14e02 CTT ACG ATG AGT CCT GAG TAA GTG (for) GAT TAT TTT TGC TTG GGA AGC (rev)
132 55 AFLP TuCS
M14d02 CTT TCC TCA TCA TCA TCA TCT TCT (for) ATC TTT ATT CCC TTT ATT TCA (rev)
125 55 AFLP-No amplification
TuCS
M11c09 CTT AAT GAA AGA AGT TGA AAG TTG CT (for) CCA ATC CAA TGA ATA ACA TTG AG (rev)
318 50 No amplification TuCS
*, expected size based on sequence data
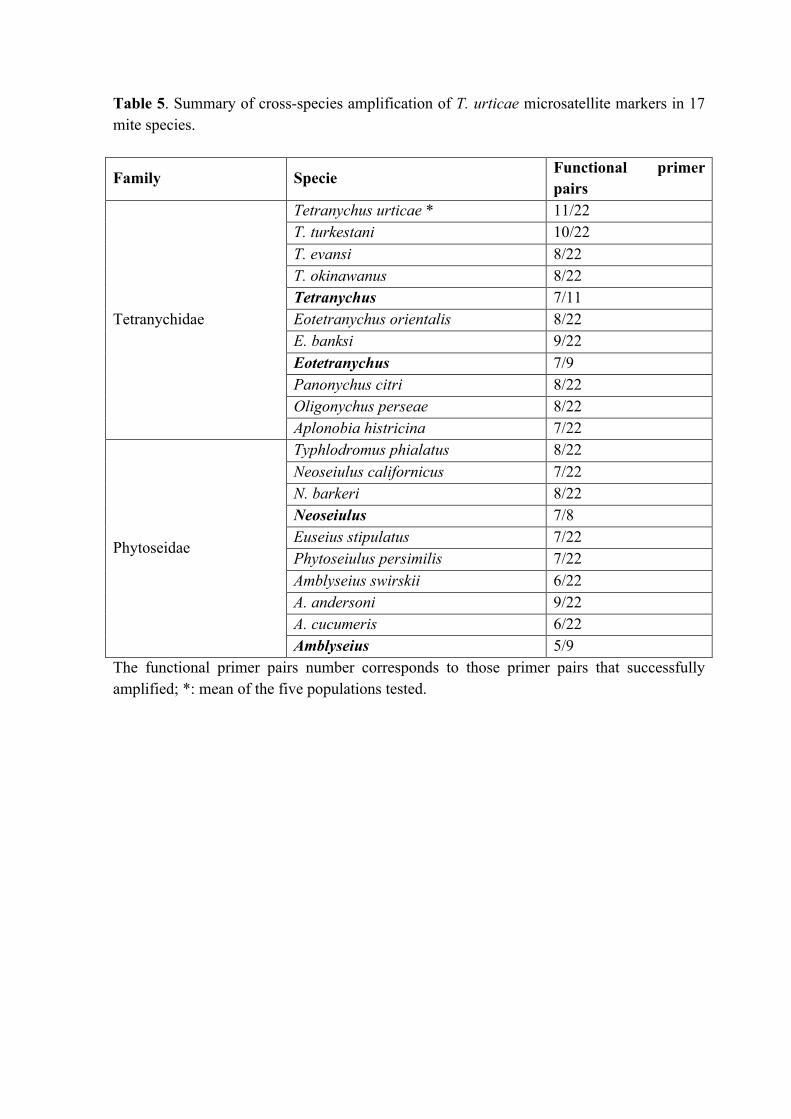
Table 5. Summary of cross-species amplification of T. urticae microsatellite markers in 17 mite species.
Family Specie Functional primer pairs
Tetranychidae
Tetranychus urticae * 11/22 T. turkestani 10/22 T. evansi 8/22 T. okinawanus 8/22 Tetranychus 7/11 Eotetranychus orientalis 8/22 E. banksi 9/22 Eotetranychus 7/9 Panonychus citri 8/22 Oligonychus perseae 8/22 Aplonobia histricina 7/22
Phytoseidae
Typhlodromus phialatus 8/22 Neoseiulus californicus 7/22 N. barkeri 8/22 Neoseiulus 7/8 Euseius stipulatus 7/22 Phytoseiulus persimilis 7/22 Amblyseius swirskii 6/22 A. andersoni 9/22 A. cucumeris 6/22 Amblyseius 5/9
The functional primer pairs number corresponds to those primer pairs that successfully amplified; *: mean of the five populations tested.