Embed Size (px)
Citation preview

1
Trace ions rejection tunning in NF by selecting solution composition: ion permeances 1 estimation 2
3
Neus Pagèsa, Mònica Reiga, Oriol Giberta,b, José Luis Cortinaa,b,* 4
aChemical Engineering Department, Universitat Politècnica de Catalunya UPC-BarcelonaTECH 5
Av. Diagonal 647, E-08028 Barcelona, Spain 6
bWater Technology Center CETaqua 7
Carretera d’Esplugues 75, E-08940 Cornellà de Llobregat, Spain 8
10
Abstract 11
Nanofiltration (NF) is suggested to selectively remove ionic species in aqueous 12
process streams taking benefit of both membrane and aqueous solution 13
composition. The importance of predicting and optimizing selective ion 14
rejections by NF not only of major compounds (e.g. NaCl, Na2SO4, MgCl2, 15
MgSO4) but also of minor ones such as ammonium (NH4+), nitrate (NO3
-), 16
bromide (Br-), iodide (I-) typically present in natural and industrial process 17
streams is crucial. The current work explores ion rejection patterns and 18
membrane ion permeances using the phenomenological Solution-Electro-19
Diffusion-Film (SEDF) model. It makes possible rapid calculations that account 20
for the effects of spontaneously arising electric fields on rejections. Experimental 21
ion rejection data of several inorganic ions species at various transmembrane 22
pressures and at fixed cross-flow velocity have been obtained with NF270 23
membrane. A number of trace ions (Na+, K+, Cl-, Ca2+, Mg2+, SO42-, NO3
-, NH4+, 24
Br- and I-) have been used in combination with various dominant salts (NaCl, 25
MgCl2, MgSO4) as model feed solutions. Results showed that dominant salts 26
were moderately (NaCl) and highly (MgCl2, MgSO4) rejected when some ions 27
are divalent, while trace ions exhibited quite variable rejection, including 28
negative ones mainly at low transmembrane volume flows. The electric field of 29
membrane potential can accelerate or retard the ion flows to the permeate, so 30
negative or unexpectedly high rejections could be observed. Ions transport was 31
shown to be affected by the membrane chemistry (e.g. acid-base properties of 32
the un-crosslinked carboxylic and amine groups) and the dielectric exclusion 33
phenomena. From the modelling procedure, ionic membrane permeances were 34
determined for various multi-ion systems studied. Results showed that nature of 35
dominant salt composition can be used to control the rejection of minor 36
components. 37
38
Keywords 39

2
Nanofiltration; cross-flow filtration; electrolytes mixture; ion rejections; solution-1
electro-diffusion-film model; ion membrane permeance. 2
3
4
5
1. INTRODUCTION 6
7
Nanofiltration (NF) is a new technological solution for the removal of both major and minor organic 8
and inorganic compounds from aqueous solutions [1–3]. In comparison with reverse osmosis 9
(RO), NF needs less pressure to provide the same volume flow (but usually with lower quality) 10
and offers higher ion selectivities. Typically, NF are thin-film composites -made from various 11
polymers such as (aromatic) polyamides, polysulfone/poly(ether sulfone)/sulfonated polysulfone, 12
polyimide and poly(piperazine amide) [4]. Like RO, NF membranes contain functional groups (not 13
fully cross-linked carboxylic and amine groups), resulting from the synthesis, that can be charged, 14
depending on the pH of the solution in contact with the membrane. At neutral pH, NF membranes 15
are usually slightly negatively charged (e.g. due to deprotonation of the carboxylic groups) as their 16
isoelectric points are around pH 3–4.5 [5–10]. However, determining the chemical membrane 17
composition, in terms of free functional groups, is still an important challenge especially in view of 18
explaining the different ion rejections occurring with various kinds of NF membranes [7,11–13]. 19
Multi-ionic solutions occur in virtually all practical applications of membrane processes, and the 20
solution composition, in terms of chemical nature of the ions, especially in terms of charge (sign 21
and magnitude) and the relative molar compositions, has been demonstrated to play a critical 22
role. Rejection of a given ion depends not only on ion properties, but also on the solution 23
environment (other ions present). As an example, recently, Umpuch et al. [14], investigated how 24
the addition of strong electrolytes (e.g. NaCl or Na2SO4) affected the selectivity of the sodium 25
lactate/glucose separation by NF. The addition of Na2SO4 (0.25 M) compared to NaCl (0.25 M) 26
provided a maximum separation factor of 1.9 for sodium glucose (0.1 M)/sodium lactate (0.1 M) 27
solutions whereas the separation with NaCl (0.25 M) provided separation factors up to 1.5 and the 28
separation was impossible without the addition of salt. 29
Modelling of ion rejection in NF is very useful for the optimization and scale-up of water treatment 30
processes, and enormous effort on this field has been expended in the last decades. Ion transport 31
through NF membranes has been widely described by either the non-equilibrium thermodynamic 32
model and its modifications [15–18] or the extended Nernst–Planck equations [19–22]. 33
Among the former, the Spiegler–Kedem (SK) model [15] considered the solute transport as a 34
superposition of (partially uncoupled) convective and diffusive solute flows. In order to include the 35
interactions of solute-solvent, solute-membrane and solvent-membrane, the SK equation was 36
accordingly modified taking into account the influence of membrane structural parameters [23,24] 37
when electrolytes mixtures were employed and the concentration dependence [25] of the 38

3
phenomenological transport coefficients using single NaCl and NaBr salts. Then, the number of 1
fitting parameters had to be increased up to six [26]. It was shown how the permeance 2
coefficients to water and solutes can be derived from experimental data and how to choose 3
suitable electroneutrality conditions to obtain the membrane permeances. 4
Simultaneously, considering up to three ion exclusion mechanisms, i.e. steric, electric (Donnan 5
equilibrium) [27–29] and dielectric - [30–33] exclusion mechanisms and the description of the 6
solute transport in the membrane phase by the extended Nernst-Planck (NP) equation, several 7
parameters of the membrane (such as pore size, fixed charge and dielectric properties) and the 8
ion involved were determined. In addition, several extensions of the NP equations included 9
macroscopic hydrodynamic and electrostatic equations to describe the equilibrium, partitioning 10
and transport of the ions through a nano-porous membrane phase. The use of these complex 11
equations required a large number of fitting parameters that makes difficult the solution of the 12
inverse problem of unambiguous determination of these from experimental data. 13
An alternative approach is the use of solution-diffusion (SD) model, widely applied originally in RO 14
[34–38]. Unlike the established extended NP or Donnan-Steric-Pore-Dielectric model, the SD 15
model can explain the high SO42-/Cl- selectivity in NF and is in agreement with the weak 16
convective coupling between the solute and solvent transfers in the membrane phase 17
[18,24,39,40]. Yaroshchuk et al. [39] demonstrated that for single salts, the same simple version 18
of SD model coupled with the film model theory, the solution-diffusion-film model (SDF) is 19
applicable. However, for electrolyte mixtures the SDF model had to be extended in order to 20
include the coupling between the electro-diffusion fluxes of various ions via the electric field of 21
membrane potential [41–43]. Taking it into account, a good description of ion rejection 22
dependence on the transmembrane volume flow for a number of electrolyte mixtures could be 23
achieved [41,42]. This approach also accounts for the existence of a concentration-polarization 24
layer where the ion transfer occurs via electro-diffusion as well as via convection due to the 25
solvent transfer. This new description of transmembrane mass transfer by the so-called Solution-26
Electro-Diffusion-Film (SEDF) model allows for the development of efficient procedures of 27
determination of membrane permeances towards not only salts but also single ions from 28
experimental data. 29
The main objective of this work was to extend the validation of the SEDF model via comparing 30
experimental and theoretical data on the rejection of several dominant salts and trace ions using 31
the NF270 membrane in a cross-flow experimental set-up. Synthetic aqueous solutions 32
representative of natural waters influenced by industrial and mining drainage (Na+, K+, Mg2+, Cl-, 33
Br-, I-) and industrial wastewaters (NH4+, NO3
-, SO42-) were used. Three representative dominant 34
electrolyte types were used ((NaCl (+1:-1), MgCl2(+2,-1), MgSO4(+2,-2)). The membrane 35
permeances with respect to several ions (Na+, K+, Cl-, Ca2+, Mg2+, SO42-, NO3
-, NH4+, I- and Br-) 36
was calculated. 37
38

4
2. MATERIALS AND METHODS 1
2
2.1. Membrane cross-flow set-up 3
Experiments were performed with a NF270 membrane in a cross-flow set-up equipped with a test 4
cell (GE SEPATM CF II) with a spacer-filled feed channel and the possibility of independent 5
variation of cross-flow velocity (cfv) and transmembrane pressure (TMP) [42,44]. The membrane 6
area was 0.014 m2. Feed solutions were kept at constant temperature (23 ± 2ºC) in a 7
thermostated feed tank (30 L) and pumped into the cross-flow filtration system with a high-8
pressure diaphragm pump (Hydra-Cell, USA) at a prefixed flow rate and pressure. The two output 9
streams from the test cell, permeate and concentrate, were recirculated into the feed tank 10
providing thus a fairly constant concentration in the feed solution. The cfv was fixed and the TMP 11
was varied by a needle valve located in the concentrate stream just at the exit from the test cell. 12
The system was equipped with flow-meters, pressure-meters, a conductivity cell, a pH-meter and 13
a temperature sensor to monitor the hydrodynamic and chemical parameters. Furthermore, a data 14
acquisition system programmed in Labview was developed to ensure the robustness of the 15
system and obtain reproducible data. Sensor calibration was performed under the hydrodynamic 16
conditions used in the experimental work. 17
18
2.2. Ion rejection experimental tests of multi-ion electrolyte solutions 19
Several multi-ion aqueous solutions consisting of a dominant single salt (NaCl, MgCl2 or MgSO4) 20
mixed with trace ions such as Na+, Cl-, Ca2+, Mg2+, SO42-, K+, NO3
-, NH4+, I- and Br- were used as 21
feed solutions. Common scenarios of low-quality surface waters influenced by industrial and 22
mining drainage containing KCl, MgCl2, KI, NaBr, etc and industrial wastewater containing NH4+, 23
NO3-, SO4
2- [45,46] were reproduced by these selected model systems. Before performing any 24
rejection experiments, membranes were wetted overnight in distilled water to wash-out potential 25
storage products. Then, they were compacted with distilled water for one hour and with the 26
working solution over one hour and a half at the maximum working cfv and TMP to ensure 27
constant transmembrane flux in all the experiments at the same pressure requirements. The 28
experimental tests were carried out at a fixed cfv of 0.7 m s-1 and the TMP was varied between 29
osmotic pressure of feed solution (4.5-7 bar) and 20 bar. Concentrations of dominant salts in feed 30
solutions were maintained at 10-1 mol L-1 while concentrations of trace ions were at about 0.5-2% 31
of dominant salt concentrations. All reagents were of analysis quality (PA-ACS-ISO reagent, 32
PANREAC). The conditions of rejection experiments performed with multi-ion solutions are 33
summarized in Table 1. 34
35
Table 1. Experimental conditions for the filtration of multi-ion solutions of Na+, Cl-, K+, Ca2+, Mg2+, 36
SO42-, NO3
-, NH4+, I- and Br- by the NF270 membrane. 37

5
Dominant
salts
Trace
salt
Feed concentration Cross-flow
rate
Trans-
membrane
pressure
Dominant
salt Trace salt
(mol L-1) (mol L-1) (m s-1) (bar)
NaCl MgSO4 10-1 2·10-3 0.7 4.5 - 20
NaCl MgCl2 10-1 2·10-3 0.7 4.5 - 20
NaCl CaCl2 10-1 2·10-3 0.7 4.5 - 20
NaCl KCl 10-1 2·10-3 0.7 4.5 - 20
NaCl NH4Cl 10-1 2·10-3 0.7 4.5 - 20
NaCl NaNO3 10-1 2·10-3 0.7 4.5 - 20
NaCl NaBr 10-1 2·10-3 0.7 4.5 - 20
NaCl NaI 10-1 2·10-3 0.7 4.5 - 20
MgCl2 KCl 10-1 5·10-4 0.7 7 - 20
MgCl2 NH4Cl 10-1 5·10-4 0.7 7 - 20
MgCl2 Na2SO4 10-1 5·10-4 0.7 7 - 20
MgCl2 NaNO3 10-1 5·10-4 0.7 7 - 20
MgCl2 NaBr 10-1 5·10-4 0.7 7 - 20
MgCl2 NaI 10-1 5·10-4 0.7 7 - 20
MgSO4 NaCl 10-1 5·10-4 0.7 4.5 - 20
MgSO4 NH4Cl 10-1 5·10-4 0.7 4.5 - 20
MgSO4 NaNO3 10-1 5·10-4 0.7 4.5 - 20
MgSO4 NaBr 10-1 5·10-4 0.7 4.5 - 20
MgSO4 NaI 10-1 5·10-4 0.7 4.5 - 20
1
2
The transmembrane volume flow was determined via monitoring collected permeate volume. 3
Ion concentrations in feed and permeate samples were measured by ion chromatography (Dionex 4
ICS-1000). The cation and anion analyses were performed by using the IONPAC® CS16 cation-5
exchange column, which uses 3·10-2 mol L-1 methane sulphonic acid eluent and the IONPAC® 6
AS23 anion-exchange column. A mixture of 4.5·10-3 mol L-1 Na2CO3 and 8·10-4 mol L-1 NaHCO3 7
was used as eluent in the latter case. The pH of the feed and permeate solutions were measured 8
with a pH electrode. Overall, in the experimental tests, pH ranged between 5.1 and 6.3. 9
10
2.3. Modelling of ion transfer across NF membranes in multi-ion solutions 11
In this study, the SEDF model was used to fit experimental data for both dominant and trace ions 12
[41]. The model equations, summarized in Table 2 relates the observable rejections of the 13
dominant salt (Rsobs) and the trace ions (Rt
obs) with the corresponding intrinsic ones (Rsint , Rt
int ) 14
taking into account the concentration polarization and using the unstirred-layer thickness (δ) as 15

6
one of the fitting parameters. [41,42], 1
In order to fit the dominant salt rejections as a function of transmembrane volume flow, two 2
parameters need to be obtained for the dominant salt (by using Eq 8): the membrane and the 3
concentration-polarization layer permeances to the dominant salt (Ps, Ps(δ)). The intrinsic rejection 4
of the dominant salt (Rsint) can then be calculated by Eq. (9) and, then, its reciprocal intrinsic 5
transmission (fs) and the corresponding membrane surface concentration (Cs(m)) can be 6
determined. Once the trace-ion concentrations at the membrane surface are calculated by using 7
Eq. (10), the intrinsic rejections (Rtint) and the corresponding reciprocal transmissions of the trace 8
ions (ft) can be obtained. Subsequently, in the case of trace ions different from the dominant ions, 9
two parameters, b and K are fitted to Eq 11 and 12. From them, the membrane permeances to 10
dominant and trace ions (P±, Ps(δ)) can be calculated with Eq. (13) and the parameter from Eq. 11
(11), respectively. 12
13
Table 2. Summary of mass transport equations of the Solution-Electro-Diffusion-Film (SEDF) 14
model [39,41,42] 15
(1)
(2)
(3)
(4)
(5)
(6)
(7)
Observable salt rejections
where , and (8)
Intrinsic salt rejections
(9)
Trace ion concentration at the membrane surface
7
where , , ,
(10)
Reciprocal transmission of trace ion
where , , and (11)
Membrane permeances to dominant ions (12)
(13)
1
2.5 NF270 properties 2
NF270 (Dow Chemical) membrane was used to perform the experimental tests. Its active layer is 3
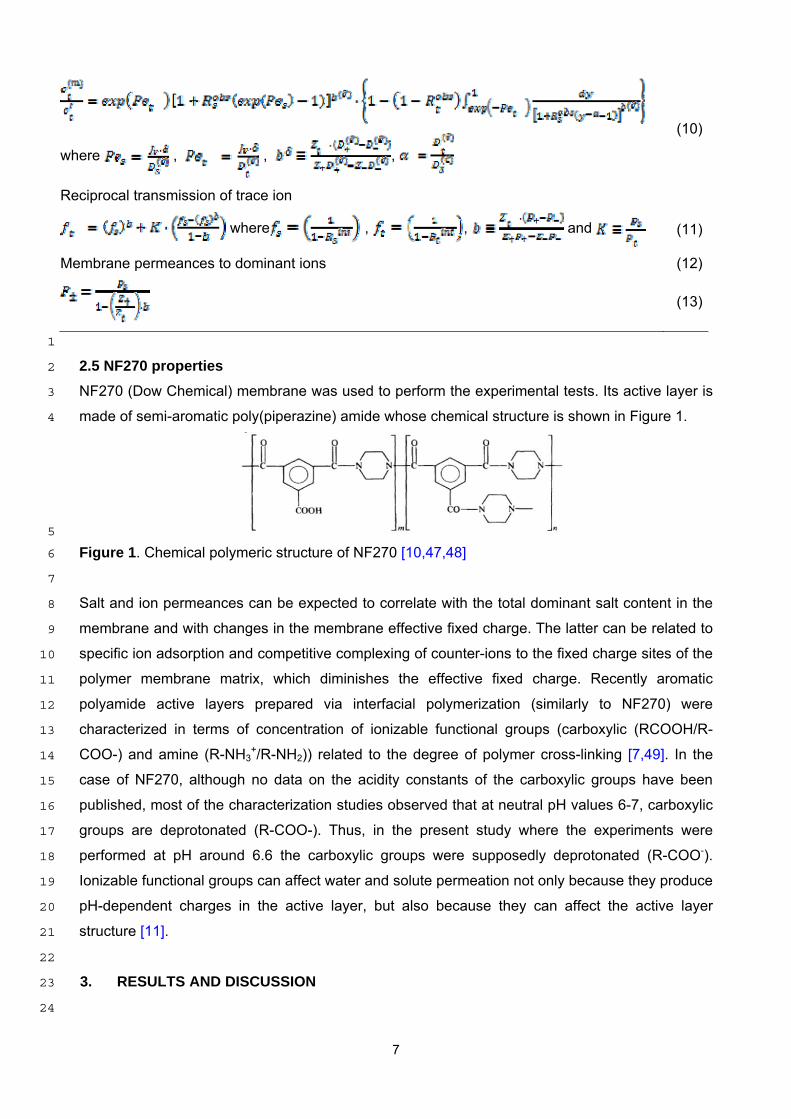
made of semi-aromatic poly(piperazine) amide whose chemical structure is shown in Figure 1. 4
5
Figure 1. Chemical polymeric structure of NF270 [10,47,48] 6
7
Salt and ion permeances can be expected to correlate with the total dominant salt content in the 8
membrane and with changes in the membrane effective fixed charge. The latter can be related to 9
specific ion adsorption and competitive complexing of counter-ions to the fixed charge sites of the 10
polymer membrane matrix, which diminishes the effective fixed charge. Recently aromatic 11
polyamide active layers prepared via interfacial polymerization (similarly to NF270) were 12
characterized in terms of concentration of ionizable functional groups (carboxylic (RCOOH/R-13
COO-) and amine (R-NH3+/R-NH2)) related to the degree of polymer cross-linking [7,49]. In the 14
case of NF270, although no data on the acidity constants of the carboxylic groups have been 15
published, most of the characterization studies observed that at neutral pH values 6-7, carboxylic 16
groups are deprotonated (R-COO-). Thus, in the present study where the experiments were 17
performed at pH around 6.6 the carboxylic groups were supposedly deprotonated (R-COO-). 18
Ionizable functional groups can affect water and solute permeation not only because they produce 19
pH-dependent charges in the active layer, but also because they can affect the active layer 20
structure [11]. 21
22
3. RESULTS AND DISCUSSION 23
24

8
3.1 NaCl as dominant salt 1
Figure 2 shows the observable rejection for the dominant salt (NaCl) in the presence of a trace 2
salt (referred to as NaCl_CA, where CA is the trace salt) (Fig 2a) and for the trace ions (referred 3
to as C+ (NaCl_CA) for the cations and A- (NaCl_CA) for the anions) (Fig 2b) as a function of 4
transmembrane volume flow. The symbols represent the experimental points and the lines were 5
derived by using the SEDF model equations (Table 2). Calculated membrane permeances to 6
dominant and trace ions are collected in Table 3. 7
8
9
Figure 2. Observable rejections for the dominant salt NaCl in the presence of trace ions (Fig 2a) 10
and for the trace ions (Mg2+, Ca2+, K+, NH4+, SO4
2-, NO3-, Br-, I-) accompanying the dominant salt 11
(Fig 2b) as a function of transmembrane volume flow. Lines were obtained by the SEDF model. 12
13
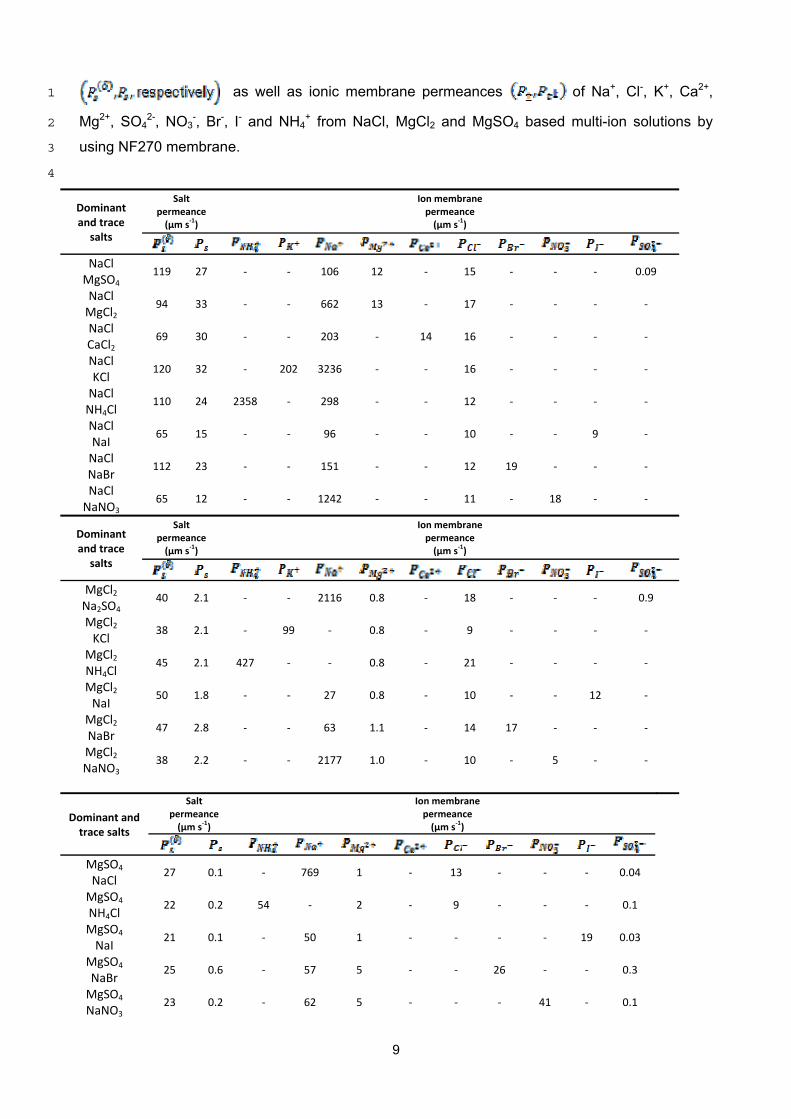
Table 3. Concentration-polarization layer and membrane permeances to the dominant salt 14
9
as well as ionic membrane permeances of Na+, Cl-, K+, Ca2+, 1
Mg2+, SO42-, NO3
-, Br-, I- and NH4+ from NaCl, MgCl2 and MgSO4 based multi-ion solutions by 2
using NF270 membrane. 3
4
Dominant and trace salts
Salt permeance (µm s
‐1)
Ion membrane permeance (µm s
‐1)
NaCl MgSO4
119 27 ‐ ‐ 106 12 ‐ 15 ‐ ‐ ‐ 0.09
NaCl MgCl2
94 33 ‐ ‐ 662 13 ‐ 17 ‐ ‐ ‐ ‐
NaCl CaCl2
69 30 ‐ ‐ 203 ‐ 14 16 ‐ ‐ ‐ ‐
NaCl KCl
120 32 ‐ 202 3236 ‐ ‐ 16 ‐ ‐ ‐ ‐
NaCl NH4Cl
110 24 2358 ‐ 298 ‐ ‐ 12 ‐ ‐ ‐ ‐
NaCl NaI
65 15 ‐ ‐ 96 ‐ ‐ 10 ‐ ‐ 9 ‐
NaCl NaBr
112 23 ‐ ‐ 151 ‐ ‐ 12 19 ‐ ‐ ‐
NaCl NaNO3
65 12 ‐ ‐ 1242 ‐ ‐ 11 ‐ 18 ‐ ‐
Dominant and trace salts
Salt permeance (µm s
‐1)
Ion membrane permeance (µm s
‐1)
MgCl2 Na2SO4
40 2.1 ‐ ‐ 2116 0.8 ‐ 18 ‐ ‐ ‐ 0.9
MgCl2 KCl
38 2.1 ‐ 99 ‐ 0.8 ‐ 9 ‐ ‐ ‐ ‐
MgCl2 NH4Cl
45 2.1 427 ‐ ‐ 0.8 ‐ 21 ‐ ‐ ‐ ‐
MgCl2 NaI
50 1.8 ‐ ‐ 27 0.8 ‐ 10 ‐ ‐ 12 ‐
MgCl2 NaBr
47 2.8 ‐ ‐ 63 1.1 ‐ 14 17 ‐ ‐ ‐
MgCl2 NaNO3
38 2.2 ‐ ‐ 2177 1.0 ‐ 10 ‐ 5 ‐ ‐
Dominant and trace salts
Salt permeance (µm s
‐1)
Ion membranepermeance (µm s
‐1)
MgSO4 NaCl
27 0.1 ‐ 769 1 ‐ 13 ‐ ‐ ‐ 0.04
MgSO4 NH4Cl
22 0.2 54 ‐ 2 ‐ 9 ‐ ‐ ‐ 0.1
MgSO4 NaI
21 0.1 ‐ 50 1 ‐ ‐ ‐ ‐ 19 0.03
MgSO4 NaBr
25 0.6 ‐ 57 5 ‐ ‐ 26 ‐ ‐ 0.3
MgSO4 NaNO3
23 0.2 ‐ 62 5 ‐ ‐ ‐ 41 ‐ 0.1

10
1
For NF270, the rejections of the dominant salt varied between 50-60% (Figure 2a). Trace ions 2
exhibited different selectivity patterns clearly depending on feed solution composition. It is a priori 3
uncertain which of the ions, cations (Cn+) or anions (An-), would be the faster. The electrostatic 4
potential gradient located between both sides of membrane, results in an electric field that 5
accelerates or slows down the ions across the membrane, and concentrates them on both feed 6
and permeate interfaces depending on their own ion charge. Double-charged trace ions (SO42-, 7
Mg2+, Ca2+), were mostly better rejected than the dominant salt (NaCl) itself and the single-8
charged trace ions (Figure 2b). Particularly, the double-charged anion SO42- was the best rejected 9
trace ion, exhibiting a percentage removal >98% over the whole range of transmembrane volume 10
flows tested, followed by the double-charged cations Mg2+ and Ca2+ (with rejection percentages of 11
80-85% and 75% at the highest flows tested, respectively). This finding is consistent with the fact 12
that the experiments were performed at pH around 6.6±0.2, whereby the carboxylic groups of the 13
polyamide membrane were assumed to be deprotonated (R-COO-) so the permeance to Cn+ was 14
expected to be significantly higher than that to An-. 15
With regards to single-charged trace ions, cations (K+ and NH4+) were better rejected than anions 16
(I-, Br-, NO3-) just in opposite way of double-charged trace ions (Figure 2b). Although, K+ and NH4
+ 17
rejections showed both a very similar pattern increased up to 60%, anions were rejected up to 18
50% (for I-), 45% (Br-) and 20% (NO3-) at largest transmembrane volume flows. Besides that, 19
negative rejections of NO3- (-5%) were observed at smallest transmembrane volume flow (Figure 20
2b). Indeed, NO3- was more quickly transported to the permeate than Cl- as their ion membrane 21
permeances values shows (Table 4). 22
23
3.2 MgCl2 as the dominant salt 24
The observable rejection of the dominant salt MgCl2 and the trace ions over the transmembrane 25
volume flows are shown in Figure 3a and Figure 3b respectively, and following the notation 26
described above in section 3.1. Experimental data are represented with symbols whereas their 27
modelling by the SEDF model is shown by lines. The calculated membrane permeances towards 28
the dominants salt and the trace ions by the SEDF model are presented also in Table 3. 29
11
1
2
3
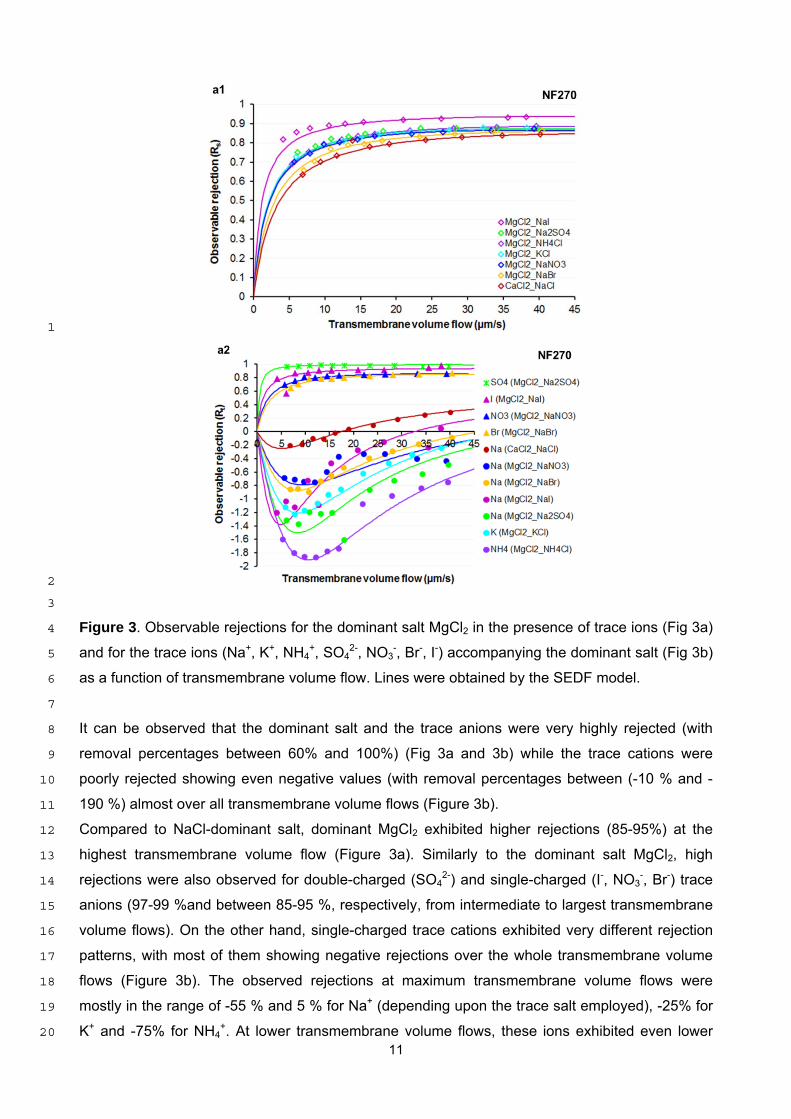
Figure 3. Observable rejections for the dominant salt MgCl2 in the presence of trace ions (Fig 3a) 4
and for the trace ions (Na+, K+, NH4+, SO4
2-, NO3-, Br-, I-) accompanying the dominant salt (Fig 3b) 5
as a function of transmembrane volume flow. Lines were obtained by the SEDF model. 6
7
It can be observed that the dominant salt and the trace anions were very highly rejected (with 8
removal percentages between 60% and 100%) (Fig 3a and 3b) while the trace cations were 9
poorly rejected showing even negative values (with removal percentages between (-10 % and -10
190 %) almost over all transmembrane volume flows (Figure 3b). 11
Compared to NaCl-dominant salt, dominant MgCl2 exhibited higher rejections (85-95%) at the 12
highest transmembrane volume flow (Figure 3a). Similarly to the dominant salt MgCl2, high 13
rejections were also observed for double-charged (SO42-) and single-charged (I-, NO3
-, Br-) trace 14
anions (97-99 %and between 85-95 %, respectively, from intermediate to largest transmembrane 15
volume flows). On the other hand, single-charged trace cations exhibited very different rejection 16
patterns, with most of them showing negative rejections over the whole transmembrane volume 17
flows (Figure 3b). The observed rejections at maximum transmembrane volume flows were 18
mostly in the range of -55 % and 5 % for Na+ (depending upon the trace salt employed), -25% for 19
K+ and -75% for NH4+. At lower transmembrane volume flows, these ions exhibited even lower 20

12
(i.e. more negative) rejection values, with minima at -20% for Na+ at a transmembrane volume 1
flow of 7 µm/s or -190% for NH4+ at a transmembrane volume flow of 12 µm/s). Although, the 2
highest negative rejections of K+ and NH4+ being -125% and -190% respectively and Na+ with 3
SO42- as a counter-ion -150%.+. 4
To sum up, the negative rejection (i.e. permeance through the NF270 membrane) of the positive 5
single-charged trace ions appeared to follow the sequence (in decreasing order) : NH4+ > 6
Na+(Na2SO4) > Na+(NaI) ~ K+(KCl) > Na+(NaBr) ~ Na+(NaNO3) inversely in accordance with the 7
positive rejection sequence of their electrolyte counter-ions which was SO42- > I- > Br- ~ NO3
- 8
(Figure 3b). This finding confirmed that both positive and negative trace ions rejections were 9
strongly controlled by the same magnitude of the electric field that spontaneously arose 10
depending on all involved ions in each experimental test. 11
Results showed that a NF membrane containing negative charged functional groups (carboxylic 12
groups) at the working solution pH, the substitution of the dominant salt from NaCl to MgCl2 13
promotes the possibility to remove from the treated solutions all the mono-charged trace cations 14
(Na+, K+, NH4+) present in solution (rejections below 0% along the pressure range evaluated). 15
16
3.3 MgSO4 as dominant salt 17
Figure 4 shows the observable rejection for the dominant salt MgSO4 in presence of different 18
trace salts (CA) (Fig 4a) and for trace ions (Fig 4b) as a function of the transmembrane volume 19
flow and following the notation described above in section 3.1. The symbols represent the 20
experimental points and the lines were derived by the SEDF model. The calculated membrane 21
permeances to dominant and trace ions are collected in Table 4. 22
23

13
1
2
Figure 4. Observable rejections for the dominant salt MgSO4 in the presence of trace ions (Fig 3
4a) and for the trace ions (Na+, NH4+, Cl-, NO3
-, Br-, I-) accompanying the dominant salt (Fig 4b) as 4
a function of transmembrane volume flow. Lines were obtained by the SEDF model. 5
6
When MgSO4 dominant-based solutions were treated by NF270 membrane, both the dominant 7
MgSO4 (Figure 4a) and the single-charged trace cations (Na+ and NH4+) (Figure 4b) were fairly 8
well-rejected over all transmembrane volume flows (with rejection ranges of 85-99 % and 70-90 9
%, respectively). The rejection of Na+ and NH4+ trace ions seemed little influenced by their 10
counter-ions, showing a subtle rejection sequence depending on their counter-anions as follows: 11
Na+(NaI) > Na+(NaCl) > Na+(NaNO3) > NH4+(NH4Cl) > Na+(NaBr) being in accordance with the 12
dominant salt rejection sequence obtained MgSO4(NaI)≈ MgSO4(NaCl) > MgSO4(NaNO3) ≈ 13
MgSO4(NH4Cl) > MgSO4(NaBr), that was also dependent on the anions from the trace salts. 14
On the other hand, the single-charged trace anions were poorly rejected showing a wide range on 15
their rejections [-170 to 40 %] including negative values over all transmembrane volume flows 16
(Figure 4b). At the highest transmembrane volume flow, Cl- was the most rejected regardless the 17
form in which it was added (40% and 30% when it was added as NH4Cl and NaCl, respectively), 18
followed by Br- and I- (with rejection values lower than 10%) and finally NO3-, which was 19
negatively rejected over all transmembrane volume flows. At low transmembrane volume flow, the 20
highest negative rejections of the single-charged anion patterns were determined as the retention 21
sequence follows: Cl- (-50% (NH4Cl)) < Br- (-65%) < Cl- (-84% (NaCl)) < I- (-135%) < NO3- (-22
168%). This sequence was similarly to that achieved at highest transmembrane volume flows. 23
As described by Umpuch et al. [14] the separation factor of mixtures of lactate /glucose was 24
achieved by addition of strong electrolytes (Na2SO4 or NaCl) taking benefit of both the power of 25
the dielectric exclusion and the nature of the dominant ions. Then, for example trace cations 26
(organic or inorganic) could be removed from an aqueous solution with a membrane having 27
negatively charged functional groups at the pH of the treated solution by using for example a (+2/-28
1) type electrolyte (e.g. MgCl2, CaCl2 or BaCl2) promoting the permeation of all cations as the 29

14
dominant cation (Mg, Ca or Ba) would be highly rejected. Figure 3, shows that the use of a 0.1 M 1
MgCl2 solution provides a 100% removal of Na+ /K +/NH4+ ions. If the desired objective is to 2
remove anions, a (+2/-2) type electrolyte (e.g. MgSO4) could be used. In Figure 2, permeation 3
values for halides and NO3- were below 10%, and separation factors close to 1.5 would be 4
achieved 5
6
7
3.4 Membrane permeances to dominant salt and trace ions: dependence on electrolyte 8
type 9
The difference in the rejections of the dominant and the trace ions lies on the membrane 10
permeances towards them, which have been calculated by means of the SEDF model as 11
summarized in Table 2. Salt membrane permeances decreased from the highest value 20-30 12
µm/s measured for NaCl (an electrolyte with two mono-charged species (1:1,Na+/Cl-)) to 1.8-2.8 13
µm/s for MgCl2 (an electrolyte with one two mono-charged and two double-charged species 14
(2:1,Mg+2/Cl-)) and down to 0.1-0.6 µm/s for MgSO4 (an electrolyte with two double mono-charged 15
species (1:1,Mg2+, SO42-)). 16
Among the different mechanisms used for describing ion rejections by NF membranes, the 17
dielectric exclusion mechanism explains the permeance values measured in this study. 18
Yaroshchuk et al. [50] postulated dielectric exclusion as one of separation mechanisms of NF. 19
Dielectric exclusion is caused by the interactions of ions with the bound electric charges induced 20
by ions at interfaces between media of different dielectric constants (e.g. carboxylic and amine 21
groups of NF270). The dielectric exclusion from the polymer network pores of the membranes 22
with closed geometry is shown to be essentially stronger than that from free volume with relatively 23
open geometry. Originally it was common to believe that their main rejection mechanism was the 24
Donnan exclusion caused by a fixed electric charge. That conclusion was based, in fact, on the 25
only observation that double-charge anions were rejected essentially better than single-charge 26
ones. However, that is characteristic of dielectric exclusion too. According to Kim et al. [49] thin 27
film polyamide layers of RO and NF membranes have a bimodal distribution with sizes (e.g 2.1-28
2.4 Å and 3.5-4.5 Å for FT30 RO membrane), which is just the range where the dielectric 29
exclusion can be strong. In principle, that mechanism is more universal than the Donnan 30
exclusion because a membrane may have or may not have a fixed charge (e.g. NF270 as a 31
function of the pH), however, the existence of a low dielectric constant matrix is beyond any 32
doubt. 33
34
Thus, due to the dielectric exclusion membranes protect themselves from the intrusion of ions 35
which gives rise to the screening of dielectric exclusion itself. Both mechanisms, the dielectric and 36
Donnan exclusions, cause a rejection of ions. However, they are far from being simply additive, 37
and the interaction between them is non-trivial. Indeed, it has been shown that a fixed charge 38

15
makes the screening of interactions with polarization charges stronger thus making the dielectric 1
exclusion weaker [50,51]. At the same time the dielectric exclusion is equivalent to a decrease in 2
the bulk electrolyte concentration. The latter is known to cause an increase in the Donnan 3
exclusion. Thus, the dielectric exclusion makes the Donnan exclusion stronger, whereas the 4
presence of fixed charge makes the dielectric exclusion weaker. That can be illustrated by the 5
effect of dielectric exclusion on the relationship between fixed charge density and Donnan 6
potential. It essentially depends on the pore geometry parameter and the type of electrolyte 7
according to the ions valance. 8
For instance, for 1:1 (e.g. NaCl) electrolytes dielectric exclusion is lower than for electrolytes with 9
double-charge counter-ions 2:1 (e.g. MgCl2), which in turn is lower than for electrolytes containing 10
double-charge ions (2:2) (MgSO4). Therefore in the case of electrolytes with double-charge 11
counter-ions such as MgSO4 a fixed charge of considerable magnitude is likely to cause a 12
decrease in reflection coefficient. At the same time a fixed charge of moderate magnitude may be 13
beneficial for membrane performance. This behavior has been extended to other electrolytes data 14
for NF270 reported in the literature and the same trend is reported, as it is the case of CaCl2 and 15
Na2SO4 with permeance values of 4.8-5 µm/s, and 0.1-0.2 µm/s, respectively [42,52]. 16
A second phenomenon related to the presence of charges on the membrane structure should be 17
stressed. As discussed above, the isoelectric point at the solution pH, the free carboxylic groups 18
are ionized. Then, for a given electrolyte, the negative ion (e.g. Cl- in NaCl and MgCl2 and SO4-2 in 19
MgSO4), will suffer from electrical repulsion, and then rejected in a stronger way than the 20
positively charged ion (e.g. Na+ in NaCl or Mg+2 in MgCl2 and MgSO4). This is in agreement with 21
the measured ion permeances, where the most potentially fast ion from this couple (Na+, Mg+2) is 22
expected to be the Na+. Na+ has the largest ion permeances >100 for all the experiments with 23
NaCl as dominant salt higher than Mg+2, affected additionally by the dielectric exclusion effect. 24
With regards to anions, the potentially fastest ion was Cl- with permeance values of 11-17 µm/s 25
for both NaCl and MgCl2 dominant salts, followed by sulfate with permeance values of 0.05-0.1 26
µm/s for dominant MgSO4, due to the dielectric exclusion effect. Similar values of permeances for 27
SO42- were reported by Pages et al. [42] for dominant Na2SO4 dominant salt experiments. 28
The influence of the nature of the dominant electrolyte on the membrane permeance to the trace 29
ions was also extracted from experimental data by using the SEDF model. Results, collected in 30
Table 3, showed that membrane permeances to trace cations (Na+, Mg2+) were similar as those 31
determined for them in experiments as dominant salt. Then, size exclusion mechanism as it is 32
claiming in some NF models is not having a relevant contribution for Na+ rejections and solution 33
composition (nature of the dominant electrolyte) and the membrane properties are having a 34
highest contribution. 35
Membrane permeance values to NH4+ were approx. 400 µm/s and 2300 µm/s in NaCl- and MgCl2-36
dominated solutions, respectively, much higher than the value of 54 µm/s corresponding to a 37
MgSO4-dominated solution. This latter low value is due to the fact that in a solution dominated by 38

16
a 2:2 type electrolyte, the negatively charged ion (SO42- in this case) accelerates trace anions 1
permeation while des-accelerates the transport of cations such as NH4+. The same explanation as 2
before applies to the permeance values to K+ (approx. 200 µm/s and 100 µm/s for NaCl- and 3
MgCl2-dominated solutions, respectively) are slightly lower than to NH4+. 4
It is of particular mention the behavior of ion permeances of Na+. For dominant NaCl and MgCl2 5
solutions Na+ ion is showing the highest ion permeances with values higher than 100. However in 6
dominant MgSO4 solutions as trace values of rejection measured range from 0 up to –80% at the 7
maximum linear velocity. For the case of anionic species, sulfate ions as trace component in 8
MgCl2 and NaCl, solutions provided permeance values similar to those for dominant salts as well 9
as chloride ions in MgSO4 dominant salt concentration. For the case of non-common anions such 10
as Br-, I- and NO3-, values reported were similar to a monovalent ion as Cl-. Both Br- and I- have 11
similar chemical properties, although different size properties as it is reported by the hydrated 12
radius with values of 330 pm, and 340 pm respectively, and 195 pm for Cl-. However this has not 13
been traduced in such different ion permeances as it is claimed by models considering size 14
exclusion effects. Similarly NO3- (340 pm hydrated radius), a single charge ion, with also similar 15
permeance values to halide anions. 16
17
18
4. CONCLUSIONS 19
In order to study the effect of dominant salt concentration on the removal of trace ions (Na+, K+, 20
Cl-, Ca2+, Mg2+, SO42-, NO3
-, NH4+, Br- and I-) a set of NF experiments with different dominant salts 21
(NaCl, MgCl2, MgSO4) was designed. The rejections of easily-permeating ions such as single-22
charge inorganic ions in NF membranes containing ionisable free carboxylic and amine groups 23
are controlled to a larger extent by a combination of the electric field, the membrane permeance 24
to them, the membrane properties and the solution composition. The experimental data with 25
various trace ions and dominant salts confirm this hypothesis and can be qualitatively interpreted 26
within the scope of extended SEDF model in the case of feed solutions consisting of one 27
dominant salt and (any number of) trace ions. 28
The applicability of the SEDF model was confirmed, since it was possible to fit the experimental 29
data by means of the model, even in the case of negative rejections. The successful SEDF model 30
fitting highlighted the importance of the polarization layer and electric-field effects on which the 31
model is based. The study has demonstrated severe changes on the selectivity rejection of 32
inorganic ions as Br-, I-, NO3-, NH4
+, K+ depending on the environment solutions. Although the 33
information on the membrane permeances to ions has remained empirical in this study, in 34
principle, it can further be used for the verification of self-consistency of various mechanistic 35
models. The availability of three “measurable” quantities, the membrane permeances to the 36
cations and anions of the dominant salt as well as to the trace ions, in contrast to just one 37
permeance to the salt available from conventional measurements with single salts, can make self-38

17
consistency checks much more conclusive. 1
2
5 ACKNOWLEDGMENTS 3
This research was supported by the ZERO-DISCHARGE project (CTQ2011-26799) and 4
Waste2Product project (CTM2014-57302-R) financed by the Ministerio de Economía y 5
Competitividad (MINECO) and the Catalan Government (Project Ref. 2014SGR50), Spain. The 6
work of Mònica Reig was supported by the Spanish Ministry (MINECO) within the scope of the 7
grant BES-2012-051914. Authors want to thank to A. Yaroshchuk, for their valuable contribution 8
on the work. We also want to thank the contribution of Dow Chemical for the supply of the 9
membranes. 10
11
Nomenc
lature
water permeance defined on Eq. (1)
ion and water molecules concentrations (mol m-3)
water molecules concentration in the feed solution (mol m-3)
salt concentration in the feed solution (mol m-3)
salt concentration at the membrane surface (mol m-3)
salt concentration in the permeate (mol m-3)
trace ion concentration in the feed solution (mol m-3)
trace ion concentration at the membrane surface (mol m-3)
trace ion concentration in the permeate (mol m-3)
ion and water molecules diffusion coefficients in the membrane (m2 s-1)
solute diffusion coefficient in the concentration-polarization layer (m2 s-1)
dominant ion diffusion coefficients in the concentration-polarization layer (m2 s-1)
dominant salt diffusion coefficient in the concentration-polarization layer (m2 s-1)
trace ion diffusion coefficient in the concentration-polarization layer (m2 s-1)
reciprocal dominant salt transmembrane transfer
reciprocal trace ion transmembrane transfer
liquid-membrane sorption coefficient defined on Eq. (1)
concentration-polarization layer permeance to the dominant salt (m s-1)
membrane permeance to the dominant salt (m s-1)
membrane permeances to the dominant ions (m s-1)
membrane permeances to the trace ions (m s-1)
dominant salt Péclet number

18
trace ion Péclet number
gas constant (J K−1 mol−1)
dominant salt intrinsic rejection
trace ion intrinsic rejection
dominant salt observable rejection
trace ion observable rejection
temperature (K)
solute molar volume (m3 mol-1)
coordinate scaled on the membrane thickness (m)
ion charge
dominant ion charges
trace ion charge
Greek letters
fraction of trace ion over salt diffusion coefficients in the concentration polarization-
layer
activity coefficient of the bulk feed solution
activity coefficient of the feed-membrane interphase
estimated concentration-polarization thickness (m)
dimensionless reference electrostatic potential
1
REFERENCES 2
[1] S. Darvishmanesh, T. Robberecht, P. Luis, J. Degrève, B. Van der Bruggen, Performance 3 of Nanofiltration Membranes for Solvent Purification in the Oil Industry, J. Am. Oil Chem. 4 Soc. 88 (2011) 1255–1261. 5
[2] A. Sotto, J.M. Arsuaga, B. Van der Bruggen, Sorption of phenolic compounds on NF/RO 6 membrane surfaces: Influence on membrane performance, Desalination. 309 (2013) 64–7 73. 8
[3] S.K. Nataraj, K.M. Hosamani, T.M. Aminabhavi, Nanofiltration and reverse osmosis thin 9 film composite membrane module for the removal of dye and salts from the simulated 10 mixtures, Desalination. 249 (2009) 12–17. 11
[4] B. Van der Bruggen, J. Kim, Nanofiltration of aqueous solutions: Recent developments 12 and progresses, in: Adv. Mater. Membr. Prep., 2012: pp. 228–247. 13
[5] O. Coronell, B.J. Mariñas, X. Zhang, D.G. Cahill, Quantification of functional groups in the 14 active layer of nanofiltration (NF) and reverse osmosis (RO) membranes, (2007). 15
[6] D.L. Oatley, L. Llenas, R. Pérez, P.M. Williams, X. Martínez-Lladó, M. Rovira, Review of 16 the dielectric properties of nanofiltration membranes and verification of the single oriented 17 layer approximation., Adv. Colloid Interface Sci. 173 (2012) 1–11. 18
[7] O. Coronell, M.I. González, B.J. Mariñas, D.G. Cahill, Ionization behavior, stoichiometry of 19 association, and accessibility of functional groups in the active layers of reverse osmosis 20 and nanofiltration membranes., Environ. Sci. Technol. 44 (2010) 6808–6814. 21
[8] A.E. Childress, M. Elimelech, Effect of solution chemistry on the surface charge of 22

19
polymeric reverse osmosis and nanofiltration membranes, J. Memb. Sci. 119 (1996) 253–1 268. 2
[9] L. a. Richards, M. Vuachère, A.I. Schäfer, Impact of pH on the removal of fluoride, nitrate 3 and boron by nanofiltration/reverse osmosis, Desalination. 261 (2010) 331–337. 4
[10] E. Idil Mouhoumed, a. Szymczyk, a. Schäfer, L. Paugam, Y.H. La, Physico-chemical 5 characterization of polyamide NF/RO membranes: Insight from streaming current 6 measurements, J. Memb. Sci. 461 (2014) 130–138. 7
[11] O. Coronell, B.J. Mariñas, D.G. Cahill, Depth heterogeneity of fully aromatic polyamide 8 active layers in reverse osmosis and nanofiltration membranes., Environ. Sci. Technol. 45 9 (2011) 4513–20. 10
[12] A.I. Schäfer, A.. Fane, T.D. Waite, Nanofiltration of natural organic matter : Removal , 11 fouling and the influence of multivalent ions, Desalination. 118 (1998) 109–122. 12
[13] R.S. Harisha, K.M. Hosamani, R.S. Keri, S.K. Nataraj, T.M. Aminabhavi, Arsenic removal 13 from drinking water using thin film composite nanofiltration membrane, Desalination. 252 14 (2010) 75–80. 15
[14] C. Umpuch, S. Galier, S. Kanchanatawee, H.R. Balmann, Nanofiltration as a purification 16 step in production process of organic acids: Selectivity improvement by addition of an 17 inorganic salt, Process Biochem. 45 (2010) 1763–1768. 18
[15] K.S. Spiegler, O. Kedem, Thermodynamics of hyperfiltration (reverse osmosis): criteria for 19 efficient membranes, Desalination. 1 (1966) 311–326. 20
[16] A.E. Yaroshchuk, Rejection of single salts versus transmembrane volume flow in RO/NF: 21 thermodynamic properties, model of constant coefficients, and its modification, J. Memb. 22 Sci. 198 (2002) 285–297. 23
[17] J. Schaep, B. Van der Bruggen, C. Vandecasteele, D. Wilms, Influence of ion size and 24 charge in nanofiltration, Sep. Purif. Technol. 14 (1998) 155–162. 25
[18] S. Bason, Y. Kaufman, V. Freger, Analysis of ion transport in nanofiltration using 26 phenomenological coefficients and structural characteristics, J. Phys. Chem. B. 114 (2010) 27 3510–3517. 28
[19] J. Garcia-Aleman, J.M. Dickson, Mathematical modeling of nanofiltration membranes with 29 mixed electrolyte solutions, J. Memb. Sci. 235 (2004) 1–13. 30
[20] W.R. Bowen, H. Mukhtar, Characterisation and prediction of separation performance of 31 nanofiltration membranes, J. Memb. Sci. 112 (1996) 263–274. 32
[21] W.R. Bowen, J.S. Welfoot, P.M. Williams, Linearized transport model for nanofiltration: 33 Development and assessment, AIChE J. 48 (2002) 760–773. 34
[22] D.W. Nielsen, G. Jonsson, Bulk-phase criteria for negative ion rejection in nanofiltration of 35 multicomponent salt solutions, Sep. Sci. Technol. 29 (1994) 1165–1182. 36
[23] G. Jonsson, Concentration profiles retention—flux curves for composite membranes in 37 reverse osmosis, J. Memb. Sci. 14 (1983) 211–227. 38
[24] J. Jagur-Grodzinski, O. Kedem, Transport coefficients and salt rejection in unchanged 39 hyperfiltration membranes, Desalination. 1 (1966) 327–341. 40
[25] S. Bason, O. Kedem, V. Freger, Determination of concentration-dependent transport 41 coefficients in nanofiltration: Experimental evaluation of coefficients, J. Memb. Sci. 326 42 (2009) 197–204. 43
[26] X.L. Wang, Y.Y. Fang, C.H. Tu, B. Van der Bruggen, Modelling of the separation 44 performance and electrokinetic properties of nanofiltration membranes, Int. Rev. Phys. 45 Chem. 31 (2012) 111–130. 46
[27] X.-L. Wang, T. Tsuru, S. Nakao, S. Kimura, Electrolyte transport through nanofiltration 47 membranes by the space-charge model and the comparison with Teorell-Meyer-Sievers 48 model, J. Memb. Sci. 103 (1995) 117–133. 49
20
[28] M.D. Afonso, M.N. De Pinho, Transport of MgSO4, MgCl2, and Na2SO4 across an 1 amphoteric nanofiltration membrane, J. Memb. Sci. 179 (2000) 137–154. 2
[29] L. Bruni, S. Bandini, Studies on the role of site-binding and competitive adsorption in 3 determining the charge of nanofiltration membranes, Desalination. 241 (2009) 315–330. 4
[30] A. Szymczyk, P. Fievet, Investigating transport properties of nanofiltration membranes by 5 means of a steric, electric and dielectric exclusion model, J. Memb. Sci. 252 (2005) 77–88. 6
[31] a Szymczyk, N. Fatinrouge, P. Fievet, C. Ramseyer, a Vidonne, Identification of dielectric 7 effects in nanofiltration of metallic salts, J. Memb. Sci. 287 (2007) 102–110. 8
[32] A.A. Hussain, S.K. Nataraj, M.E.E. Abashar, I.S. Al-mutaz, T.M. Aminabhavi, Prediction of 9 physical properties of nanofiltration membranes using experiment and theoretical models, 10 J. Memb. Sci. 310 (2008) 321–336. 11
[33] N.S. Kotrappanavar, A.A. Hussain, M.E.E. Abashar, I.S. Al-mutaz, T.M. Aminabhavi, M.N. 12 Nadagouda, Prediction of physical properties of nanofiltration membranes for neutral and 13 charged solutes, Desalination. 280 (2011) 174–182. 14
[34] P.V.X. Hung, S.-H. Cho, S.-H. Moon, Prediction of boron transport through seawater 15 reverse osmosis membranes using solution–diffusion model, Desalination. 247 (2009) 33–16 44. 17
[35] A. Bódalo, J.-L. Gómez, E. Gómez, G. León, M. Tejera, Reduction of sulphate content in 18 aqueous solutions by reverse osmosis using cellulose acetate membranes, Desalination. 19 162 (2004) 55–60. 20
[36] A. Bódalo, J.-L. Gómez, E. Gómez, G. León, M. Tejera, Ammonium removal from aqueous 21 solutions by reverse osmosis using cellulose acetate membranes, Desalination. 184 (2005) 22 149–155. 23
[37] J.G. Wijmans, R.W. Baker, The solution-diffusion model: a review, J. Memb. Sci. 107 24 (1995) 1–21. 25
[38] D. Paul, Reformulation of the solution-diffusion theory of reverse osmosis, J. Memb. Sci. 26 241 (2004) 371–386. 27
[39] A. Yaroshchuk, X. Martínez-Lladó, L. Llenas, M. Rovira, J. de Pablo, J. Flores, et al., 28 Mechanisms of transfer of ionic solutes through composite polymer nano-filtration 29 membranes in view of their high sulfate/chloride selectivities, Desalin. Water Treat. 6 30 (2009) 48–53. 31
[40] V. Sasidhar, E. Ruckenstein, Anomalous effects during electrolyte osmosis across 32 charged porous membranes, J. Colloid Interface Sci. 85 (1982) 332–362. 33
[41] A. Yaroshchuk, X. Martínez-Lladó, L. Llenas, M. Rovira, J. de Pablo, Solution-diffusion-film 34 model for the description of pressure-driven trans-membrane transfer of electrolyte 35 mixtures: One dominant salt and trace ions, J. Memb. Sci. 368 (2011) 192–201. 36
[42] N. Pages, A. Yaroshchuk, O. Gibert, J.L. Cortina, Rejection of trace ionic solutes in 37 nanofiltration: Influence of aqueous phase composition, Chem. Eng. Sci. 104 (2013) 1107–38 1115. 39
[43] A. Yaroshchuk, M.L. Bruening, E.E. Licón Bernal, Solution-Diffusion–Electro-Migration 40 model and its uses for analysis of nanofiltration, pressure-retarded osmosis and forward 41 osmosis in multi-ionic solutions, J. Memb. Sci. 447 (2013) 463–476. 42
[44] M. Reig, N. Pagès, E. Licon, C. Valderrama, O. Gibert, A. Yaroshchuk, et al., Evolution of 43 electrolyte mixtures rejection behaviour using nanofiltration membranes under spiral wound 44 and flat-sheet configurations, Desalin. Water Treat. 56 (2014) 3519–3529. 45
[45] M. Reig, E. Licon, O. Gibert, A. Yaroshchuk, J.L. Cortina, Rejection of ammonium and 46 nitrate from sodium chloride solutions by nanofiltration: Effect of dominant-salt 47 concentration on the trace-ion rejection, Chem. Eng. J. 303 (2016) 401–408. 48
[46] J. Raich-Montiu, J. Barios, V. Garcia, M.E. Medina, F. Valero, R. Devesa, et al., 49 Integrating membrane technologies and blending options in water production and 50

21
distribution systems to improve organoleptic properties. The case of the Barcelona 1 Metropolitan Area, J. Clean. Prod. 69 (2014) 250–259. 2
[47] A. Sotto, ARCADIO SOTTO DÍAZ, (2008). 3
[48] W.J. Koros, G.K. Fleming, S.M. Jordan, T.H. Kim, H.H. Hoehn, POLYMERIC MEMBRANE 4 MATERIALS SOLUTION-DIFFUSION BASED PERMEATION SEPARATIONS Membrane 5 science and polymer science have grown synergistically over the past thirty years . Clearly 6 , today ’ s impressive set of membrane processes and products could not exist, 13 (1988) 7 339–401. 8
[49] S.H. Kim, S.-Y. Kwak, T. Suzuki, Positron annihilation spectroscopic evidence to 9 demonstrate the flux-enhancement mechanism in morphology-controlled thin-film-10 composite (TFC) membrane., Environ. Sci. Technol. 39 (2005) 1764–70. 11
[50] A.E. Yaroshchuk, Dielectric exclusion of ions from membranes, Adv. Colloid Interface Sci. 12 85 (2000) 193–230. 13
[51] S. Bandini, D. Vezzani, Nanofiltration modeling: the role of dielectric exclusion in 14 membrane characterization, Chem. Eng. Sci. 58 (2003) 3303–3326. 15
[52] A. Yaroshchuk, X. Martínez-Lladó, L. Llenas, M. Rovira, J. de Pablo, Solution-diffusion-film 16 model for the description of pressure-driven trans-membrane transfer of electrolyte 17 mixtures: One dominant salt and trace ions, J. Memb. Sci. 368 (2011) 192–201. 18
19
20 21