Embed Size (px)
Citation preview

1
U.S. EPA and DHS Center of Excellence
CAMRA is an interdisciplinary research center established to develop scientific knowledge on the fate and risk from high priority infectious agents.
(Michigan State University, Drexel University, University of Michigan, Carnegie Mellon University, Northern Arizona University, University of Arizona and University of California Berkeley)
Homepage: http://www.camra.msu.edu/

2
Introduction to Quantitative Microbial Risk Assessment
Joan B. Rose, Ph.D., Yin Huang, Ph.D. Michigan State University

Quantitative Microbial Risk Assessment (QMRA)
• What is QMRA?A method for assessing risks from microbial agents in a framework that defines the statistical probability of an infection from the environmental pollution of water, soil, food, surfaces and hands
• Problem formulation The problem should be formulated to respond
directly to the needs of decision makers, stakeholders, as well as the interested public, and to guide the risk assessment paradigm
3

Hazard Identification
Dose Response Exposure Assessment
Risk Characterization
Risk Management
HAZARD IDENTIFICATION Types of microorganisms and disease end-pointsDOSE-RESPONSE Human feeding studies, clinical studies, less virulent microbes and health adultsEXPOSURE Monitoring data, indicators and modeling used to address exposureRISK CHARACTERIZATION Magnitude of the risk, uncertainty and variability Need to tie risk assessments to management and decision science
Risk Assessment Paradigm
4

5
Hazard Identification
• Determine what microorganisms cause which human illnesses• Develop diagnostic tools to identify the hazards to link to and
quantify the associated the infection, incubation time, symptoms in individuals (and communities), severity, duration, and excretion rates
• Understand possible transmission routes• Data sources: Clinical data, outbreak investigations,
experimental and epidemiological studies

6
Dose Response
• Provides a quantitative relationship between the likelihood of adverse effects and the level of microbial exposure
- End point: infection, illness or death - Dose: number of organisms ingested or inhaled• Data come from human and animal feeding studies• Enables low dose extrapolation• Have Dose-response models for most Class A and B
agents

Dose-Response Models
• P= probability of infection (risk)• d=dose• K, α, N50
model specific parameters
Exponential Approximate Beta Poisson
p1 exp kd
p1 1d 21/ 1 N50
7

8
Exposure Assessment
• Identifies affected population• Determines the exposure pathways and environmental fate• Calculates the amount, frequency, length of time, and route of exposure• Estimates dose or distribution of doses

9
Risk Characterization
• Integrates dose-response analysis and exposure assessment to estimate magnitude of risk, uncertainty and variability
• Monte Carlo analysis gives distribution of risks and population/community models

Monte Carlo Uncertainty Analysis• Risk assessments are often subject to large uncertainties• Monte Carlo generates or “samples” parameters X1 and
X2 based on certain distributions while calculating corresponding risk Y = F(X1, X2)
• A discrete distribution of Y that approximates true distribution of Y is used
• True percentiles of Y ~= percentile of Yi values are included• Typically the analysis summarizes the data by mean,
median, upper bound, and lower bound
10

11
Applications for QMRAEstablish policies for protection of health using standards or performance based criteria
• Compare risks• Evaluate alternative
solutions• Prioritize risks• Identify scientific data gaps• Develop protocols for
monitoring• Communicate effectively
with the public

Example: Cryptosporidium Risk Assessment
• What is the risk of waterborne disease from swimming ?• According to CDC, diarrheal recreational water illnesses (RWIs) outbreaks, the most
commonly reported RWI, has sickened almost 19,000 people from 1984 to 2002• One of the most commonly reported parasites that cause diarrheal RWI is
Cryptosporidium • Cryptosporidium - protozoan parasite - environmentally transmissible form: oocysts - exposure route: fecal-oral - Risk analysis scenario: swimming in contaminated pool
12

Dose-Response Modeling for Cryptosporidium
• Fitting dose-response model to available data
• Exponential with k= 0.00419
• Risk = 1-exp(-dose x 0.00419)
Exponential model fit to data on oral exposure to oocysts and infectivity of Cryptosporidium in humans (Dupont 1995)
13

Cryptosporidium Risk per Swim
• Exposure assessment: Swimming after a fecal accident i. 0.016 liters consumed per swim (Dufour et al. 2006) ii. assume 15 infective oocysts/liter iii. Dose =0.016 liters/swim x 15 oocysts/liter = 0.24
• Risk Characterization - Risk = 1-exp(-0.00419 x dose ) - Risk = 1-exp(-0.00419 * 0.24)= 0.0010
p1 exp kd
14

Risk from Multiple Exposures Seasonal Risk of swimming [probability of infection with
multiple exposures] assumes each exposure event is independent.
Example:Seasonal swimming occurs for 8 events throughout the
year.Probability of Infection for one swim event = 0.0010Multiple Exposure Risk =1-[1-SingleRisk]8
Seasonal Swim Risk =1-[1-0.0010]8 = 0.008015

Monte Carlo Uncertainty
• Risk=1-exp(-k * ingestion * concentration)• suppose we don’t know true average
concentration?• Choose input distributions that reflect plausible
spread in these values• Assuming Ln (natural log) of the average oocyst
concentration is normally distributed with mean = 2.7 and standard deviation = 0.20generate Ln [average concentration] from normal
generator in excel 16

From Point Estimate to Probabilistic Risk Assessment• Probabilistic Seasonal Risk=1-{1-[1-exp(-k * ingestion * concentration)]}8
• Only concentration of oocysts used as a distribution for the risk output.• A series of risks are calculated based on randomly generated oocyst levels from the
distribution of the concentration of oocysts (see slide 16)• Output can be described by distribution as shown below (inclusive of mean ,
median, upper bound, and lower bound, etc)• From the output below, mean=0.0081, median=0.0079, 95% upper bound=0.0109,
95% lower bound =0.0059
0.00490869
0.00532701
0.005745331
0.006163651
0.006581972
0.007000292
0.007418612
0.007836933
0.008255253
0.008673574
0.009091894
0.009510214
0.009928535
0.010346855
0.010765175
0.011183496
0.011601816
0.012020137
0.012438457
0.012856777
0.013275098
0.013693418More
0
10
20
30
40
50
60
70
Seasonal Swimming Cryptosporidium Risk
Risk
Freq
uenc
y
17
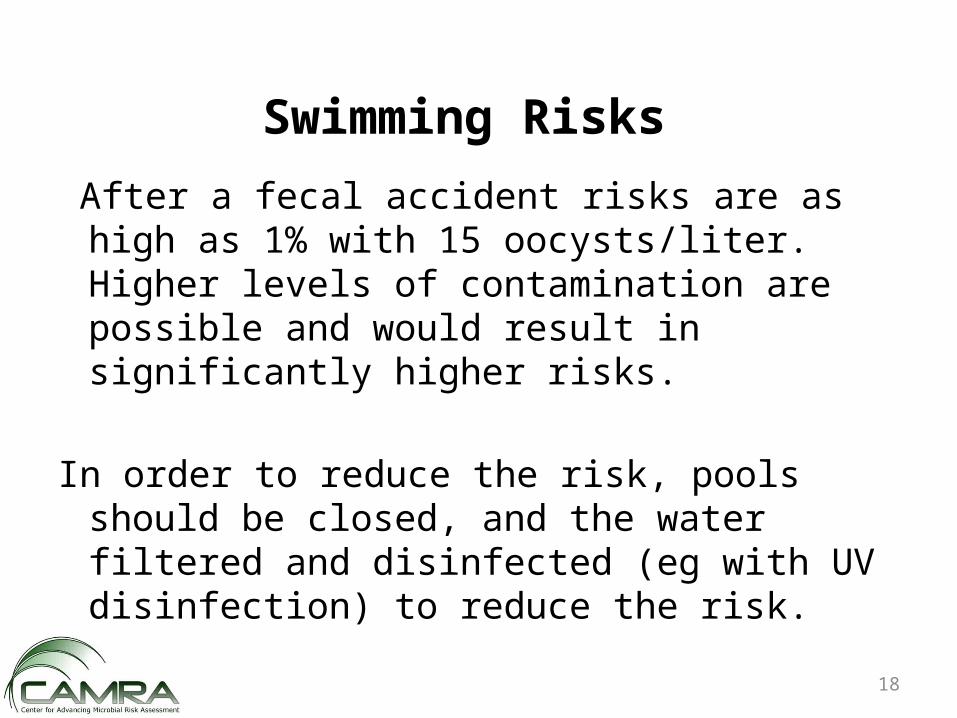
Swimming Risks
After a fecal accident risks are as high as 1% with 15 oocysts/liter. Higher levels of contamination are possible and would result in significantly higher risks.
In order to reduce the risk, pools should be closed, and the water filtered and disinfected (eg with UV disinfection) to reduce the risk.
18

19
Selected QMRA References• Casman, E. A. and B. Fischhoff (2008). "Risk Communication Planning for the Aftermath of a Plague
Bioattack." Risk Analysis 28(5): 1327-1342.• Dufour, A., O. Evans, et al. (2006). "Water ingestion during swimming activities in a pool: A pilot study."
Journal of Water and Health 4(4): 425-430.• DuPont, H., C. Chappell, et al. (1995). "The infectivity of Cryptosporidium parvum in healthy volunteers."
New England Journal of Medicine 332(13): 855-859. • Eisenberg, J., E. Seto, et al. (1998). "An analysis of the Milwaukee cryptosporidiosis outbreak based on a
dynamic model of the infection process." Epidemiology 9(3): 228-231.• Gerba, C., J. Rose, et al. (1996). "Sensitive populations: who is at the greatest risk?" International Journal of
Food Microbiology 30(1-2): 113-123.• Haas, C. N., J. B. Rose, et al. (1999). Quantitative Microbial Risk Assessment. New York, John Wiley and
Sons.• Huang, Y., T. Hong, et al. (2010). "How Sensitive Is Safe? Risk-Based Targets for Ambient Monitoring of
Pathogens." IEEE Sensors Journal 10(3): 668-673.• Ives, R. L., A. M. Kamarainen, et al. (2007). "Use of Cell Culture to Assess Cryptosporidium parvum Survival
Rates in Natural Groundwaters and Surface Waters." Applied and Environmental Microbiology 73(18): 5968-5970.
• Rose, J. B., C. N. Haas, et al. (1991). "Risk assessment and control of waterborne giardiasis." American Journal of Public Health 81(6): 709-713.
• National Academy of Sciences (1983). Risk assessment in the federal government: managing the process. Washington, DC, National Academy Press.