Embed Size (px)
Citation preview

1
U.S. Expansion and Upgrade
Growth investment at 9 of 12 domestic refineries
Bayway
LakeCharles
Sweeny
WoodRiver
Ponca City
Borger
Billings
LAR
Rodeo
Ferndale
Trainer
Alliance
Investment Drivers:• Advantaged crude growth• Growing clean products• Enhancing E&P integration• Increasing capacity
$4 – $5 B Investment Program(2006 – 2011)
$4 – $5 B Investment Program(2006 – 2011)

2
Heavy Sour
SweetSweet
Current Future
Heavy Sour
SourSour
Grow U.S. Refining Capabilities
• Integration with E&P
• Enhanced refining profitability
• Attractive economics
• Increased capabilities
Capacity DistributionCapacity Distribution$4 – $5 B Investment Program(2006 – 2011)
$4 – $5 B Investment Program(2006 – 2011)

3
Commercial
• Scope
- 2.5 B BBL/yr crude oil and refined products
- 4.2 TCF/yr gas marketing business
- Global trading operation
• Objectives- Optimize value chain to maximize earnings
- Trade around asset base & market knowledge for additional value
• Financial contribution- Improves total company ROCE
- Included in E&P / R&M realizations

4
• LUKOIL’s sole equity partner
• 14.8% equity ownership1, moving to 20%
• JV partner in Timan-Pechora
• Jointly pursuing upstream and downstream opportunities globally
• 2005 earnings2 estimated at $700 MM
LUKOIL Update
1 Equity ownership as of the end of third-quarter 2005.2 2005 equity earnings to COP are based on annualized YTD Q3 actuals.

5
Technology
• Enable E&P / R&M initiatives– Heavy oil, Arctic, LNG – Clean fuels / hydroprocessing,
coking, alkylation– Capacity expansion and flexibility– Project management / execution
• Emerging energy opportunities – Disciplined, phased approach– Extending core competencies– Renewable fuels– E-GasTM Gasification Technology

6
Rising to the Challenge• Deliver strong operating and financial performance
– Continued focus on Operating Excellence
– Manage cost inflation and project execution
• Well-defined, sustainable growth plan– Portfolio of strong E&P / R&M growth projects
– Increased production and refining capacity / capability
• Financial strategy to complement value creation
SettingObjectives
2003
DeliveringPerformance
2004
Raising Expectations
2005
Continuous improvement Shareholder value creation
Investing for Growth
2006+
7
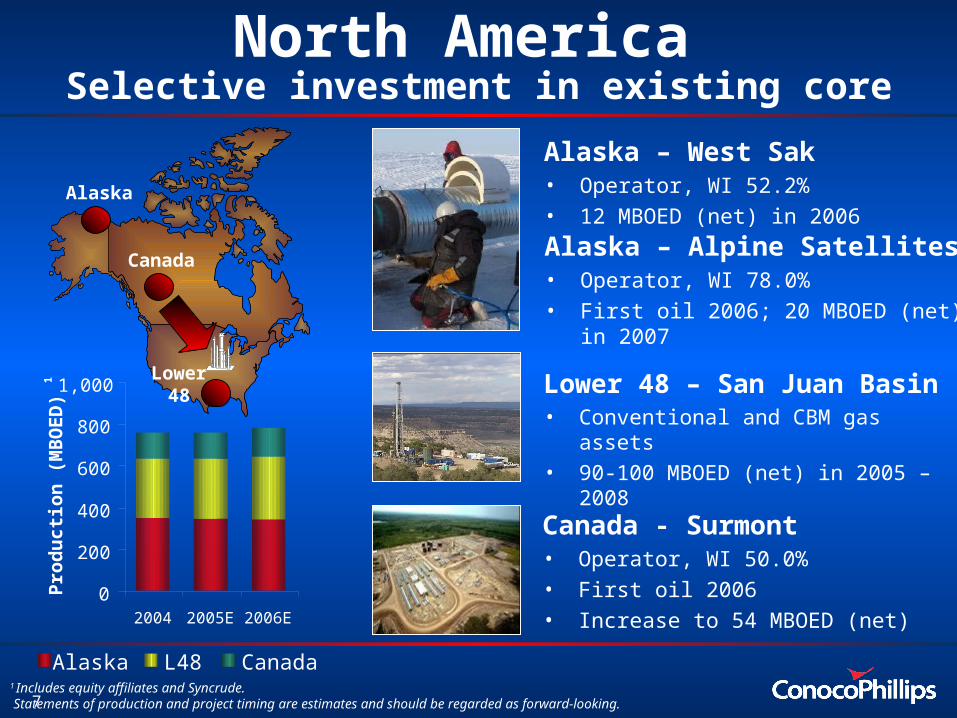
North America Selective investment in existing core
Alaska – West Sak• Operator, WI 52.2%• 12 MBOED (net) in 2006
Canada - Surmont• Operator, WI 50.0%• First oil 2006• Increase to 54 MBOED (net)
1 Includes equity affiliates and Syncrude. Statements of production and project timing are estimates and should be regarded as forward-looking.
Alaska
Canada
Lower 48 Lower 48 – San Juan Basin
• Conventional and CBM gas assets• 90-100 MBOED (net) in 2005 – 2008
Alaska – Alpine Satellites• Operator, WI 78.0%• First oil 2006; 20 MBOED (net) in 2007
0
200
400
600
2004 2005E 2006E
800
1,000
Pro
du
ctio
n (
MB
OE
D)
1
Alaska L48 Canada

8
ANS
Mackenzie Delta
Alaska - ANS Gas• WI 4.9-36.1%• COP agreement in principle with State• Largest leaseholder• Estimated net resources of 8 TCF• Estimated net production of
~1-1.3 BCFD • Federal enabling legislation in 2004
Canada - Northern Gas• Mackenzie Delta – Estimated net
resources of 1.8 TCF • Initial net production of 230 MMCFD• Ongoing negotiations• Startup 2011• Additional upside potential
North AmericaArctic gas
Statements of production and project timing are estimates and should be regarded as forward-looking.

9
North Sea Selective investment in existing core
Norway - Ekofisk Growth• Operator, WI 35.1%• First oil October 2005 • 25 MBOED (net) in 2009
1 Combined Satellite WI - Callanish WI 83.5%, Brodgar WI 75%. Statements of production and project timing are estimates and should be regarded as forward-looking.
Greater Ekofisk
Greater Britannia
AlvheimU.K. - Britannia Satellites• First oil 2007; Operator, WI 79.0%• Development drilling is complete• 50 MBOED (net) in 2007
1
Norway - Alvheim• First oil 2007, WI 20.0%• FPSO and subsea completions• 15 MBOED (net) in 20070
200
400
600
2004 2005E 2006E
Pro
du
ctio
n (
MB
OE
D)
U.K. Norway

10
0
200
400
600
800
2004 2005E 2006E
China
Australia / Timor-LesteVietnam
Indonesia
Venezuela
1
Rest of World
LUKOIL
Pro
du
ctio
n (
MB
OE
D)
New Legacy Growth AreasIncreasing access and growing production
1 Includes equity affiliates and Syncrude. Statements of production and project timing are estimates and should be regarded as forward-looking.