Embed Size (px)
Citation preview

1
V. Simplifying the Portfolio Process

2
Simplifying the Portfolio Process Estimating correlations
Single Index ModelsMultiple Index ModelsAverage Models
Finding Efficient Portfolios

3
1956 Markowitz – not implemented
i j2 2
j=12
j ii=1 i=1
NN NX X X
NR X Rp i ii 1
i i i j ijp

4
5
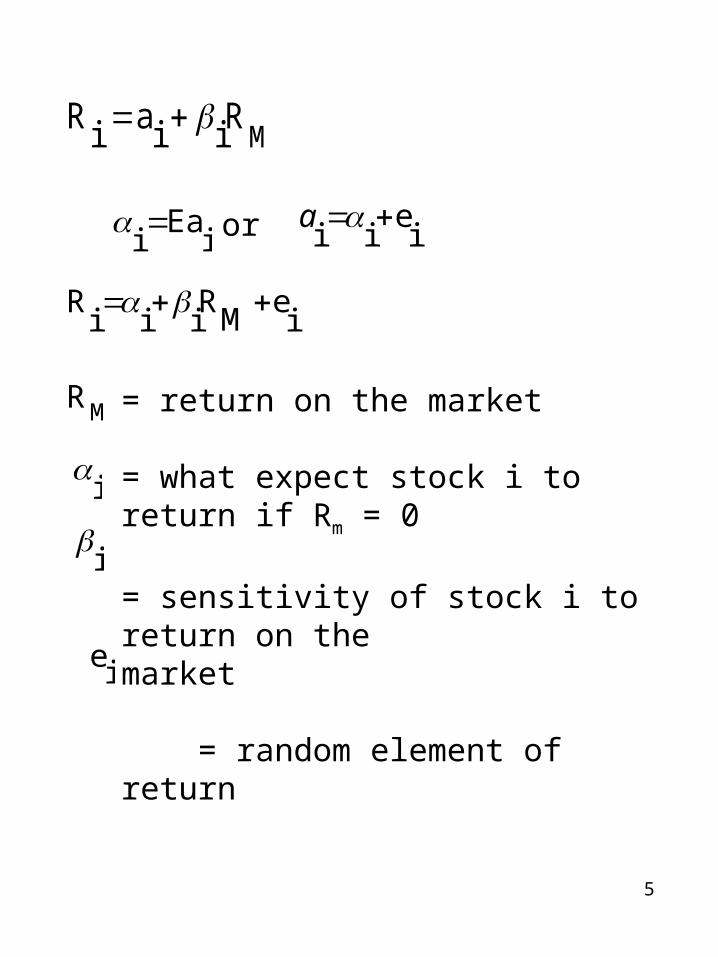
MRiiaiR
iEa
i or e
i i ia
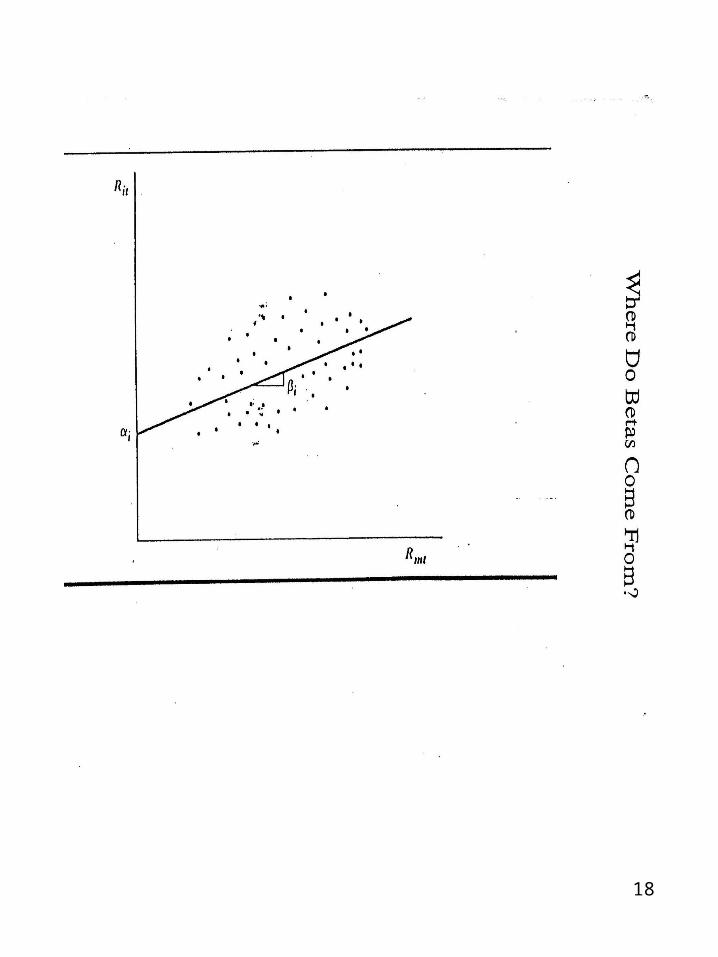
R R eMi i i i
= return on the market = what expect stock i to return if Rm = 0 = sensitivity of stock i to return on the
market = random element of return
MR
i
i
ie

6
Sharpe Single Index Models Basic Equation
ieRiiiRM
By Construction
0ieE i = 1,2,…N
By Definition
2ei
2ieE i = 1,2,…N
E2
2R RMM M
By Assumption
0M
RMR ,ieE
i = 1,2,…N
E e , e 0i j
j i; i = 1,2,...N; j=1,2...N
7
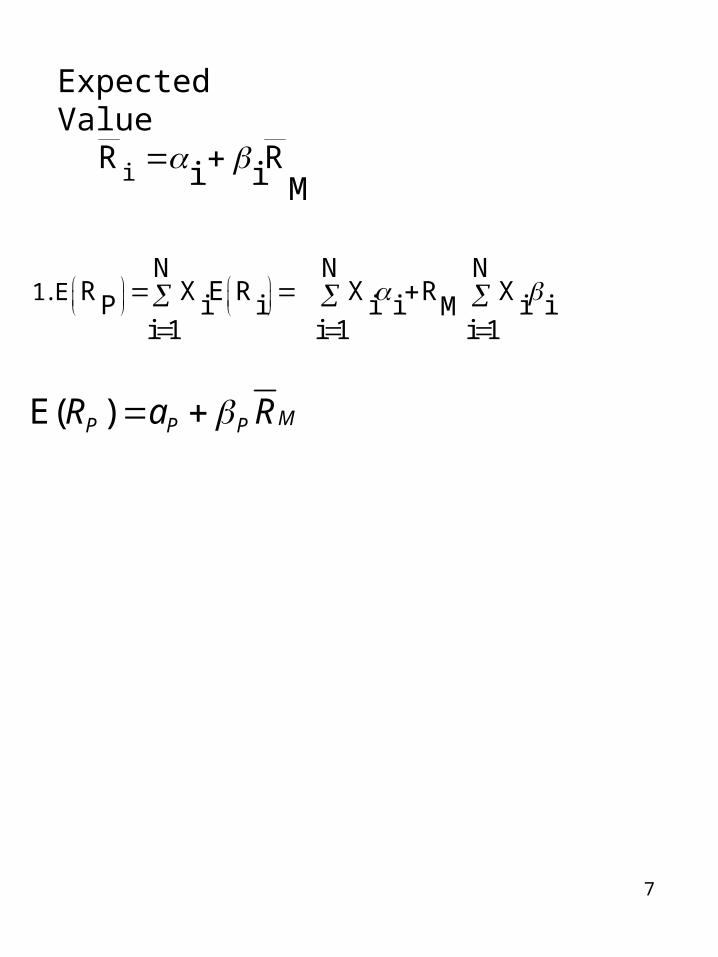
Expected Value
MRiiR i
1. EN N N
R X E R X R XP i i i i i iMi 1 i 1 i 1
E( ) MP P PR a R
8
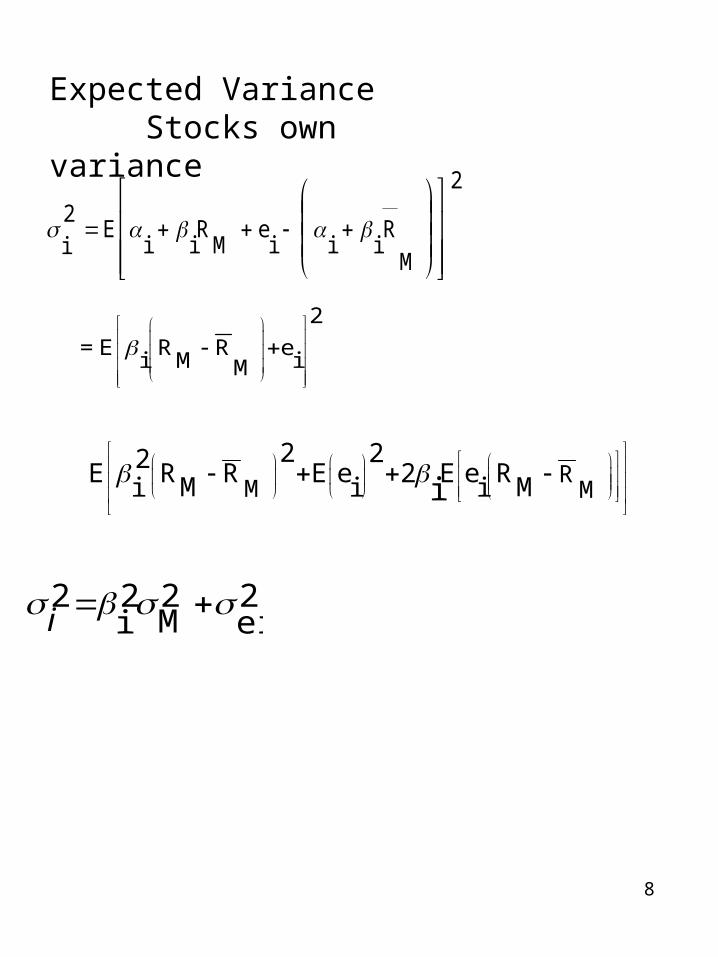
Expected VarianceStocks own variance
2
MR
iiie
MR
iiE
2i
2
= E R R ei M iM
RM M
2 22E R R E e 2 E e RM Mi i ii
2ei
2M
2i
2 i
9
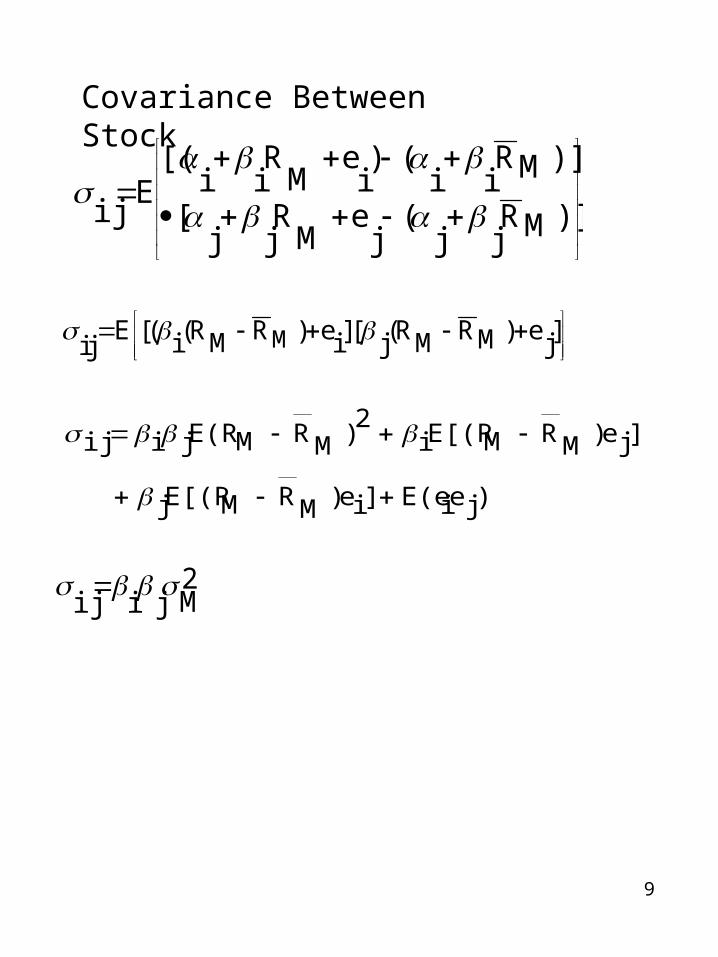
Covariance Between Stock
)]MRjj
(j
eM
Rjj
[
)]MRii
()i
eM
Rii
[(E
ij
ME [( (R R ) e ][ (R R ) e ]M Mi i j jij M
)jeiE(e]ie)MRME[(Rj
]je)MRME[(Ri2
)MRME(Rjiij
2Mjiij

10
N N N2 2 2 X X XP i i i j ij1 i 1j 1
j i
i
2 2 2 2 Mi i ei
2Mjiij
N
1i MRi
N
1i iiXPR .1

11
N
1i2ei
2i
X2Mjij
XN
1i
N
1i
N
ij1j
iX2
M2i
2i
X2P
a b c a Stocks own variances due to market b Covariance risk c Independent component of stocks own
variance

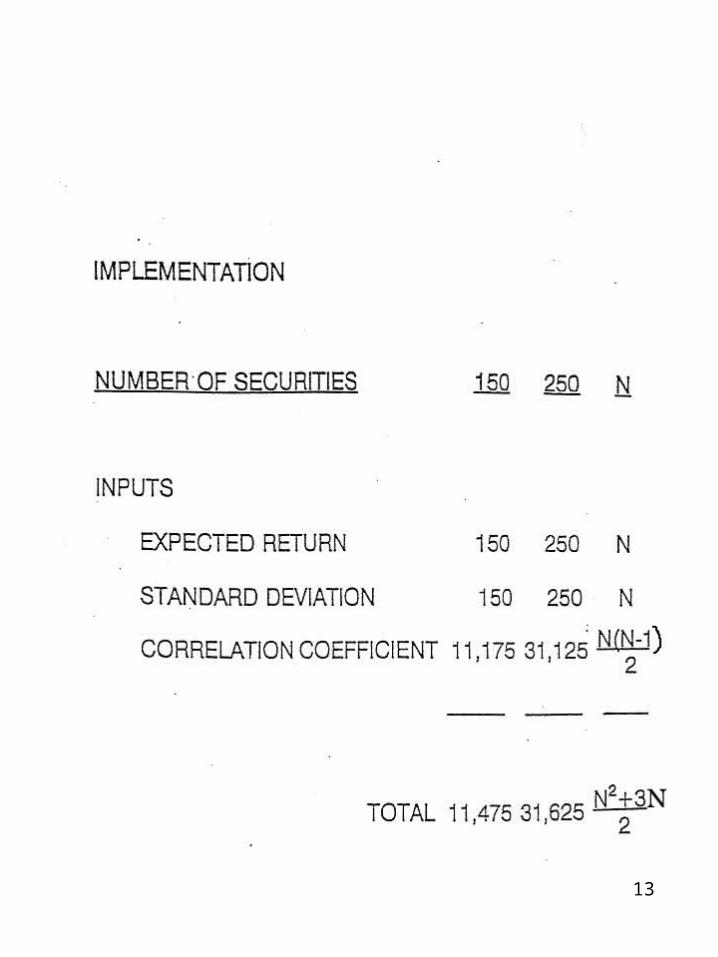
12
# of rec. N 150 250
i N 150 250
i N 150 250
2ei
N 150 250
MR 1 1 1
2M 1 1 1
Sharpe Single Index3N + 2 452 752
General Model 2N+N(N-1) 2
(11,475) (31,625)
13

14
Alternative way of getting inputs
N Securities
Input Alternative Input
i
i N
i
iRN
2ei
2i
MRM
R
2M
2M
N
1
1
3N + 2
Miii RR
2ei
2M
2i
2i
15
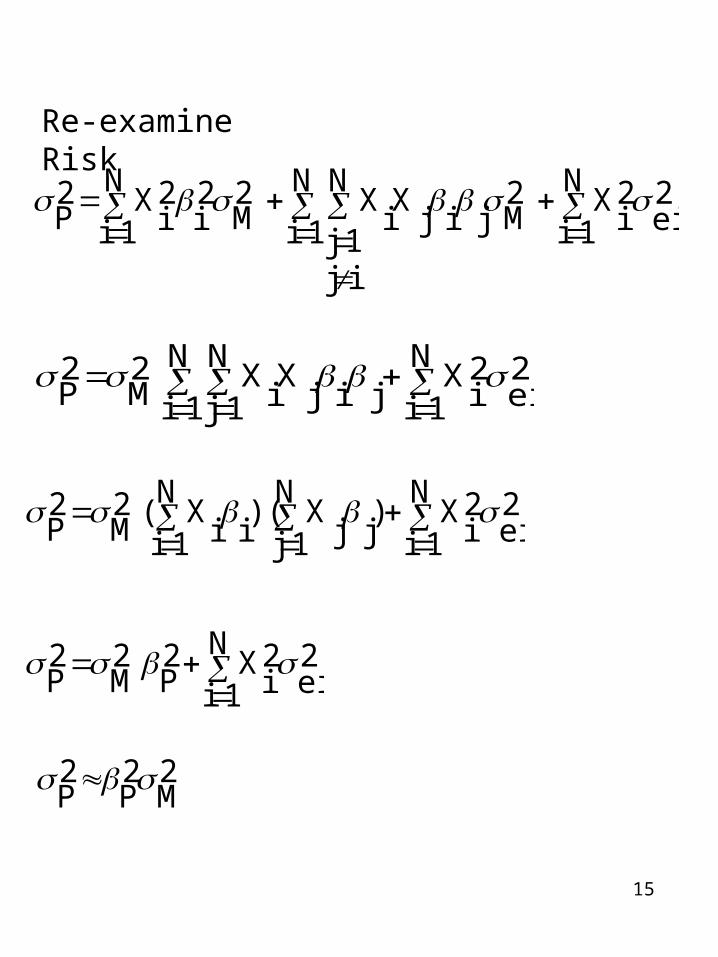
Re-examine Risk
N
1i2ei
2i
X2Mjij
XN
1i
N
1i
N
ij1j
iX2
M2i
2i
X2P
2ei
N
1i2i
Xjij
XN
1i
N
1j iX2
M2P
N
1i2ei
2i
X)N
1i
N
1j jjX)(
iiX(2
M2P
N
1i2ei
2i
X2P
2M
2P
2 2 2 P P M

16
2M
2P
2P
2ei
2M
2i
2i
Non Diversifiable DiversifiableMarket Risk Residual Risk

17
18

19
ieMRiiiR
60
1t 60
1t2]RMt[R
)]RMtR)(Rit[(R
2M
iMi
Mt
Mtit
R Ri i Mi

20
21
22
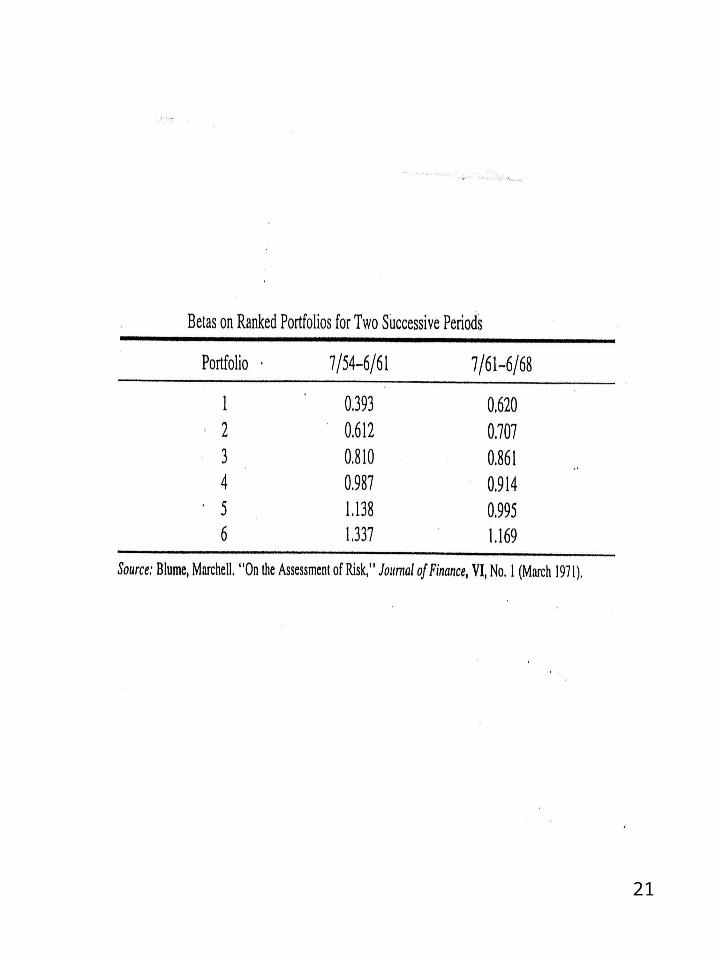
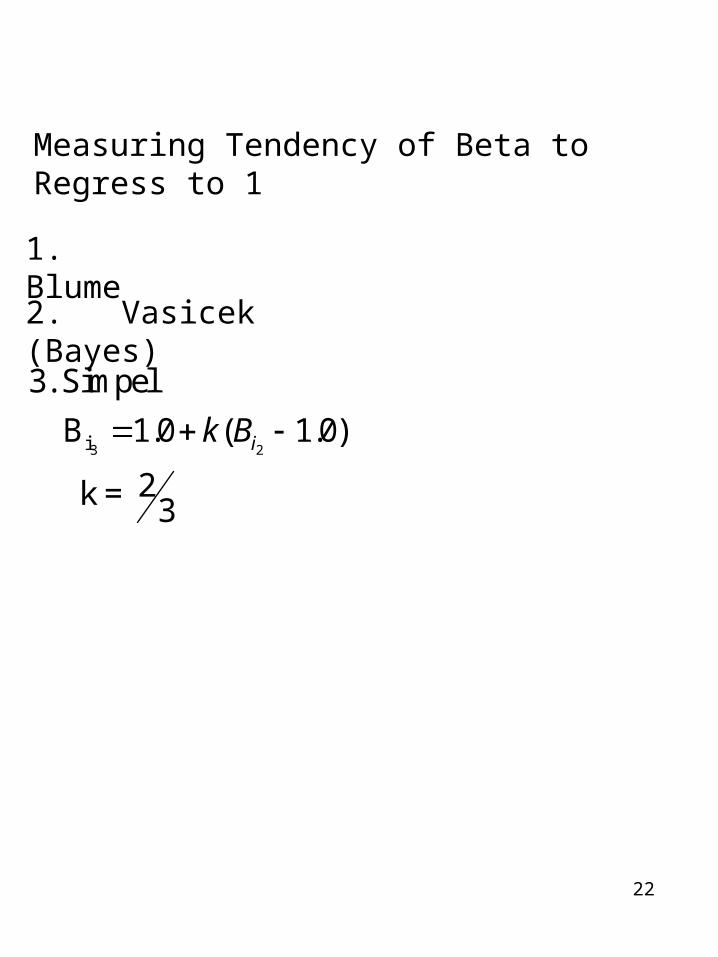
Measuring Tendency of Beta to Regress to 1
1. Blume
2. Vasicek (Bayes)
3 2i
3. Simpel
B 1.0 ( 1.0)
2 k = 3
ik B
23

24
Vasicek
2
2
22 i2
2
ˆ i2i3 1 1
2 2
i2

25
How Well Do They Forecast Future Betas
1. Vasicek2. Blume3. Unadjusted4. All Betas = 1.0
26
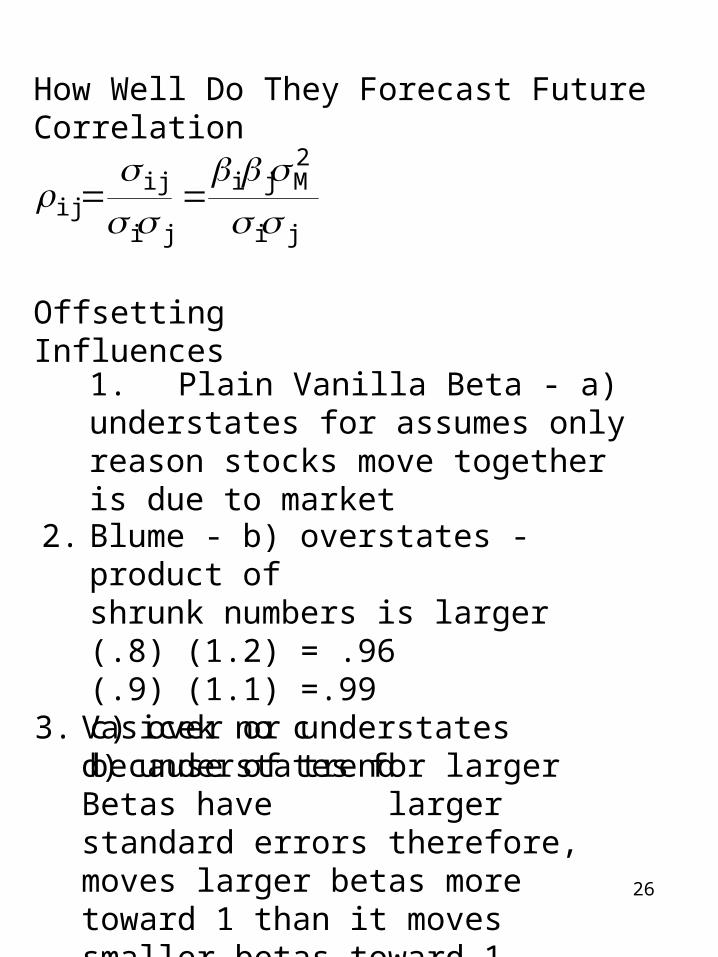
How Well Do They Forecast Future Correlation
ji
2Mji
ji
ijij
Offsetting Influences
1. Plain Vanilla Beta - a) understates for assumes only reason stocks move together is due to market
Blume - b) overstates - product of shrunk numbers is larger (.8) (1.2) = .96(.9) (1.1) =.99 c) over or understates because of trend
2.
Vasicek no c
d) understates for larger Betas have larger standard errors therefore, moves larger betas more toward 1 than it moves smaller betas toward 1.
3.

27
Which of these biases are more important - empirical matter - ranking when adjust for mean
1. Vasicek2. Blume3. Plain Vanilla Beta4. Beta = 15. Historical
28
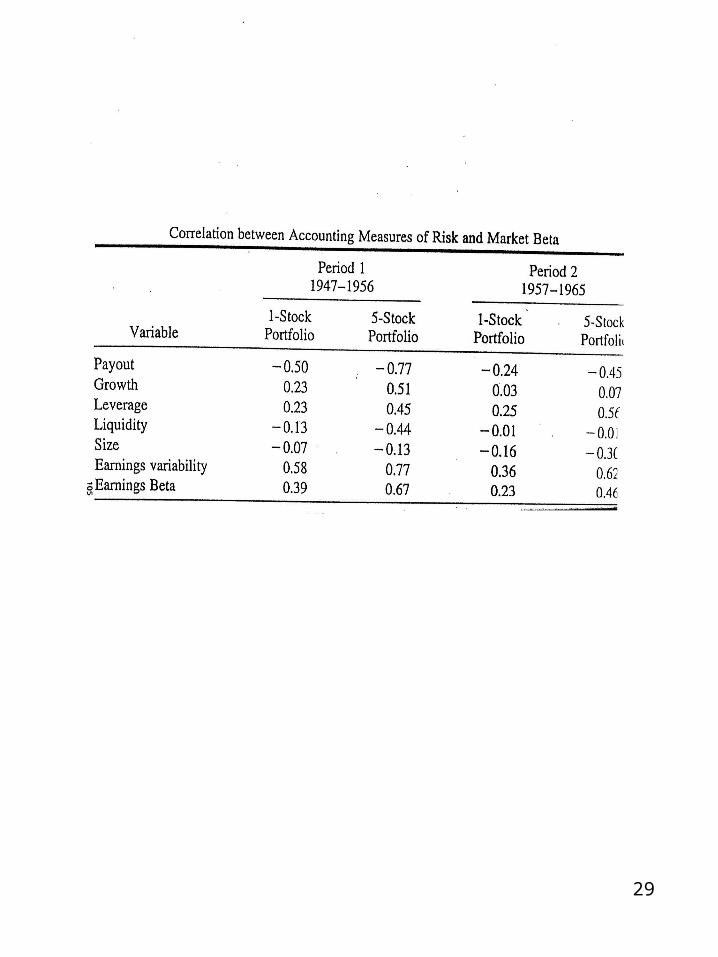
Can we do better - Round 1- Fundamental Betas
Why look at Fundamental Variables
1. Betas are risk measures - they should be related to fundamental variables
2. Betas are typically based on 60 months of data what happens is something changes 10 months after.
29
30
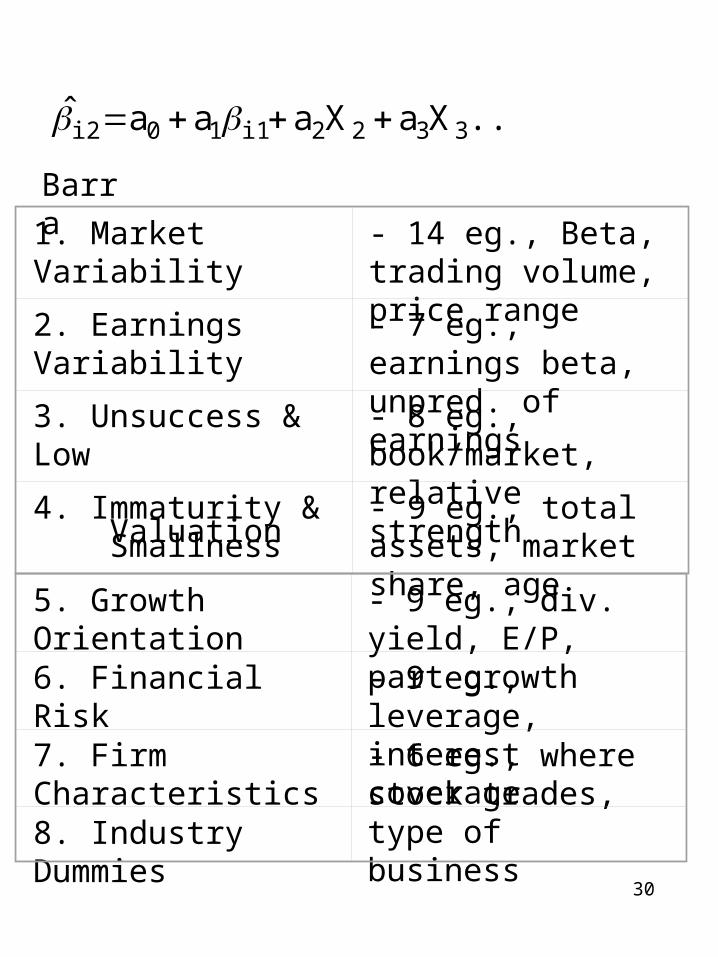
....XaXaaaˆ3322i110i2
Barra
1. Market Variability - 14 eg., Beta, trading volume, price range
2. Earnings Variability - 7 eg., earnings beta, unpred. of earnings
3. Unsuccess & Low Valuation
- 8 eg., book/market, relative strength
4. Immaturity & Smallness
- 9 eg., total assets, market share, age
5. Growth Orientation - 9 eg., div. yield, E/P, part growth
6. Financial Risk - 9 eg., leverage, interest coverage
7. Firm Characteristics - 6 eg., where stock trades, type of business
8. Industry Dummies
31
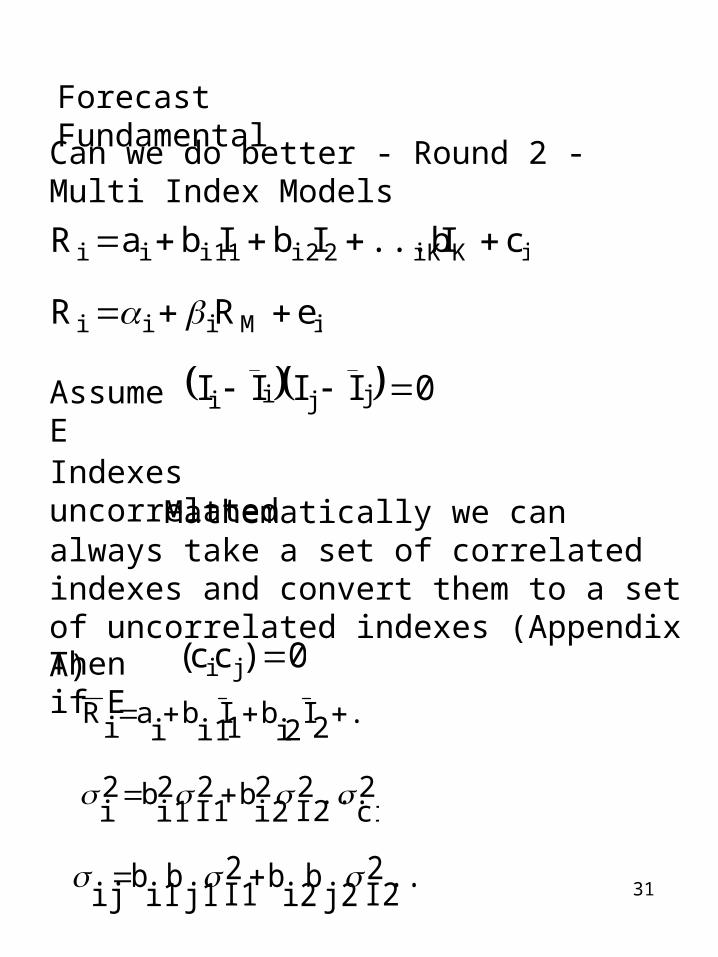
Forecast Fundamental
Can we do better - Round 2 - Multi Index Models
iKiK2i21i1ii cI...bIbIbaR
iMiii eRR
Assume E 0IIII jjii
Indexes uncorrelated Mathematically we can always take a set of correlated indexes and convert them to a set of uncorrelated indexes (Appendix A)
Then if E 0)cc( ji
...2I2ib1Ii1
bi
aiR
2ci
...2I2
2i2
b2I1
2i1
b2i
....2I2j2
bi2
b2I1j1
bi1
bij
32
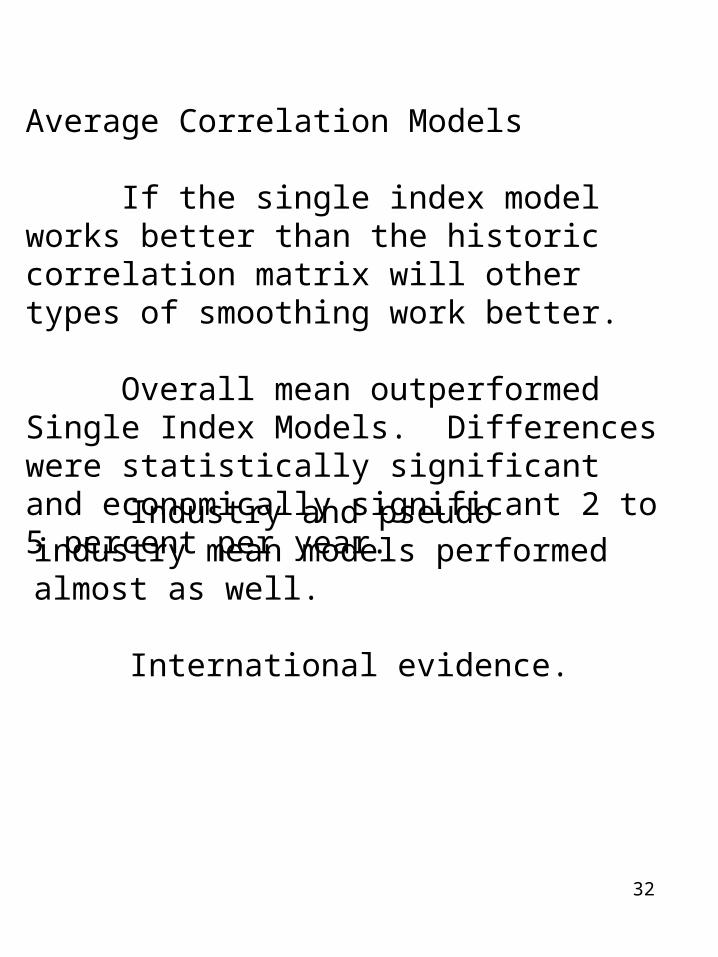
Average Correlation Models
If the single index model works better than the historic correlation matrix will other types of smoothing work better.
Overall mean outperformed Single Index Models. Differences were statistically significant and economically significant 2 to 5 percent per year.
Industry and pseudo industry mean models performed almost as well.
International evidence.