Embed Size (px)
Citation preview
Regional 1% Water ConservationProgram 2002 Annual Report
March 2003
Saving Water Partnership2002 ANNUAL REPORT
2
Regional 1% Water ConservationProgram 2002 Annual Report
CONTENTS
1. SUMMARY OF 2002 4
2. PROGRAM DESIGN 11
3. PERFORMANCE BY SECTOR 17Residential Indoor Use 17Residential Landscape Use 20Commercial Process and Domestic Use 26Commercial Landscape and Irrigation Use 28Overall Messaging 29Youth Education 31Evaluation and Monitoring 33
4. CONSUMPTION ANALYSIS 37
5. REBATED EQUIPMENT BY WATER PROVIDER 43
Saving Water Partnership2002 ANNUAL REPORT
3
ACKNOWLEDGEMENTS
SEATTLE PUBLIC UTILITIESChuck Clarke, Director
Nancy Ahern, Deputy Director, Resource Management BranchTim Croll, Director, Community Services DivisionRich Gustav, Resource Conservation ManagerAl Dietemann, 1% Conservation Program Lead
Mialee Jose, 1% Annual Report Project Manager
SEATTLE WATER SYSTEM CONSERVATION TECHNICAL FORUMDeborah Rannfeldt, Chair, Woodinville Water District
Residential Indoor Working Group (Including Multifamily)Susan Fife-Ferris (City of Bellevue), Agnes Hicks (Skyway Water and Sewer District), Barbara
Sullivan (City of Redmond), Laurie Van Leuven (Highline Water District), John Thompson (K. C.Water District #125), David Broustis (SPU), Mialee Jose (SPU), Billie Fisher (SPU), Arece
Hampton (SPU)
Residential Outdoor Working Group (Excluding Multifamily)Patricia Burgess (City of Bellevue), Barbara Sullivan (City of Redmond), Laurie Van Leuven
(Highline Water District), Mike Brent (Northshore Utility District), Deborah Rannfeldt (WoodinvilleWater District), Nota Lucas (SPU), Liz Fikejs (SPU), Jenna Smith (SPU), Linda Summers
(SPU), Carl Woestwin (SPU), David McDonald (SPU)
Commercial Domestic, Process, and Landscape Working GroupLaurie Van Leuven (Highline Water District), Vikki VanDuyne (City of Bellevue), Bill Anderson
(Business & Industry Recycling Venture), Roger Van Gelder (Roger Van Gelder & Associates),Phil Paschke (SPU), Hans Van Dusen (SPU), Jenna Smith (SPU)
Overall Messaging Working GroupMike Brent (Northshore Utility District), Patricia Burgess (City of Bellevue), Deborah Rannfeldt(Woodinville Water District), Barbara Sullivan (City of Redmond), Laurie Van Leuven (Highline
Water District), Cornell Amaya (SPU), Mialee Jose (SPU)
Youth Education Working GroupDebbie Rannfeldt (Woodinville Water District), Patricia Burgess (City of Bellevue), Susan Fife-Ferris (City of Bellevue), Mike Brent (Northshore Utility District), Laurie VanLeuven (Highline
Water District), Barbara Sullivan (City of Redmond), Mike Mercer (SPU),
Evaluation Working GroupMargaret Wiggins (Northshore Utility District), John Thompson (KC Water District #125), Hans
Van Dusen (SPU), Tim Skeel (SPU)
Special ThanksTim Skeel (SPU Resource Planning Division), Bruce Flory (SPU Finance Division), Hans VanDusen (SPU Community Services Division), Jenna Smith (SPU Community Services Division)
Saving Water Partnership2002 ANNUAL REPORT
4
1. SUMMARY OF 2002The regional 1% Water Conservation Program (1% Program) sponsored by the Saving WaterPartnership (SWP) brought new programs on line, established new program directions, andexceeded water savings targets for 2002. For several program components, 2002 effortsrepresented a major expansion from 1% Program implementation to date. New elements suchas rebates for multifamily toilets and retailer discounts for natural yard care products weredesigned and implemented, while increased promotion of mature programs such as Wash Wiseand Water Smart Technology produced significant customer participation and savings. Avariety of program development efforts are contributing to program direction for 2003 andbeyond.
The 2001 drought and water use curtailment messages produced a significant carry-over effecton 2002 regional water consumption. In addition, Seattle Public Utilities (SPU) experienced arevenue shortfall as a result of the drought, which impacted 2002 1% Program implementation. Low regional water consumption and customers’ continuing high awareness of both curtailmentand conservation messages enabled the program to de-emphasize overall conservationmessages compared to prior years. In November and December of 2002, water shortageconditions occurred again, garnering media attention on curtailment and conservationmessages at no cost to the 1% Program. The added media attention provided a boost to 1%Program behavioral savings.
While the focus of this report is the 1% Program, efforts other than 1% will be discussed in orderto describe total savings in the water system. Based on consumption analysis, 1% Programefforts helped customers implement conservation behaviors and equipment replacement thatproduced 1.2 million gallons per day (MGD) in new long-term savings, surpassing 2002 targetsby 8%, but 29% below the ten-year average annual savings target of 1.7 MGD. 0.5 MGD ofthese conservation savings were from new fixtures and equipment. The remaining 0.7 MGDwere generated by new permanent conservation behaviors. Carry-over from the 2001 droughtcurtailment efforts, combined with the impacts of an economic downturn that affectedcommercial water use, produced an estimated 4 MGD of transitory savings that are expected toerode over the next few years. Of the 4 MGD, 2.3 MGD is estimated to be drought carry-over,which is roughly the amount that was expected, while 1.7 MGD is estimated to be the impact ofthe economic downturn. Non-1% Program savings included an additional 1.25 MGD from theimpacts of water rates and plumbing codes (predicted in existing demand forecasts).
The Regional 1% ProgramThis report reviews annual progress of the regional 1% Program. For this review, the 'region'refers to all customers served by the Seattle Public Utilities (SPU) water supply system.Twenty-six local water providers initiated the regional 1% Water Conservation Program in 2000,targeting water conservation savings of 1% per capita per year through 2010, for a total savingsgoal of 18 MGD. The regional program includes expansion of existing programs anddevelopment of new cost-effective conservation programs from measures identified in the 1998regional Conservation Potential Assessment.1 Section 2 of this report reviews the short andlong-term program design for the 1% Program. A Ten Year Water Conservation Program Plan2
was completed in 2002, detailing program budgets, savings targets and implementationstrategies through 2010.
Saving Water Partnership2002 ANNUAL REPORT
5
2002 Goals and StrategiesThe 2002 1% savings goal was 1.12 MGD. This goal was lower than 2001, reflecting loweravailable funding following the 2001 drought. Average annual targets for subsequent years areexpected to be near 1.7 MGD and provide 18 MGD in total program water savings by 2010.Annual budgets and targets are included in the Ten Year Water Conservation Program Plan3.
The 1% Program fixture and equipment rebate programs for residential and commercialcustomers were designed to expand on previous success with residential washing machinesand with a variety of commercial fixtures and technologies. In addition the 1% Programundertook development of new residential multifamily toilet rebates and residential landscapeaudits and irrigation hardware testing. 1% Program outreach and technical assistance wasfocussed on delivering permanent behavior changes. Specific sector goals for conservationefforts are presented in Table 2.
Marketing strategies to increase rebates and long-term conservation behaviors employed massmedia, direct mailings, new program materials, new web and hotline resources, seminars andworkshops, agency and trade association partnerships and a host of targeted promotions.Customer research showed high recall of the water shortage messages of 2001, so overallmessaging efforts to reinforce the ‘conservation ethic’ were reduced compared to 2000 and2001. Instead, advertising focused primarily on attracting participation in specific rebatepromotions and behavioral practices.
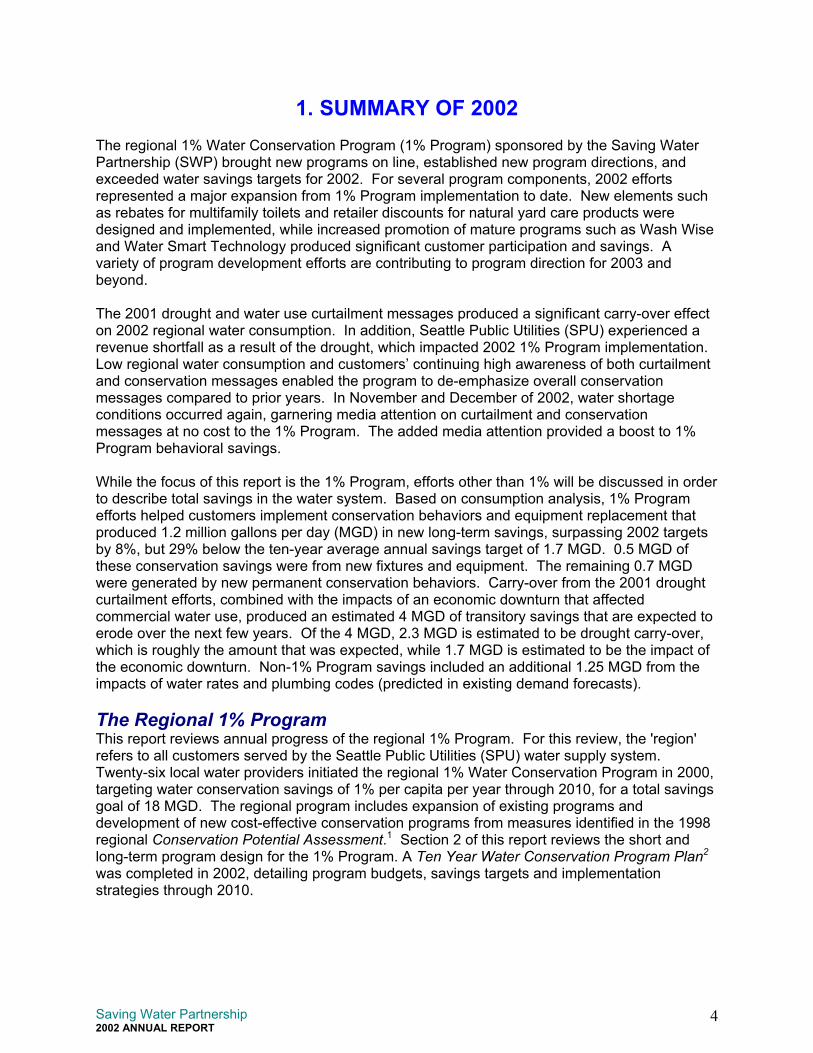
2002 1% Program Performance Water use for 2002 was significantly below the original 1% Program target set in 1999, due to acombination of factors. According to initial modeling and analysis, weather-adjusted per capitawater use was about 7% below the 1% Program target for 2002. Chart 1 shows how weatherand the 1% Program have affected per capita use. The carry-over of drought curtailmentimpacts from 2001 and continuing economic slowdown have contributed a large share to thereduced water use. A more detailed description of Chart 1 is provided in Section 4, page 37.
Chart 1: Regional Per Capita Customer Use
Saving Water Partnership2002 ANNUAL REPORT
6
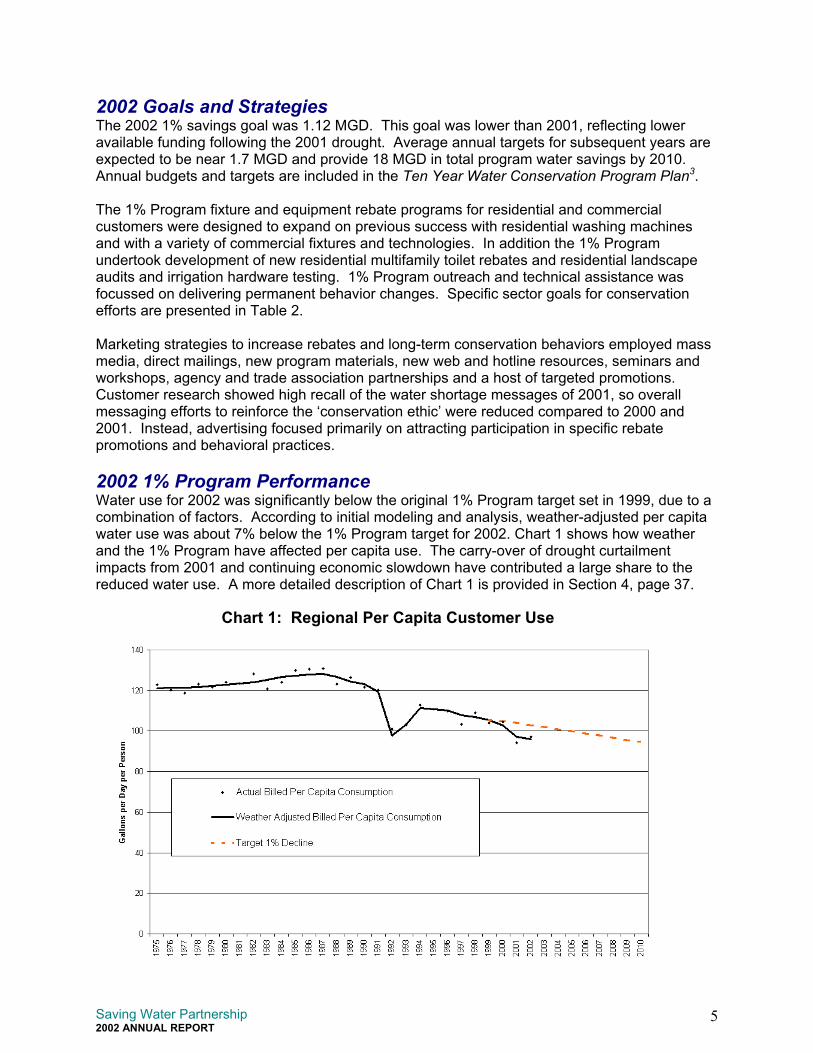
New water savings achieved in 2002 include long-term savings and transitory, or temporarysavings. Long-term savings include both the direct and indirect impacts from incentives,education and promotion of the 1% Program – these savings are the focus of this report. Long-term savings also include savings that would come from higher water rates and plumbing fixturecodes. All long-term savings are included in SPU’s demand forecast, whereas transitorysavings are not. Transitory savings come from above-normal system (non-revenue) savingsand from temporary drought curtailment actions, as well as from the 2002 slowing of economicactivity in the regional service area. Table 1 below provides estimates for long-term andtransitory savings from 2002, with more detailed analysis provided in Chapter 4.
Table 1: New Water Savings Achieved in 2002 (MGD) New Long-Term Customer Savings Transitory Savings Total6
1% ConservationProgram
Rates Code SeattleLow
Income3
Total Curtailment&
Economy4
System Total
Hardware2 Behavior ResidentialIndoor1
0.29 0.1 0.3 0.5 0.3 1.5 0.7 - 0.7 2.1
ResidentialLandscape
<0.01 0.3 0.1 - - 0.4 0.6 - 0.6 1.0
CommercialDomestic
0.04 0.2 0.0 0.3 - 0.5 0.9 - 0.9 1.4
CommercialProcess
0.15 0.1 0.1 - - 0.4 1.6 - 1.6 2.0
CommercialLandscape1
0.01 <0.1 <0.1 - - 0.1 0.2 - 0.2 0.3
2002 Total7 0.5 0.7 0.5 0.8 0.3 2.8 4.05 2.0 6.0 8.81Includes Multifamily2Savings from fixture replacement and equipment upgrade programs can be measured with greaterprecision than other sources of savings in this table.3Seattle low-income savings are separate from and in addition to the 1% Program as required by SeattleOrdinance 120532. These savings resulted from toilet retrofits completed in low-income housing in2002.4Includes impact of curtailment carry-over from 2001 drought (2.3 MGD) and temporarily depressedeconomic conditions (1.7 MGD) in 2002.54.0 MGD in 2002 indicates that 1 MGD of the 2001 transitory savings has eroded and that 4 MGD oftransitory savings are still expected to erode as time passes.6Savings are weather-adjusted from 2002 forecast.
7Some totals may not add due to rounding.
Long-term savings remain slightly ahead of target in relation to the 10 year 1% Program plan.However, savings are below the average annual target of 1.7 MGD and will need to be made upin later years as shown in the Ten Year Water Conservation Program Plan4. Table 1 shows thetransitory savings that occurred in 2002, and that the 5 MGD of curtailment savings from 2001has eroded by 1 MGD. SPU estimates that 1.7 MGD of the remaining 4 MGD of curtailmentsavings is attributable to the economic slowdown in the commercial sector. This indicates thatthe remaining 2.3 MGD of curtailment savings from the 2001 drought is eroding in line withprevious projections. Together, the total 2002 transitory and long-term savings add up to 8.8
Saving Water Partnership2002 ANNUAL REPORT
PROGRAM SECTOR
Residential IndoorBehavioral & Outreac
Hardware Incentive
Res. LandscapeBehavioral & Outreac
Hardware Incentive
Comm DomesticBehavioral & Outreac
Hardware Incentive
Comm ProcessBehavioral & Outreac
Hardware Incentive
Comm LandscapeBehavioral & Outreac
Hardware Incentive
Umbrella MessagingYouth Education,1Customer Research,684-SAVE,Savingwater.org,CPA, Other
TotalsBehavioral & Outreac
Hardware Incentive
1Umbrella and Yonot have savings 2Some totals may
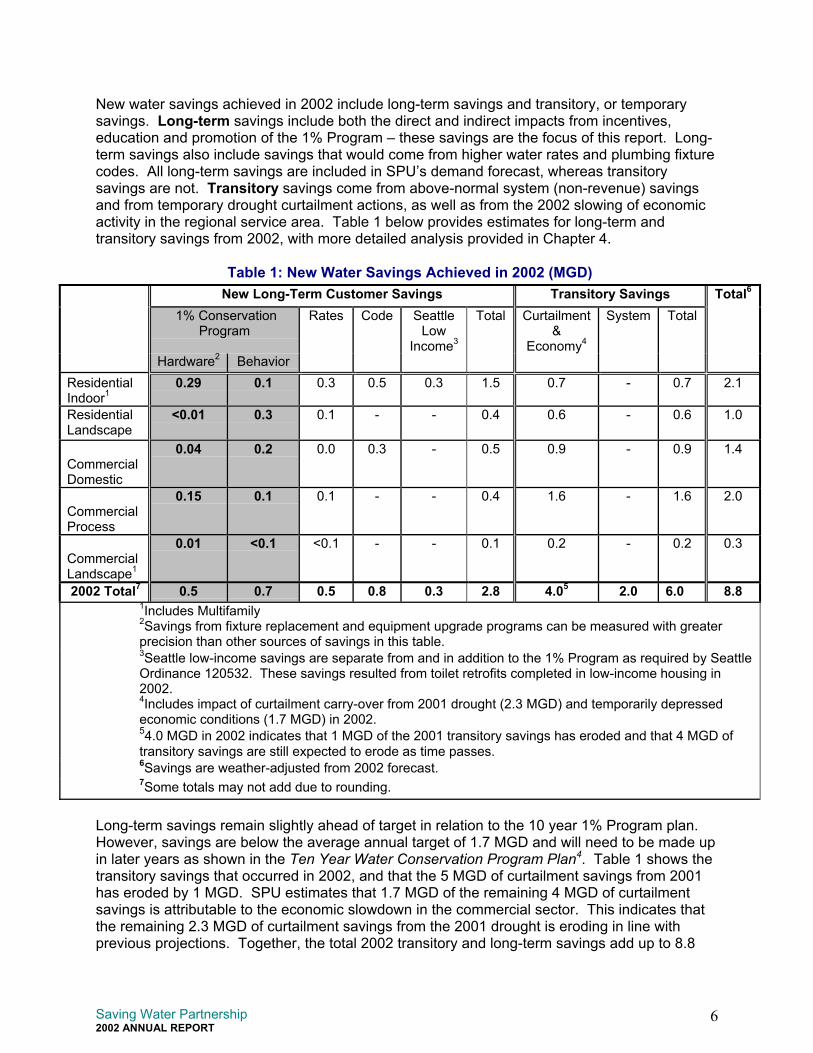
MGD, which is the difference between the “no-conservation“ forecast and actual demand for2002. Again, more detailed analysis is provided in Chapter 4.Conservation goals and estimated new savings for each sector are summarized in Table 2below. For each sector, savings are estimated for behavioral incentives and outreach efforts,hardware incentives and curtailment messages:
Behavioral Incentives and Outreach savings include permanent conservation achievedwith and without incentives to invest primarily in new behaviors. These savings are estimatedto be 0.7 MGD in 2002. These estimates are based on information presented in Section 4.
Hardware Incentive savings include new fixtures and equipment upgrades that weresupported with program incentives, as well as accelerated fixtures (beyond rates and code)that were upgraded without rebates. Based on program records, these savings are estimatedto be 0.48 MGD in 2002.
Table 2: 2002 PerformanceEXPENDITURES
($1,000)2002 WATER SAVINGS
(1,000 GPD)Goal Conservation
AchievedCurtailment& Economy
$1,310 610 386 700h 100 700s 286
$704 100 304 600h 300 600s 4
$166 41 245 900h 200 900s 45
$567 328 246 1,600h 100 1,600s 146
$149 41 34 200h 25 200s 9
1 $681
$3,577 1,120 1,2142 4,000h 725 4,000
7
s 4902
uth elements are considered drivers for other elements and dotargets tied directly to them. not add due to rounding.
Saving Water Partnership2002 ANNUAL REPORT
8
Curtailment and economy savings include transitory behavior or operational changes, aswell as savings from other temporary impacts such as slower economic activity. Thesesavings were estimated to be about 5 MGD in 2001 and 4 MGD in 2002. Much of the 2001drought messaging stressed temporary curtailment actions, but some of these behaviors canbecome long-term conservation actions if reinforced through long-term conservation programefforts
Sector Highlights
Residential indoor programs continued to ramp up in 2002. Multifamily toilet rebates expandedto a full-scale program and achieved double their savings goal. WashWise rebates matchedlast year’s output despite a slow economy and despite lowering the rebate from $100 to $75.Increased materials at retailers, increased advertising, and a special fall promotion that offeredhigher rebates for the most efficient machines all contributed to meeting rebate goals. Articleswere published in utility newsletters and new materials were developed to support new behaviorchanges.
Residential landscape efforts included development of new incentives for behavior change,including NW Natural Yard Days, and programs to test on-site audits and new irrigation devices.Educational efforts expanded successful outreach partnerships with 29 nurseries across theservice region, who distributed 33,000 educational fact sheets — double the participation of2001. Three new Natural Lawn & Garden guides on Choosing the Right Plants, Natural PestControl, and Composting provided regional residents with tools to reduce outdoor water usewhile creating a healthy landscape. Training for home gardeners and landscape professionalsreached thousands of citizens and professionals. Radio and print ads promoted landscapeconservation messages, program opportunities at local nurseries, and regional events.
Commercial, industrial and institutional facilities implemented more than 65 financialincentive projects in 2002. Major projects were completed at the University of Washington,Group Health Hospital and Lake Washington School District. Nearly 20 smaller projectsprovided rebates to eliminate pass-through cooling in refrigeration and ice machines. Freetechnical assistance, seminars and irrigation audits were provided to hundreds more throughthe Water Smart Technology and Water Efficient Irrigation Programs. New promotionpartnerships were created with trade groups, other utilities and agencies, and other serviceproviders.
Youth and education programs offered new school resources and training in 2002, includingdistribution of new conservation kits, one "Water Matters" teacher training workshop, anddevelopment of an on-line interactive map of the regional water system. The program alsoproduced an educational TV ad for kids, featuring Bert the Salmon, and supported the ad with asignificant presence at KOMO Kids Fair.
Six purveyor working groups met throughout the year to guide the implementation ofResidential Indoor, Residential Landscape, Marketing, Commercial, Education and Evaluationefforts.
Saving Water Partnership2002 ANNUAL REPORT
9
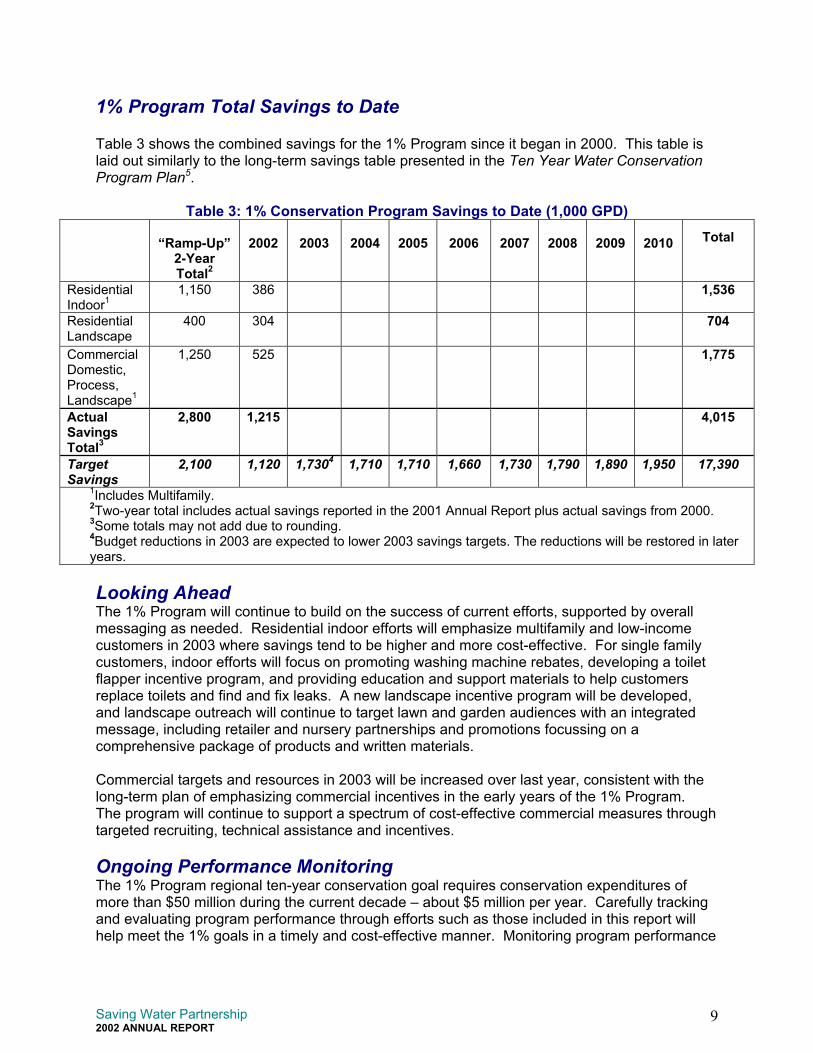
1% Program Total Savings to Date
Table 3 shows the combined savings for the 1% Program since it began in 2000. This table islaid out similarly to the long-term savings table presented in the Ten Year Water ConservationProgram Plan5.
Table 3: 1% Conservation Program Savings to Date (1,000 GPD)
“Ramp-Up”2-YearTotal2
2002 2003 2004 2005 2006 2007 2008 2009 2010 Total
Residential Indoor1
1,150 386 1,536
ResidentialLandscape
400 304 704
CommercialDomestic,Process,Landscape1
1,250 525 1,775
ActualSavingsTotal3
2,800 1,215 4,015
TargetSavings
2,100 1,120 1,7304 1,710 1,710 1,660 1,730 1,790 1,890 1,950 17,390
1Includes Multifamily.2Two-year total includes actual savings reported in the 2001 Annual Report plus actual savings from 2000.3Some totals may not add due to rounding.4Budget reductions in 2003 are expected to lower 2003 savings targets. The reductions will be restored in lateryears.
Looking AheadThe 1% Program will continue to build on the success of current efforts, supported by overallmessaging as needed. Residential indoor efforts will emphasize multifamily and low-incomecustomers in 2003 where savings tend to be higher and more cost-effective. For single familycustomers, indoor efforts will focus on promoting washing machine rebates, developing a toiletflapper incentive program, and providing education and support materials to help customersreplace toilets and find and fix leaks. A new landscape incentive program will be developed,and landscape outreach will continue to target lawn and garden audiences with an integratedmessage, including retailer and nursery partnerships and promotions focussing on acomprehensive package of products and written materials.
Commercial targets and resources in 2003 will be increased over last year, consistent with thelong-term plan of emphasizing commercial incentives in the early years of the 1% Program.The program will continue to support a spectrum of cost-effective commercial measures throughtargeted recruiting, technical assistance and incentives.
Ongoing Performance Monitoring The 1% Program regional ten-year conservation goal requires conservation expenditures ofmore than $50 million during the current decade – about $5 million per year. Carefully trackingand evaluating program performance through efforts such as those included in this report willhelp meet the 1% goals in a timely and cost-effective manner. Monitoring program performance
Saving Water Partnership2002 ANNUAL REPORT
10
will ensure that resources are put to their best use and that the programs are managed forhighest efficiency. This information will also help identify the need for mid-course correctionsand fine-tuning adjustments as the program proceeds toward the goal. This document is thesecond of an annual series of reports designed to inform and guide the program toward its goal.
End Notes 1 Conservation Potential Assessment, Seattle Public Utilities, 1998,http://www.ci.seattle.wa.us/util/RESCONS/CPA/default.htm.
2 Ten Year Conservation Program Plan, Seattle Public Utilities, 2002,www.cityofseattle.net/util/RESCONS/papers/tenyearplan.pdf.
3 Ten Year Conservation Program Plan, Seattle Public Utilities, 2002,www.cityofseattle.net/util/RESCONS/papers/tenyearplan.pdf.
4 Ten Year Conservation Program Plan, Seattle Public Utilities, 2002,www.cityofseattle.net/util/RESCONS/papers/tenyearplan.pdf.
5 Ten Year Conservation Program Plan, Seattle Public Utilities, 2002,www.cityofseattle.net/util/RESCONS/papers/tenyearplan.pdf.
2. Program Design
Regional 1% Program and 10-year GoalThe Saving Water Partnership is committed to an ambitious effort to reduce per capita wateruse in the regional service area by 1% every year through 2010. To accomplish the ten-yeargoal, local water providers will reduce per capita water use by about 1% each year for the nextten years. More detailed strategies and goals for the 10-year program and beyond arepresented in the Ten Year Water Conservation Program Plan6.
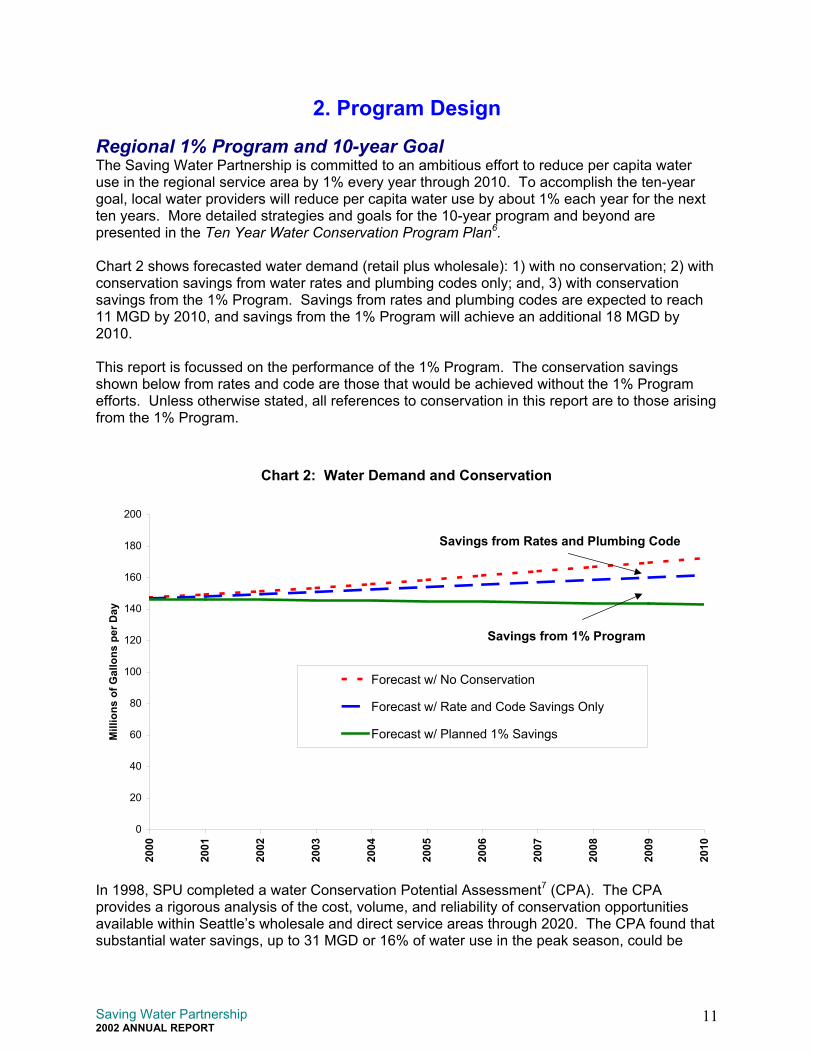
Chart 2 shows forecasted water demand (retail plus wholesale): 1) with no conservation; 2) withconservation savings from water rates and plumbing codes only; and, 3) with conservationsavings from the 1% Program. Savings from rates and plumbing codes are expected to reach11 MGD by 2010, and savings from the 1% Program will achieve an additional 18 MGD by2010.
This report is focussed on the performance of the 1% Program. The conservation savingsshown below from rates and code are those that would be achieved without the 1% Programefforts. Unless otherwise stated, all references to conservation in this report are to those arisingfrom the 1% Program.
Saving Water Partnership2002 ANNUAL REPORT
11
In 1998, SPU completed a water Conservation Potential Assessment7 (CPA). The CPAprovides a rigorous analysis of the cost, volume, and reliability of conservation opportunitiesavailable within Seattle’s wholesale and direct service areas through 2020. The CPA found thatsubstantial water savings, up to 31 MGD or 16% of water use in the peak season, could be
Chart 2: Water Demand and Conservation
0
20
40
60
80
100
120
140
160
180
200
2000
2001
2002
2003
2004
2005
2006
2007
2008
2009
2010
Mill
ions
of G
allo
ns p
er D
ay
Forecast w/ No Conservation
Forecast w/ Rate and Code Savings Only
Forecast w/ Planned 1% Savings
Savings from Rates and Plumbing Code
Savings from 1% Program
Saving Water Partnership2002 ANNUAL REPORT
12
achieved over the next 20 years with no reduction in customers’ ability to use water or theirsatisfaction with water services.
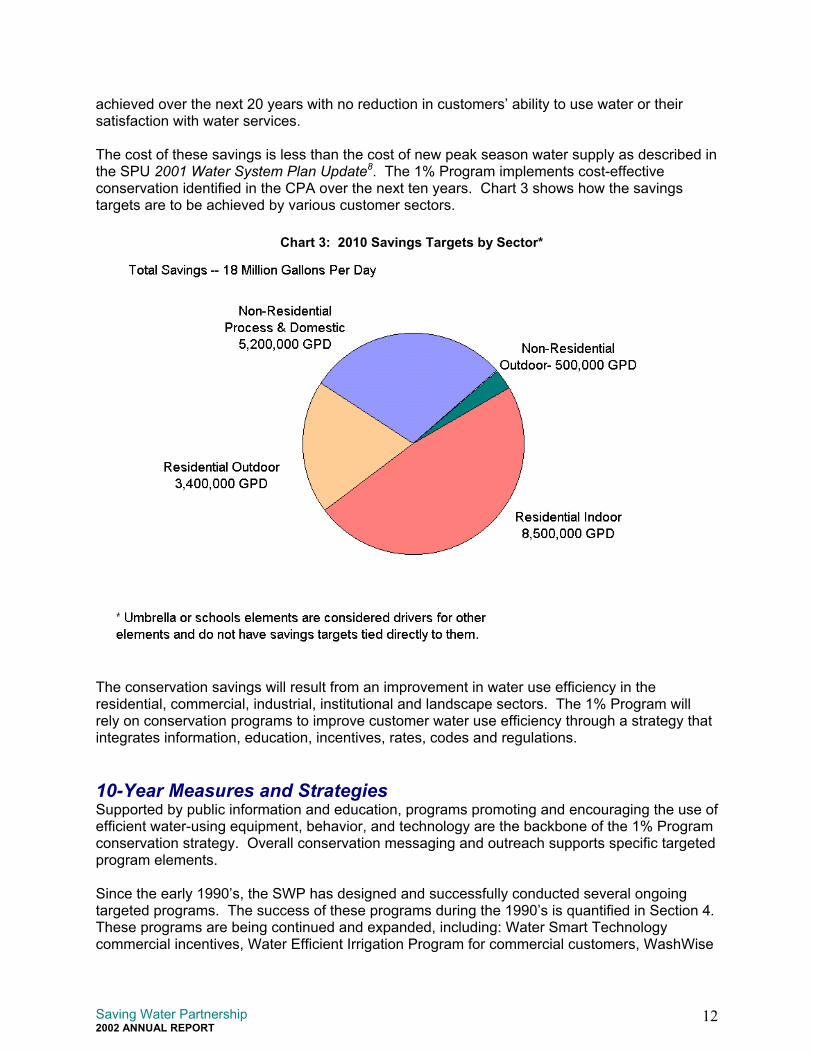
The cost of these savings is less than the cost of new peak season water supply as described inthe SPU 2001 Water System Plan Update8. The 1% Program implements cost-effectiveconservation identified in the CPA over the next ten years. Chart 3 shows how the savingstargets are to be achieved by various customer sectors.
The conservation savings will result from an improvement in water use efficiency in theresidential, commercial, industrial, institutional and landscape sectors. The 1% Program willrely on conservation programs to improve customer water use efficiency through a strategy thatintegrates information, education, incentives, rates, codes and regulations.
10-Year Measures and StrategiesSupported by public information and education, programs promoting and encouraging the use ofefficient water-using equipment, behavior, and technology are the backbone of the 1% Programconservation strategy. Overall conservation messaging and outreach supports specific targetedprogram elements.
Since the early 1990’s, the SWP has designed and successfully conducted several ongoingtargeted programs. The success of these programs during the 1990’s is quantified in Section 4.These programs are being continued and expanded, including: Water Smart Technologycommercial incentives, Water Efficient Irrigation Program for commercial customers, WashWise
Chart 3: 2010 Savings Targets by Sector*
Saving Water Partnership2002 ANNUAL REPORT
13
water-efficient washing machine rebates for residential customers, and Natural Lawn & Gardentechniques for residential landscapes. In addition, new targeted hardware and behaviorprograms have been designed and are being implemented for residential landscape andresidential indoor uses. These new programs are discussed in more detail in Section 3.
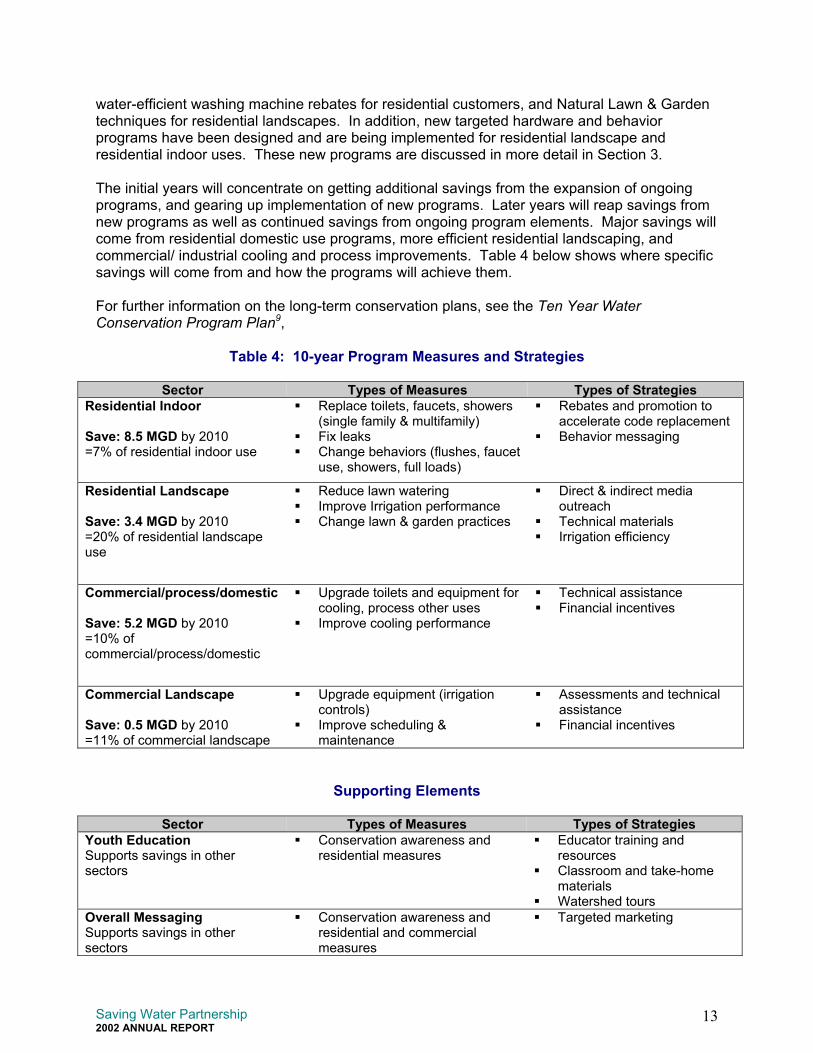
The initial years will concentrate on getting additional savings from the expansion of ongoingprograms, and gearing up implementation of new programs. Later years will reap savings fromnew programs as well as continued savings from ongoing program elements. Major savings willcome from residential domestic use programs, more efficient residential landscaping, andcommercial/ industrial cooling and process improvements. Table 4 below shows where specificsavings will come from and how the programs will achieve them.
For further information on the long-term conservation plans, see the Ten Year WaterConservation Program Plan9,
Table 4: 10-year Program Measures and Strategies
Sector Types of Measures Types of StrategiesResidential Indoor Save: 8.5 MGD by 2010=7% of residential indoor use
Replace toilets, faucets, showers(single family & multifamily)
Fix leaks Change behaviors (flushes, faucet
use, showers, full loads)
Rebates and promotion toaccelerate code replacement
Behavior messaging
Residential Landscape Save: 3.4 MGD by 2010=20% of residential landscapeuse
Reduce lawn watering Improve Irrigation performance Change lawn & garden practices
Direct & indirect mediaoutreach
Technical materials Irrigation efficiency
Commercial/process/domestic Save: 5.2 MGD by 2010=10% ofcommercial/process/domestic
Upgrade toilets and equipment forcooling, process other uses
Improve cooling performance
Technical assistance Financial incentives
Commercial Landscape
Save: 0.5 MGD by 2010=11% of commercial landscape
Upgrade equipment (irrigationcontrols)
Improve scheduling &maintenance
Assessments and technicalassistance
Financial incentives
Supporting Elements
Sector Types of Measures Types of StrategiesYouth EducationSupports savings in othersectors
Conservation awareness andresidential measures
Educator training andresources
Classroom and take-homematerials
Watershed toursOverall MessagingSupports savings in othersectors
Conservation awareness andresidential and commercialmeasures
Targeted marketing
Saving Water Partnership2002 ANNUAL REPORT
14
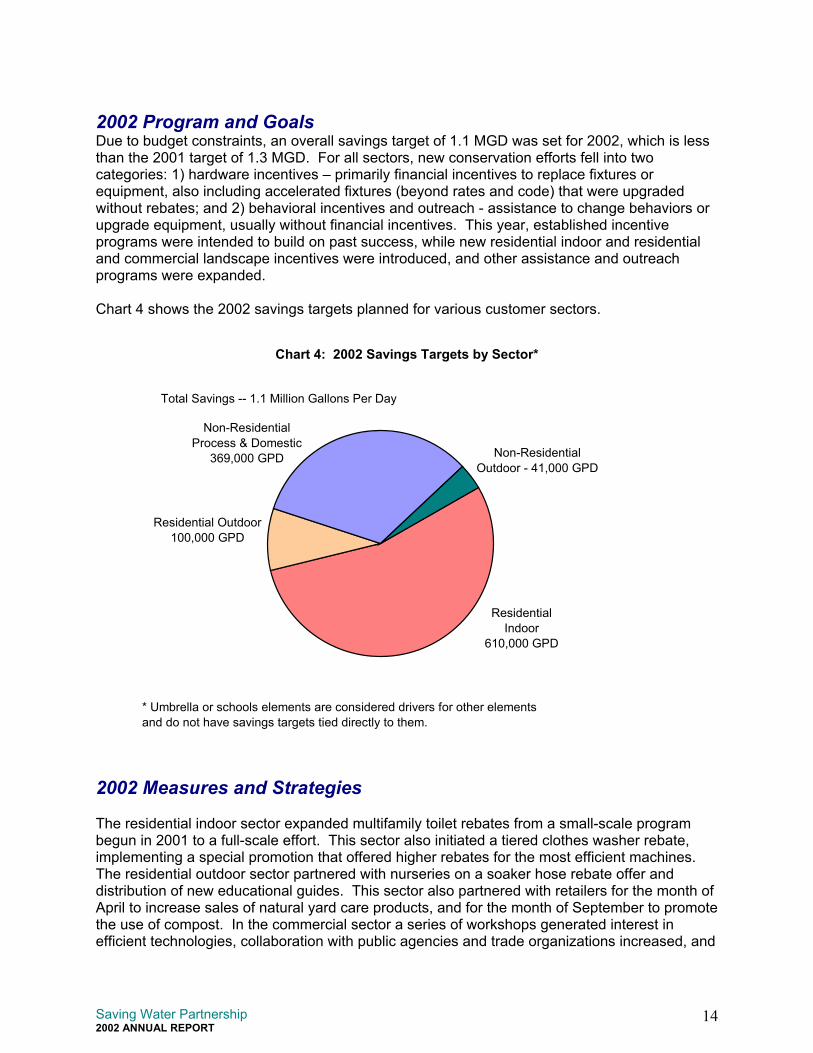
2002 Program and GoalsDue to budget constraints, an overall savings target of 1.1 MGD was set for 2002, which is lessthan the 2001 target of 1.3 MGD. For all sectors, new conservation efforts fell into twocategories: 1) hardware incentives – primarily financial incentives to replace fixtures orequipment, also including accelerated fixtures (beyond rates and code) that were upgradedwithout rebates; and 2) behavioral incentives and outreach - assistance to change behaviors orupgrade equipment, usually without financial incentives. This year, established incentiveprograms were intended to build on past success, while new residential indoor and residentialand commercial landscape incentives were introduced, and other assistance and outreachprograms were expanded.
Chart 4 shows the 2002 savings targets planned for various customer sectors.
2002 Measures and Strategies
The residential indoor sector expanded multifamily toilet rebates from a small-scale programbegun in 2001 to a full-scale effort. This sector also initiated a tiered clothes washer rebate,implementing a special promotion that offered higher rebates for the most efficient machines.The residential outdoor sector partnered with nurseries on a soaker hose rebate offer anddistribution of new educational guides. This sector also partnered with retailers for the month ofApril to increase sales of natural yard care products, and for the month of September to promotethe use of compost. In the commercial sector a series of workshops generated interest inefficient technologies, collaboration with public agencies and trade organizations increased, and
2002 Savings Targets by Sector*
Residential Indoor
610,000 GPD
Total Savings -- 1.1 Million Gallons Per Day
* Umbrella or schools elements are considered drivers for other elements and do not have savings targets tied directly to them.
Non-ResidentialProcess & Domestic
369,000 GPD Non-ResidentialOutdoor - 41,000 GPD
Residential Outdoor 100,000 GPD
Chart 4: 2002 Savings Targets by Sector*
Saving Water Partnership2002 ANNUAL REPORT
15
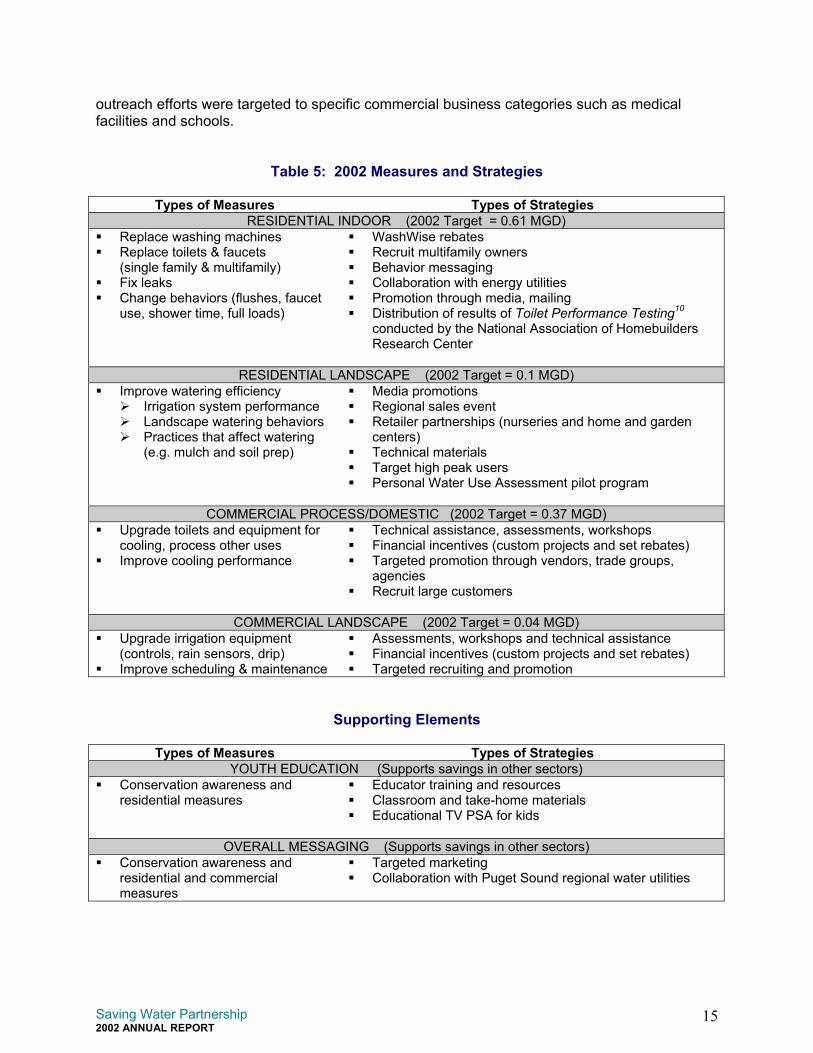
outreach efforts were targeted to specific commercial business categories such as medicalfacilities and schools.
Table 5: 2002 Measures and Strategies
Types of Measures Types of StrategiesRESIDENTIAL INDOOR (2002 Target = 0.61 MGD)
Replace washing machines Replace toilets & faucets
(single family & multifamily) Fix leaks Change behaviors (flushes, faucet
use, shower time, full loads)
WashWise rebates Recruit multifamily owners Behavior messaging Collaboration with energy utilities Promotion through media, mailing Distribution of results of Toilet Performance Testing10
conducted by the National Association of HomebuildersResearch Center
RESIDENTIAL LANDSCAPE (2002 Target = 0.1 MGD) Improve watering efficiency
Irrigation system performance Landscape watering behaviors Practices that affect watering
(e.g. mulch and soil prep)
Media promotions Regional sales event Retailer partnerships (nurseries and home and garden
centers) Technical materials Target high peak users Personal Water Use Assessment pilot program
COMMERCIAL PROCESS/DOMESTIC (2002 Target = 0.37 MGD) Upgrade toilets and equipment for
cooling, process other uses Improve cooling performance
Technical assistance, assessments, workshops Financial incentives (custom projects and set rebates) Targeted promotion through vendors, trade groups,
agencies Recruit large customers
COMMERCIAL LANDSCAPE (2002 Target = 0.04 MGD) Upgrade irrigation equipment
(controls, rain sensors, drip) Improve scheduling & maintenance
Assessments, workshops and technical assistance Financial incentives (custom projects and set rebates) Targeted recruiting and promotion
Supporting Elements
Types of Measures Types of StrategiesYOUTH EDUCATION (Supports savings in other sectors)
Conservation awareness andresidential measures
Educator training and resources Classroom and take-home materials Educational TV PSA for kids
OVERALL MESSAGING (Supports savings in other sectors) Conservation awareness and
residential and commercialmeasures
Targeted marketing Collaboration with Puget Sound regional water utilities
Saving Water Partnership2002 ANNUAL REPORT
16
End Notes 6 Ten Year Conservation Program Plan, Seattle Public Utilities, 2002,www.cityofseattle.net/util/RESCONS/papers/tenyearplan.pdf.
7 Conservation Potential Assessment, Seattle Public Utilities, 1998,http://www.ci.seattle.wa.us/util/RESCONS/CPA/default.htm.
8 2001 Water System Plan Update, Seattle Public Utilities, 2001,http://www.ci.seattle.wa.us/util/watersystemplan/default.htm
9 Ten Year Conservation Program Plan, Seattle Public Utilities, 2002,www.cityofseattle.net/util/RESCONS/papers/tenyearplan.pdf.
10 Water Closet Performance Testing, National Association of Homebuilders Research Center,September, 2002, http://www.savingwater.org/toilettest.htm.
Saving Water Partnership2002 ANNUAL REPORT
3. PERFORMANCE BY SECTOR
Some program customer sectors exceeded their performance targets in 2002 largely as a resultof exceptional behavior savings owing to the 2001 drought carry-over, the 2002 fall drought, andthe local economic downturn. Hardware rebate components of the program saw mixed resultsin 2002, in part due to the economic downturn. • The Water Smart Technology and Water Efficient Irrigation programs did not meet their
performance targets in 2002, but when these programs are viewed in combination withcommercial domestic and behavioral measures, the commercial sector overall exceeded itstarget by 28%. The Water Smart Technology program experienced a surge in completedprojects in late 2002 that will be included in 2003 performance.
• The residential indoor programs saw mixed results. The WashWise program exceededgoals, while Multifamily Toilet Rebates spent much of the year ramping up, and did notcomplete as many projects as planned. Residential indoor programs achieved 63% of thetotal savings targets for this sector. Multifamily Toilet Rebate costs were higher thanplanned in 2002, as higher rebates were offered in response to property managers’feedback expressed during focus groups. The higher rebates successfully attractedcustomers to this new program. Costs are expected to decrease in future years as theprogram design evolves and as confidence in the new toilets increases among customers.
• The residential landscape sector undertook development of on-site landscape audits andirrigation hardware, both potential key components of achieving the long-term goal. Aninitial evaluation found very little savings from the audits and found 27% peak savings froma combination of a rain sensor and a controller that automatically adjusts its scheduleaccording to historical evapotranspiration rates.
Residential Indoor Use
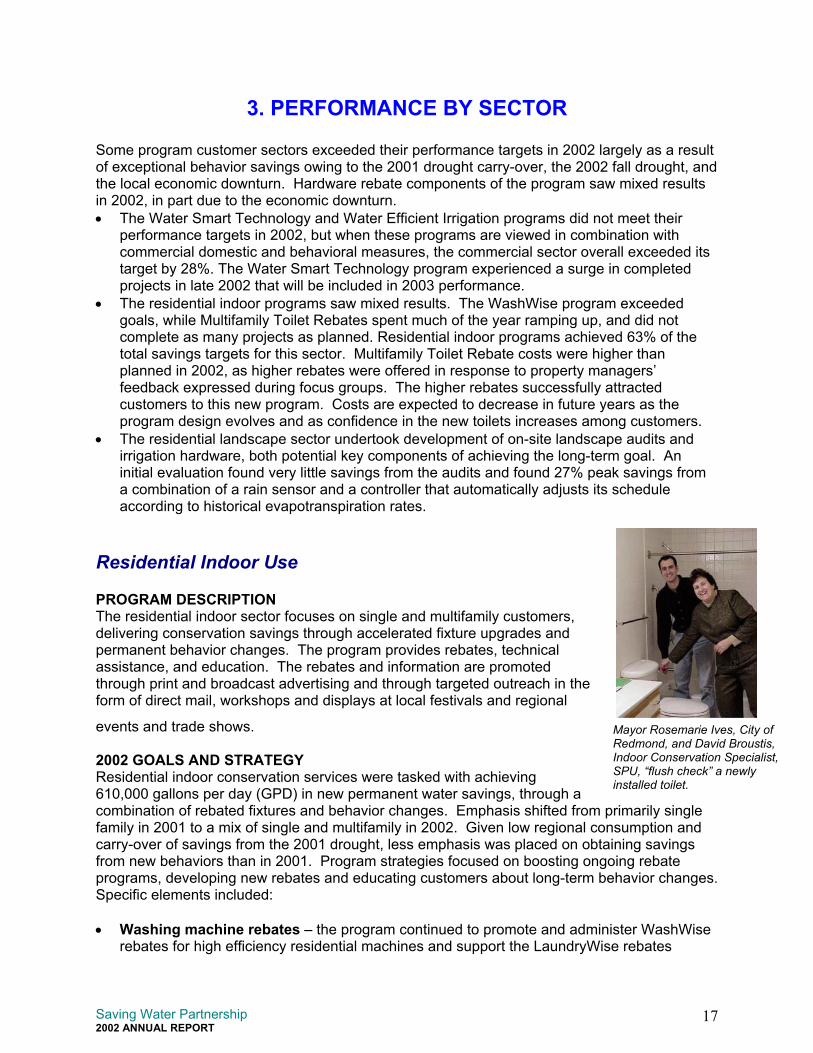
PROGRAM DESCRIPTIONThe residential indoor sector focuses on single and multifamily customers,delivering conservation savings through accelerated fixture upgrades andpermanent behavior changes. The program provides rebates, technicalassistance, and education. The rebates and information are promotedthrough print and broadcast advertising and through targeted outreach in theform of direct mail, workshops and displays at local festivals and regional
events and trade shows.
2002 GOALS AND STRATEGYResidential indoor conservation services were tasked with achieving610,000 gallons per day (GPD) in new permanent water savings, through acombination of rebated fixtures and behavior changes. Emphasis shifted from pfamily in 2001 to a mix of single and multifamily in 2002. Given low regional cocarry-over of savings from the 2001 drought, less emphasis was placed on obtafrom new behaviors than in 2001. Program strategies focused on boosting ongprograms, developing new rebates and educating customers about long-term bSpecific elements included:
• Washing machine rebates – the program continued to promote and adminrebates for high efficiency residential machines and support the LaundryWis
Mayor Rosemarie Ives, City ofRedmond, and David Broustis,Indoor Conservation Specialist,SPU, “flush check” a newlyinstalled toilet.
17
rimarily singlensumption andining savingsoing rebateehavior changes.
ister WashWisee rebates
Saving Water Partnership2002 ANNUAL REPORT
18
administered by Seattle City Light for common-area multifamily building machines. Theseprograms leverage water and energy conservation messages and energy utility dollars toeducate about and encourage the installation of efficient machines. Advertising forWashWise expanded significantly in 2002 compared to 2001, in order to maintainparticipation rates despite a lower rebate amount of $75 per machine in 2002, down from$100 per machine in 2001.
• New utility collaboration – SWP coordinated with Seattle CityLight and Puget Sound Energy (PSE) for a special WashWisepromotion during the months of October and November. Thepromotion introduced tiered rebates based on the efficiency of themachines. This promotion was the first time that PSE has assistedthe Saving Water Partnership with customer rebates.
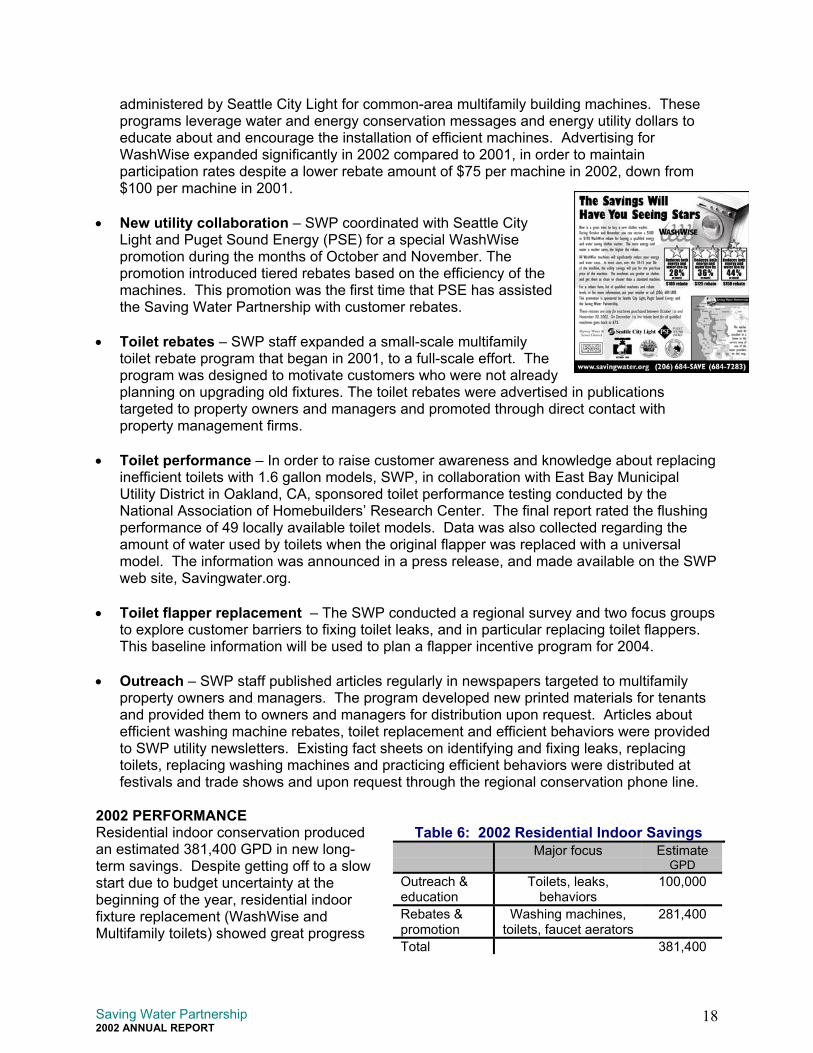
• Toilet rebates – SWP staff expanded a small-scale multifamilytoilet rebate program that began in 2001, to a full-scale effort. Theprogram was designed to motivate customers who were not alreadyplanning on upgrading old fixtures. The toilet rebates were advertised in publicationstargeted to property owners and managers and promoted through direct contact withproperty management firms.
• Toilet performance – In order to raise customer awareness and knowledge about replacinginefficient toilets with 1.6 gallon models, SWP, in collaboration with East Bay MunicipalUtility District in Oakland, CA, sponsored toilet performance testing conducted by theNational Association of Homebuilders’ Research Center. The final report rated the flushingperformance of 49 locally available toilet models. Data was also collected regarding theamount of water used by toilets when the original flapper was replaced with a universalmodel. The information was announced in a press release, and made available on the SWPweb site, Savingwater.org.
• Toilet flapper replacement – The SWP conducted a regional survey and two focus groupsto explore customer barriers to fixing toilet leaks, and in particular replacing toilet flappers.This baseline information will be used to plan a flapper incentive program for 2004.
• Outreach – SWP staff published articles regularly in newspapers targeted to multifamilyproperty owners and managers. The program developed new printed materials for tenantsand provided them to owners and managers for distribution upon request. Articles aboutefficient washing machine rebates, toilet replacement and efficient behaviors were providedto SWP utility newsletters. Existing fact sheets on identifying and fixing leaks, replacingtoilets, replacing washing machines and practicing efficient behaviors were distributed atfestivals and trade shows and upon request through the regional conservation phone line.
2002 PERFORMANCEResidential indoor conservation producedan estimated 381,400 GPD in new long-term savings. Despite getting off to a slowstart due to budget uncertainty at thebeginning of the year, residential indoorfixture replacement (WashWise andMultifamily toilets) showed great progress
Table 6: 2002 Residential Indoor SavingsMajor focus Estimate
GPDOutreach &education
Toilets, leaks,behaviors
100,000
Rebates &promotion
Washing machines,toilets, faucet aerators
281,400
Total 381,400
Saving Water Partnership2002 ANNUAL REPORT
19
Toilet replacement inprogress. This 50-unitapartment has reducedwater use by ___%.
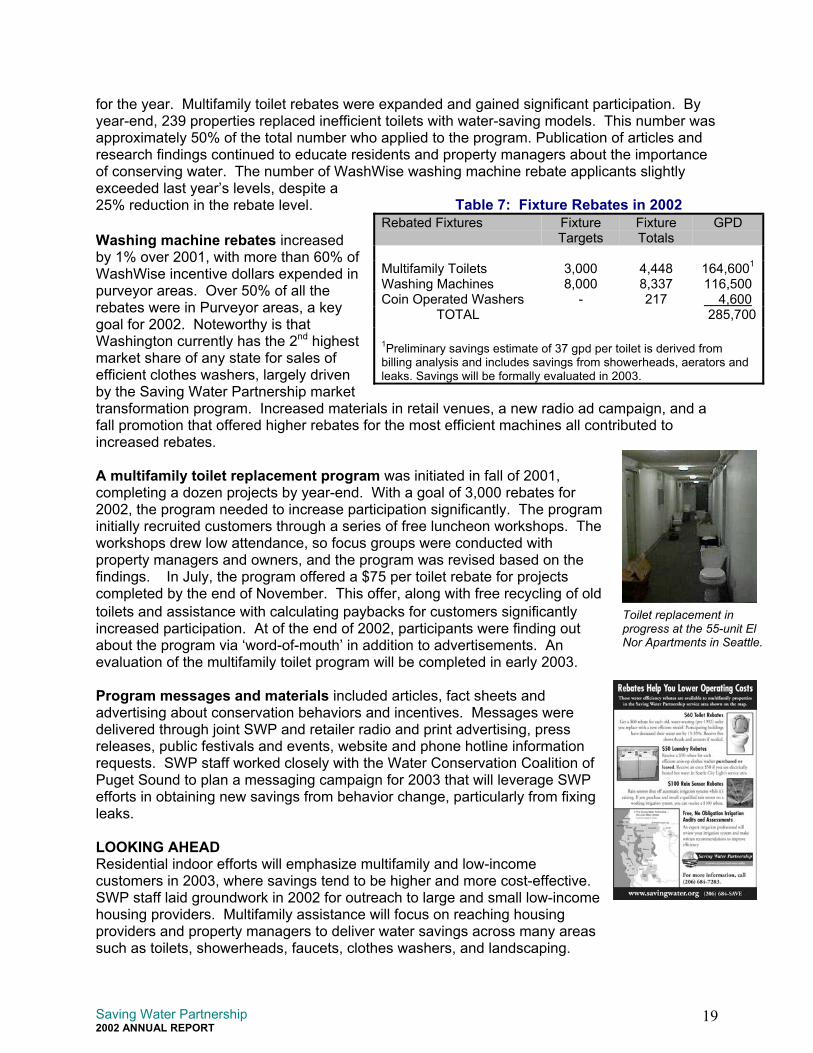
Toilet replacement inprogress at the 55-unit ElNor Apartments in Seattle.
for the year. Multifamily toilet rebates were expanded and gained significant participation. Byyear-end, 239 properties replaced inefficient toilets with water-saving models. This number wasapproximately 50% of the total number who applied to the program. Publication of articles andresearch findings continued to educate residents and property managers about the importanceof conserving water. The number of WashWise washing machine rebate applicants slightlyexceeded last year’s levels, despite a25% reduction in the rebate level.
Washing machine rebates increasedby 1% over 2001, with more than 60% ofWashWise incentive dollars expended inpurveyor areas. Over 50% of all therebates were in Purveyor areas, a keygoal for 2002. Noteworthy is thatWashington currently has the 2nd highestmarket share of any state for sales ofefficient clothes washers, largely drivenby the Saving Water Partnership markettransformation program. Increased materials in retail venues, a new radio ad campaign, and afall promotion that offered higher rebates for the most efficient machines all contributed toincreased rebates.
A multifamily toilet replacement program was initiated in fall of 2001,completing a dozen projects by year-end. With a goal of 3,000 rebates for2002, the program needed to increase participation significantly. The programinitially recruited customers through a series of free luncheon workshops. Theworkshops drew low attendance, so focus groups were conducted withproperty managers and owners, and the program was revised based on thefindings. In July, the program offered a $75 per toilet rebate for projectscompleted by the end of November. This offer, along with free recycling of oldtoilets and assistance with calculating paybacks for customers significantlyincreased participation. At of the end of 2002, participants were finding outabout the program via ‘word-of-mouth’ in addition to advertisements. Anevaluation of the multifamily toilet program will be completed in early 2003.
Program messages and materials included articles, fact sheets andadvertising about conservation behaviors and incentives. Messages weredelivered through joint SWP and retailer radio and print advertising, pressreleases, public festivals and events, website and phone hotline informationrequests. SWP staff worked closely with the Water Conservation Coalition ofPuget Sound to plan a messaging campaign for 2003 that will leverage SWPefforts in obtaining new savings from behavior change, particularly from fixingleaks.
LOOKING AHEADResidential indoor efforts will emphasize multifamily and low-incomecustomers in 2003, where savings tend to be higher and more cost-effective.SWP staff laid groundwork in 2002 for outreach to large and small low-incomehousing providers. Multifamily assistance will focus on reaching housingproviders and property managers to deliver water savings across many areassuch as toilets, showerheads, faucets, clothes washers, and landscaping.
Table 7: Fixture Rebates in 2002Rebated Fixtures Fixture
TargetsFixtureTotals
GPD
Multifamily Toilets 3,000 4,448 164,6001
Washing Machines 8,000 8,337 116,500Coin Operated Washers - 217 4,600
TOTAL 285,700
1Preliminary savings estimate of 37 gpd per toilet is derived frombilling analysis and includes savings from showerheads, aerators andleaks. Savings will be formally evaluated in 2003.
Saving Water Partnership2002 ANNUAL REPORT
20
For single family customers, 2003 efforts will focus on promoting washing machine rebates andproviding education and support materials to help customers replace toilets and find and fixleaks. With new clothes washer standards beginning to take effect in 2004, the WashWiseprogram is beginning to wind down. After 2003, the program is likely to focus on limited rebatesfor only the most efficient machines. Planning is taking place for a single-family toilet effort laterin 2003, possibly an incentive program or a strong educational push. Program developmentefforts will enable launch of a toilet flapper replacement program in 2004. Program informationwill target savings through behavior change. Outreach efforts will continue to look foropportunities to partner where it makes sense, to leverage our presence and cost-effectiveness,and seek efficiencies by integrating messages.
Residential Landscape Use
PROGRAM DESCRIPTIONThis customer sector targets water used for single family landscapes. The target audience isprimarily those who use water inefficiently in their landscapes. To effectively reach the targetaudience, an integrated resource conservation concept of the Natural Lawn & Garden (NLG)was developed. The NLG program aims at encouraging practices that are environmentallyfriendly, including not only water use, but also solid waste and surface water managementpractices. This holistic approach has created efficiencies by leveraging resources from otherutilities and agencies. Program efforts focus on ecological landscape management, outreachand education, program incentives and evaluation. The desired behaviors are described in aseries of six publications called the Natural Lawn & Garden Guides (titles with an asterisk weredeveloped in 2002):• Choosing the Right Plants for a Beautiful, Trouble-Free Garden*• Natural Pest, Weed & Disease Control*• Composting at Home*• Growing Healthy Soil• Smart Watering• Natural Lawn Care
The long-term goal, over ten or more years, is to build a new customer ethic with respect tolandscapes, replacing traditional and resource intensive practices with those that are moreresource-efficient and more closely follow a natural model. Conservation measures focus onpractices and choices that are compatible with site conditions to provide a beautiful and healthylandscape requiring limited care, reduced use of inputs such as water, fertilizer, and pesticides,and generating less organic waste that must be disposed of off-site.
2002 GOALS AND STRATEGYResidential landscape conservation was targeted to reduce long-term water use by 100,000GPD in 2002. The strategy to achieve these savings focussed on delivering an integratedmessage, increasing awareness, providing educational materials, and creating incentives:
• Raising awareness among targeted customers through media and industry partnerships onwater efficient landscape practices.
• Educating targeted consumers about best landscape practices with new Natural Lawn &Garden guides and numerous training workshops and presentations. The SWP partnered
Saving Water Partnership2002 ANNUAL REPORT
21
with local nurseries to obtain their assistance in distributing the guides, offering space forclasses, and participating in the soaker hose discount/rebate program.
• Creating behavior change incentives to draw attention to conservation messages, educationmaterials and resource efficient behavior. Incentives occurred through three primarypromotions and one targeted audit program. First, in partnership with nurseries, SWPoffered soaker hose rebates to encourage customers to learn more about efficient watering.Second, Northwest Natural Yard Days provided discounts on a variety of landscapingproducts and tools that help customers use more ecologically-based practices. And third,SWP partnered with King County Solid Waste Division and area retailers to promotediscounted compost. Adding compost to garden beds creates healthier soil that ultimatelyneeds fewer additional inputs such as water, fertilizer, and pesticides. Each of thesepromotions served three objectives: encouraging efficient watering; highlighting programeducational messages about best practices; and building upon industry partnerships. Inaddition to these promotions, SWP piloted a targeted audit called the Personal WaterSavings Program. This provided customers with on-site recommendations for more efficientirrigation and indoor water use. Rather than offering a specific product as an incentive,customers received personalized recommendations based upon an on-site assessment oftheir landscape to give them motivation for immediate and long-term change.
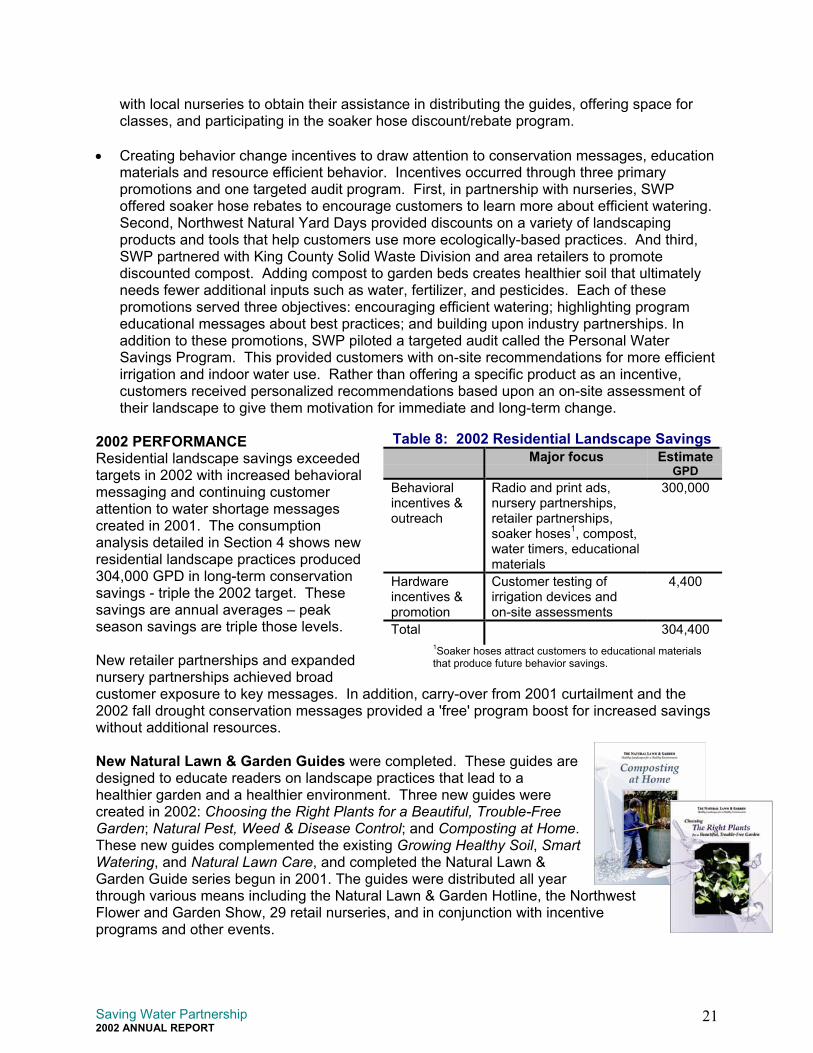
2002 PERFORMANCEResidential landscape savings exceededtargets in 2002 with increased behavioralmessaging and continuing customerattention to water shortage messagescreated in 2001. The consumptionanalysis detailed in Section 4 shows newresidential landscape practices produced304,000 GPD in long-term conservationsavings - triple the 2002 target. Thesesavings are annual averages – peakseason savings are triple those levels.
New retailer partnerships and expandednursery partnerships achieved broadcustomer exposure to key messages. In addition, carry-over from 2001 curtailment and the2002 fall drought conservation messages provided a 'free' program boost for increased savingswithout additional resources.
New Natural Lawn & Garden Guides were completed. These guides aredesigned to educate readers on landscape practices that lead to ahealthier garden and a healthier environment. Three new guides werecreated in 2002: Choosing the Right Plants for a Beautiful, Trouble-FreeGarden; Natural Pest, Weed & Disease Control; and Composting at Home.These new guides complemented the existing Growing Healthy Soil, SmartWatering, and Natural Lawn Care, and completed the Natural Lawn &Garden Guide series begun in 2001. The guides were distributed all yearthrough various means including the Natural Lawn & Garden Hotline, the NorthwestFlower and Garden Show, 29 retail nurseries, and in conjunction with incentiveprograms and other events.
Table 8: 2002 Residential Landscape SavingsMajor focus Estimate
GPDBehavioralincentives &outreach
Radio and print ads,nursery partnerships,retailer partnerships,soaker hoses1, compost,water timers, educationalmaterials
300,000
Hardwareincentives &promotion
Customer testing ofirrigation devices andon-site assessments
4,400
Total 304,4001Soaker hoses attract customers to educational materialsthat produce future behavior savings.
Saving Water Partnership2002 ANNUAL REPORT
Advertising & media outreach supported each incentive program offered in 2002. In addition,summer ads appeared in the Seattle PI, Seattle Times, Eastside Journal, and South CountyJournal promoting the Natural Lawn & Garden Guides and the Natural Lawn & Garden Hotline.One hundred print media ads and over 200 radio ads ran in 2002. While it is difficult to quantifytheir behavioral impact, the presence of these messages in newspapers and radio reinforcedprogrammatic work and built public awareness of natural lawn and garden practices thatproduced real savings. For a detailed breakdown of print and radio advertising, please see the2002 Natural Lawn & Garden Summary Notebook11.
Nursery partnerships were expanded andstrengthened in 2002. The Saving WaterPartnership established nursery partners as keydistribution points for the Natural Lawn & GardenGuides, training nursery staff on these Guides,expanding nursery participation in the springsoaker hose and fall compost campaigns, andbuilding relationships through ongoing nurserycommunication. At a minimum, partneringnurseries were asked to distribute the NaturalsGuides. Nurseries throughout King County wereinvited to be partners. 29 nurseries across theSaving Water Partnership service area agreed to partner, as compared to 12 nurseries in 2001.
Overall, the 2002 landscape campaign succeeded in meeting its intended goals: relationshipswere strengthened, nursery staff were trained, a brochure distribution network was set up, andnursery participation in the soaker hose promotion increased. Many nurseries did not distributethe volume of brochures expected, but the cumulative effect of 29 nurseries distributingbrochures resulted in 33,000 brochures reaching customers. At year-end site visits, allnurseries expressed satisfaction and an interest in continuing thepartnership in 2003.
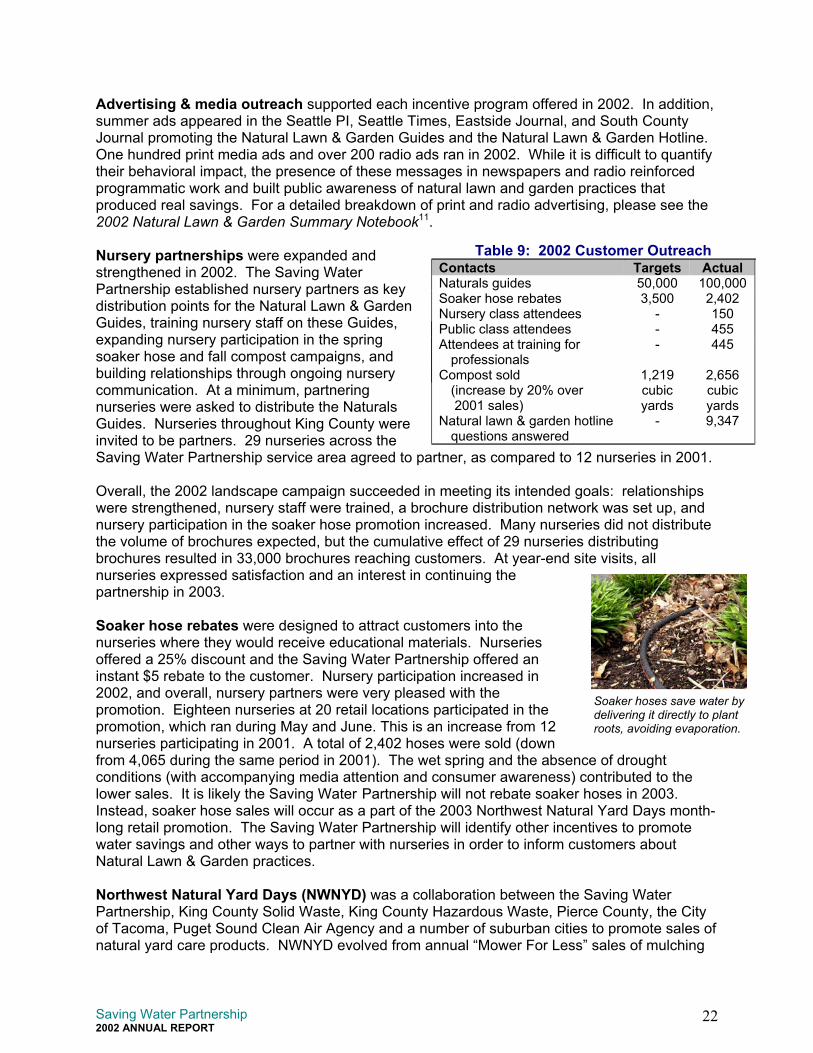
Soaker hose rebates were designed to attract customers into thenurseries where they would receive educational materials. Nurseriesoffered a 25% discount and the Saving Water Partnership offered aninstant $5 rebate to the customer. Nursery participation increased in2002, and overall, nursery partners were very pleased with thepromotion. Eighteen nurseries at 20 retail locations participated in thepromotion, which ran during May and June. This is an increase from 12nurseries participating in 2001. A total of 2,402 hoses were sold (downfrom 4,065 during the same period in 2001). The wet spring and the absencconditions (with accompanying media attention and consumer awareness) clower sales. It is likely the Saving Water Partnership will not rebate soaker hInstead, soaker hose sales will occur as a part of the 2003 Northwest Naturalong retail promotion. The Saving Water Partnership will identify other incenwater savings and other ways to partner with nurseries in order to inform cusNatural Lawn & Garden practices.
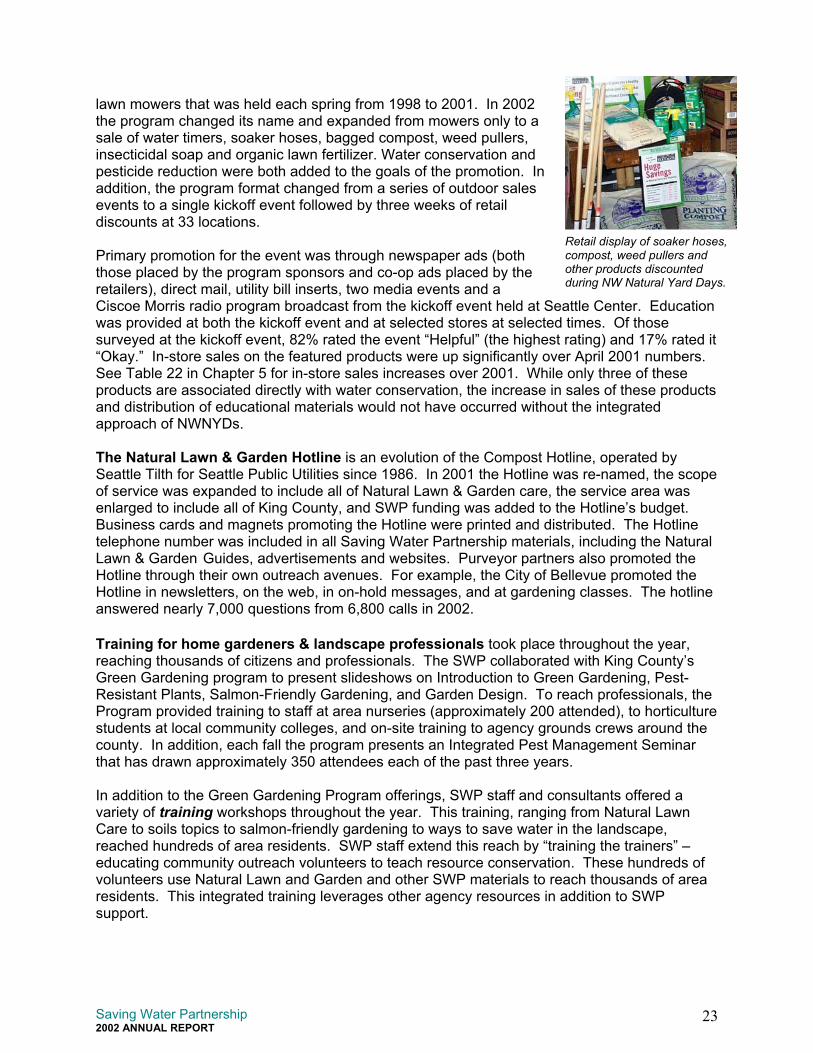
Northwest Natural Yard Days (NWNYD) was a collaboration between the SPartnership, King County Solid Waste, King County Hazardous Waste, Piercof Tacoma, Puget Sound Clean Air Agency and a number of suburban citiesnatural yard care products. NWNYD evolved from annual “Mower For Less”
Table 9: 2002 Customer OutreachContacts Targets ActualNaturals guides 50,000 100,000Soaker hose rebates 3,500 2,402Nursery class attendees - 150Public class attendees - 455Attendees at training for
professionals- 445
Compost sold(increase by 20% over 2001 sales)
1,219cubicyards
2,656cubicyards
Natural lawn & garden hotlinequestions answered
- 9,347
Soaker hoses save water bydelivering it directly to plantroots, avoiding evaporation.
22
e of droughtontributed to theoses in 2003.l Yard Days month-tives to promotetomers about
aving Watere County, the City to promote sales of sales of mulching
Saving Water Partnership2002 ANNUAL REPORT
23
Retail display of soaker hoses,compost, weed pullers andother products discountedduring NW Natural Yard Days.
lawn mowers that was held each spring from 1998 to 2001. In 2002the program changed its name and expanded from mowers only to asale of water timers, soaker hoses, bagged compost, weed pullers,insecticidal soap and organic lawn fertilizer. Water conservation andpesticide reduction were both added to the goals of the promotion. Inaddition, the program format changed from a series of outdoor salesevents to a single kickoff event followed by three weeks of retaildiscounts at 33 locations.
Primary promotion for the event was through newspaper ads (boththose placed by the program sponsors and co-op ads placed by theretailers), direct mail, utility bill inserts, two media events and aCiscoe Morris radio program broadcast from the kickoff event held at Seattle Center. Educationwas provided at both the kickoff event and at selected stores at selected times. Of thosesurveyed at the kickoff event, 82% rated the event “Helpful” (the highest rating) and 17% rated it“Okay.” In-store sales on the featured products were up significantly over April 2001 numbers.See Table 22 in Chapter 5 for in-store sales increases over 2001. While only three of theseproducts are associated directly with water conservation, the increase in sales of these productsand distribution of educational materials would not have occurred without the integratedapproach of NWNYDs.
The Natural Lawn & Garden Hotline is an evolution of the Compost Hotline, operated bySeattle Tilth for Seattle Public Utilities since 1986. In 2001 the Hotline was re-named, the scopeof service was expanded to include all of Natural Lawn & Garden care, the service area wasenlarged to include all of King County, and SWP funding was added to the Hotline’s budget.Business cards and magnets promoting the Hotline were printed and distributed. The Hotlinetelephone number was included in all Saving Water Partnership materials, including the NaturalLawn & Garden Guides, advertisements and websites. Purveyor partners also promoted theHotline through their own outreach avenues. For example, the City of Bellevue promoted theHotline in newsletters, on the web, in on-hold messages, and at gardening classes. The hotlineanswered nearly 7,000 questions from 6,800 calls in 2002.
Training for home gardeners & landscape professionals took place throughout the year,reaching thousands of citizens and professionals. The SWP collaborated with King County’sGreen Gardening program to present slideshows on Introduction to Green Gardening, Pest-Resistant Plants, Salmon-Friendly Gardening, and Garden Design. To reach professionals, theProgram provided training to staff at area nurseries (approximately 200 attended), to horticulturestudents at local community colleges, and on-site training to agency grounds crews around thecounty. In addition, each fall the program presents an Integrated Pest Management Seminarthat has drawn approximately 350 attendees each of the past three years.
In addition to the Green Gardening Program offerings, SWP staff and consultants offered avariety of training workshops throughout the year. This training, ranging from Natural LawnCare to soils topics to salmon-friendly gardening to ways to save water in the landscape,reached hundreds of area residents. SWP staff extend this reach by “training the trainers” –educating community outreach volunteers to teach resource conservation. These hundreds ofvolunteers use Natural Lawn and Garden and other SWP materials to reach thousands of arearesidents. This integrated training leverages other agency resources in addition to SWPsupport.
Saving Water Partnership2002 ANNUAL REPORT
24
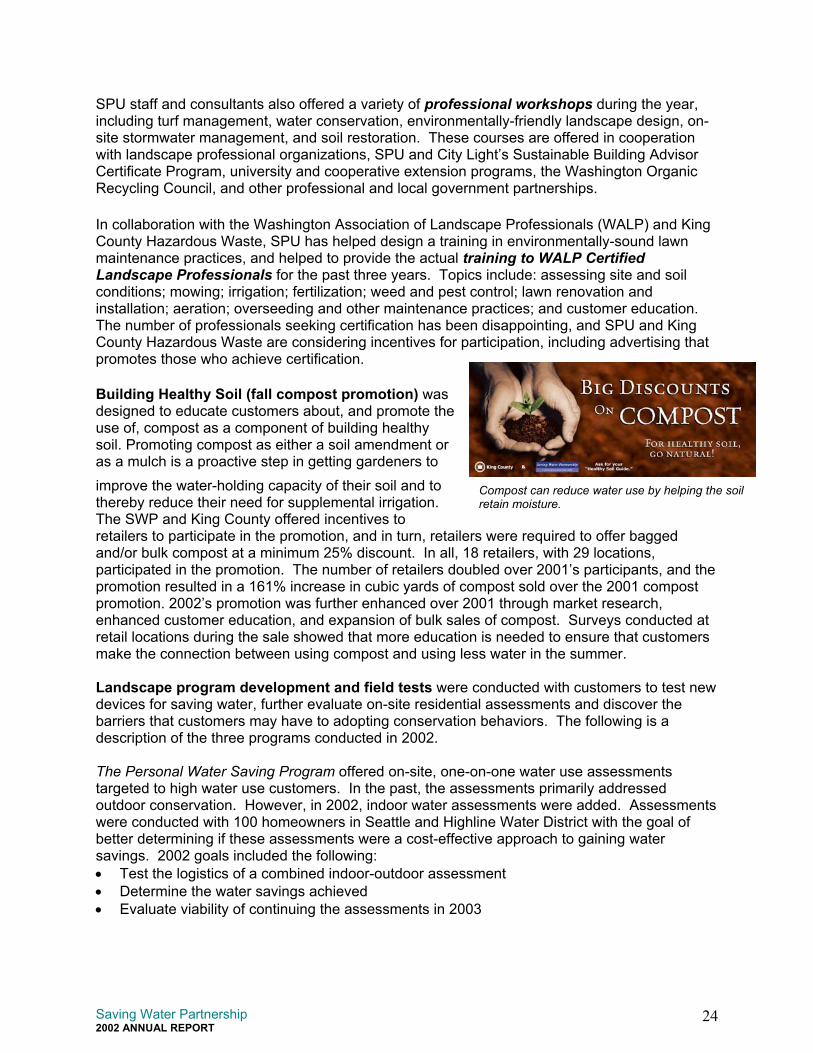
Compost can reduce water use by helping the soilretain moisture.
SPU staff and consultants also offered a variety of professional workshops during the year,including turf management, water conservation, environmentally-friendly landscape design, on-site stormwater management, and soil restoration. These courses are offered in cooperationwith landscape professional organizations, SPU and City Light’s Sustainable Building AdvisorCertificate Program, university and cooperative extension programs, the Washington OrganicRecycling Council, and other professional and local government partnerships.
In collaboration with the Washington Association of Landscape Professionals (WALP) and KingCounty Hazardous Waste, SPU has helped design a training in environmentally-sound lawnmaintenance practices, and helped to provide the actual training to WALP CertifiedLandscape Professionals for the past three years. Topics include: assessing site and soilconditions; mowing; irrigation; fertilization; weed and pest control; lawn renovation andinstallation; aeration; overseeding and other maintenance practices; and customer education.The number of professionals seeking certification has been disappointing, and SPU and KingCounty Hazardous Waste are considering incentives for participation, including advertising thatpromotes those who achieve certification.
Building Healthy Soil (fall compost promotion) wasdesigned to educate customers about, and promote theuse of, compost as a component of building healthysoil. Promoting compost as either a soil amendment oras a mulch is a proactive step in getting gardeners toimprove the water-holding capacity of their soil and tothereby reduce their need for supplemental irrigation.The SWP and King County offered incentives toretailers to participate in the promotion, and in turn, retailers were required to offer baggedand/or bulk compost at a minimum 25% discount. In all, 18 retailers, with 29 locations,participated in the promotion. The number of retailers doubled over 2001’s participants, and thepromotion resulted in a 161% increase in cubic yards of compost sold over the 2001 compostpromotion. 2002’s promotion was further enhanced over 2001 through market research,enhanced customer education, and expansion of bulk sales of compost. Surveys conducted atretail locations during the sale showed that more education is needed to ensure that customersmake the connection between using compost and using less water in the summer.
Landscape program development and field tests were conducted with customers to test newdevices for saving water, further evaluate on-site residential assessments and discover thebarriers that customers may have to adopting conservation behaviors. The following is adescription of the three programs conducted in 2002.
The Personal Water Saving Program offered on-site, one-on-one water use assessmentstargeted to high water use customers. In the past, the assessments primarily addressedoutdoor conservation. However, in 2002, indoor water assessments were added. Assessmentswere conducted with 100 homeowners in Seattle and Highline Water District with the goal ofbetter determining if these assessments were a cost-effective approach to gaining watersavings. 2002 goals included the following: • Test the logistics of a combined indoor-outdoor assessment• Determine the water savings achieved • Evaluate viability of continuing the assessments in 2003
Saving Water Partnership2002 ANNUAL REPORT
25
To determine if participants saved water, they were matched up with customers who had similarhistorical consumption, but did not participate in the program. These customers were used as“controls.” Based on 2002 summer consumption, Seattle participants used 0.15 CCF percustomer per day less than their controls. The change in consumption with Highline customerswas not statistically significant. Customer surveys and continued evaluation work will bring forthfurther information that will be incorporated into program planning. Irrigation hardware customer research took place during the summer of 2002. The SWPworked with customers to determine the savings potential of several irrigation devices: anirrigation controller that automatically adjusted scheduling according to historic weather factors;a wireless and hardwired rain sensor; and an irrigation scheduling service. One hundred-fifteencustomers participated. Each participating customer was matched with a control that hadsimilar water use patterns, property size and household characteristics. The Study resultsshowed a 27% reduction in water use for those participants who had both the controller and rainsensor installed. In 2003, a savings evaluation will continue for those participants with the rainsensor because 2002’s unusually warm and dry weather provided limited results about the rainsensor’s savings potential.
A landscape behavior barriers analysis was conducted to help determine what prevents high-peak-use customers from adopting landscape behaviors that would save water. A series offocus groups was held in late fall of 2002 to assess barriers encountered in three topic areas:automatic irrigation; plant selection; and watering and maintenance. Some of the key findingsinclude:• Automatic irrigation system users lack awareness about the efficiency of these systems, and
believe that they are in fact efficient;• Many gardeners believe that resource efficient landscapes are less attractive than other
landscapes;• Participants believe that “right plant/right place” is a useful concept relating to aesthetic
concerns such as size and color, but not to conditions of the landscape itself, such as sun,soil type, etc.;
• Participants lack awareness of how much water plants actually need, and of how muchwater they actually do apply;
• When participants were made aware of their relative water use and, for example, the higherwater use associated with automatic systems, they were much more interested in learninghow to increase efficiency;
• Participants want feedback about how much water they use relative to what they should useand relative to others in similar situations.
The results of the research will be integrated into program planning and will be reflected in theLandscape Strategic Plan that will be drafted during the first half of 2003.
LOOKING AHEAD Program efforts will continue to target lawn and garden audiences with an integrated messagein 2003, using distribution of the Natural Lawn & Garden guides as a foundation. One of the firsttasks in the 2003 campaign will be to develop a comprehensive strategy that reaches a broaderaudience, takes into account findings from the Barriers Analysis, continues the successful workof 2002, and finds new partners to help deliver conservation messages.
Saving Water Partnership2002 ANNUAL REPORT
26
Commercial Process and Domestic Use
PROGRAM DESCRIPTIONThe Water Smart Technology program provides free technical assistance and financialincentives to reduce water use at commercial, industrial and institutional facilities. Conservationopportunities include replacing toilets and urinals, converting ice machines and refrigerationequipment from water to air-cooled, other types of pass-through cooling, installing highefficiency commercial clothes washers, upgrading air compressors and other medicalequipment, process water recycling and reuse, cooling tower improvements, and other wateruse efficiency technologies. Program staff and consultants provide efficiency solutions throughsite assessments, technical review, product evaluation and program materials. Programfinancial incentives provide standard rebates or custom incentives of up to 50% of the installedcosts of any cost-effective measure. Most program participants have a simple payback periodof less than two years on their investment.
2002 GOALS AND STRATEGYThe Water Smart Technology Program had a water savings target of 369,000 GPD for 2002,less than the 2001 target due to budget constraints.
Program delivery and outreach focused on four strategies:• Promotion through service and equipment vendors; • Partnerships with trade groups, electric utilities, agencies and other service providers; • Targeted recruiting of select business categories, including large customers, hospitality,
medical facilities, and schools and institutions;• Workshops designed to address selected end uses.
These strategies and priorities are described in the Commercial Delivery Strategy12 completedin May 2001.
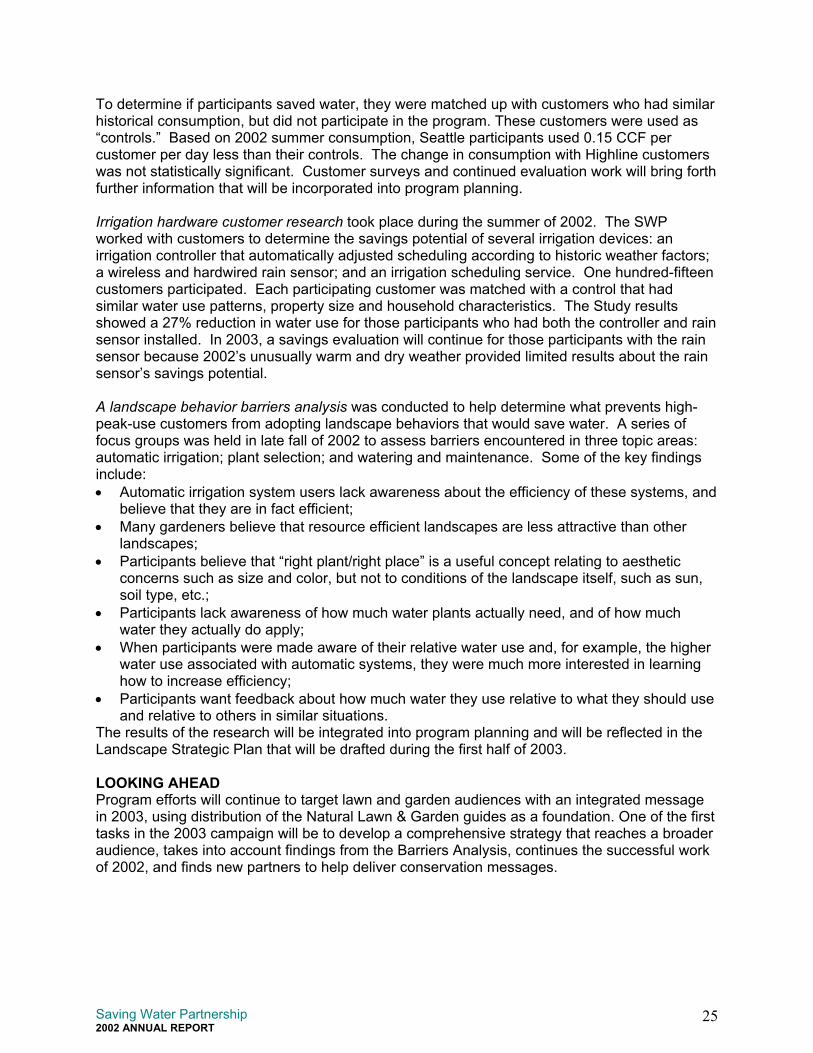
2002 PERFORMANCE Improvements at commercial facilitiesproduced estimated long-term watersavings of 490,300 GPD in 2002,exceeding savings targets by 33%.Rebate projects produced about 150,300GPD savings, while technical assistanceresulted in an estimated 40,000 GPD.The remaining 300,000 GPD were fromnew behaviors and operational changes atcommercial facilities. Significant outreachand assistance was provided by the Business & Industry Resource Venture (ResourceVenture) and contributed to these non-rebate savings. The Resource Venture is a non-profitaffiliate of the Greater Seattle Chamber of Commerce that is under contract to the SWP andSPU to provide resource conservation outreach to the business community.
Table 10: 2002 Commercial Process andDomestic SavingsMajor Focus Estimate
GPDOutreach &information
Customer assistance,workshops
300,000
Rebates &administration
Toilets, cooling,process, technicalassistance
190,300
Total 490,300
Saving Water Partnership2002 ANNUAL REPORT
27
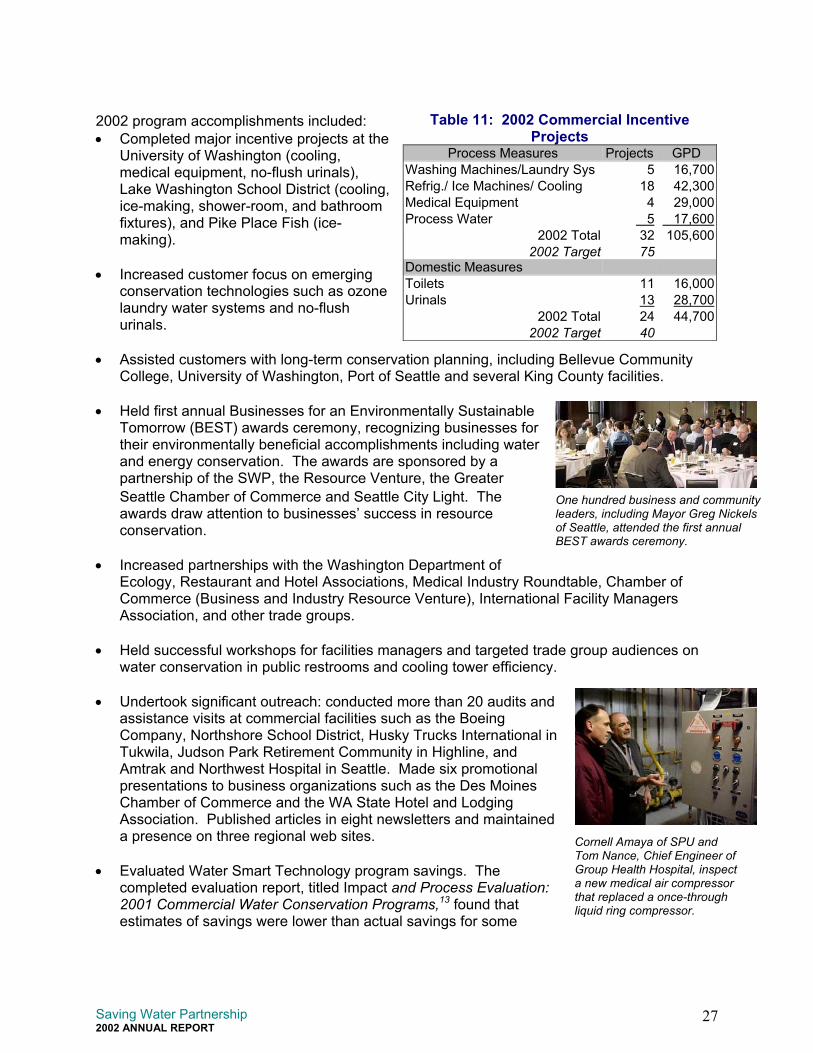
Cornell Amaya of SPU andTom Nance, Chief Engineer ofGroup Health Hospital, inspecta new medical air compressorthat replaced a once-throughliquid ring compressor.
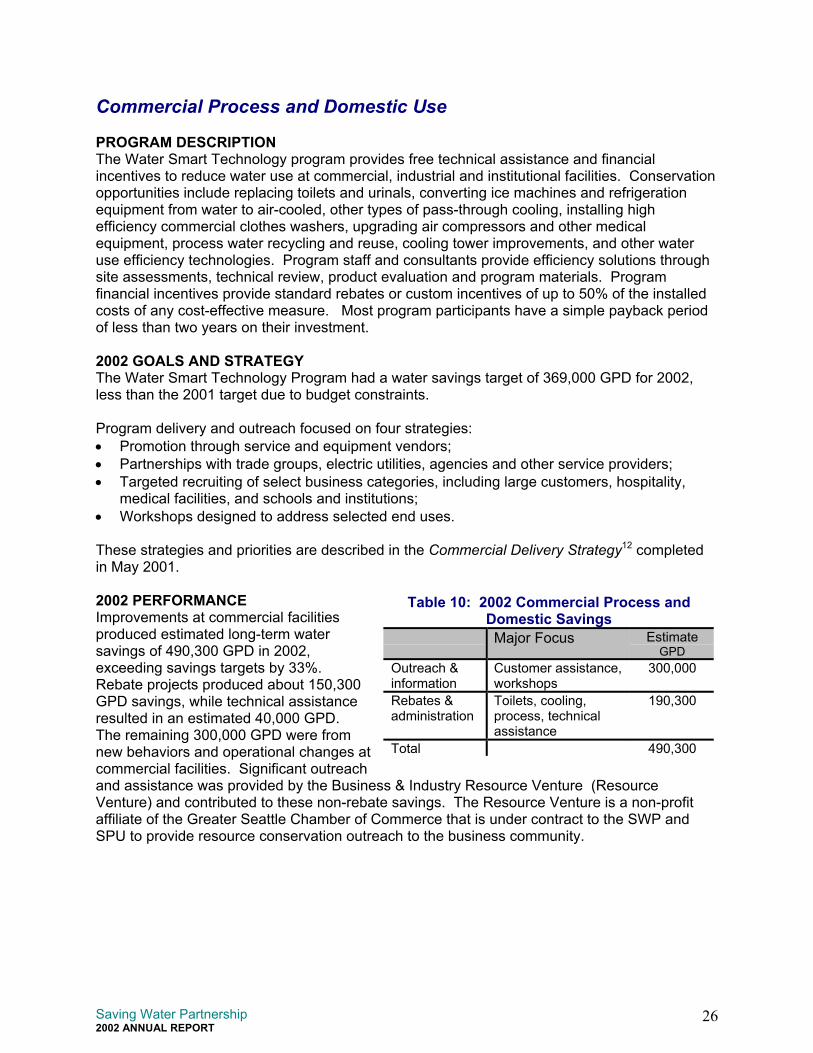
One hundred business and communityleaders, including Mayor Greg Nickelsof Seattle, attended the first annualBEST awards ceremony.
2002 program accomplishments included:• Completed major incentive projects at the
University of Washington (cooling,medical equipment, no-flush urinals),Lake Washington School District (cooling,ice-making, shower-room, and bathroomfixtures), and Pike Place Fish (ice-making).
• Increased customer focus on emergingconservation technologies such as ozonelaundry water systems and no-flushurinals.
• Assisted customers with long-term conservation planning, including Bellevue CommunityCollege, University of Washington, Port of Seattle and several King County facilities.
• Held first annual Businesses for an Environmentally SustainableTomorrow (BEST) awards ceremony, recognizing businesses fortheir environmentally beneficial accomplishments including waterand energy conservation. The awards are sponsored by apartnership of the SWP, the Resource Venture, the GreaterSeattle Chamber of Commerce and Seattle City Light. Theawards draw attention to businesses’ success in resourceconservation.
• Increased partnerships with the Washington Department ofEcology, Restaurant and Hotel Associations, Medical Industry Roundtable, Chamber ofCommerce (Business and Industry Resource Venture), International Facility ManagersAssociation, and other trade groups.
• Held successful workshops for facilities managers and targeted trade group audiences onwater conservation in public restrooms and cooling tower efficiency.
• Undertook significant outreach: conducted more than 20 audits andassistance visits at commercial facilities such as the BoeingCompany, Northshore School District, Husky Trucks International inTukwila, Judson Park Retirement Community in Highline, andAmtrak and Northwest Hospital in Seattle. Made six promotionalpresentations to business organizations such as the Des MoinesChamber of Commerce and the WA State Hotel and LodgingAssociation. Published articles in eight newsletters and maintaineda presence on three regional web sites.
• Evaluated Water Smart Technology program savings. Thecompleted evaluation report, titled Impact and Process Evaluation:2001 Commercial Water Conservation Programs,13 found thatestimates of savings were lower than actual savings for some
Table 11: 2002 Commercial IncentiveProjects
Process Measures Projects GPDWashing Machines/Laundry Sys 5 16,700Refrig./ Ice Machines/ Cooling 18 42,300Medical Equipment 4 29,000Process Water 5 17,600
2002 Total 32 105,6002002 Target 75
Domestic MeasuresToilets 11 16,000Urinals 13 28,700
2002 Total 24 44,7002002 Target 40
Saving Water Partnership2002 ANNUAL REPORT
28
measures, and higher than actual for others. For the Water Smart Technology programoverall, the estimated savings were very close to evaluated savings.
LOOKING AHEADCommercial targets and resources in 2003 will be similar to 2002. Reaching the high levels ofparticipation necessary to achieve target goals is a continuing challenge. The program willcontinue to support a spectrum of cost-effective measures through technical assistance andincentives. Outreach will include specialized training and workshops including a workshop onefficient laundry technologies for commercial laundries. Recruiting and assistance will continuewith many of the targeted sectors from 2002 including large users (Port of Seattle, UW andothers), purveyor customers, office and property management, hotels and restaurants, hospitalsand medical research, manufacturing and processing, and education.
Commercial Landscape and Irrigation Use
PROGRAM DESCRIPTIONThe Water Efficient Irrigation Program (WEIP) focuses on increasing landscape and irrigationefficiency at commercial, institutional and multifamily facilities. WEIP provides professional siteassessments, workshops, other technical assistance, and financial incentives to helpcommercial customers upgrade systems and reduce summer water use. Conservationopportunities include improved irrigation controls and scheduling, upgraded systemcomponents, and soil amendment and plant selection. WEIP targets site owners, facilitymanagers and landscape and irrigation industry professionals.
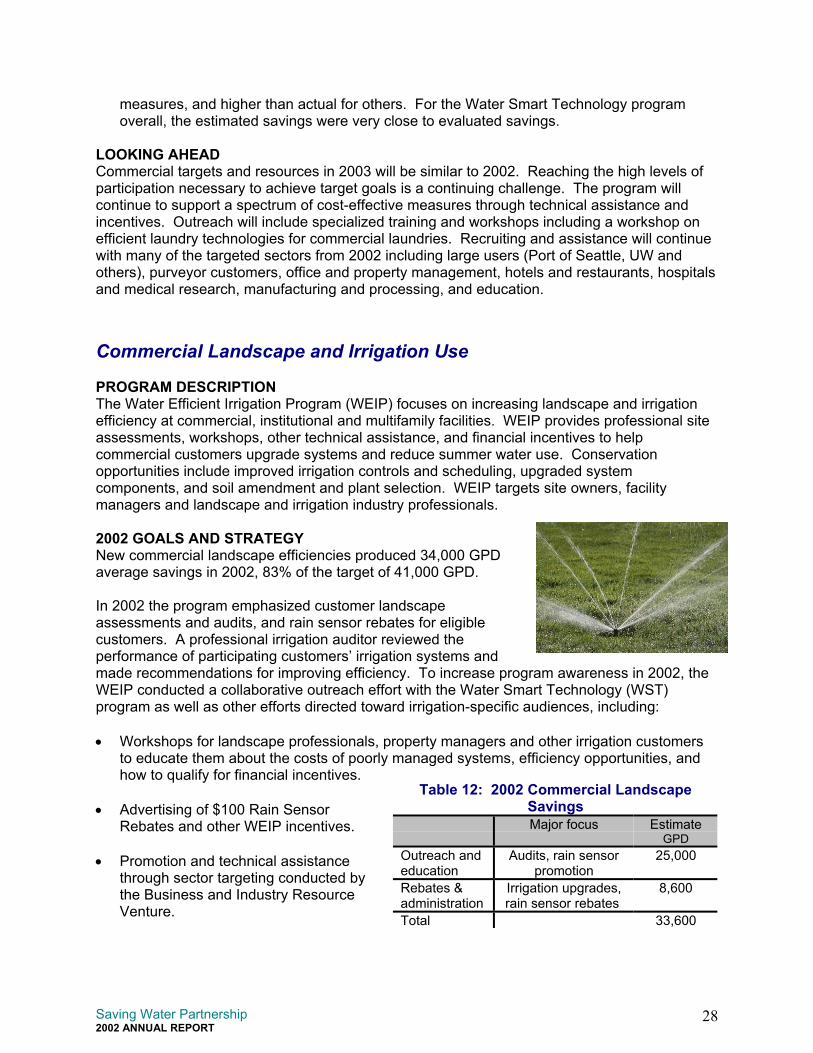
2002 GOALS AND STRATEGYNew commercial landscape efficiencies produced 34,000 GPDaverage savings in 2002, 83% of the target of 41,000 GPD.
In 2002 the program emphasized customer landscapeassessments and audits, and rain sensor rebates for eligiblecustomers. A professional irrigation auditor reviewed theperformance of participating customers’ irrigation systems andmade recommendations for improving efficiency. To increase program awareness in 2002, theWEIP conducted a collaborative outreach effort with the Water Smart Technology (WST)program as well as other efforts directed toward irrigation-specific audiences, including: • Workshops for landscape professionals, property managers and other irrigation customers
to educate them about the costs of poorly managed systems, efficiency opportunities, andhow to qualify for financial incentives.
• Advertising of $100 Rain SensorRebates and other WEIP incentives.
• Promotion and technical assistancethrough sector targeting conducted bythe Business and Industry ResourceVenture.
Table 12: 2002 Commercial LandscapeSavingsMajor focus Estimate
GPDOutreach andeducation
Audits, rain sensorpromotion
25,000
Rebates &administration
Irrigation upgrades,rain sensor rebates
8,600
Total 33,600
Saving Water Partnership2002 ANNUAL REPORT
29
Saving Water Partnership Staff work continually to improve partnerships with landscape andirrigation professionals to promote a water conservation ethic in businesses and to increaseawareness of WEIP incentives for customers.
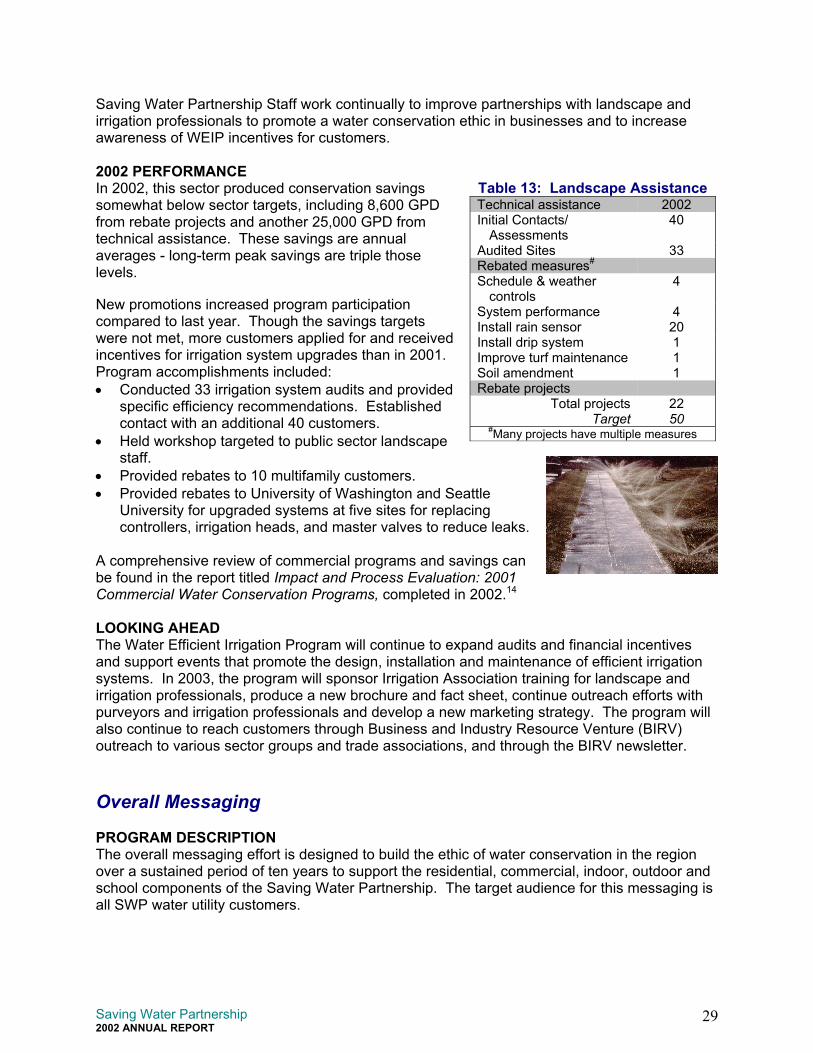
2002 PERFORMANCEIn 2002, this sector produced conservation savingssomewhat below sector targets, including 8,600 GPDfrom rebate projects and another 25,000 GPD fromtechnical assistance. These savings are annualaverages - long-term peak savings are triple thoselevels.
New promotions increased program participationcompared to last year. Though the savings targetswere not met, more customers applied for and receivedincentives for irrigation system upgrades than in 2001. Program accomplishments included:• Conducted 33 irrigation system audits and provided
specific efficiency recommendations. Establishedcontact with an additional 40 customers.
• Held workshop targeted to public sector landscapestaff.
• Provided rebates to 10 multifamily customers.• Provided rebates to University of Washington and Seattle
University for upgraded systems at five sites for replacingcontrollers, irrigation heads, and master valves to reduce leaks.
A comprehensive review of commercial programs and savings canbe found in the report titled Impact and Process Evaluation: 2001Commercial Water Conservation Programs, completed in 2002.14
LOOKING AHEAD The Water Efficient Irrigation Program will continue to expand audits and financial incentivesand support events that promote the design, installation and maintenance of efficient irrigationsystems. In 2003, the program will sponsor Irrigation Association training for landscape andirrigation professionals, produce a new brochure and fact sheet, continue outreach efforts withpurveyors and irrigation professionals and develop a new marketing strategy. The program willalso continue to reach customers through Business and Industry Resource Venture (BIRV)outreach to various sector groups and trade associations, and through the BIRV newsletter.
Overall Messaging
PROGRAM DESCRIPTIONThe overall messaging effort is designed to build the ethic of water conservation in the regionover a sustained period of ten years to support the residential, commercial, indoor, outdoor andschool components of the Saving Water Partnership. The target audience for this messaging isall SWP water utility customers.
Table 13: Landscape AssistanceTechnical assistance 2002Initial Contacts/
Assessments40
Audited Sites 33Rebated measures#
Schedule & weathercontrols
4
System performance 4Install rain sensor 20Install drip system 1Improve turf maintenance 1Soil amendment 1Rebate projects
Total projects 22Target 50
#Many projects have multiple measures
Saving Water Partnership2002 ANNUAL REPORT
30
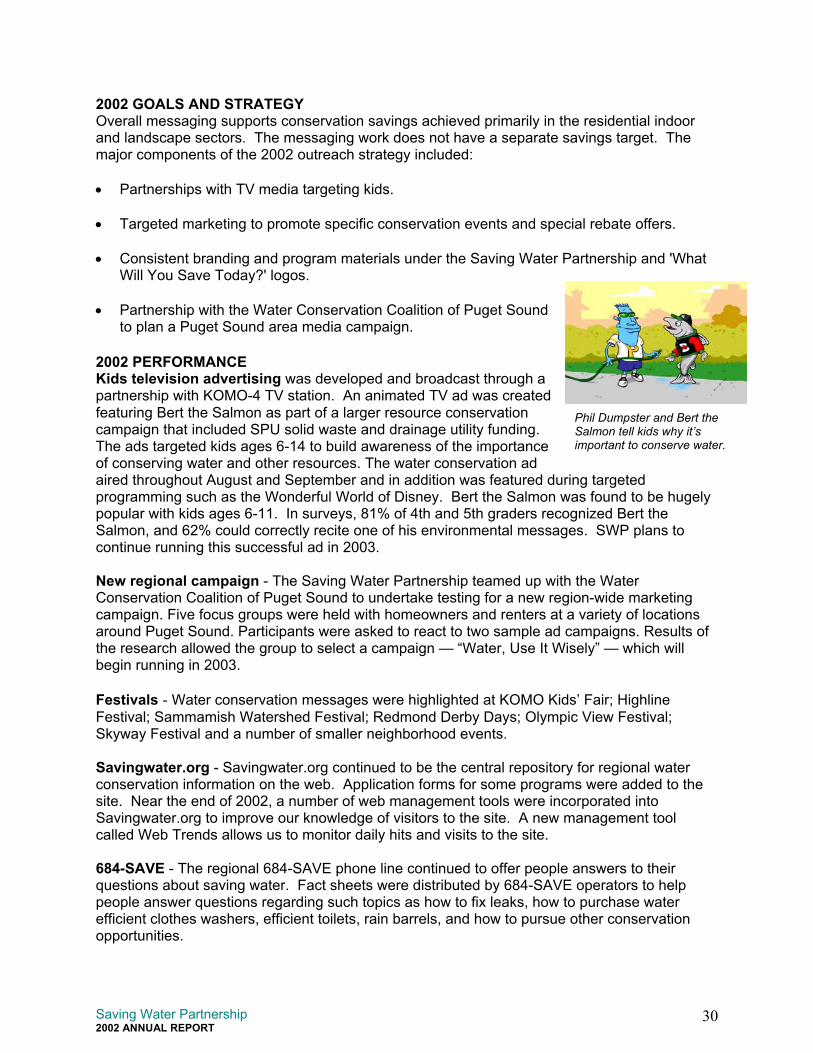
Phil Dumpster and Bert theSalmon tell kids why it’simportant to conserve water.
2002 GOALS AND STRATEGYOverall messaging supports conservation savings achieved primarily in the residential indoorand landscape sectors. The messaging work does not have a separate savings target. Themajor components of the 2002 outreach strategy included:
• Partnerships with TV media targeting kids.
• Targeted marketing to promote specific conservation events and special rebate offers.
• Consistent branding and program materials under the Saving Water Partnership and 'WhatWill You Save Today?' logos.
• Partnership with the Water Conservation Coalition of Puget Soundto plan a Puget Sound area media campaign.
2002 PERFORMANCEKids television advertising was developed and broadcast through apartnership with KOMO-4 TV station. An animated TV ad was createdfeaturing Bert the Salmon as part of a larger resource conservationcampaign that included SPU solid waste and drainage utility funding.The ads targeted kids ages 6-14 to build awareness of the importanceof conserving water and other resources. The water conservation adaired throughout August and September and in addition was featured during targetedprogramming such as the Wonderful World of Disney. Bert the Salmon was found to be hugelypopular with kids ages 6-11. In surveys, 81% of 4th and 5th graders recognized Bert theSalmon, and 62% could correctly recite one of his environmental messages. SWP plans tocontinue running this successful ad in 2003.
New regional campaign - The Saving Water Partnership teamed up with the WaterConservation Coalition of Puget Sound to undertake testing for a new region-wide marketingcampaign. Five focus groups were held with homeowners and renters at a variety of locationsaround Puget Sound. Participants were asked to react to two sample ad campaigns. Results ofthe research allowed the group to select a campaign — “Water, Use It Wisely” — which willbegin running in 2003.
Festivals - Water conservation messages were highlighted at KOMO Kids’ Fair; HighlineFestival; Sammamish Watershed Festival; Redmond Derby Days; Olympic View Festival;Skyway Festival and a number of smaller neighborhood events.
Savingwater.org - Savingwater.org continued to be the central repository for regional waterconservation information on the web. Application forms for some programs were added to thesite. Near the end of 2002, a number of web management tools were incorporated intoSavingwater.org to improve our knowledge of visitors to the site. A new management toolcalled Web Trends allows us to monitor daily hits and visits to the site.
684-SAVE - The regional 684-SAVE phone line continued to offer people answers to theirquestions about saving water. Fact sheets were distributed by 684-SAVE operators to helppeople answer questions regarding such topics as how to fix leaks, how to purchase waterefficient clothes washers, efficient toilets, rain barrels, and how to pursue other conservationopportunities.
Saving Water Partnership2002 ANNUAL REPORT
Residential water conservationcustomer research - a benchmarksurvey that has been conductedsystematically every two to threeyears since 1990 took place in fall of2001, and was completed in 2002.15
This 1,000 participant surveyprovided quantitative and qualitativecustomer research to trackindicators over time to assessprogram effectiveness. The surveymeasured current attitudes andbehaviors of residential customerswith respect to water conservation.The 2001 survey also gatheredinsights about the effects of theregional drought on changes in attitudethat it is important to conserve water anproblems have generally intensified sinto actively conserve water. 89% of cussomewhat affect whether we have enouidentified in the evaluation, and how cuconservation and have changed since 1
LOOKING AHEADSWP messaging will primarily focus onConservation Coalition of Puget Soundand radio “Water – Use It Wisely” camp
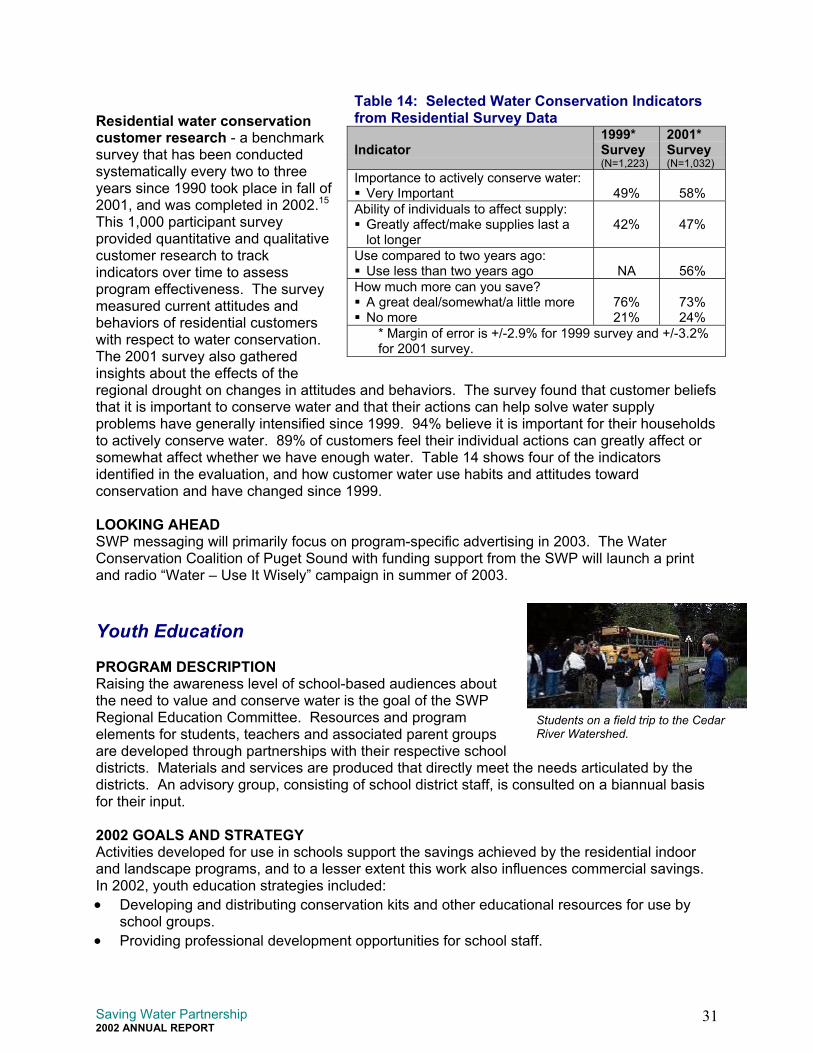
Youth Education
PROGRAM DESCRIPTIONRaising the awareness level of school-bthe need to value and conserve water iRegional Education Committee. Resouelements for students, teachers and asare developed through partnerships witdistricts. Materials and services are prodistricts. An advisory group, consistingfor their input.
2002 GOALS AND STRATEGYActivities developed for use in schools and landscape programs, and to a lessIn 2002, youth education strategies inc• Developing and distributing conserv
school groups.• Providing professional developmen
Table 14: Selected Water Conservation Indicatorsfrom Residential Survey Data
Indicator1999*Survey(N=1,223)
2001*Survey(N=1,032)
Importance to actively conserve water: Very Important 49% 58%
Ability of individuals to affect supply: Greatly affect/make supplies last alot longer
42% 47%
Use compared to two years ago: Use less than two years ago NA 56%
How much more can you save? A great deal/somewhat/a little more No more
76%21%
73%24%
* Margin of error is +/-2.9% for 1999 survey and +/-3.2%
31
for 2001 survey.
Students on a field trip to the CedarRiver Watershed.
s and behaviors. The survey found that customer beliefsd that their actions can help solve water supplyce 1999. 94% believe it is important for their householdstomers feel their individual actions can greatly affect orgh water. Table 14 shows four of the indicators
stomer water use habits and attitudes toward999.
program-specific advertising in 2003. The Water with funding support from the SWP will launch a printaign in summer of 2003.
ased audiences abouts the goal of the SWPrces and programsociated parent groupsh their respective schoolduced that directly meet the needs articulated by the
of school district staff, is consulted on a biannual basis
support the savings achieved by the residential indoorer extent this work also influences commercial savings.luded:ation kits and other educational resources for use by
t opportunities for school staff.
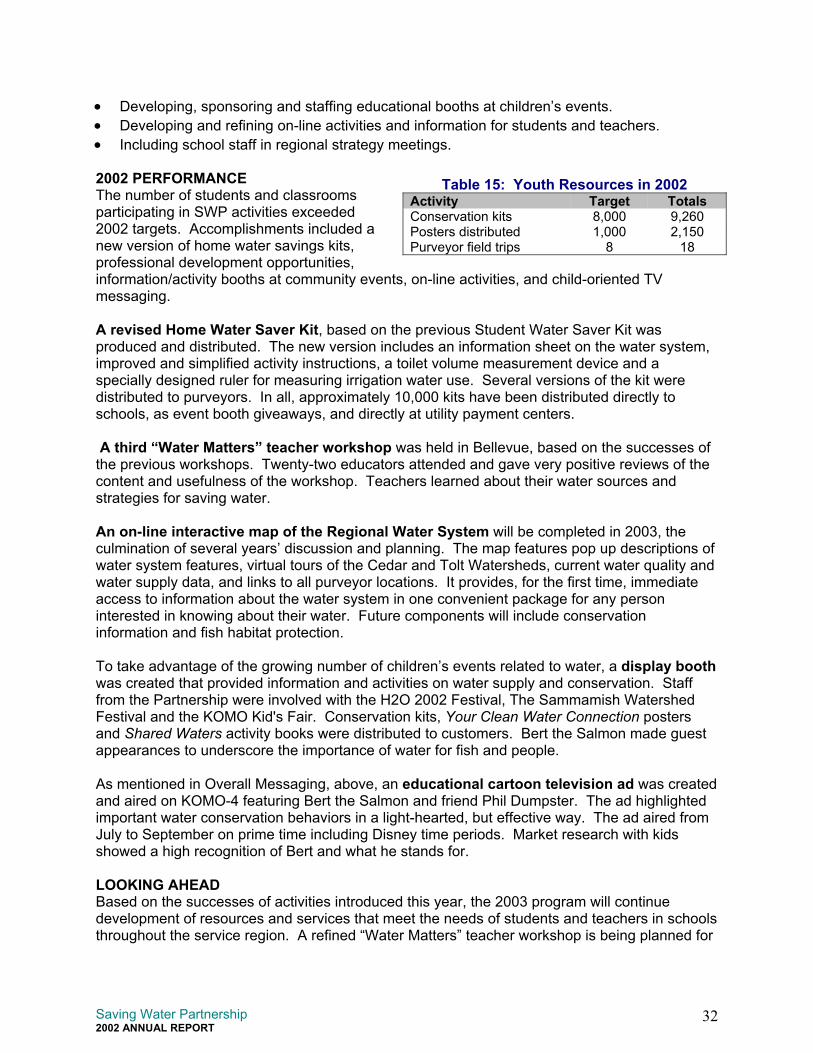
Saving Water Partnership2002 ANNUAL REPORT
32
• Developing, sponsoring and staffing educational booths at children’s events.• Developing and refining on-line activities and information for students and teachers.• Including school staff in regional strategy meetings.
2002 PERFORMANCEThe number of students and classroomsparticipating in SWP activities exceeded2002 targets. Accomplishments included anew version of home water savings kits,professional development opportunities,information/activity booths at community events, on-line activities, and child-oriented TVmessaging.
A revised Home Water Saver Kit, based on the previous Student Water Saver Kit wasproduced and distributed. The new version includes an information sheet on the water system,improved and simplified activity instructions, a toilet volume measurement device and aspecially designed ruler for measuring irrigation water use. Several versions of the kit weredistributed to purveyors. In all, approximately 10,000 kits have been distributed directly toschools, as event booth giveaways, and directly at utility payment centers.
A third “Water Matters” teacher workshop was held in Bellevue, based on the successes ofthe previous workshops. Twenty-two educators attended and gave very positive reviews of thecontent and usefulness of the workshop. Teachers learned about their water sources andstrategies for saving water.
An on-line interactive map of the Regional Water System will be completed in 2003, theculmination of several years’ discussion and planning. The map features pop up descriptions ofwater system features, virtual tours of the Cedar and Tolt Watersheds, current water quality andwater supply data, and links to all purveyor locations. It provides, for the first time, immediateaccess to information about the water system in one convenient package for any personinterested in knowing about their water. Future components will include conservationinformation and fish habitat protection.
To take advantage of the growing number of children’s events related to water, a display boothwas created that provided information and activities on water supply and conservation. Stafffrom the Partnership were involved with the H2O 2002 Festival, The Sammamish WatershedFestival and the KOMO Kid's Fair. Conservation kits, Your Clean Water Connection postersand Shared Waters activity books were distributed to customers. Bert the Salmon made guestappearances to underscore the importance of water for fish and people.
As mentioned in Overall Messaging, above, an educational cartoon television ad was createdand aired on KOMO-4 featuring Bert the Salmon and friend Phil Dumpster. The ad highlightedimportant water conservation behaviors in a light-hearted, but effective way. The ad aired fromJuly to September on prime time including Disney time periods. Market research with kidsshowed a high recognition of Bert and what he stands for.
LOOKING AHEAD Based on the successes of activities introduced this year, the 2003 program will continuedevelopment of resources and services that meet the needs of students and teachers in schoolsthroughout the service region. A refined “Water Matters” teacher workshop is being planned for
Table 15: Youth Resources in 2002Activity Target TotalsConservation kits 8,000 9,260Posters distributed 1,000 2,150Purveyor field trips 8 18
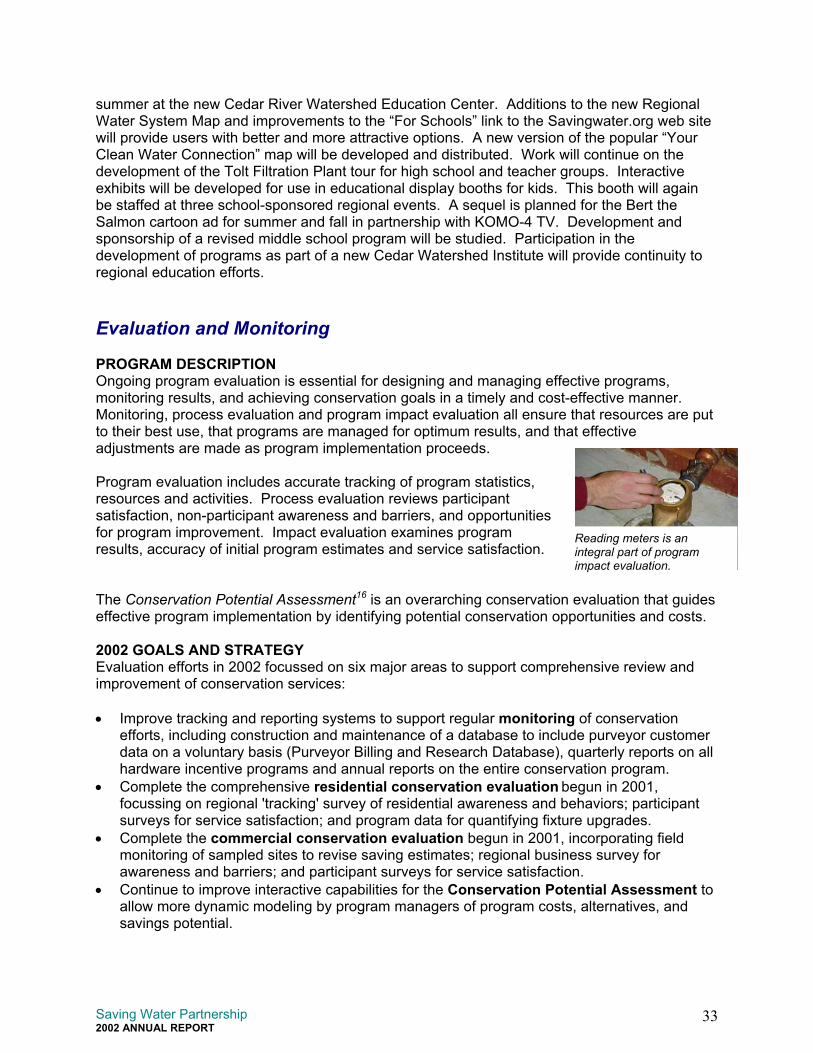
Saving Water Partnership2002 ANNUAL REPORT
33
Reading meters is anintegral part of programimpact evaluation.
summer at the new Cedar River Watershed Education Center. Additions to the new RegionalWater System Map and improvements to the “For Schools” link to the Savingwater.org web sitewill provide users with better and more attractive options. A new version of the popular “YourClean Water Connection” map will be developed and distributed. Work will continue on thedevelopment of the Tolt Filtration Plant tour for high school and teacher groups. Interactiveexhibits will be developed for use in educational display booths for kids. This booth will againbe staffed at three school-sponsored regional events. A sequel is planned for the Bert theSalmon cartoon ad for summer and fall in partnership with KOMO-4 TV. Development andsponsorship of a revised middle school program will be studied. Participation in thedevelopment of programs as part of a new Cedar Watershed Institute will provide continuity toregional education efforts.
Evaluation and Monitoring
PROGRAM DESCRIPTIONOngoing program evaluation is essential for designing and managing effective programs,monitoring results, and achieving conservation goals in a timely and cost-effective manner.Monitoring, process evaluation and program impact evaluation all ensure that resources are putto their best use, that programs are managed for optimum results, and that effectiveadjustments are made as program implementation proceeds.
Program evaluation includes accurate tracking of program statistics,resources and activities. Process evaluation reviews participantsatisfaction, non-participant awareness and barriers, and opportunitiesfor program improvement. Impact evaluation examines programresults, accuracy of initial program estimates and service satisfaction.
The Conservation Potential Assessment16 is an overarching conservation evaluation that guideseffective program implementation by identifying potential conservation opportunities and costs.
2002 GOALS AND STRATEGYEvaluation efforts in 2002 focussed on six major areas to support comprehensive review andimprovement of conservation services:
• Improve tracking and reporting systems to support regular monitoring of conservationefforts, including construction and maintenance of a database to include purveyor customerdata on a voluntary basis (Purveyor Billing and Research Database), quarterly reports on allhardware incentive programs and annual reports on the entire conservation program.
• Complete the comprehensive residential conservation evaluation begun in 2001,focussing on regional 'tracking' survey of residential awareness and behaviors; participantsurveys for service satisfaction; and program data for quantifying fixture upgrades.
• Complete the commercial conservation evaluation begun in 2001, incorporating fieldmonitoring of sampled sites to revise saving estimates; regional business survey forawareness and barriers; and participant surveys for service satisfaction.
• Continue to improve interactive capabilities for the Conservation Potential Assessment toallow more dynamic modeling by program managers of program costs, alternatives, andsavings potential.
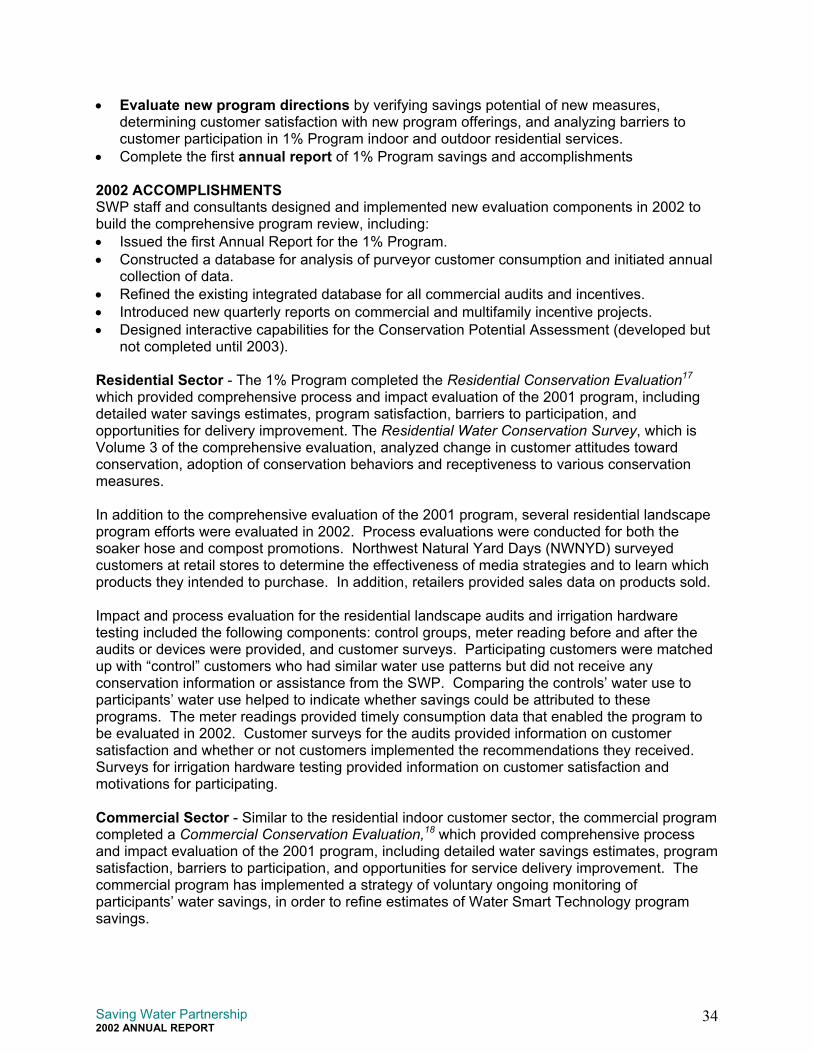
Saving Water Partnership2002 ANNUAL REPORT
34
• Evaluate new program directions by verifying savings potential of new measures,determining customer satisfaction with new program offerings, and analyzing barriers tocustomer participation in 1% Program indoor and outdoor residential services.
• Complete the first annual report of 1% Program savings and accomplishments
2002 ACCOMPLISHMENTSSWP staff and consultants designed and implemented new evaluation components in 2002 tobuild the comprehensive program review, including:• Issued the first Annual Report for the 1% Program.• Constructed a database for analysis of purveyor customer consumption and initiated annual
collection of data.• Refined the existing integrated database for all commercial audits and incentives. • Introduced new quarterly reports on commercial and multifamily incentive projects.• Designed interactive capabilities for the Conservation Potential Assessment (developed but
not completed until 2003).
Residential Sector - The 1% Program completed the Residential Conservation Evaluation17
which provided comprehensive process and impact evaluation of the 2001 program, includingdetailed water savings estimates, program satisfaction, barriers to participation, andopportunities for delivery improvement. The Residential Water Conservation Survey, which isVolume 3 of the comprehensive evaluation, analyzed change in customer attitudes towardconservation, adoption of conservation behaviors and receptiveness to various conservationmeasures.
In addition to the comprehensive evaluation of the 2001 program, several residential landscapeprogram efforts were evaluated in 2002. Process evaluations were conducted for both thesoaker hose and compost promotions. Northwest Natural Yard Days (NWNYD) surveyedcustomers at retail stores to determine the effectiveness of media strategies and to learn whichproducts they intended to purchase. In addition, retailers provided sales data on products sold.
Impact and process evaluation for the residential landscape audits and irrigation hardwaretesting included the following components: control groups, meter reading before and after theaudits or devices were provided, and customer surveys. Participating customers were matchedup with “control” customers who had similar water use patterns but did not receive anyconservation information or assistance from the SWP. Comparing the controls’ water use toparticipants’ water use helped to indicate whether savings could be attributed to theseprograms. The meter readings provided timely consumption data that enabled the program tobe evaluated in 2002. Customer surveys for the audits provided information on customersatisfaction and whether or not customers implemented the recommendations they received.Surveys for irrigation hardware testing provided information on customer satisfaction andmotivations for participating.
Commercial Sector - Similar to the residential indoor customer sector, the commercial programcompleted a Commercial Conservation Evaluation,18 which provided comprehensive processand impact evaluation of the 2001 program, including detailed water savings estimates, programsatisfaction, barriers to participation, and opportunities for service delivery improvement. Thecommercial program has implemented a strategy of voluntary ongoing monitoring ofparticipants’ water savings, in order to refine estimates of Water Smart Technology programsavings.
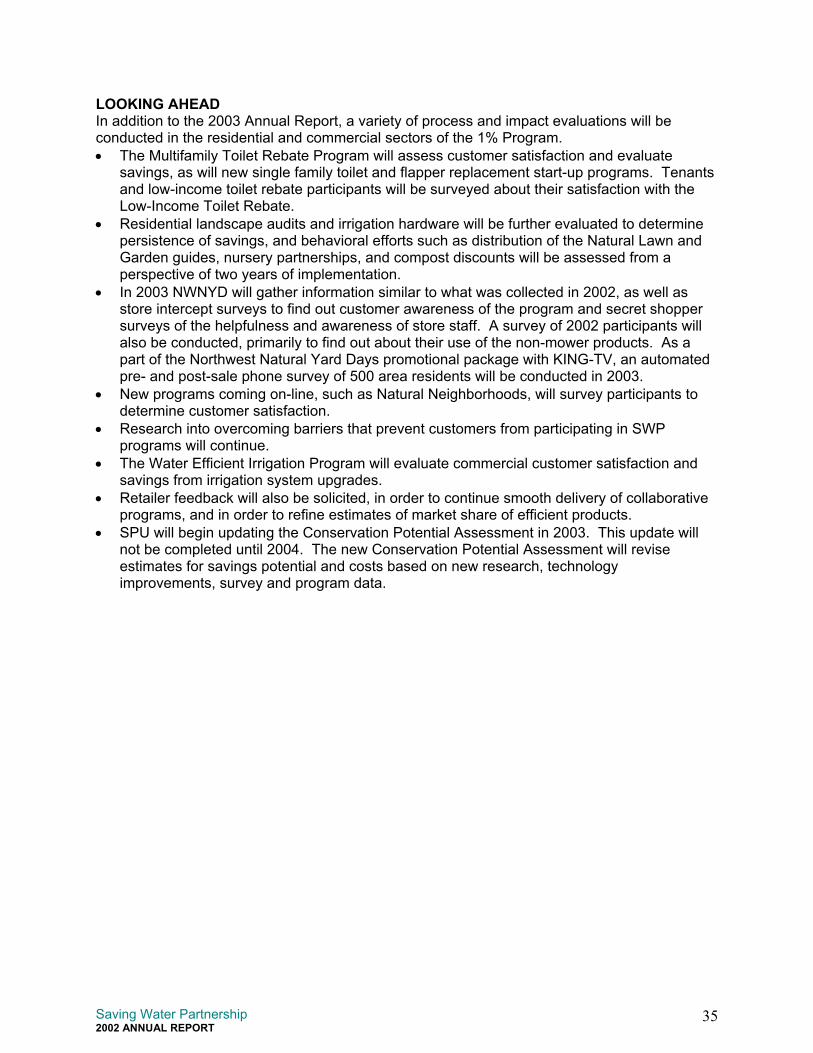
Saving Water Partnership2002 ANNUAL REPORT
35
LOOKING AHEADIn addition to the 2003 Annual Report, a variety of process and impact evaluations will beconducted in the residential and commercial sectors of the 1% Program.• The Multifamily Toilet Rebate Program will assess customer satisfaction and evaluate
savings, as will new single family toilet and flapper replacement start-up programs. Tenantsand low-income toilet rebate participants will be surveyed about their satisfaction with theLow-Income Toilet Rebate.
• Residential landscape audits and irrigation hardware will be further evaluated to determinepersistence of savings, and behavioral efforts such as distribution of the Natural Lawn andGarden guides, nursery partnerships, and compost discounts will be assessed from aperspective of two years of implementation.
• In 2003 NWNYD will gather information similar to what was collected in 2002, as well asstore intercept surveys to find out customer awareness of the program and secret shoppersurveys of the helpfulness and awareness of store staff. A survey of 2002 participants willalso be conducted, primarily to find out about their use of the non-mower products. As apart of the Northwest Natural Yard Days promotional package with KING-TV, an automatedpre- and post-sale phone survey of 500 area residents will be conducted in 2003.
• New programs coming on-line, such as Natural Neighborhoods, will survey participants todetermine customer satisfaction.
• Research into overcoming barriers that prevent customers from participating in SWPprograms will continue.
• The Water Efficient Irrigation Program will evaluate commercial customer satisfaction andsavings from irrigation system upgrades.
• Retailer feedback will also be solicited, in order to continue smooth delivery of collaborativeprograms, and in order to refine estimates of market share of efficient products.
• SPU will begin updating the Conservation Potential Assessment in 2003. This update willnot be completed until 2004. The new Conservation Potential Assessment will reviseestimates for savings potential and costs based on new research, technologyimprovements, survey and program data.
Saving Water Partnership2002 ANNUAL REPORT
36
End Notes 11 2002 Natural Lawn & Garden Summary Notebook, Seattle Public Utilities, 2002.
12 Commercial Program Design Strategy, Seattle Public Utilities, 2001,http://www.ci.seattle.wa.us/util/RESCONS/papers/Comm_Program_Design_Strategy.PDF.
13 Impact and Process Evaluation of the 2001 Commercial Water Conservation Programs: Volume 1: Program Evaluation Report, Seattle Public Utilities, 2002,
http://www.ci.seattle.wa.us/util/RESCONS/papers/2001_Commercial_Water_Vol1.PDF. Volume 2: Participant and Population Surveys, Seattle Public Utilities, 2002,
http://www.ci.seattle.wa.us/util/RESCONS/papers/2001_Commercial_Water_Vol2.PDF. Volume 3: Measure-Specific Evaluation Reports, Seattle Public Utilities, 2002.
14 Impact and Process Evaluation of the 2001 Commercial Water Conservation Programs: Volume 1: Program Evaluation Report, Seattle Public Utilities, 2002,
http://www.ci.seattle.wa.us/util/RESCONS/papers/2001_Commercial_Water_Vol1.PDF. Volume 2: Participant and Population Surveys, Seattle Public Utilities, 2002,
http://www.ci.seattle.wa.us/util/RESCONS/papers/2001_Commercial_Water_Vol2.PDF. Volume 3: Measure-Specific Evaluation Reports, Seattle Public Utilities, 2002.
15 2001 Residential Programs Evaluation Report: Volume 3: 2001 Residential WaterConservation Survey Results, Seattle Public Utilities, 2002,http://www.ci.seattle.wa.us/util/RESCONS/papers/Res_Eval_2001_Vol3.pdf.
16 Conservation Potential Assessment, Seattle Public Utilities, 1998,http://www.ci.seattle.wa.us/util/RESCONS/CPA/default.htm.
17 2001 Residential Programs Evaluation Report: Volume 1: Findings, Seattle Public Utilities, 2002,
http://www.ci.seattle.wa.us/util/RESCONS/papers/Res_Eval_2001_Vol1.pdf. Volume 2: Back Up Reports and Data, Seattle Public Utilities, 2002,
http://www.ci.seattle.wa.us/util/RESCONS/papers/Res_Eval_2001_Vol2.pdf. Volume 3: 2001 Residential Water Conservation Survey Results, Seattle Public Utilities,
2002, http://www.ci.seattle.wa.us/util/RESCONS/papers/Res_Eval_2001_Vol3.pdf.
18 Impact and Process Evaluation of the 2001 Commercial Water Conservation Programs: Volume 1: Program Evaluation Report, Seattle Public Utilities, 2002,
http://www.ci.seattle.wa.us/util/RESCONS/papers/2001_Commercial_Water_Vol1.PDF. Volume 2: Participant and Population Surveys, Seattle Public Utilities, 2002,
http://www.ci.seattle.wa.us/util/RESCONS/papers/2001_Commercial_Water_Vol2.PDF. Volume 3: Measure-Specific Evaluation Reports, Seattle Public Utilities, 2002.
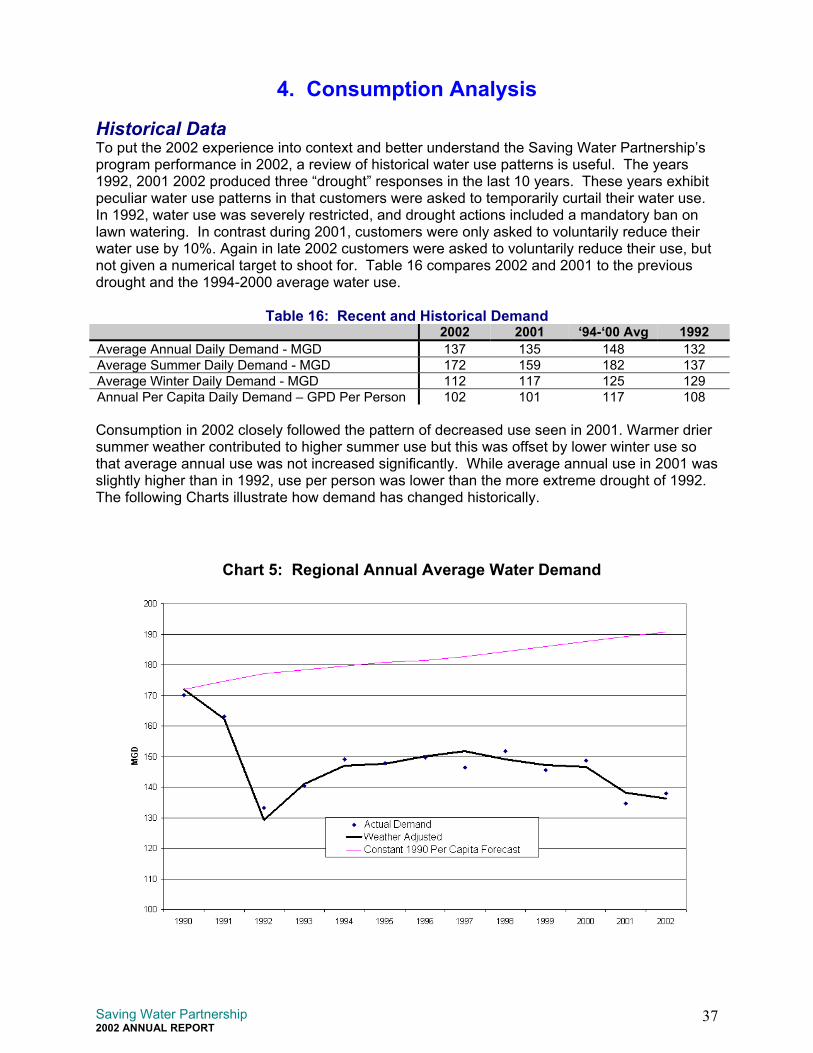
Saving Water Partnership2002 ANNUAL REPORT
37
4. Consumption Analysis
Historical DataTo put the 2002 experience into context and better understand the Saving Water Partnership’sprogram performance in 2002, a review of historical water use patterns is useful. The years1992, 2001 2002 produced three “drought” responses in the last 10 years. These years exhibitpeculiar water use patterns in that customers were asked to temporarily curtail their water use.In 1992, water use was severely restricted, and drought actions included a mandatory ban onlawn watering. In contrast during 2001, customers were only asked to voluntarily reduce theirwater use by 10%. Again in late 2002 customers were asked to voluntarily reduce their use, butnot given a numerical target to shoot for. Table 16 compares 2002 and 2001 to the previousdrought and the 1994-2000 average water use.
Table 16: Recent and Historical Demand2002 2001 ‘94-‘00 Avg 1992
Average Annual Daily Demand - MGD 137 135 148 132Average Summer Daily Demand - MGD 172 159 182 137Average Winter Daily Demand - MGD 112 117 125 129Annual Per Capita Daily Demand – GPD Per Person 102 101 117 108
Consumption in 2002 closely followed the pattern of decreased use seen in 2001. Warmer driersummer weather contributed to higher summer use but this was offset by lower winter use sothat average annual use was not increased significantly. While average annual use in 2001 wasslightly higher than in 1992, use per person was lower than the more extreme drought of 1992.The following Charts illustrate how demand has changed historically.
Chart 5: Regional Annual Average Water Demand
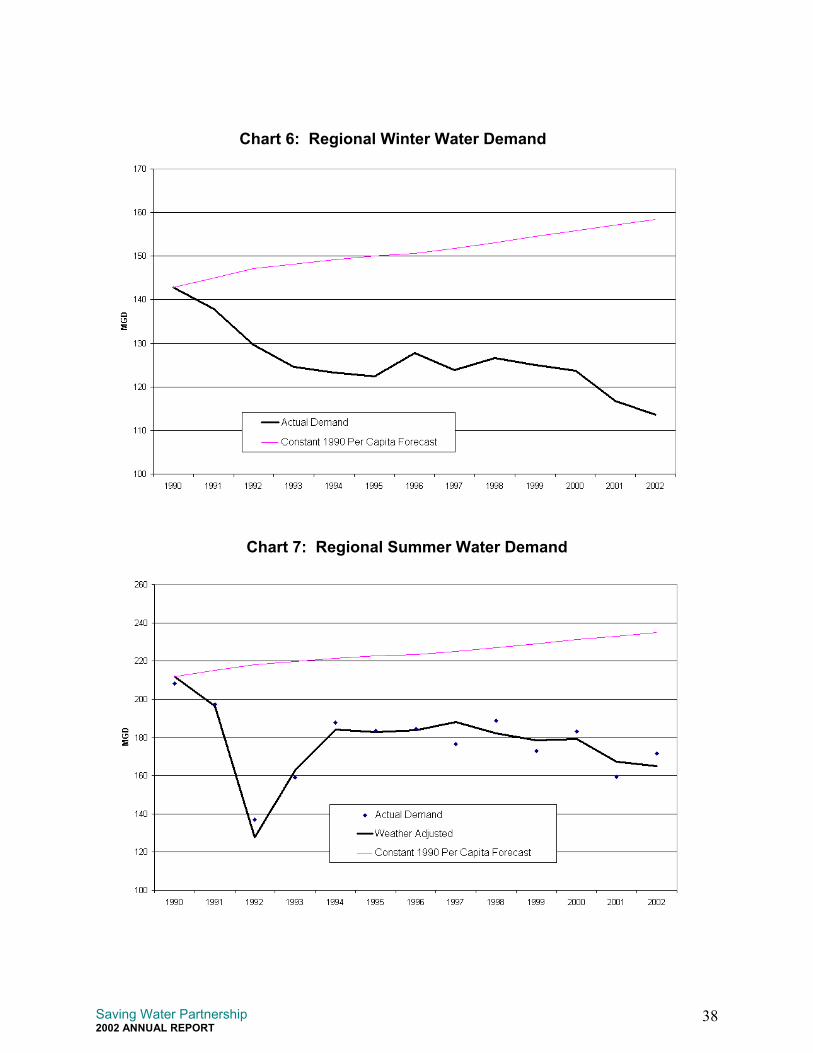
Saving Water Partnership2002 ANNUAL REPORT
38
Chart 6: Regional Winter Water Demand
Chart 7: Regional Summer Water Demand
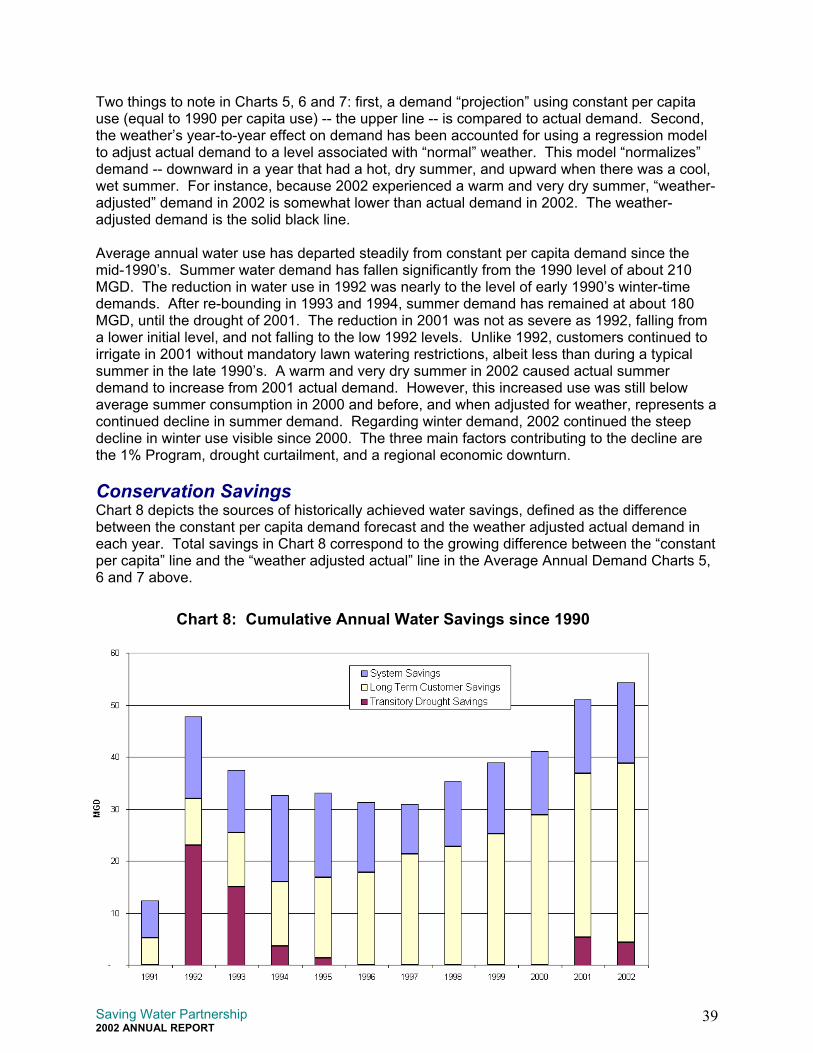
Saving Water Partnership2002 ANNUAL REPORT
39
Two things to note in Charts 5, 6 and 7: first, a demand “projection” using constant per capitause (equal to 1990 per capita use) -- the upper line -- is compared to actual demand. Second,the weather’s year-to-year effect on demand has been accounted for using a regression modelto adjust actual demand to a level associated with “normal” weather. This model “normalizes”demand -- downward in a year that had a hot, dry summer, and upward when there was a cool,wet summer. For instance, because 2002 experienced a warm and very dry summer, “weather-adjusted” demand in 2002 is somewhat lower than actual demand in 2002. The weather-adjusted demand is the solid black line.
Average annual water use has departed steadily from constant per capita demand since themid-1990’s. Summer water demand has fallen significantly from the 1990 level of about 210MGD. The reduction in water use in 1992 was nearly to the level of early 1990’s winter-timedemands. After re-bounding in 1993 and 1994, summer demand has remained at about 180MGD, until the drought of 2001. The reduction in 2001 was not as severe as 1992, falling froma lower initial level, and not falling to the low 1992 levels. Unlike 1992, customers continued toirrigate in 2001 without mandatory lawn watering restrictions, albeit less than during a typicalsummer in the late 1990’s. A warm and very dry summer in 2002 caused actual summerdemand to increase from 2001 actual demand. However, this increased use was still belowaverage summer consumption in 2000 and before, and when adjusted for weather, represents acontinued decline in summer demand. Regarding winter demand, 2002 continued the steepdecline in winter use visible since 2000. The three main factors contributing to the decline arethe 1% Program, drought curtailment, and a regional economic downturn.
Conservation SavingsChart 8 depicts the sources of historically achieved water savings, defined as the differencebetween the constant per capita demand forecast and the weather adjusted actual demand ineach year. Total savings in Chart 8 correspond to the growing difference between the “constantper capita” line and the “weather adjusted actual” line in the Average Annual Demand Charts 5,6 and 7 above.
Chart 8: Cumulative Annual Water Savings since 1990
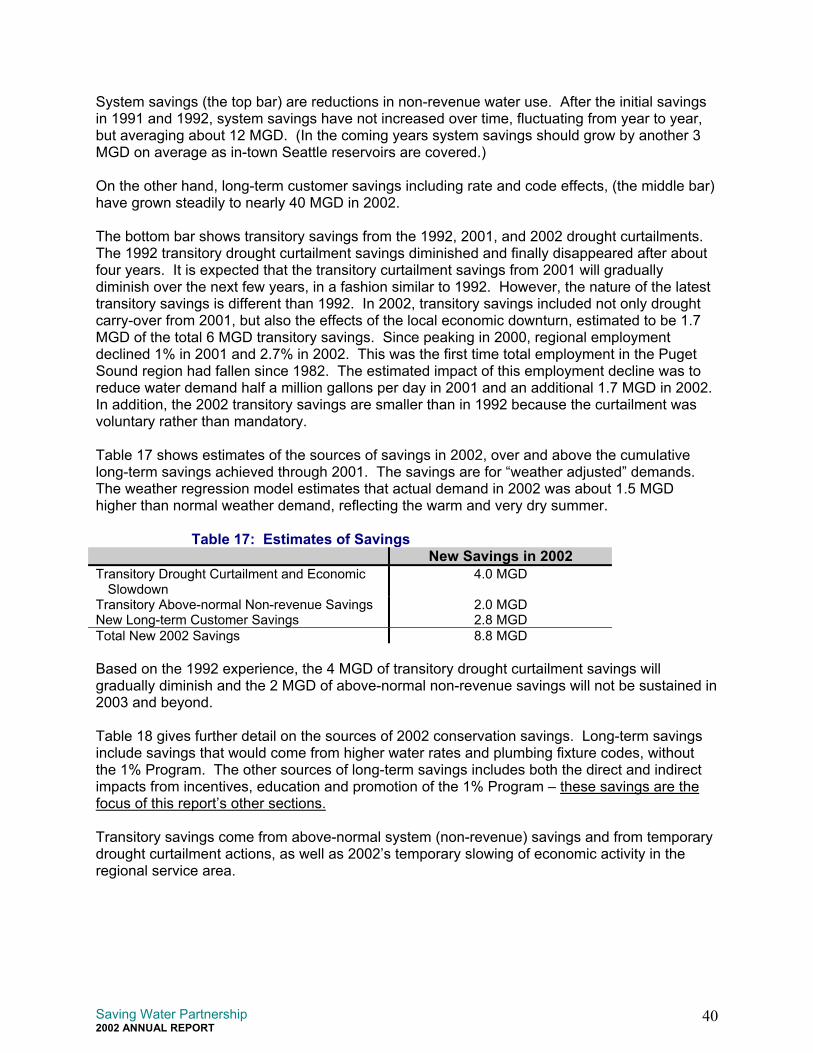
Saving Water Partnership2002 ANNUAL REPORT
40
System savings (the top bar) are reductions in non-revenue water use. After the initial savingsin 1991 and 1992, system savings have not increased over time, fluctuating from year to year,but averaging about 12 MGD. (In the coming years system savings should grow by another 3MGD on average as in-town Seattle reservoirs are covered.)
On the other hand, long-term customer savings including rate and code effects, (the middle bar)have grown steadily to nearly 40 MGD in 2002.
The bottom bar shows transitory savings from the 1992, 2001, and 2002 drought curtailments.The 1992 transitory drought curtailment savings diminished and finally disappeared after aboutfour years. It is expected that the transitory curtailment savings from 2001 will graduallydiminish over the next few years, in a fashion similar to 1992. However, the nature of the latesttransitory savings is different than 1992. In 2002, transitory savings included not only droughtcarry-over from 2001, but also the effects of the local economic downturn, estimated to be 1.7MGD of the total 6 MGD transitory savings. Since peaking in 2000, regional employmentdeclined 1% in 2001 and 2.7% in 2002. This was the first time total employment in the PugetSound region had fallen since 1982. The estimated impact of this employment decline was toreduce water demand half a million gallons per day in 2001 and an additional 1.7 MGD in 2002.In addition, the 2002 transitory savings are smaller than in 1992 because the curtailment wasvoluntary rather than mandatory.
Table 17 shows estimates of the sources of savings in 2002, over and above the cumulativelong-term savings achieved through 2001. The savings are for “weather adjusted” demands.The weather regression model estimates that actual demand in 2002 was about 1.5 MGDhigher than normal weather demand, reflecting the warm and very dry summer.
Table 17: Estimates of SavingsNew Savings in 2002
Transitory Drought Curtailment and EconomicSlowdown
4.0 MGD
Transitory Above-normal Non-revenue Savings 2.0 MGDNew Long-term Customer Savings 2.8 MGDTotal New 2002 Savings 8.8 MGD
Based on the 1992 experience, the 4 MGD of transitory drought curtailment savings willgradually diminish and the 2 MGD of above-normal non-revenue savings will not be sustained in2003 and beyond.
Table 18 gives further detail on the sources of 2002 conservation savings. Long-term savingsinclude savings that would come from higher water rates and plumbing fixture codes, withoutthe 1% Program. The other sources of long-term savings includes both the direct and indirectimpacts from incentives, education and promotion of the 1% Program – these savings are thefocus of this report’s other sections.
Transitory savings come from above-normal system (non-revenue) savings and from temporarydrought curtailment actions, as well as 2002’s temporary slowing of economic activity in theregional service area.
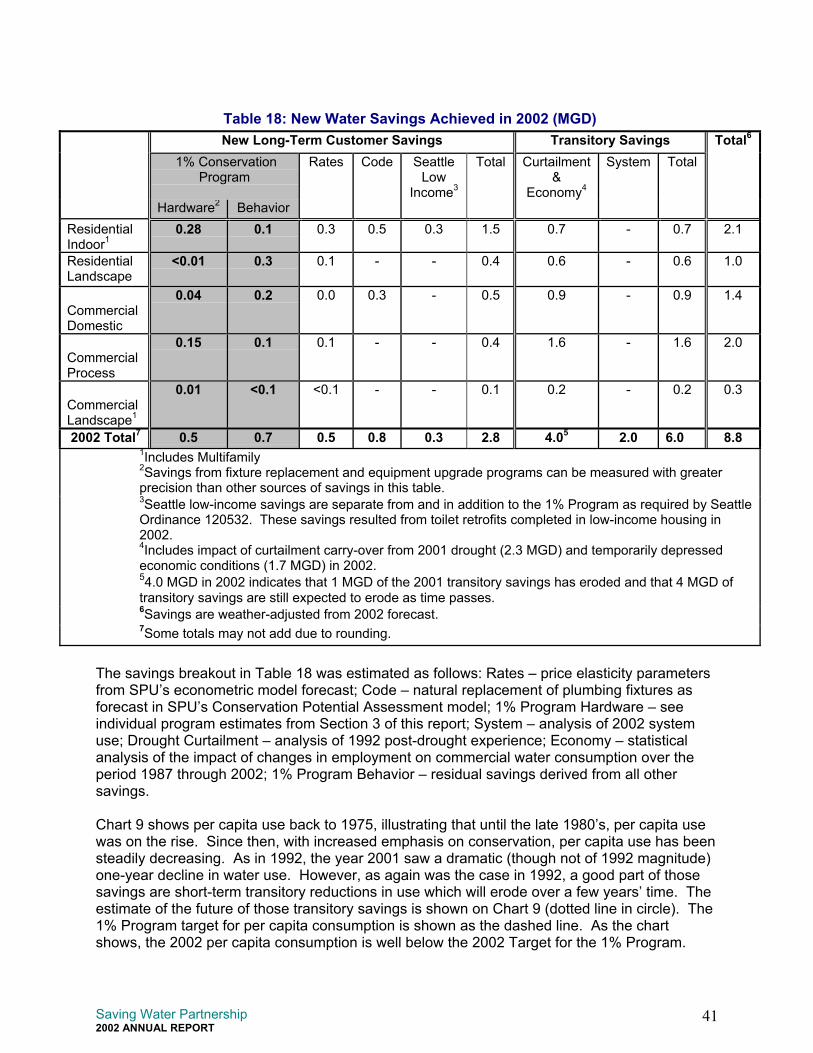
Saving Water Partnership2002 ANNUAL REPORT
41
Table 18: New Water Savings Achieved in 2002 (MGD) New Long-Term Customer Savings Transitory Savings Total6
1% ConservationProgram
Rates Code SeattleLow
Income3
Total Curtailment&
Economy4
System Total
Hardware2 Behavior ResidentialIndoor1
0.28 0.1 0.3 0.5 0.3 1.5 0.7 - 0.7 2.1
ResidentialLandscape
<0.01 0.3 0.1 - - 0.4 0.6 - 0.6 1.0
CommercialDomestic
0.04 0.2 0.0 0.3 - 0.5 0.9 - 0.9 1.4
CommercialProcess
0.15 0.1 0.1 - - 0.4 1.6 - 1.6 2.0
CommercialLandscape1
0.01 <0.1 <0.1 - - 0.1 0.2 - 0.2 0.3
2002 Total7 0.5 0.7 0.5 0.8 0.3 2.8 4.05 2.0 6.0 8.81Includes Multifamily2Savings from fixture replacement and equipment upgrade programs can be measured with greaterprecision than other sources of savings in this table.3Seattle low-income savings are separate from and in addition to the 1% Program as required by SeattleOrdinance 120532. These savings resulted from toilet retrofits completed in low-income housing in2002.4Includes impact of curtailment carry-over from 2001 drought (2.3 MGD) and temporarily depressedeconomic conditions (1.7 MGD) in 2002.54.0 MGD in 2002 indicates that 1 MGD of the 2001 transitory savings has eroded and that 4 MGD oftransitory savings are still expected to erode as time passes.6Savings are weather-adjusted from 2002 forecast.
7Some totals may not add due to rounding.
The savings breakout in Table 18 was estimated as follows: Rates – price elasticity parametersfrom SPU’s econometric model forecast; Code – natural replacement of plumbing fixtures asforecast in SPU’s Conservation Potential Assessment model; 1% Program Hardware – seeindividual program estimates from Section 3 of this report; System – analysis of 2002 systemuse; Drought Curtailment – analysis of 1992 post-drought experience; Economy – statisticalanalysis of the impact of changes in employment on commercial water consumption over theperiod 1987 through 2002; 1% Program Behavior – residual savings derived from all othersavings.
Chart 9 shows per capita use back to 1975, illustrating that until the late 1980’s, per capita usewas on the rise. Since then, with increased emphasis on conservation, per capita use has beensteadily decreasing. As in 1992, the year 2001 saw a dramatic (though not of 1992 magnitude)one-year decline in water use. However, as again was the case in 1992, a good part of thosesavings are short-term transitory reductions in use which will erode over a few years’ time. Theestimate of the future of those transitory savings is shown on Chart 9 (dotted line in circle). The1% Program target for per capita consumption is shown as the dashed line. As the chartshows, the 2002 per capita consumption is well below the 2002 Target for the 1% Program.
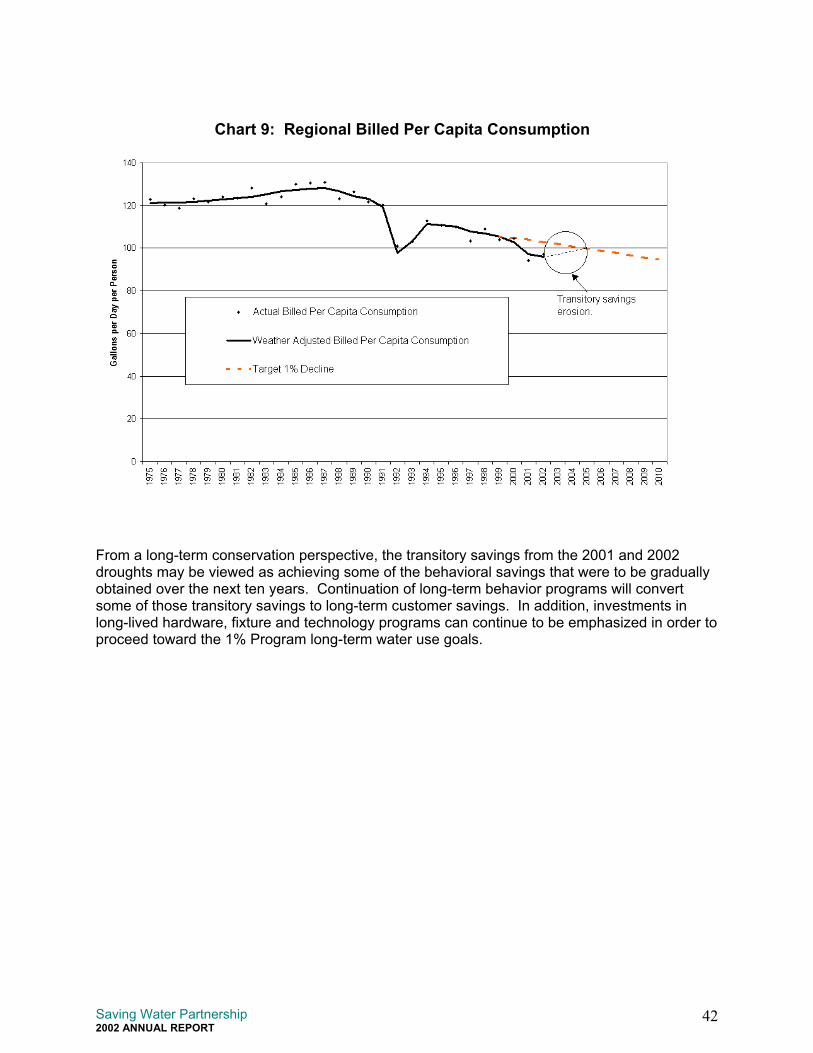
Saving Water Partnership2002 ANNUAL REPORT
42
From a long-term conservation perspective, the transitory savings from the 2001 and 2002droughts may be viewed as achieving some of the behavioral savings that were to be graduallyobtained over the next ten years. Continuation of long-term behavior programs will convertsome of those transitory savings to long-term customer savings. In addition, investments inlong-lived hardware, fixture and technology programs can continue to be emphasized in order toproceed toward the 1% Program long-term water use goals.
Chart 9: Regional Billed Per Capita Consumption
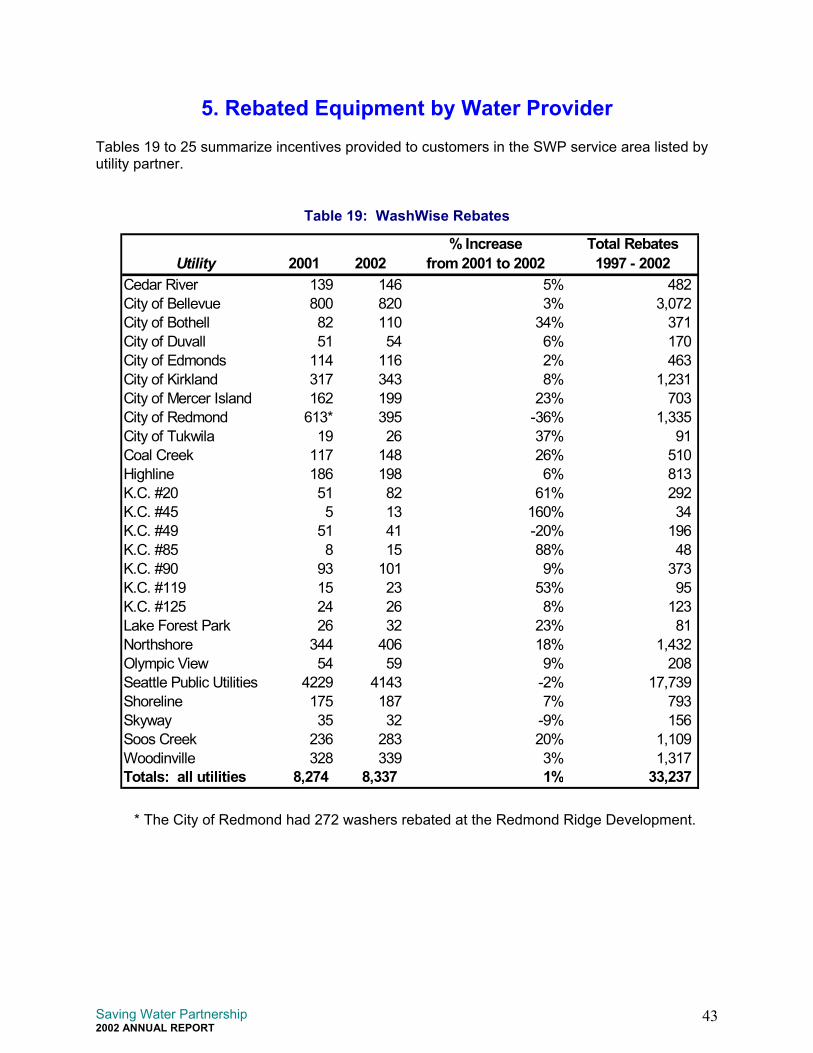
Saving Water Partnership2002 ANNUAL REPORT
43
* The City of Redmond had 272 washers rebated at the Redmond Ridge Development.
5. Rebated Equipment by Water ProviderTables 19 to 25 summarize incentives provided to customers in the SWP service area listed byutility partner.
Table 19: WashWise Rebates
% Increase Total RebatesUtility 2001 2002 from 2001 to 2002 1997 - 2002
Cedar River 139 146 5% 482 City of Bellevue 800 820 3% 3,072 City of Bothell 82 110 34% 371 City of Duvall 51 54 6% 170 City of Edmonds 114 116 2% 463 City of Kirkland 317 343 8% 1,231 City of Mercer Island 162 199 23% 703 City of Redmond 613* 395 -36% 1,335 City of Tukwila 19 26 37% 91 Coal Creek 117 148 26% 510 Highline 186 198 6% 813 K.C. #20 51 82 61% 292 K.C. #45 5 13 160% 34 K.C. #49 51 41 -20% 196 K.C. #85 8 15 88% 48 K.C. #90 93 101 9% 373 K.C. #119 15 23 53% 95 K.C. #125 24 26 8% 123 Lake Forest Park 26 32 23% 81 Northshore 344 406 18% 1,432 Olympic View 54 59 9% 208 Seattle Public Utilities 4229 4143 -2% 17,739 Shoreline 175 187 7% 793 Skyway 35 32 -9% 156 Soos Creek 236 283 20% 1,109 Woodinville 328 339 3% 1,317 Totals: all utilities 8,274 8,337 1% 33,237
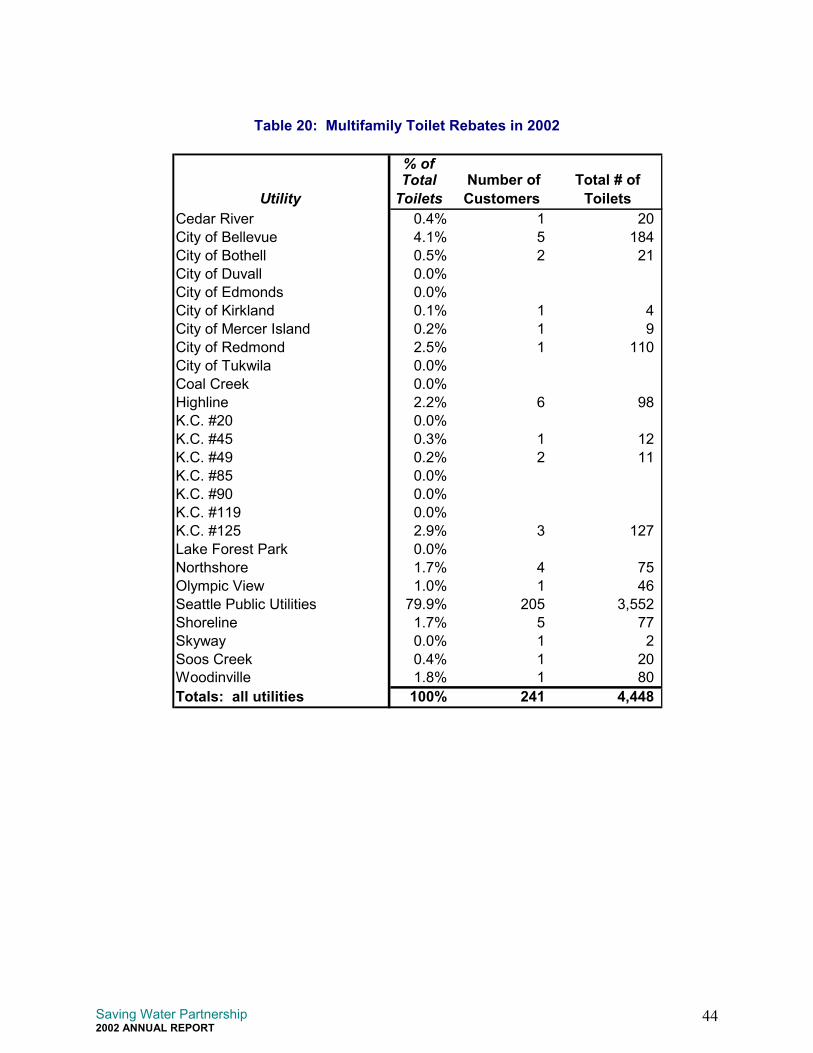
Saving Water Partnership2002 ANNUAL REPORT
44
Table 20: Multifamily Toilet Rebates in 2002
% of
UtilityTotal
ToiletsNumber of Customers
Total # of Toilets
Cedar River 0.4% 1 20 City of Bellevue 4.1% 5 184 City of Bothell 0.5% 2 21 City of Duvall 0.0%City of Edmonds 0.0%City of Kirkland 0.1% 1 4 City of Mercer Island 0.2% 1 9 City of Redmond 2.5% 1 110 City of Tukwila 0.0%Coal Creek 0.0%Highline 2.2% 6 98 K.C. #20 0.0%K.C. #45 0.3% 1 12 K.C. #49 0.2% 2 11 K.C. #85 0.0%K.C. #90 0.0%K.C. #119 0.0%K.C. #125 2.9% 3 127 Lake Forest Park 0.0%Northshore 1.7% 4 75 Olympic View 1.0% 1 46 Seattle Public Utilities 79.9% 205 3,552 Shoreline 1.7% 5 77 Skyway 0.0% 1 2 Soos Creek 0.4% 1 20 Woodinville 1.8% 1 80 Totals: all utilities 100% 241 4,448
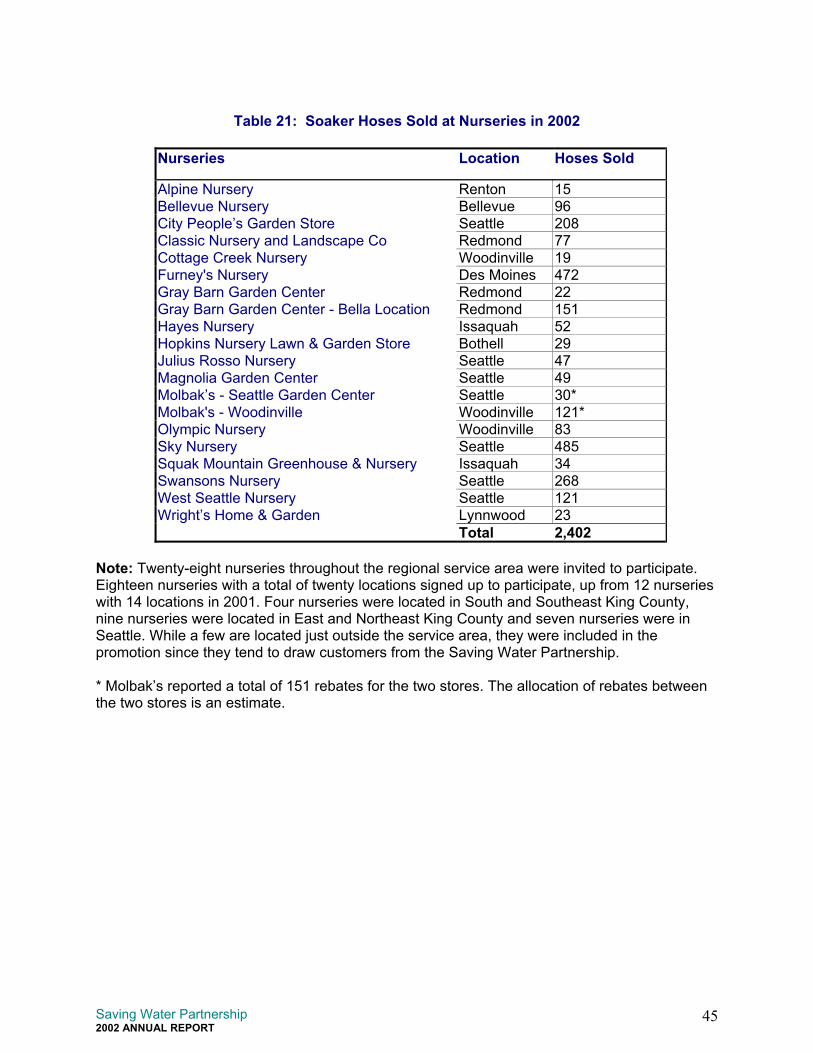
Saving Water Partnership2002 ANNUAL REPORT
45
Table 21: Soaker Hoses Sold at Nurseries in 2002
Nurseries Location Hoses Sold
Alpine Nursery Renton 15Bellevue Nursery Bellevue 96City People’s Garden Store Seattle 208Classic Nursery and Landscape Co Redmond 77Cottage Creek Nursery Woodinville 19Furney's Nursery Des Moines 472Gray Barn Garden Center Redmond 22Gray Barn Garden Center - Bella Location Redmond 151Hayes Nursery Issaquah 52Hopkins Nursery Lawn & Garden Store Bothell 29Julius Rosso Nursery Seattle 47Magnolia Garden Center Seattle 49Molbak’s - Seattle Garden Center Seattle 30*Molbak's - Woodinville Woodinville 121*Olympic Nursery Woodinville 83Sky Nursery Seattle 485Squak Mountain Greenhouse & Nursery Issaquah 34Swansons Nursery Seattle 268West Seattle Nursery Seattle 121Wright’s Home & Garden Lynnwood 23
Total 2,402
Note: Twenty-eight nurseries throughout the regional service area were invited to participate.Eighteen nurseries with a total of twenty locations signed up to participate, up from 12 nurserieswith 14 locations in 2001. Four nurseries were located in South and Southeast King County,nine nurseries were located in East and Northeast King County and seven nurseries were inSeattle. While a few are located just outside the service area, they were included in thepromotion since they tend to draw customers from the Saving Water Partnership.
* Molbak’s reported a total of 151 rebates for the two stores. The allocation of rebates betweenthe two stores is an estimate.
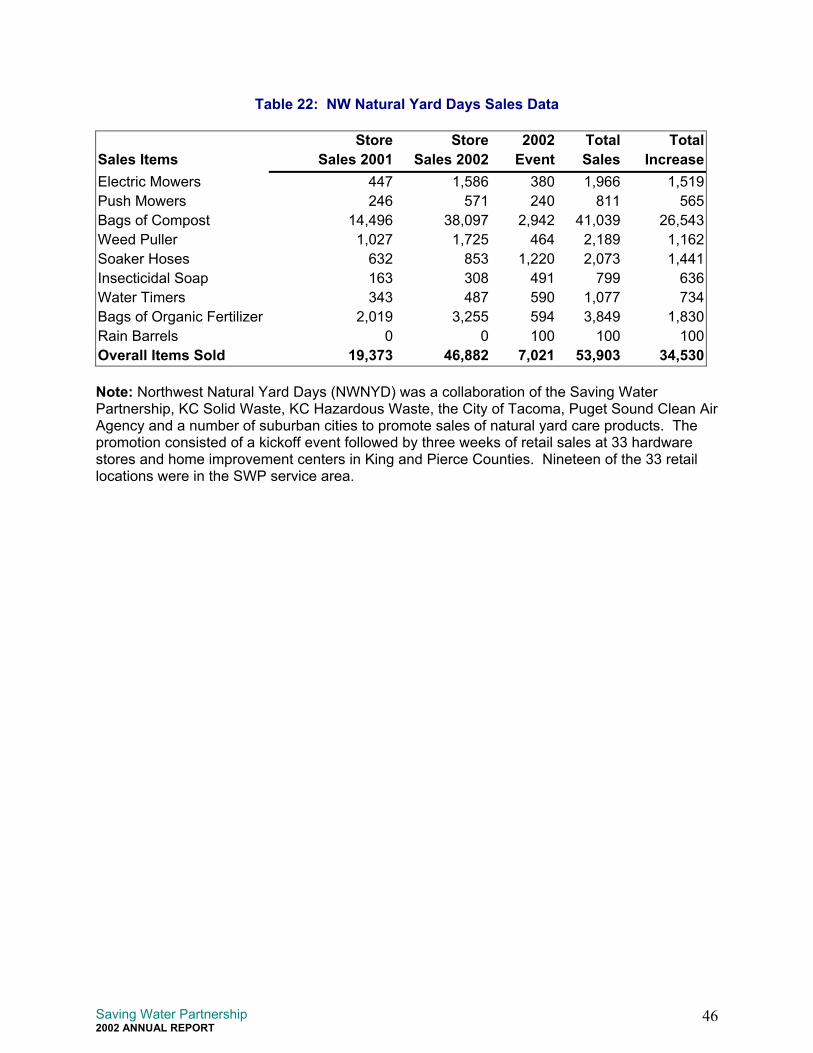
Saving Water Partnership2002 ANNUAL REPORT
46
Table 22: NW Natural Yard Days Sales Data
Store Store 2002 Total TotalSales Items Sales 2001 Sales 2002 Event Sales IncreaseElectric Mowers 447 1,586 380 1,966 1,519Push Mowers 246 571 240 811 565Bags of Compost 14,496 38,097 2,942 41,039 26,543Weed Puller 1,027 1,725 464 2,189 1,162Soaker Hoses 632 853 1,220 2,073 1,441Insecticidal Soap 163 308 491 799 636Water Timers 343 487 590 1,077 734Bags of Organic Fertilizer 2,019 3,255 594 3,849 1,830Rain Barrels 0 0 100 100 100Overall Items Sold 19,373 46,882 7,021 53,903 34,530
Note: Northwest Natural Yard Days (NWNYD) was a collaboration of the Saving WaterPartnership, KC Solid Waste, KC Hazardous Waste, the City of Tacoma, Puget Sound Clean AirAgency and a number of suburban cities to promote sales of natural yard care products. Thepromotion consisted of a kickoff event followed by three weeks of retail sales at 33 hardwarestores and home improvement centers in King and Pierce Counties. Nineteen of the 33 retaillocations were in the SWP service area.
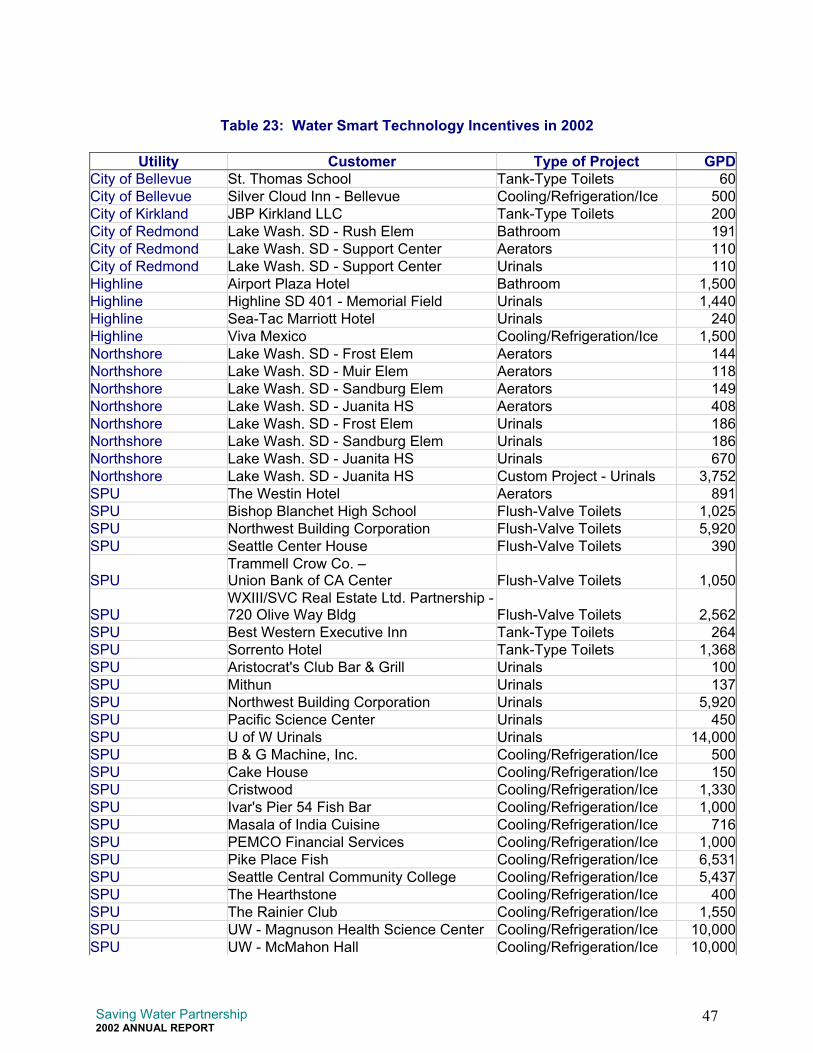
Saving Water Partnership2002 ANNUAL REPORT
47
Table 23: Water Smart Technology Incentives in 2002
Utility Customer Type of Project GPDCity of Bellevue St. Thomas School Tank-Type Toilets 60City of Bellevue Silver Cloud Inn - Bellevue Cooling/Refrigeration/Ice 500City of Kirkland JBP Kirkland LLC Tank-Type Toilets 200City of Redmond Lake Wash. SD - Rush Elem Bathroom 191City of Redmond Lake Wash. SD - Support Center Aerators 110City of Redmond Lake Wash. SD - Support Center Urinals 110Highline Airport Plaza Hotel Bathroom 1,500Highline Highline SD 401 - Memorial Field Urinals 1,440Highline Sea-Tac Marriott Hotel Urinals 240Highline Viva Mexico Cooling/Refrigeration/Ice 1,500Northshore Lake Wash. SD - Frost Elem Aerators 144Northshore Lake Wash. SD - Muir Elem Aerators 118Northshore Lake Wash. SD - Sandburg Elem Aerators 149Northshore Lake Wash. SD - Juanita HS Aerators 408Northshore Lake Wash. SD - Frost Elem Urinals 186Northshore Lake Wash. SD - Sandburg Elem Urinals 186Northshore Lake Wash. SD - Juanita HS Urinals 670Northshore Lake Wash. SD - Juanita HS Custom Project - Urinals 3,752SPU The Westin Hotel Aerators 891SPU Bishop Blanchet High School Flush-Valve Toilets 1,025SPU Northwest Building Corporation Flush-Valve Toilets 5,920SPU Seattle Center House Flush-Valve Toilets 390
SPUTrammell Crow Co. –Union Bank of CA Center Flush-Valve Toilets 1,050
SPUWXIII/SVC Real Estate Ltd. Partnership -720 Olive Way Bldg Flush-Valve Toilets 2,562
SPU Best Western Executive Inn Tank-Type Toilets 264SPU Sorrento Hotel Tank-Type Toilets 1,368SPU Aristocrat's Club Bar & Grill Urinals 100SPU Mithun Urinals 137SPU Northwest Building Corporation Urinals 5,920SPU Pacific Science Center Urinals 450SPU U of W Urinals Urinals 14,000SPU B & G Machine, Inc. Cooling/Refrigeration/Ice 500SPU Cake House Cooling/Refrigeration/Ice 150SPU Cristwood Cooling/Refrigeration/Ice 1,330SPU Ivar's Pier 54 Fish Bar Cooling/Refrigeration/Ice 1,000SPU Masala of India Cuisine Cooling/Refrigeration/Ice 716SPU PEMCO Financial Services Cooling/Refrigeration/Ice 1,000SPU Pike Place Fish Cooling/Refrigeration/Ice 6,531SPU Seattle Central Community College Cooling/Refrigeration/Ice 5,437SPU The Hearthstone Cooling/Refrigeration/Ice 400SPU The Rainier Club Cooling/Refrigeration/Ice 1,550SPU UW - Magnuson Health Science Center Cooling/Refrigeration/Ice 10,000SPU UW - McMahon Hall Cooling/Refrigeration/Ice 10,000
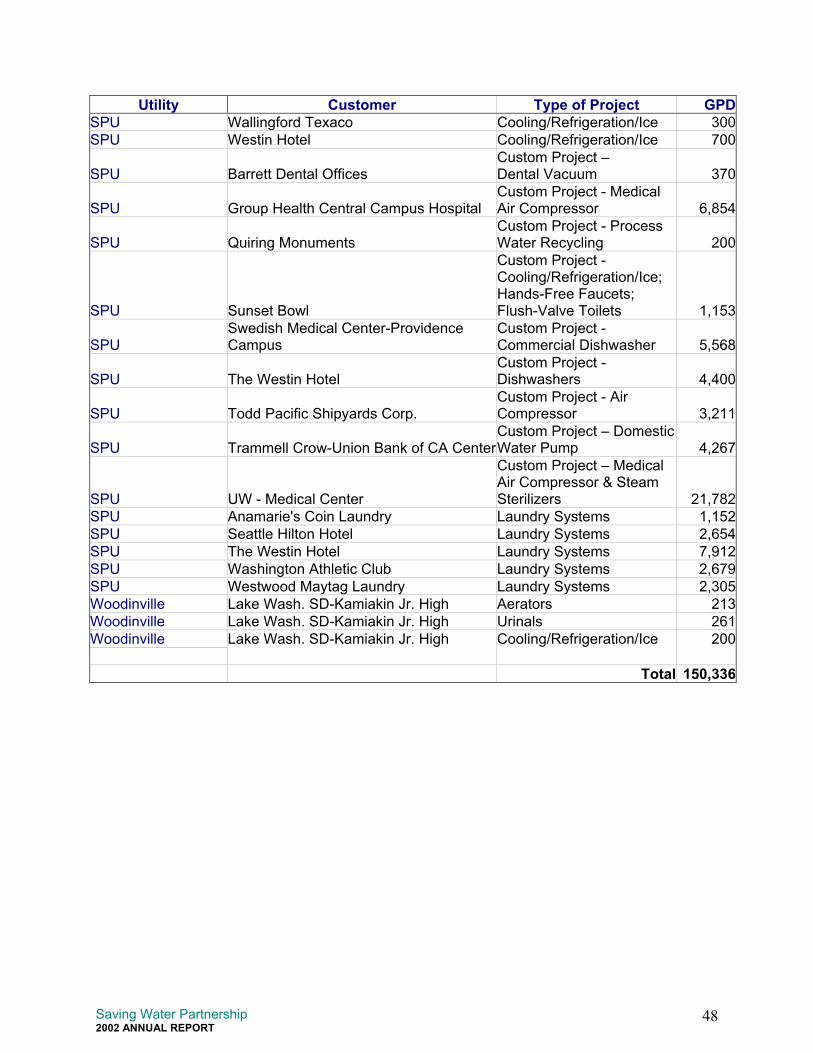
Saving Water Partnership2002 ANNUAL REPORT
48
Utility Customer Type of Project GPDSPU Wallingford Texaco Cooling/Refrigeration/Ice 300SPU Westin Hotel Cooling/Refrigeration/Ice 700
SPU Barrett Dental OfficesCustom Project – Dental Vacuum 370
SPU Group Health Central Campus HospitalCustom Project - MedicalAir Compressor 6,854
SPU Quiring MonumentsCustom Project - ProcessWater Recycling 200
SPU Sunset Bowl
Custom Project -Cooling/Refrigeration/Ice;Hands-Free Faucets;Flush-Valve Toilets 1,153
SPUSwedish Medical Center-ProvidenceCampus
Custom Project -Commercial Dishwasher 5,568
SPU The Westin HotelCustom Project -Dishwashers 4,400
SPU Todd Pacific Shipyards Corp.Custom Project - AirCompressor 3,211
SPU Trammell Crow-Union Bank of CA CenterCustom Project – DomesticWater Pump 4,267
SPU UW - Medical Center
Custom Project – MedicalAir Compressor & SteamSterilizers 21,782
SPU Anamarie's Coin Laundry Laundry Systems 1,152SPU Seattle Hilton Hotel Laundry Systems 2,654SPU The Westin Hotel Laundry Systems 7,912SPU Washington Athletic Club Laundry Systems 2,679SPU Westwood Maytag Laundry Laundry Systems 2,305Woodinville Lake Wash. SD-Kamiakin Jr. High Aerators 213Woodinville Lake Wash. SD-Kamiakin Jr. High Urinals 261Woodinville Lake Wash. SD-Kamiakin Jr. High Cooling/Refrigeration/Ice 200
Total 150,336
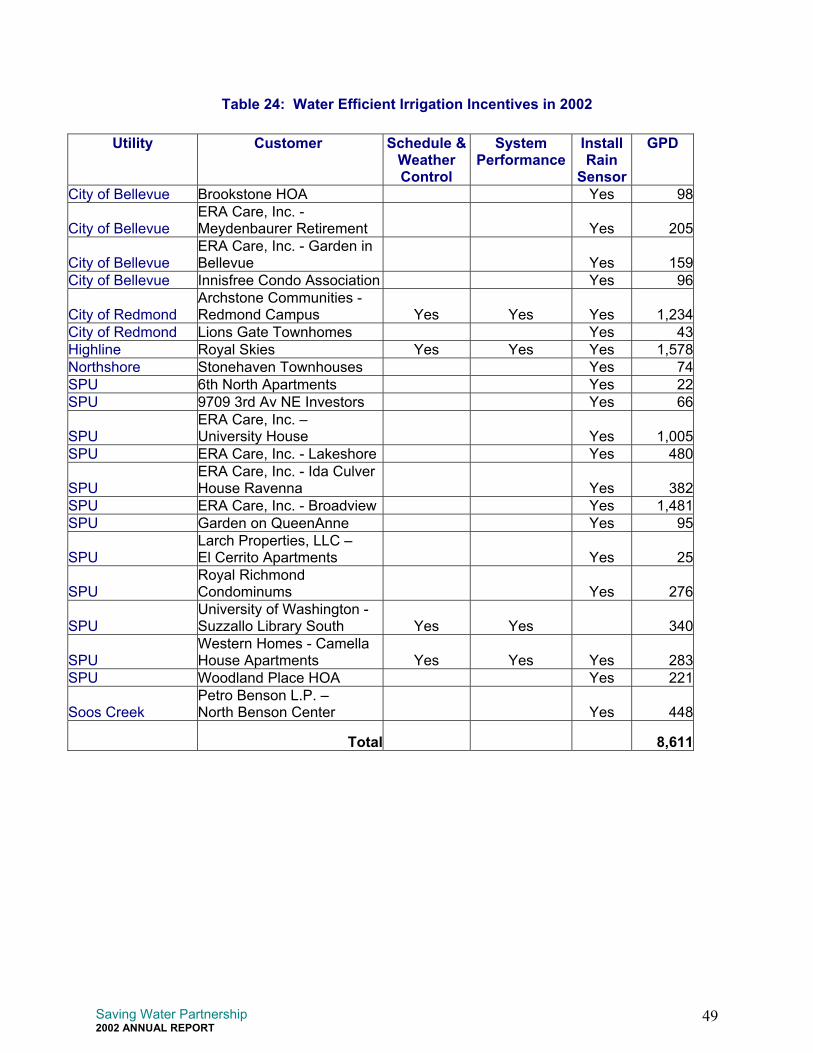
Saving Water Partnership2002 ANNUAL REPORT
49
Table 24: Water Efficient Irrigation Incentives in 2002
Utility Customer Schedule &WeatherControl
SystemPerformance
InstallRain
Sensor
GPD
City of Bellevue Brookstone HOA Yes 98
City of BellevueERA Care, Inc. -Meydenbaurer Retirement Yes 205
City of BellevueERA Care, Inc. - Garden inBellevue Yes 159
City of Bellevue Innisfree Condo Association Yes 96
City of RedmondArchstone Communities -Redmond Campus Yes Yes Yes 1,234
City of Redmond Lions Gate Townhomes Yes 43Highline Royal Skies Yes Yes Yes 1,578Northshore Stonehaven Townhouses Yes 74SPU 6th North Apartments Yes 22SPU 9709 3rd Av NE Investors Yes 66
SPUERA Care, Inc. –University House Yes 1,005
SPU ERA Care, Inc. - Lakeshore Yes 480
SPUERA Care, Inc. - Ida CulverHouse Ravenna Yes 382
SPU ERA Care, Inc. - Broadview Yes 1,481SPU Garden on QueenAnne Yes 95
SPULarch Properties, LLC –El Cerrito Apartments Yes 25
SPURoyal RichmondCondominums Yes 276
SPUUniversity of Washington -Suzzallo Library South Yes Yes 340
SPUWestern Homes - CamellaHouse Apartments Yes Yes Yes 283
SPU Woodland Place HOA Yes 221
Soos Creek Petro Benson L.P. –North Benson Center Yes 448
Total 8,611
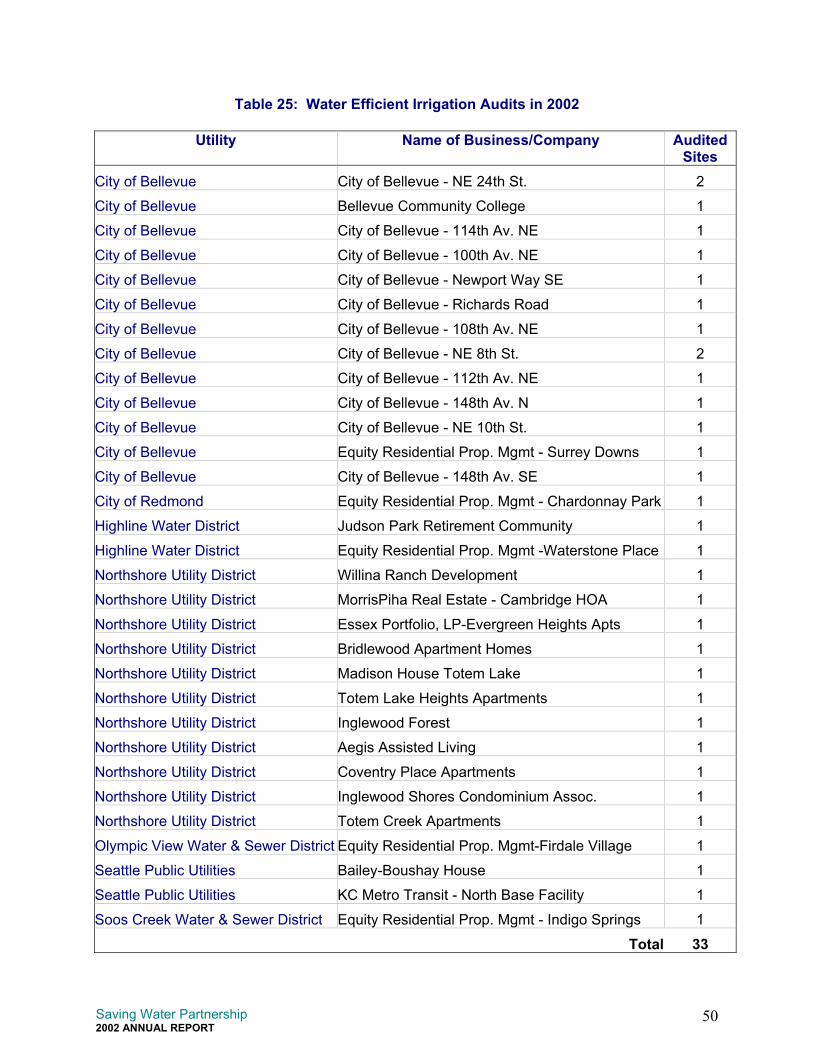
Saving Water Partnership2002 ANNUAL REPORT
50
Table 25: Water Efficient Irrigation Audits in 2002
Utility Name of Business/Company AuditedSites
City of Bellevue City of Bellevue - NE 24th St. 2
City of Bellevue Bellevue Community College 1
City of Bellevue City of Bellevue - 114th Av. NE 1
City of Bellevue City of Bellevue - 100th Av. NE 1
City of Bellevue City of Bellevue - Newport Way SE 1
City of Bellevue City of Bellevue - Richards Road 1
City of Bellevue City of Bellevue - 108th Av. NE 1
City of Bellevue City of Bellevue - NE 8th St. 2
City of Bellevue City of Bellevue - 112th Av. NE 1
City of Bellevue City of Bellevue - 148th Av. N 1
City of Bellevue City of Bellevue - NE 10th St. 1
City of Bellevue Equity Residential Prop. Mgmt - Surrey Downs 1
City of Bellevue City of Bellevue - 148th Av. SE 1
City of Redmond Equity Residential Prop. Mgmt - Chardonnay Park 1
Highline Water District Judson Park Retirement Community 1
Highline Water District Equity Residential Prop. Mgmt -Waterstone Place 1
Northshore Utility District Willina Ranch Development 1
Northshore Utility District MorrisPiha Real Estate - Cambridge HOA 1
Northshore Utility District Essex Portfolio, LP-Evergreen Heights Apts 1
Northshore Utility District Bridlewood Apartment Homes 1
Northshore Utility District Madison House Totem Lake 1
Northshore Utility District Totem Lake Heights Apartments 1
Northshore Utility District Inglewood Forest 1
Northshore Utility District Aegis Assisted Living 1
Northshore Utility District Coventry Place Apartments 1
Northshore Utility District Inglewood Shores Condominium Assoc. 1
Northshore Utility District Totem Creek Apartments 1
Olympic View Water & Sewer District Equity Residential Prop. Mgmt-Firdale Village 1
Seattle Public Utilities Bailey-Boushay House 1
Seattle Public Utilities KC Metro Transit - North Base Facility 1
Soos Creek Water & Sewer District Equity Residential Prop. Mgmt - Indigo Springs 1
Total 33
Saving Water Partnership2002 ANNUAL REPORT
51
Select Commercial Project Descriptions
Lake Washington School District (Air-Cooled Ice Machines, Air Conditioning andRefrigeration, Water Controls, Flush Valves)City of Redmond, Northshore Utility District, Woodinville Water District, City of KirklandLake Washington School District performed an extensive amount of water conservation thatinvolved work in 19 different schools and four water districts. Measures completed werereplacing water-cooled ice machines, converting water-cooled refrigeration and air-conditioningto air-cooled, installing efficient showerheads and water controls, new individual urinal flush-valves replacing continuous flushing urinals, low-flow aerators, and low volume flush-valves intoilets and urinals. Cumulative savings in excess of 20,000 gpd is expected.
Pike Place Fish (Air-Cooled Ice Machine)Seattle Public UtilitiesOne more, maybe the last large water-cooled ice maker in the Seattle direct service area, waseliminated when a project at Pike Place Fish was completed early in 2002. Nearly 10,000pounds of ice, using up to 8,000 gallons of water per day, was being produced with the existingwater-cooled ice maker at this landmark facility. A new air-cooled machine was installed thateliminated nearly all this water consumption.
University of Washington (UW) (Waterless Urinals, Vacuum Pump, Cooling Tower, DryCooler, Restroom Pilot)Seattle Public UtilitiesOver the past two years, UW, with technical assistance from the Water Smart TechnologyProgram and the Water Efficient Irrigation Program, has embarked on a comprehensive waterconservation program. This has resulted in a reduction in average daily use from over 2.2 MGDin 2000, to approximately 2.0 MGD in 2001, and 1.8 MGD in 2002. Major projects completed in2002 with assistance from the 1% Program are outlined below. Additional savings wererealized, without direct financial assistance from the 1% Program, through leak reduction, repairof malfunctioning equipment, and improved irrigation practices.
UW Facilities installed 100 no-water urinals at a wide variety of locations across the maincampus. The installations have been well accepted by students, faculty, and custodial andmaintenance staff. Following a year’s experience with these units, the UW is consideringadditional installations of no-water urinals for 2003. Total water savings from this project isprojected at 14,000 GPD.
UW Health Sciences replaced an existing liquid ring water-cooled vacuum producer serving theMagnuson Health Science Center with an air cooled model. The original equipment had alsobeen installed with a constant air bleed into the vacuum system to keep the system from cyclingon and off. The new vacuum producer was installed without the air bleed but with new controlswhich should result in substantial energy savings as well as water savings. Water savings fromthis project are projected at 7,500 GPD.
As part of a project to replace a malfunctioning cooling tower in Magnuson Health ScienceCenter, UW also installed additional piping to allow the new tower to serve a number ofadditional cooling loads in the building which had been using single pass water. The newcooling tower was also specified with a variable speed motor to save energy. Total watersavings from connection of the additional loads is projected at 10,000 GPD.
Saving Water Partnership2002 ANNUAL REPORT
52
A dry cooler was installed to serve existing water-cooled refrigeration equipment in theMcMahon Hall Kitchen. This equipment had previously been cooled with single pass water.Water savings from this project are projected at 10,000 GPD.
A pilot restroom retrofit project was completed in Balmer Hall. Results from this pilot will beused by UW in selecting equipment for a campus-wide restroom retrofit program scheduled tobegin in 2003. Sample wall mount toilets were obtained from eight different manufacturers andinstalled in restrooms on the same floor. These toilets were then subjected to a variety ofstandardized tests to document relative flushing effectiveness. Various flush valve models fromthree different manufacturers were also tested for average volume per flush as well as flushingeffectiveness. Existing urinals were tested with lower flow flush valve retrofit kits. Hand sinkswere retrofitted with 0.5 gpm aerators. Total water savings for the building from retrofitting of 29toilets, 40 urinals, and 29 hand sinks, as documented by a meter installed in the building, isapproximately 4,600 GPD.
King County Office Buildings (Audits, Toilet Replacement)Seattle Public UtilitiesDuring early 2002 King County expressed an interest in taking a serious look at reducing costsfor water and sewer at their facilities. With help from the Water Smart Technology Program,consumption records were reviewed at their various facilities within the program service area,and the (5) most promising facilities were chosen for detailed audits. Audits were thenconducted and reports with recommendations were prepared through Water Smart for thefollowing Buildings: King County Administration Building, Yesler Building, King CountyCourthouse, King County Correctional Facility, and the King County South Transfer Station.Primary recommendations for the various buildings included restroom upgrades and retrofit ofsingle pass cooling systems.
By the end of 2002 King County had completed replacement of all high flow toilets in theAdministration Building and the Yesler Building with new low consumption wall hung toilets andflush valves. One no-water urinal was installed in the Administration Building for evaluationpurposes. Total water savings for toilet upgrades for these two buildings is projected at 5,000GPD. Retrofits to single pass cooling systems and restroom upgrades to additional buildingsare now underway with a number of these projects expected to be completed in 2003.