Embed Size (px)
Citation preview

1
Weatherization And Intergovernmental Programs Office
Benchmarking Data Cleansing:A Rite of Passage Along the Benchmarking Journey
April 30, 2015
Mona Khalil, U.S. DOEShankar Earni, LBNL

2
DOE’s State and Local Technical Assistance
• General Education (fact sheets, 101s)• Implementation Models (case studies)• Research and Tools for Decision-Making• Protocols (how-to guides, model
documents)
Resources
• Webinars• Conferences and in-person trainings• Better Buildings Project Teams• Accelerators
Peer Exchange & Trainings
• On a limited basis• Level of effort will vary• In-depth efforts will be focus on:o High impact effortso Opportunities for replicabilityo Filling gaps in the technical assistance marketplace
Direct Assistance

3
• Visit the STATE AND LOCAL SOLUTION CENTER
http://energy.gov/eere/slsc/state-and-local-solution-center
• Sign up for TAP Alerts by emailing
How to tap into these and other TAP offerings

4
Course Outline• Course Objectives• Building Benchmarking• Bad Data
– What is it?– Types– Common Issues
• Data Cleansing– What it is?– Why do it?
• Data Cleansing Process– Identify/fix incorrect data types– Identify/fix missing or erroneous values– Identify/fix outliers/other inconsistencies– Check and fix to ensure internal consistency
• Data Cleansing on a Sample Data Set

5
Course Objectives
Intended AudienceCities, communities, and states that have implemented or are considering implementing an internal or community-wide benchmarking and/or disclosure program or policy and are preparing their building energy data for analysis.
Learning ObjectivesTraining modules are intended to help public sector organizations: • Identify problems associated with building energy data• Verify data accuracy • Clean data prior to analysis
6
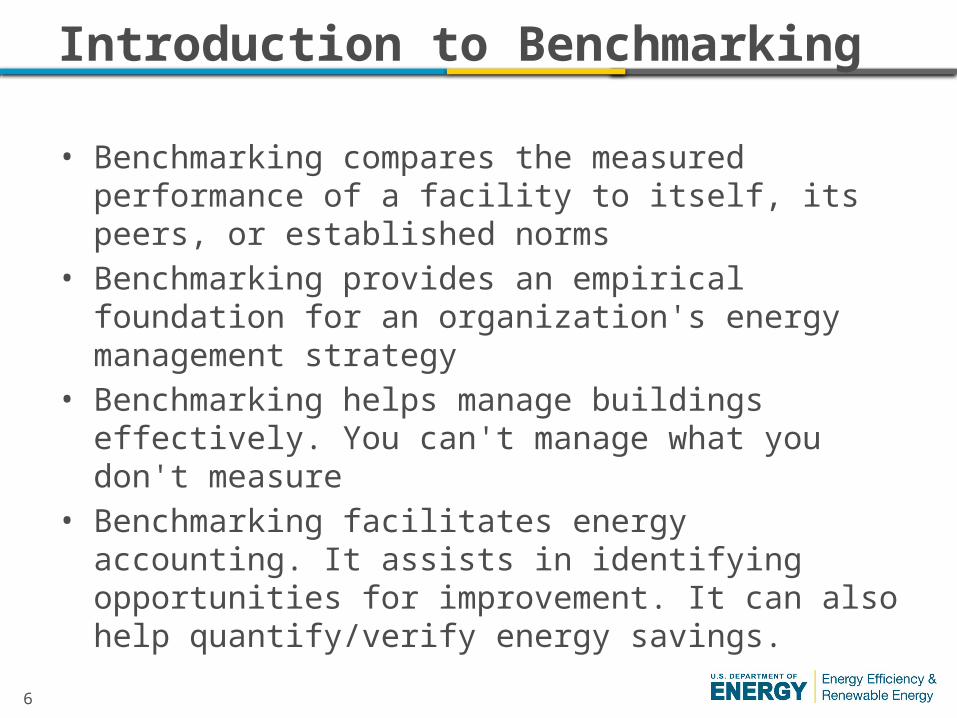
Introduction to Benchmarking
• Benchmarking compares the measured performance of a facility to itself, its peers, or established norms
• Benchmarking provides an empirical foundation for an organization's energy management strategy
• Benchmarking helps manage buildings effectively. You can't manage what you don't measure
• Benchmarking facilitates energy accounting. It assists in identifying opportunities for improvement. It can also help quantify/verify energy savings.
7
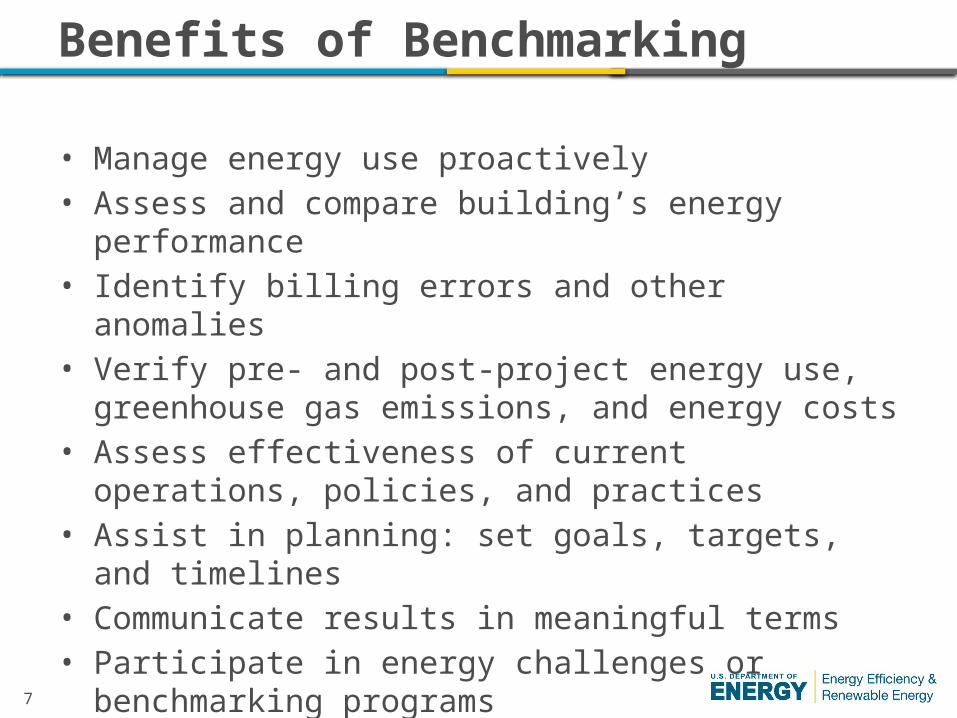
Benefits of Benchmarking
• Manage energy use proactively• Assess and compare building’s energy performance• Identify billing errors and other anomalies • Verify pre- and post-project energy use, greenhouse gas
emissions, and energy costs• Assess effectiveness of current operations, policies, and
practices • Assist in planning: set goals, targets, and timelines • Communicate results in meaningful terms • Participate in energy challenges or benchmarking programs

8
Building Benchmarking Process
1. Developing a Benchmarking Plan
2. Benchmarking Tools
3. Outreach
4. Data Collection
5. Quality Assurance/Control
6. Analyzing & Interpreting Results
7. Communicating Results
Data Cleansing & Analysis
Data Collection, Tracking
Getting Started
Source: http://energy.gov/eere/wipo/building-energy-use-benchmarking
9
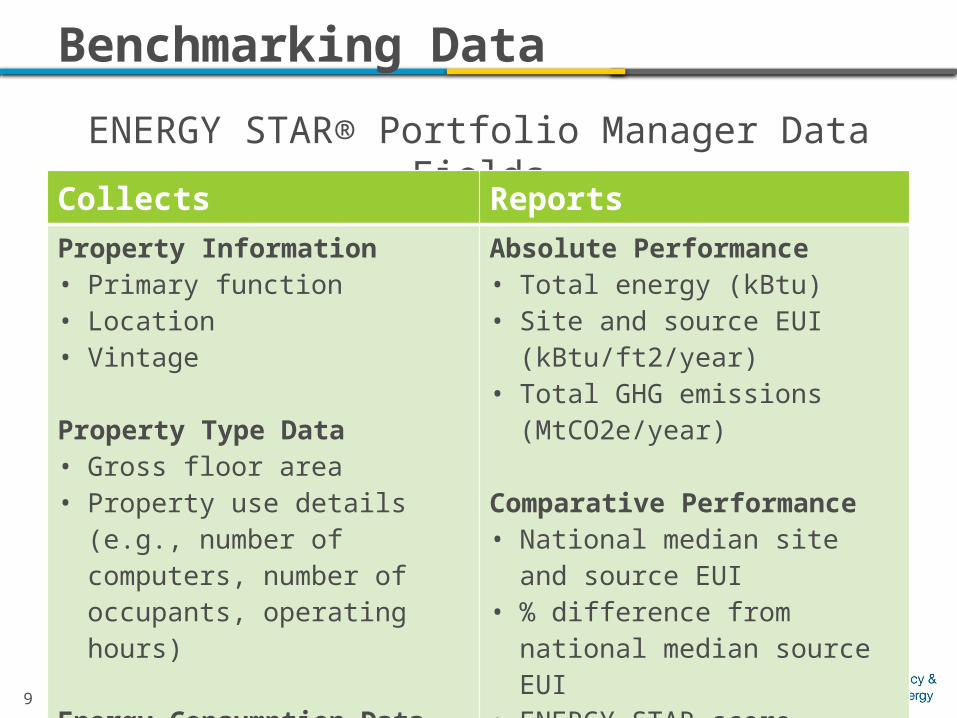
Benchmarking Data
ENERGY STAR® Portfolio Manager Data FieldsCollects ReportsProperty Information• Primary function• Location• Vintage
Property Type Data• Gross floor area• Property use details (e.g., number
of computers, number of occupants, operating hours)
Energy Consumption Data• Energy data for all fuel usage
Absolute Performance • Total energy (kBtu) • Site and source EUI (kBtu/ft2/year) • Total GHG emissions
(MtCO2e/year)
Comparative Performance• National median site and source
EUI• % difference from national median
source EUI• ENERGY STAR score

10
Bad Data: What/Where/How?What is it?• Benchmarking data may be erroneous, missing, miscorrelated, estimated
Where does it come from? • Bad data arise due to a number of issues and sources
‒ Errors due to human entry and misinterpretations ‒ Data errors due to incorrect translation between difference systems‒ Lack of complete information ‒ Lack of a standard data dictionary
How do we identify bad data? • Some issues may be easy to identify, such as missing values, or an energy
consumption value off by a factor of a million • Others may be quite tricky to identify
‒ Errors from a building that appears to be ten times more inefficient than its peers due to a decimal error vs. a truly energy intensive building (e.g., a data center)
‒ Errors due to estimations where data values are within acceptable range but is actually incorrect

11
Bad Data: TypesUnit conversion errors - inconsistent units of measure• Therms of natural gas instead of million cubic feet (MCF)• Total square feet instead of thousands of square feetWrong building characterization - building end use type is misidentified • Classifying a refrigerated warehouse as non-refrigerated
Miscorrelated data - implausible value is entered into a field • Year-to-date energy consumption instead of monthly energy consumption • Reporting energy consumption from only one meter for a building with
multiple meters
Missing data or zero values • For example: missing building type, missing gross floor area, etc. Alphanumeric instead of numeric – presence of units or other special characters • 100,000 or 100K sq. ft. may not conform to a numeric data format
Estimated or default – lack of appropriate data may prompt a user to enter estimated values; users might go with the selected default values

12
Data Cleansing: What Is It?
• Data cleansing is a process of carefully and systematically reviewing data and removing and/or correcting suspected erroneous data before analysis– A screen for a variety of common erroneous or missing data– Identification of errors that are specific to a portfolio
• Data accuracy needs to be ensured before a detailed analysis is performed
• All data are unclean unless proven otherwise• Everyone, no matter how small of a portfolio they have, needs to
do it• The cleansing process identifies preventative and corrective
measures to be implemented for future data sets

13
Data Cleansing: Why Do It?
• Important to clean the data before analysis to ensure accurate results at the building level as well as to avoid skewed conclusions at the portfolio level
• Bad data “contaminates” the data set and can lead to high variances and uncertainties in the data analysis results
• Bad data creates inaccuracy in analysis, such as:– Comparing results of a building performance against its peers– Performing year-to-year trending or even– Gaining a firm understanding of the level of a building’s performance will
be inaccurate.
This can lead to bad decisions regarding the right investment• Bad data can lead to lack of confidence in results, potentially
undermining the credibility of the underlying program or policy

14
• DOE’s Building Performance Database (BPD) provides access to empirical data on the energy performance and physical and operational characteristics of buildings
• BPD contains data on more than 750,000 residential and commercial buildings
• Building owners submit raw building performance data to the BPD team who in turn facilitate data cleansing and entry to the system
• Data in BPD undergo rigorous mapping, cleansing, and merging steps to identify and remove suspect or erroneous values
• Common data issues identified:– Zero floor areas, gross floor area < net floor area– Building type not specified– Erroneous energy consumption (zero, negative, partial)– EUI very high or too low (1<site EUI<1000 kBtu/sft) – EUI not plausible for a building type (CBECS)
Common Data Issues from BPD
15
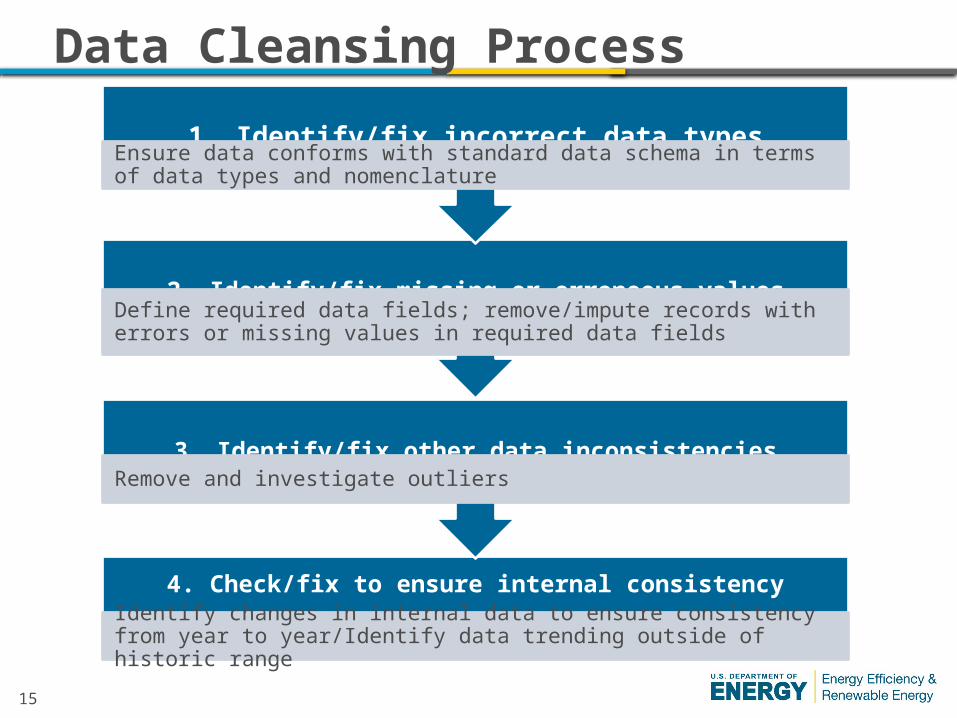
Data Cleansing Process
4. Check/fix to ensure internal consistency
Identify changes in internal data to ensure consistency from year to year/Identify data trending outside of historic range
3. Identify/fix other data inconsistenciesRemove and investigate outliers
2. Identify/fix missing or erroneous valuesDefine required data fields; remove/impute records with errors or missing values in required data fields
1. Identify/fix incorrect data typesEnsure data conforms with standard data schema in terms of data types and nomenclature

16
Data Cleansing on Sample Datasets
• Dataset includes benchmarking data for 2,100 buildings over 4 years
• Data fields: facility ID, city, zip code, building type, activity year, benchmarked floor area, annual building energy use, site EUI, source EUI, weather normalized site EUI, weather normalized source EUI, ENERGY STAR rating
• Dataset obtained from FEMP’s Compliance Tracking System (CTS)
Additional sample dataset used:• BPD sample dataset• City of Seattle 2012 benchmarking data
17
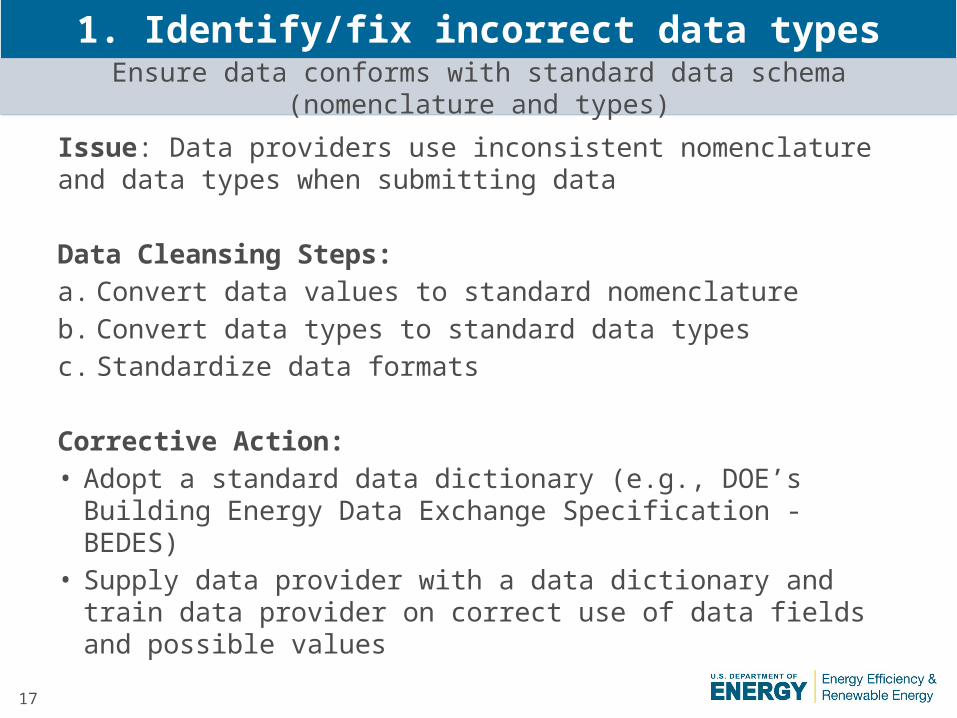
Issue: Data providers use inconsistent nomenclature and data types when submitting data
Data Cleansing Steps:a. Convert data values to standard nomenclature b. Convert data types to standard data typesc. Standardize data formats
Corrective Action: • Adopt a standard data dictionary (e.g., DOE’s Building Energy
Data Exchange Specification - BEDES)• Supply data provider with a data dictionary and train data
provider on correct use of data fields and possible values
1. Identify/fix incorrect data typesEnsure data conforms with standard data schema (nomenclature and types)

18
Hospital (General Medical amp; Sur-
gical)
Hospital (General Medical and Sur-
gical)
2
120
Pre- Cleansing
Hospital (General Medical amp;
Surgical)
Hospital (General Medical and Sur-
gical)
0
122
Post- Cleansing
Source of Error: Typographical error creates two separate building types
Corrective Action: Correct the building types to make them consistent with data types from the data dictionary. “Hospital (General Medical amp; Surgical)” is combined with “Hospital (General Medical and Surgical)”
1. Identify/fix incorrect data types
a. Convert data values to standard nomenclature

19
Non
-Ref
riger
ated
War
e...
Stor
age/
Ship
ping
/Non
-...
War
ehou
se (U
nref
riger
...
War
ehou
se
War
ehou
ses
157
0 0
43
0
Post-CleaningSource of Error: Multiple specifications for essentially the same building type
Corrective Action: Standardize building type specifications in line with data types from the dictionary. The five building types in the graph are combined to standard building types – “Non-Refrigerated Warehouse” and “Warehouse.”
1. Identify/fix incorrect data types
a. Convert data values to standard nomenclatureN
on-R
efrig
erat
ed W
ar...
Stor
age/
Ship
ping
/Non
...
War
ehou
se (U
nref
riger
...
War
ehou
se
War
ehou
ses
18 23
116
18 25
Pre-Cleaning

20
Source of Error: Data values are in the form of strings/text instead of a number; data from this record can not be sorted or analyzed with other records
Data is represented as a string/text when expecting a number
Correct format by converting the string/text into a number
Corrective Action: Correct data types to make them consistent with data types from the data dictionary. Tools such as Openrefine can help identify and correct these issues.
1. Identify/fix incorrect data types
b. Convert data types to standard data types

21
Zip code RPUI Building Type01432-9764 631 Hospital (General Medical and Surgical)01432 523 Medical Office1432 107 Other
Issue: Inconsistent representations of zip codes prevents grouping of buildingsvariation 1: _1432
variation 2: 01432variation 3: 01432-9764
Corrective Action: Correct zip code format to be consistent and match with a standard format (ABCDE)
Source of Error: Data values in an inconsistent format
1. Identify/fix incorrect data types
c. Standardize data formats
22
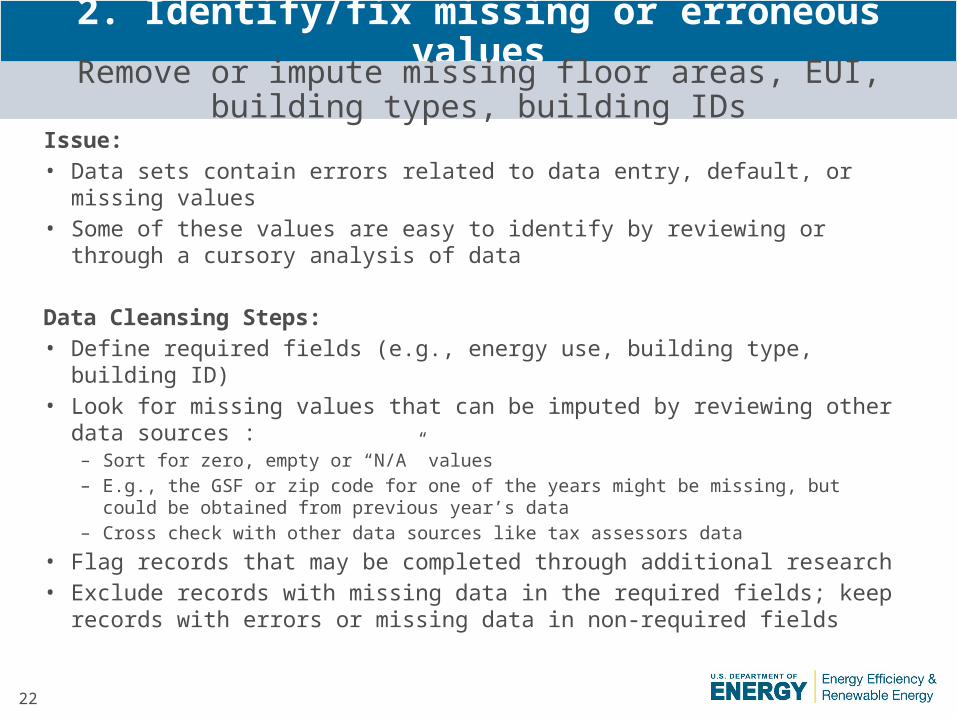
Issue:• Data sets contain errors related to data entry, default, or missing values• Some of these values are easy to identify by reviewing or through a
cursory analysis of data
Data Cleansing Steps:• Define required fields (e.g., energy use, building type, building ID)• Look for missing values that can be imputed by reviewing other data
sources :– Sort for zero, empty or “N/A” values – E.g., the GSF or zip code for one of the years might be missing, but could be
obtained from previous year’s data– Cross check with other data sources like tax assessors data
• Flag records that may be completed through additional research• Exclude records with missing data in the required fields; keep records
with errors or missing data in non-required fields
2. Identify/fix missing or erroneous valuesRemove or impute missing floor areas, EUI, building types, building IDs

23
2. Identify/fix missing or erroneous valuesRemove or impute missing floor areas, EUI, building types, building IDs
IssueIssues Identified Remarks
Cleansed Dataset
Missing Area (GSF) 55 Reconciled 1 record for 2012 by obtaining GSF from 2011 dataset
Flagged 54 records for investigation, removed from subsequent analysis
Missing Energy Use (MMBtu)
60 Key data not available in other records
Flagged 60 records for investigation, removed from subsequent analysis
Missing Building ID (“xxxxxx”)
3 Records retained for further analysis
Flagged 3 records, included in the analysis
Missing Building Type (“N/A”)
8 Key data not available through other records
Flagged 8 records for investigation, removed from subsequent analysis
Total Records Flagged
67 A total of 67 records were flagged and excluded from analysis
Total records pre-cleansing: 3,550. Post-cleansing: 3,483

24
• Establish criteria for permissible values based on the data types and realistic values
• Perform a distribution analysis to identify outliers‒ GSF‒ Site EUI‒ Site EUI by building type
• Investigate data that continue to look suspect or do not meet additional criteria
3. Identify/fix other data inconsistencies
Remove and investigate outliers

25
Range of Allowable Values
25
Field Data Type Allowed Values In-range check
Year Completed INTEGER(4) 1600 - present
Year Occupied INTEGER(4) 1600 - present >= Year Completed
Benchmarking Year INTEGER(4) 1990- present >= Year Completed
Building Type CONSTRAINED LIST ListBEDES or Portfolio Manager
Gross Floor Area DECIMAL 100 - 7 million Sq Ft
Zip Code INTEGER(5) List 00210 - 99950
Site EUI DECIMAL 1-1000 <=Source EUI
3. Identify/fix other data inconsistencies
a. Establish criteria for permissible values
Building Performance Database

26
500 1000 1500 2000 2500 3000 3500 4000 4500 5000 5500 6000 6500 7000 More1
10
100
1000
10000
3029
285
100
38
712
7
1
4
GSF (1,000 Sq Ft)
Num
ber o
f Bui
ldin
gs (l
og s
cale
)
Issue: 4 entries with GSF >7 million sq. ft. (no entries with GSF <100 sq. ft.)
Corrective action: Investigate buildings with more than 7 million SF
3. Identify/fix other data inconsistencies
b. Distribution analysis to identify GSF outliers

27
Up To 1
1 To 50
50 To 100
100 To
150
150 To
200
200 To
250
250 To
300
300 To
350
350 To
400
400 To
450
450 To
500
500 To
550
550 To
600
600 To
650
650 To
700
700 To
750
750 To
800
800 To
850
850 To
900
900 To
950
950 To
1000
More1
10
100
1000
253
7631025
492
221145
10879 63 50
30 2921
2715 15
9
3
79
6
113
Site EUI kBtu/ft2
Num
ber o
f Bui
ldin
gs (l
og S
cale
)
+
Issue: Out of range data: 253 buildings with site EUI <1 kBtu/sft; 113 buildings with site EUI >1000 kBtu/sftCorrective Action: Investigate if anomalies are due to errors in energy usage reporting, GSF, or other reasons
3. Identify/fix other data inconsistencies
b. Distribution analysis to identify EUI outliers
28
28
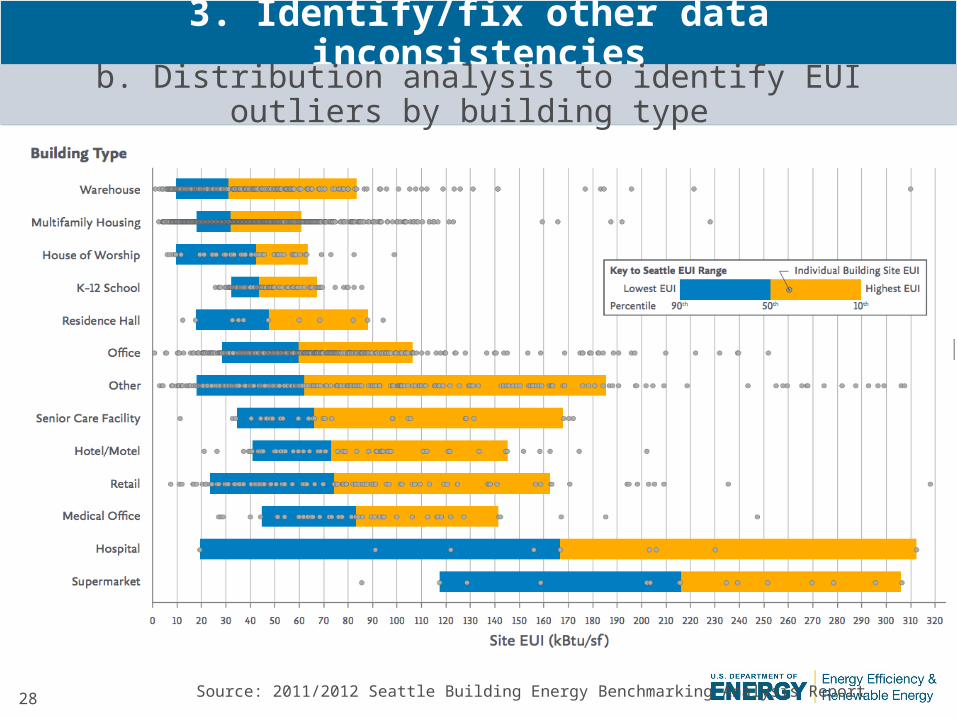
Source: 2011/2012 Seattle Building Energy Benchmarking Analysis Report
3. Identify/fix other data inconsistencies
b. Distribution analysis to identify EUI outliers by building type
29
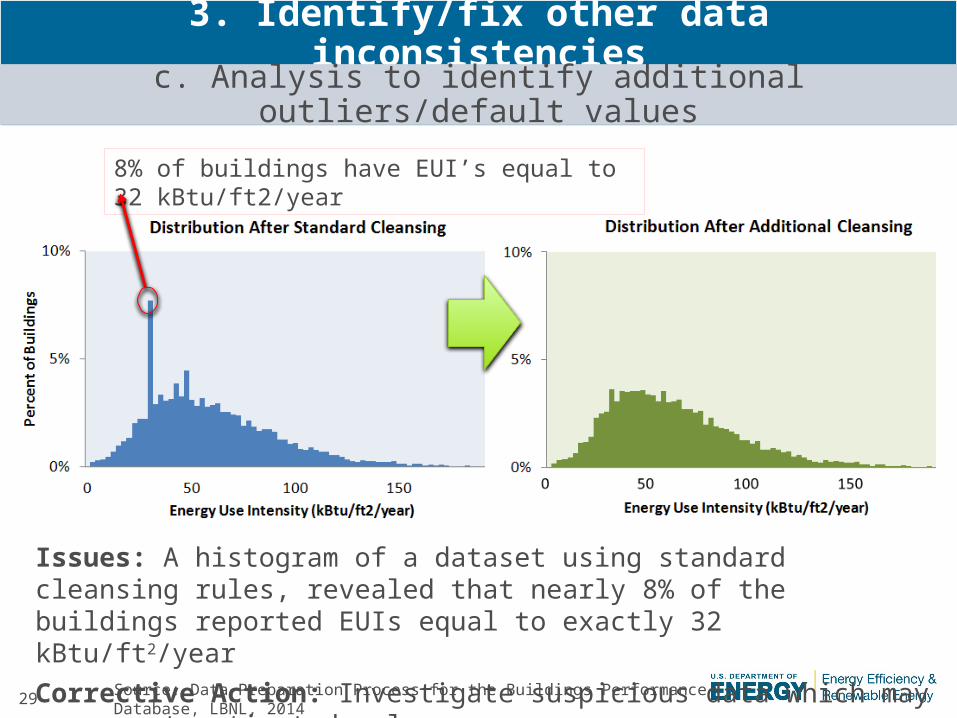
8% of buildings have EUI’s equal to 32 kBtu/ft2/year
Source: Data Preparation Process for the Buildings Performance Database, LBNL, 2014
3. Identify/fix other data inconsistencies
c. Analysis to identify additional outliers/default values
Issues: A histogram of a dataset using standard cleansing rules, revealed that nearly 8% of the buildings reported EUIs equal to exactly 32 kBtu/ft2/yearCorrective Action: Investigate suspicious data which may represent estimated values

30
Step 4. Check and fix to ensure internal consistency
• For buildings with multiple years of benchmarking, plot EUI over time to identify variations > 50% across years
• Investigate the root cause of high variation (GSF, site energy use)• Data with EUI variability > 50% is questionable; review on a case
by case basis to identify and resolve possible data errors
Site EUI (kBtu/sq ft)Building ID 2011 2012 2013
2013 vs 2011
Building 1 91.53 112.36 124.12 +36%Building 2 101.6 91.3 15.3 -85%Building 3 132.8 93.8 223.5 +68%
4. Check/fix to ensure internal consistencyIdentify data trending outside of historic range
2011 2012 20130
50
100
150
200
250
Building 1 Building 2 Building 3
Site
EU
I (kB
tu/s
q ft
)

31
Step 4. Check and fix to ensure internal consistency
31
4. Check/fix to ensure internal consistencyIdentify data trending outside of historic range
2011 2012 20130
50,000
100,000
Building 1 Building 2 Building 3
Ener
gy U
se (M
MBt
u)
Building GSF (k Sft)Building ID 2011 2012 2013 % change
Building 1 272 272 272 0%
Building 2 88 88 441 401%
Building 3 39 39 39 0%
Building Energy Use (MMBtu)Building ID 2011 2012 2013 % change
Building 1 2,489 3,056 3,376 36%
Building 2 88,925 79,874 67,370 -24%
Building 3 51,636 36,492 86,902 +68%
2011 2012 20130
250
500
GSF
(k S
ft)

32
Recommendations
• Become familiar with standard building characteristics and usage trends by major building types to help spot errors
• Learn data manipulation techniques to spot outliers– Sorting values– Identifying missing data– Plotting the distribution by GSF or EUI
• Perform statistical analysis to further characterize portfolio and identify additional data issues
• Use metadata to help with data cleansing and analysis– Part of metadata defined in BEDES is to identify the source of a data
field (actual, estimated, derived, etc.). This can be very valuable to identify which data to rely on in case of discrepancies.
33
4. Check/fix to ensure internal consistency
3. Identify/fix other data inconsistencies
2. Identify/fix missing or erroneous values
1. Identify/fix incorrect data types
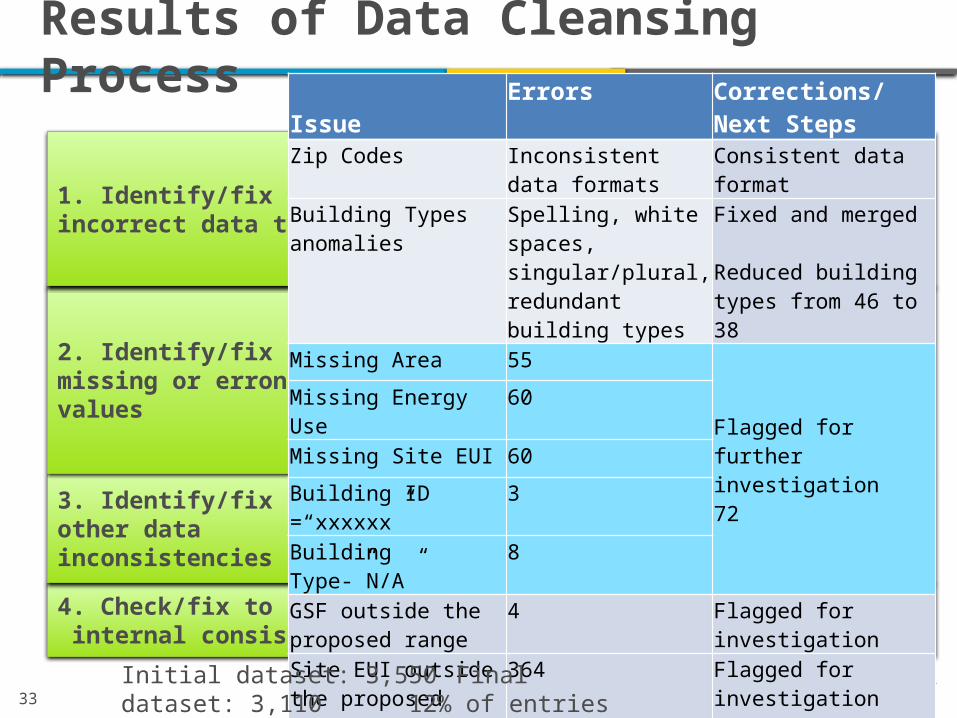
Results of Data Cleansing Process Issue
Errors Corrections/Next Steps
Zip Codes Inconsistent data formats
Consistent data format
Building Types anomalies Spelling, white spaces,
singular/plural, redundant building types
Fixed and merged
Reduced building types from 46 to 38
Missing Area 55
Flagged for further investigation72
Missing Energy Use 60
Missing Site EUI 60
Building ID =“xxxxxx” 3
Building Type-”N/A” 8
GSF outside the proposed range
4 Flagged for investigation
Site EUI outside the proposed range
364 Flagged for investigation
Big changes in Site EUI (~50%)
10 Flagged for investigation
Initial dataset: 3,550 Final dataset: 3,11012% of entries removed from analysis

34
Summary
• Data sets are dirty until scrubbed clean– The BPD throws out roughly 20% of buildings provided by data
contributors due to various data quality issues– Accurate data will strengthen confidence in final results
• Promote the use of standardized data dictionary to reduce the effort related to mapping
• Identify missing or suspicious values – If individual data fields seem suspect it may not be necessary to throw
out the whole building record; other data fields may still be valid for analysis
– Very similar energy uses for different building types in different locations can be an indication of default values, instead of actual values, used in either energy use or GSF

35
Summary• Use ranges to identify data anomalies
– Data cleansing may require learning about building performance characteristics to make judgments on reasonable values
– Identify maximum and minimum gross floor areas for each of the building types from various other sources
– Ranges of EUI can be obtained from public sources (CBECS)• Data cleansing is one of the steps along the journey to learn
about the building portfolio• Utilizing some of the basic techniques outlined here and
spending time to cleanse the data can go a long way to ensure that final analysis results are accurate and result in appropriate actions
• Automating data cleansing procedures can make this process less error prone and more efficient

36
Resources• Data Preparation Process for the Buildings Performance Database, LBNL, 2014
– http://eetd.lbl.gov/sites/all/files/data_preparation_for_bpd.pdf • ENERGY STAR Portfolio Manager
– http://www.energystar.gov/buildings • OpenRefine
– http://openrefine.org/ • Standard Energy Efficiency Data Platform (SEED)
– http://energy.gov/eere/buildings/standard-energy-efficiency-data-platform • Building Energy Data Exchange Specification (BEDES)
– http://energy.gov/eere/buildings/building-energy-data-exchange-specification-bedes
• City of Seattle, 2011/2012 Seattle Building Energy Benchmarking Analysis Report, Seattle Office of Sustainability & Environment, January 2014– http://www.seattle.gov/Documents/Departments/OSE/EBR-2011-2012-report.pdf

37
QuestionsOffice Hours• Thursday May 7—1 p.m. EDT• Tuesday May 12—2 p.m. EDT
Contact:
Mona Khalil, Ph.D.U.S. Department of [email protected] Office: 202-586-7983
Shankar Earni, Ph.D.Lawrence Berkeley National [email protected]: 510-486-7126