Embed Size (px)
Citation preview
1
Welcome
• You have been given a handset as you entered
• Please don’t press any buttons yet! You may accidentally stop it working.
• At the end of the session leave the handset with the attendant at each exit
- Please don’t steal any – they are of no use without the rest of the system
2
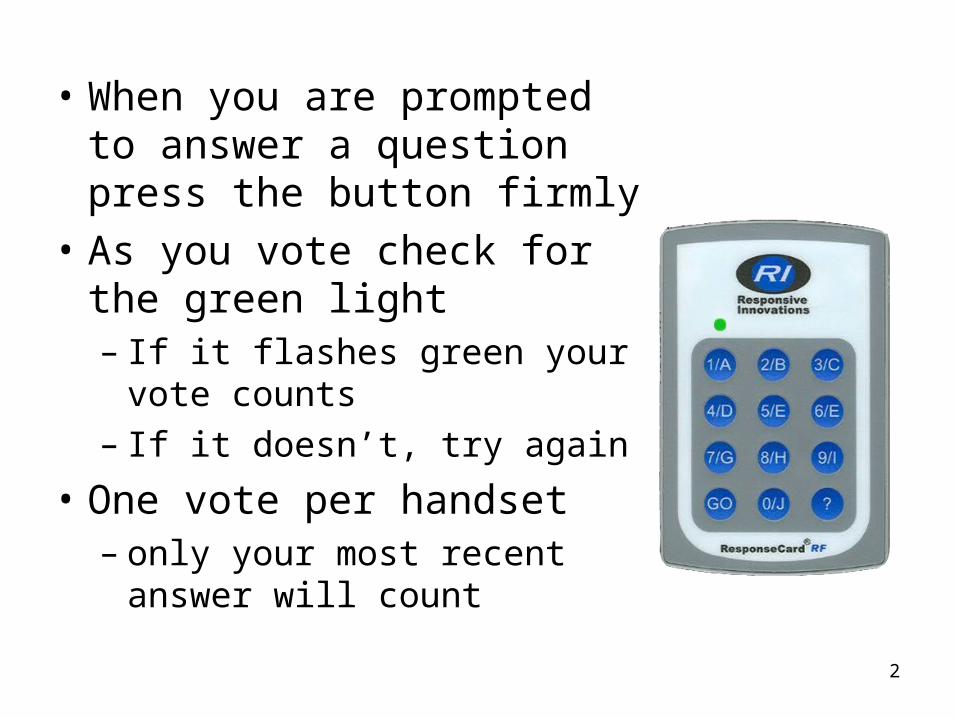
• When you are prompted to answer a question press the button firmly
• As you vote check for the green light– If it flashes green your vote
counts– If it doesn’t, try again
• One vote per handset– only your most recent answer
will count
3
Let’s try it out with a simple question
• Remember:
• Look out for the green light on the handset which flashes top indicate that your vote has been received
• No need to hurry….

4
How did you travel to university today?
Tube/
train
Bus
Bic
ycle
Wal
king
Oth
er
62%
23%
0%
15%
0%
1. Tube/train
2. Bus
3. Bicycle
4. Walking
5. Other
This slide shows…?
5
Excel for advanced calculations
John Cubbin
6
Outline
Week 1
• Excel from basics to advanced functions
Week 2
• Excel add-ins and introductory programming ideas, recording macros
Week 3
• Amending recorded macros using VBA programming language
7
Applications
Week 1
• Portfolio mean and variance
Week 2
• Simple Monte Carlo analysis
Week 3
• Revision
8
Reading
• Mary Jackson, Mike Staunton Advanced modelling in finance using Excel and VBA Wiley 2001.– Chapters 2-3 possibly 4 for more advanced
students
9
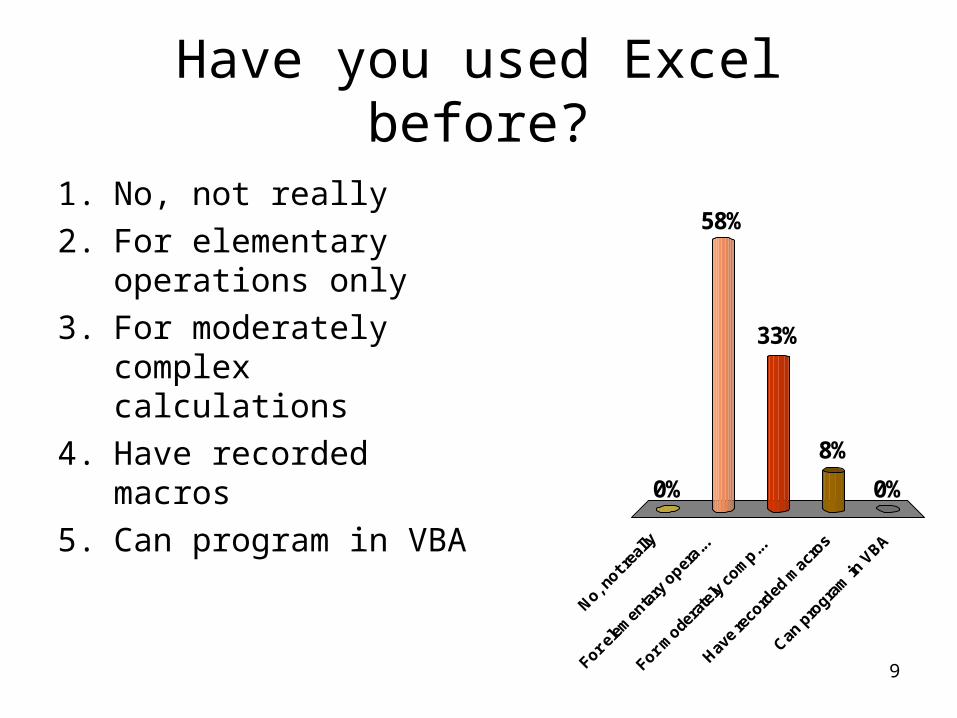
Have you used Excel before?
No, n
ot rea
lly
For e
lem
enta
ry o
pera.
..
For m
odera
tely
com
p...
Hav
e re
cord
ed m
acro
s
Can
pro
gram
in V
BA
0%
58%
0%
8%
33%
1. No, not really
2. For elementary operations only
3. For moderately complex calculations
4. Have recorded macros
5. Can program in VBA
10
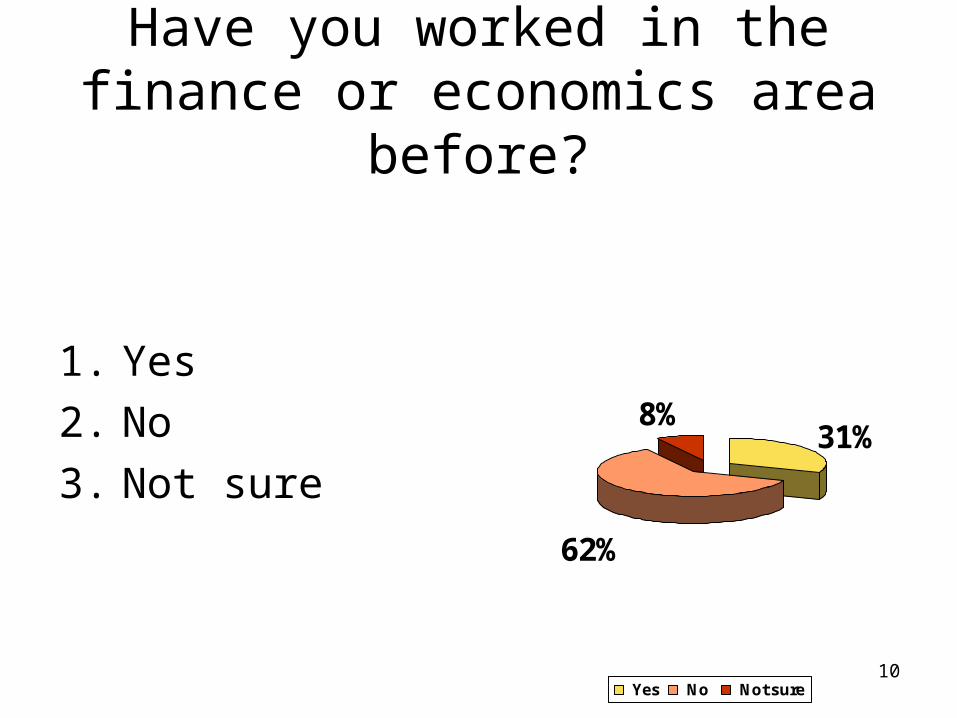
Have you worked in the finance or economics area before?
31%
62%
8%
Yes No Not sure
1. Yes
2. No
3. Not sure
11
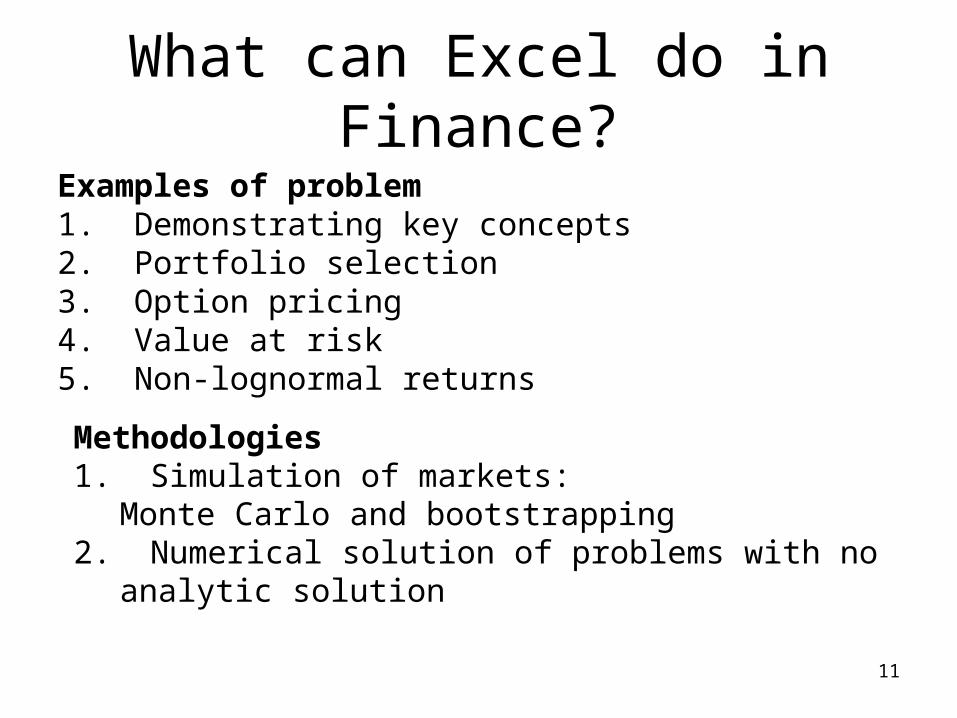
What can Excel do in Finance?
Examples of problem1. Demonstrating key concepts2. Portfolio selection3. Option pricing4. Value at risk5. Non-lognormal returns
Methodologies1. Simulation of markets:
Monte Carlo and bootstrapping2. Numerical solution of problems with no analytic
solution
12
Advantages and disadvantages of Excel
Advantages• Wide range of powerful techniques• Input and output need little programming• Example 1
Disadvantages
• Not a compiled language
•Slower than specialised mathematical programming languages
13
Good practice in spreadsheet work
• Transparency– Make it clear what is going on– Group obvious things together– Keep background stuff out of the way
• Documentation–Where it is not self evident, add labels, comments etc.
Other people (and yourself later) may need to work out what on earth is going on! It is not easy to know. Example 2
14
Good practice (2)
• Auditing –necessary to ensure accuracy– Make use of check sums and conditional formatting to
trap errors– Use the formula auditing tool box to make sure your
intentions have been fulfilled
– Do a series of calculations where you know the correct answer to make sure you are returning sensible results
– In important applications, get another person to audit and comment on your work
15
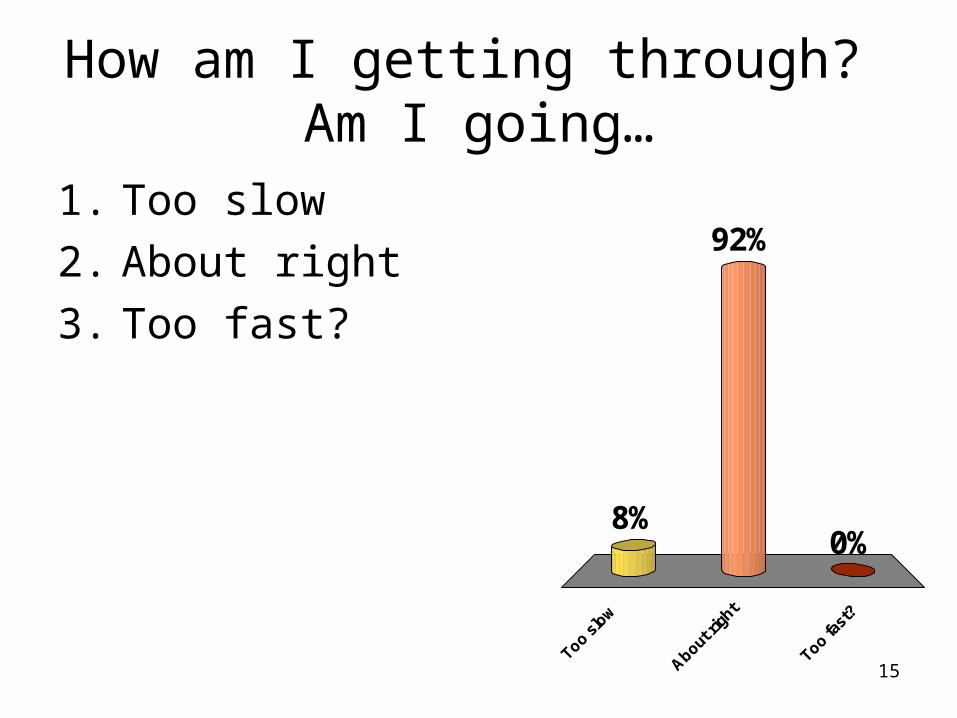
How am I getting through? Am I going…
Too s
low
About
righ
t
Too fa
st?
8%0%
92%1. Too slow
2. About right
3. Too fast?
16
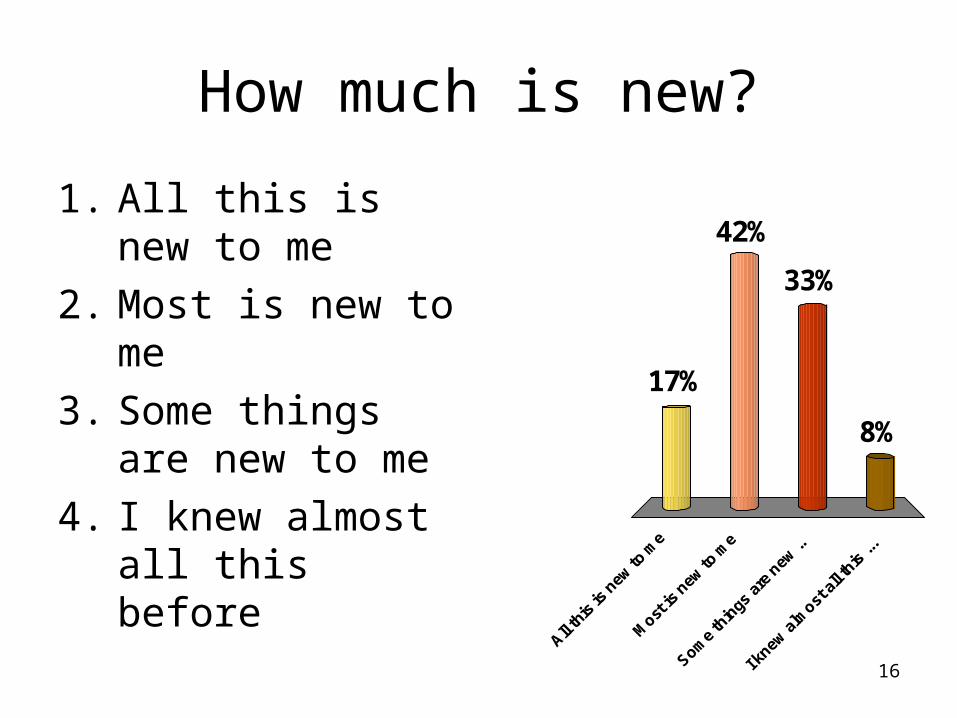
How much is new?
All
this
is n
ew to
me
Most
is n
ew to
me
Som
e th
ings
are
new
..
I kn
ew a
lmost
all
this
...
17%
8%
33%
42%1. All this is new to
me
2. Most is new to me
3. Some things are new to me
4. I knew almost all this before
17
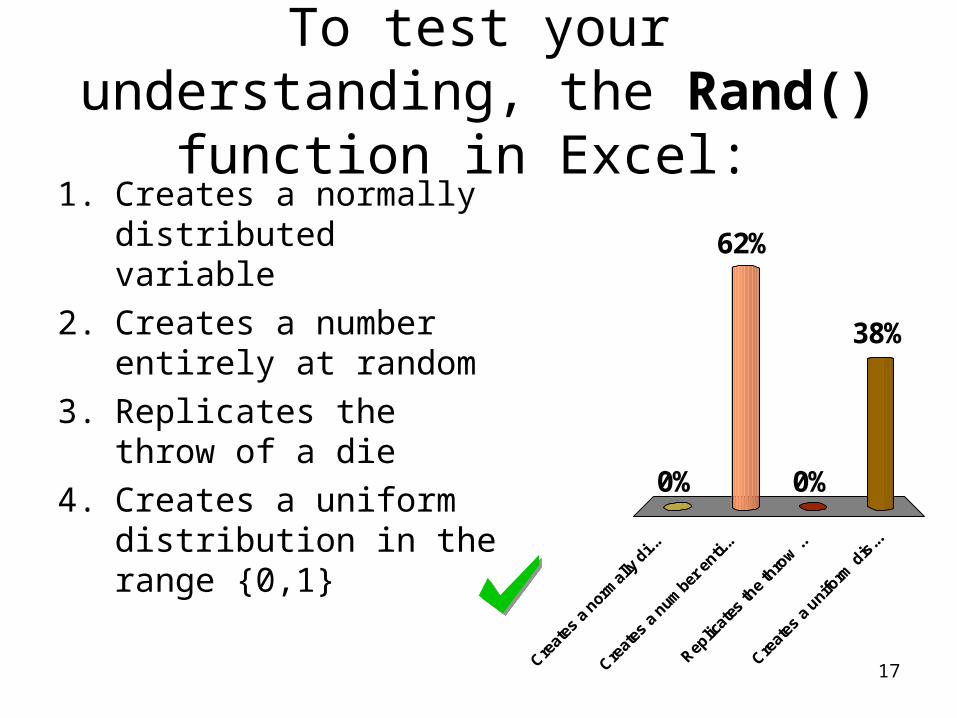
To test your understanding, the Rand() function in Excel:
Cre
ates
a n
orm
ally
di..
.
Cre
ates
a n
umbe
r enti.
..
Rep
licat
es th
e th
row
..
Cre
ates
a u
nifo
rm d
is...
0%
38%
0%
62%1. Creates a normally
distributed variable
2. Creates a number entirely at random
3. Replicates the throw of a die
4. Creates a uniform distribution in the range {0,1}
18
Section 2: More advanced functions
19
More advanced functions
• Arrays
• Frequency
• Lookup
• Regression approaches
• Random number generation
20
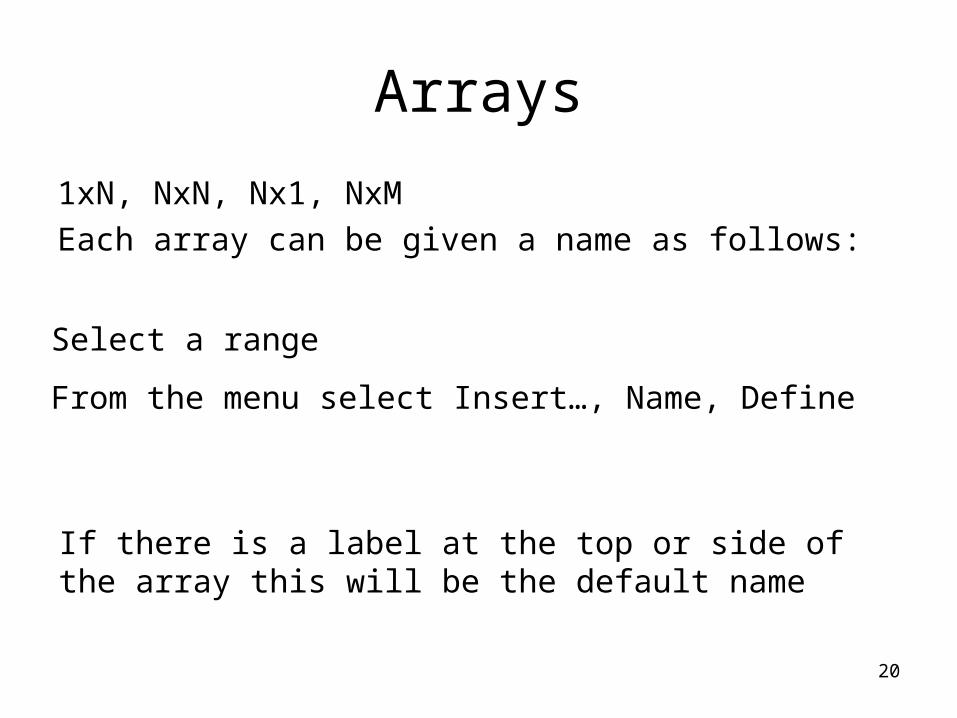
Arrays
1xN, NxN, Nx1, NxM
Each array can be given a name as follows:
Select a range
From the menu select Insert…, Name, Define
If there is a label at the top or side of the array this will be the default name
21
Frequency
Counts the cells with a given frequency
Format is Frequency( data array, bins array)
The key to using formulae covering a whole array is to press CTRL +Shift+ Enter instead of Enter when you have entered the formula.
See Example 3
22
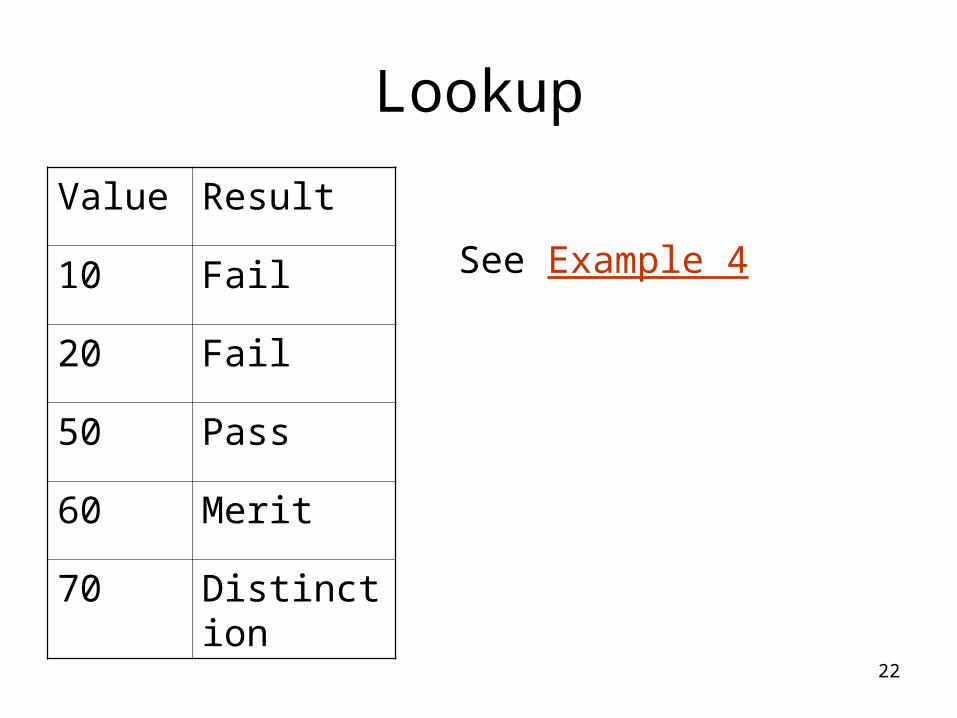
Lookup
Value Result
10 Fail
20 Fail
50 Pass
60 Merit
70 Distinction
See Example 4
23
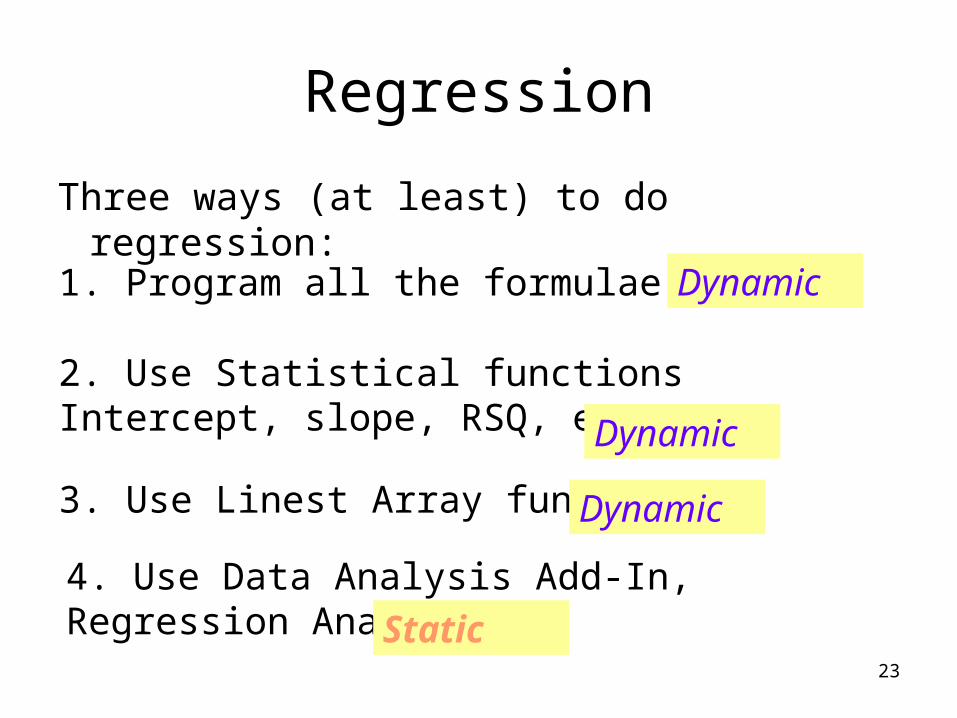
Regression
Three ways (at least) to do regression:
1. Program all the formulae yourself
2. Use Statistical functions Intercept, slope, RSQ, etc
3. Use Linest Array function
4. Use Data Analysis Add-In, Regression Analysis
Dynamic
Dynamic
Dynamic
Static
24
Random Number Functions
Much literature on random numbers
- In real life applications, make sure you get a good one with long cycle time
- For teaching purposes, Excel functions work fine
- You have already come across Rand(), which gives an outcome in the range {0,1}. This is dynamic
- This can be used to create other random distributions
25
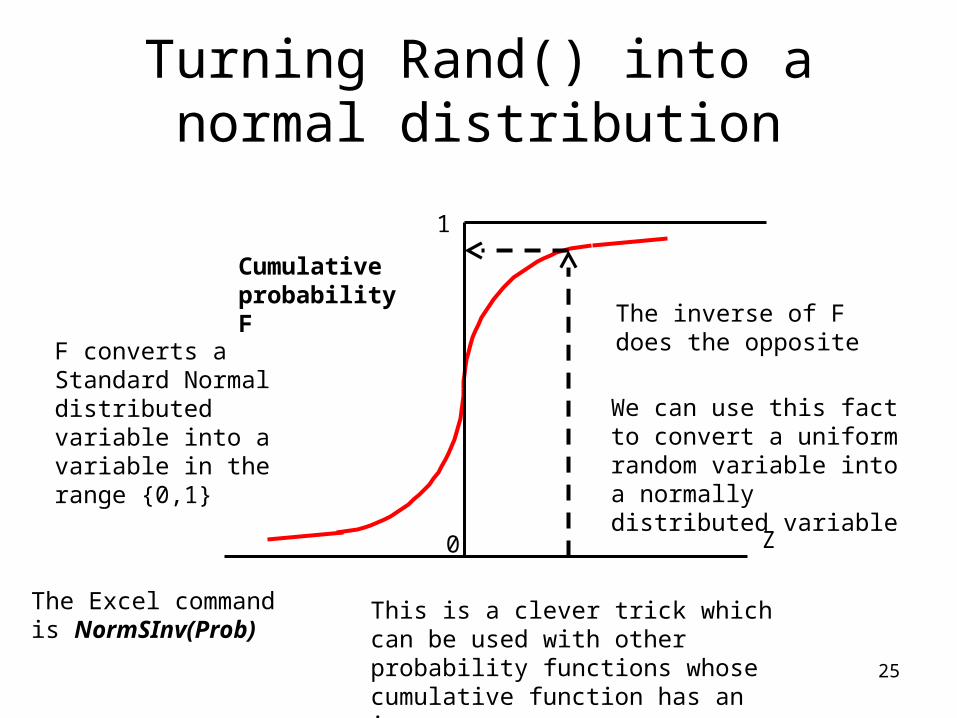
Turning Rand() into a normal distribution
0
1
Cumulative probability F
Z
F converts a Standard Normal distributed variable into a variable in the range {0,1}
The inverse of F does the opposite
We can use this fact to convert a uniform random variable into a normally distributed variable
The Excel command is NormSInv(Prob)
This is a clever trick which can be used with other probability functions whose cumulative function has an inverse
26
Static random numbers
In Tools…Data analysis…
You can generate number of different distributions.
However these are generated just once and not recalculated.
Rand() is recalculated every time. To stop this happening you can do Copy... Paste Special…Values
27
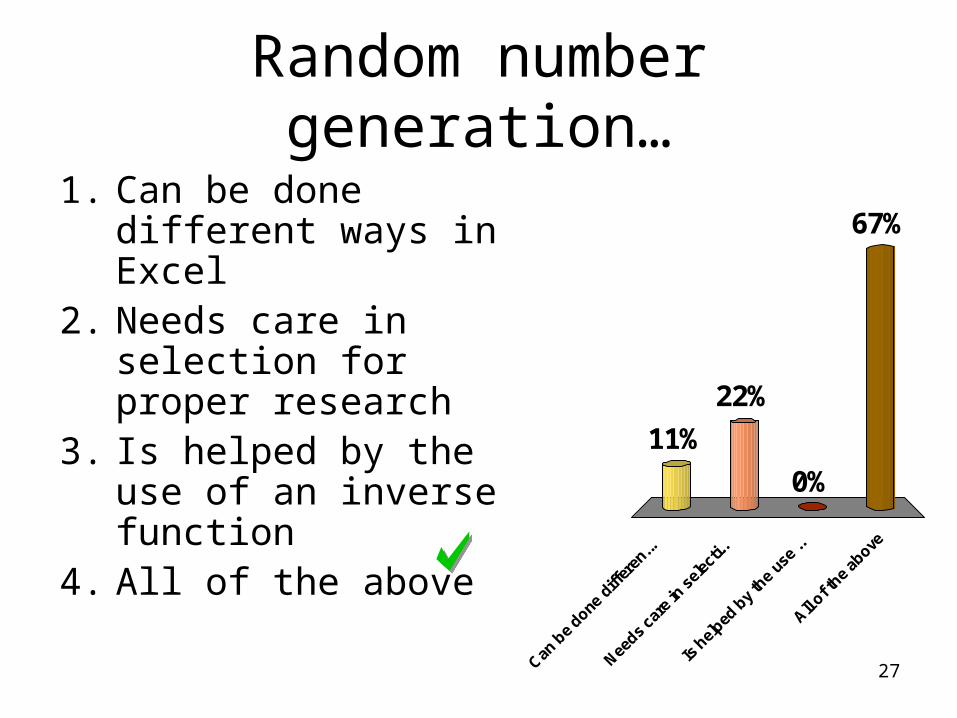
Random number generation…
Can
be
done d
iffer
en...
Nee
ds ca
re in
sel
ecti.
.
Is h
elped
by
the
use
..
All
of the
above
11%
67%
0%
22%
1. Can be done different ways in Excel
2. Needs care in selection for proper research
3. Is helped by the use of an inverse function
4. All of the above
28
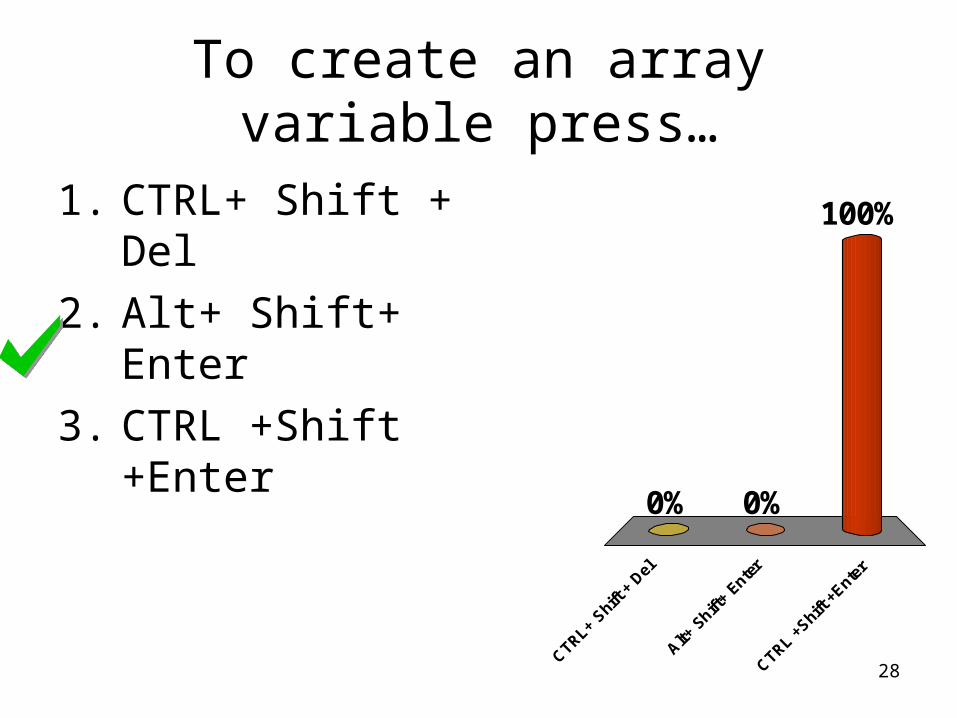
To create an array variable press…
CTRL+
Shift
+ Del
Alt+
Shift
+ Ente
r
CTRL +
Shift
+Ente
r
0%
100%
0%
1. CTRL+ Shift + Del
2. Alt+ Shift+ Enter
3. CTRL +Shift +Enter
29
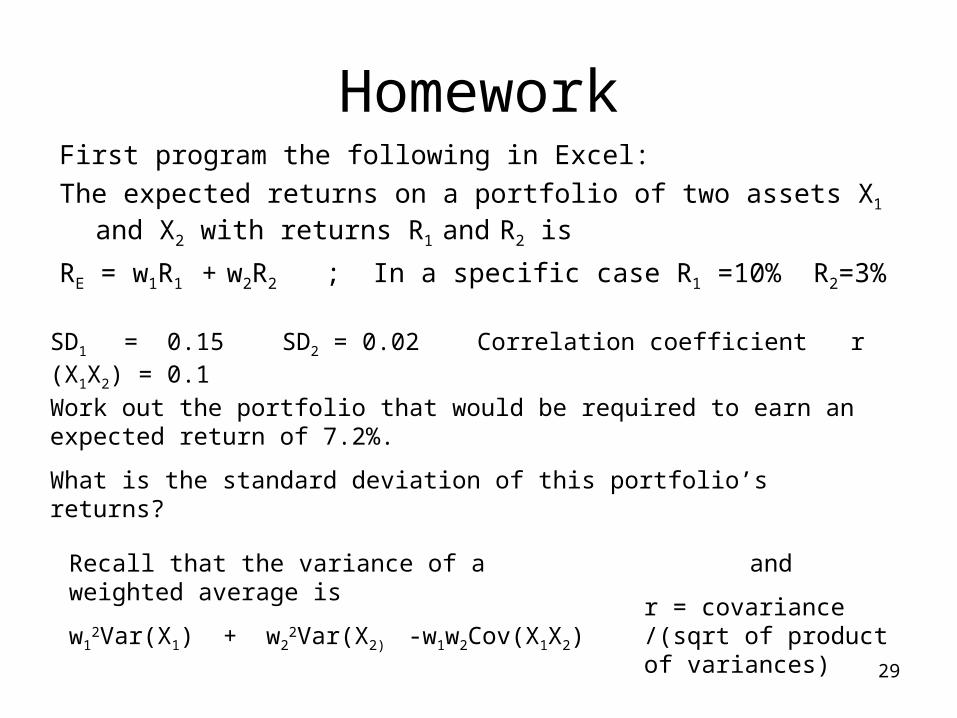
HomeworkFirst program the following in Excel:
The expected returns on a portfolio of two assets X1 and X2 with returns R1 and R2 is
RE = w1R1 + w2R2 ; In a specific case R1 =10% R2=3%
SD1 = 0.15 SD2 = 0.02 Correlation coefficient r (X1X2) = 0.1
Work out the portfolio that would be required to earn an expected return of 7.2%.
What is the standard deviation of this portfolio’s returns?
Recall that the variance of a weighted average is
w12Var(X1) + w2
2Var(X2) -w1w2Cov(X1X2)
and
r = covariance /(sqrt of product of variances)
30
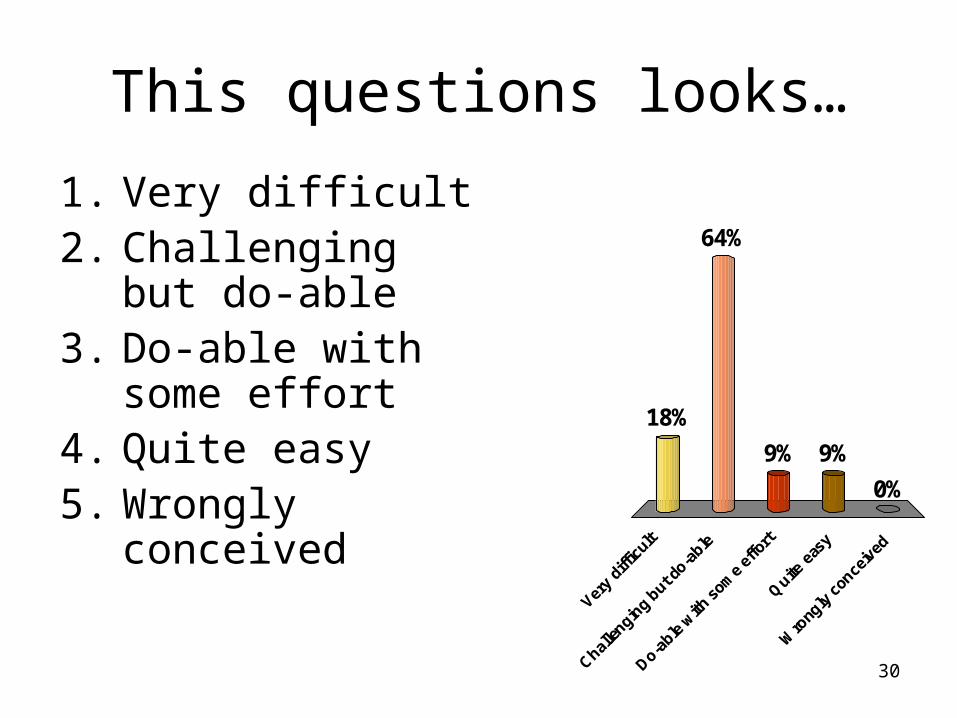
This questions looks…
Ver
y di
fficu
lt
Chal
lengin
g but d
o-able
Do-a
ble w
ith s
ome
effo
rt
Quite
eas
y
Wro
ngly
con
ceiv
ed
18%
64%
0%
9%9%
1. Very difficult2. Challenging but
do-able3. Do-able with
some effort4. Quite easy5. Wrongly
conceived

31
Homework continued
• How can you be sure this is the correct answer?
• How would you generalise this spreadsheet for multiple assets?
Next be prepared to discuss the following questions:
You may work in groups of 2 or 3
32
Please remember to return Handsets