Embed Size (px)
Citation preview

1
What happens if you offer a What happens if you offer a mobile option to your web mobile option to your web panel?panel?Results from a pilot study comparing a Results from a pilot study comparing a desktop and mobile device surveydesktop and mobile device survey
Vera Toepoel (Utrecht University, [email protected])
Peter Lugtig(Utrecht University/University of Essex, [email protected])

2
According to Statistics Netherlands, 50% of all 12 to 72 year olds with Internet access do this via a mobile device in 2011
Smartphone penetration rate explosion– In 2011 1 out of 5 people
opened their email on a smartphone (source: Emerce)
Vast increase in mobile phone useVast increase in mobile phone use
http://www.emerce.nl/research/mobiel-emails-lezen-2011-verdubbeld

3
Online probability based panel of Market Response– RDD, Internet population– Panel members ask if they can complete the survey on their
mobile phone– Young panel members (age 18-34) have the lowest
response probabilities in the panel and are continuously underrepresented in the panel (reasons for non response: don’t feel like it, no time)
– Current software not capable of using mobile friendly design
Confirmit software offers ‘responsive design’ (survey automatically optimized for the device chosen)
Smartphone as research tool?Smartphone as research tool?

4
June 2012 two surveys with similar sampling frame – (NL, 18+, Internet users, mobile registration):– Standard QSL (current online method)– Confirmit with response design (respondent could
chose prefered device)» Soft check for mobile completion
Research Design Research Design
Two parallel surveysTwo parallel surveys
Invitation: QSL Confirmit

5
Amount of people using mobile– Substantial?
Socio-demographic characteristics– Coverage bias: age, edu, gender, urbanization, hh
size+composition Response (break offs and item non-response) GPS Evaluation Response quality (measurement error)
– Questionnaire already adapted to mobile (no experiment)– Open-ended questions, check-all-that-apply, primacy
Research Questions Research Questions
What happens if you offer a mobile What happens if you offer a mobile option option to your web panel?to your web panel?

6
57% used mobile phone throughout the survey (N=443)– 252 used mobile (57%)– 33 people switched from desktop to mobile during the
survey (7%, 12% of mobile starters)– 4 people switched from desktop to mobile (1%)– 154 people used desktop (35%)
– Note: we define mobile as smart phone only. Additional analyses with mobile=all with touchscreen (incl. ipads etc.) produces similar results.
Research Questions Research Questions
Amount of people using mobileAmount of people using mobile

7
Age, hh size and hh composition (kids) significant predictors of mobile use– Older people – Larger households– No kids
No effect of: urbanization, gender, social class, education, household position, family income
Research Questions Research Questions
Socio-demographicsSocio-demographics

8
Hard-to-reach-groupHard-to-reach-group
Young: mobile increases response Young: mobile increases response probabilityprobability
9
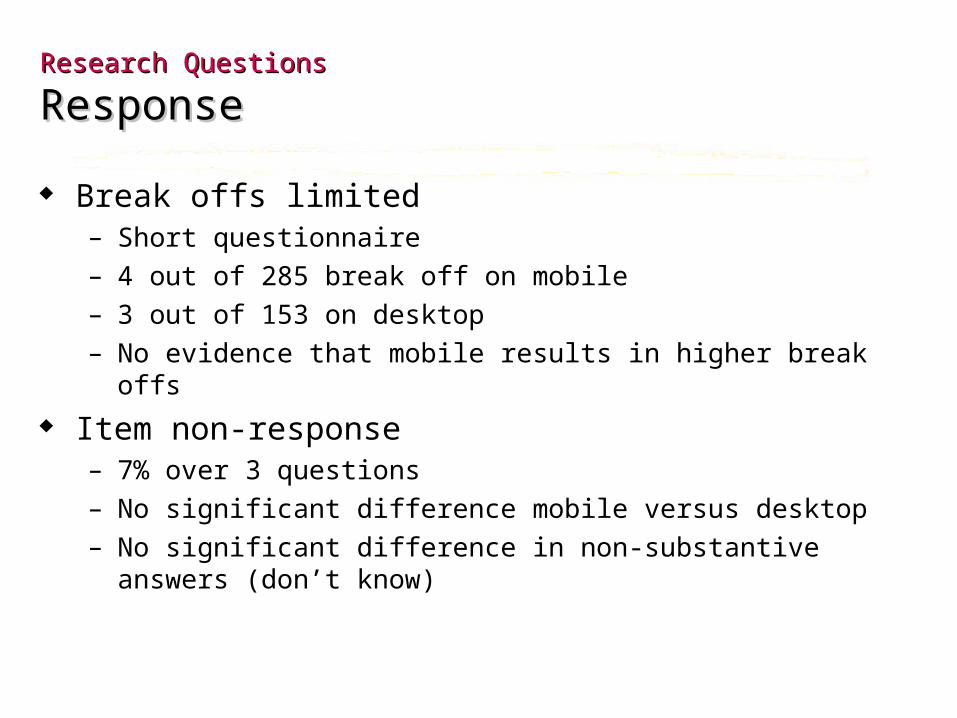
Break offs limited – Short questionnaire– 4 out of 285 break off on mobile– 3 out of 153 on desktop– No evidence that mobile results in higher break offs
Item non-response– 7% over 3 questions– No significant difference mobile versus desktop– No significant difference in non-substantive answers (don’t
know)
Research Questions Research Questions
ResponseResponse

10
Research Questions Research Questions
time to completetime to complete
11
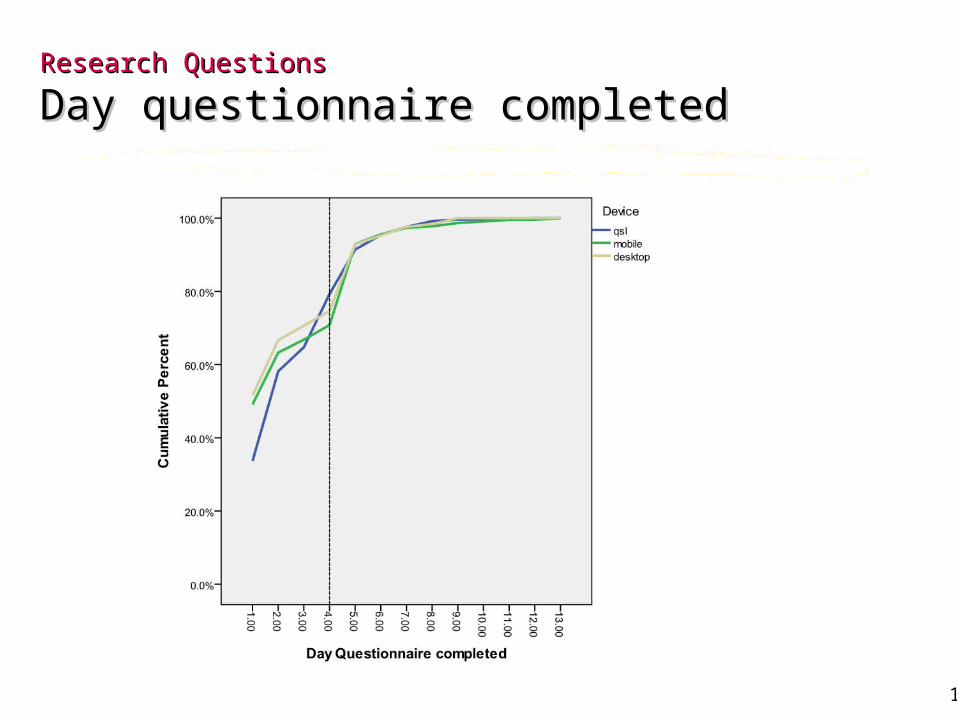
Research Questions Research Questions
Day questionnaire completedDay questionnaire completed

12
Research Questions Research Questions
GPSGPS
Mobile Desktop Total
GPS ok 38% 8% 25%
N 253 190 443
% MobileHome 67Work 14On the road 11outside 6abroad 2
N=110

13
n(mobile)=281, n(desktop)=151, N(QSL)=498 Chi-square test across mobile and desktop not
significant Chi-square test across all three groups not significant
Research Questions Research Questions
EvaluationEvaluation% Mobile Desktop Total
confirmit survey
qsl
Positive (8-10)
42 44 43 38
Neutral(6-7)
50 47 49 55
Negative(1-5)
8 9 8 7

14
EvaluationEvaluation
Higher evaluation young peopleHigher evaluation young people
7.2
7.2
7.2
7.2
18-24
25-34
35-44
45-54
55-64
65+
7.7
7.1
7.5
7.1
6.9
6.4

15
Research Questions Research Questions
Response Quality: open-ended questionsResponse Quality: open-ended questions
% Mobile Desktop Total (Confirmit)
No answer 35% 33% 33%
0-50 characters
52% 49% 51%
51-100 charcters
10% 16% 13%
100 + characters
3% 3% 3%
Notes: N(mobile)=285, N(desktop)=154No significant difference

16
Research Questions Research Questions
Response Quality: check-all-that-applyResponse Quality: check-all-that-apply
% Mobile Desktop Total (Confirmit)0 24.2 21.4 23.21 9.1 9.7 9.32 15.4 18.2 16.43 14.7 12.3 13.94 14.4 15.6 14.85 8.8 8.4 8.76 7.0 6.5 6.87 4.6 4.5 4.68 1.8 3.2 2.3Mean number of shops visited
2.7 2.8 2.8
Number of shops visited in past yearNotes: N(mobile)=285, N(desktop)=154No significant differences

17
Research Questions Research Questions
Response Quality: primacy in radio Response Quality: primacy in radio buttonsbuttons
% Mobile Desktop Total
ConfirmitOne a week or more often
3.9 0.6 2.7
About once a month
23.9 27.7 25.2
About every 3 months
37.2 32.1 35.4
About once every 6 month
21.4 26.4 23.2
Once a year o less often
10.2 9.4 9.9
Don’t know 3.5 3.8 3.6
Notes: N(mobile)=285, N(desktop)=154Frequency of buying clothes in a shop nearbyNo sigificant difference

18
Feedback mobile optionFeedback mobile option
Perfect format, excellent speed! Perfect format, excellent speed! Super!Super!
I am glad you figured out that desktop pcs are getting used less often and that questionnaires should be made mobile friendly. I don’t need to get my laptop (evaluation 8: woman, 29)
Handy! Better then the desktop since I tend to forget the survey invitations (evaluation 8: woman, 38)
Looovvedddd it(evaluation 9: woman, 18)
I like this very much. I do not need to get my laptop (evaluation 8: man, 20)
Very good!!! I will definetely get higher participation rates if this will be implemented (evaluation 9: man, 32)
Don’t like it. I have a pc which I use for all my survey activities. Next time I won’t be doing the survey(evaluation 1: man, 71)
Good! I often complete surveys on my mobile phone but this is the first one that reads well, perfect format, excellent speed! Super! (evaluation 9: woman 24)
The scrollbar was not working properly. Did not like it. it is easier on desktop(evaluation 3: woman, 58)
Good. But it should not take me too long, otherwise I’ll break off(evaluation 8: man, 51)

19
ConclusionConclusion
Considerable amount (57%) uses mobile No effect on non-response No effect on response quality Similar evaluation GPS gives additional insights No reason to believe that mixed-device is
a problem Able to attract hard-to-reach group such as
young people

20
DiscussionDiscussion
What about difficult questionnaires?– Long– grids
What about privacy? How to offer additional information to
researchers? Coverage bias?
Thank you!