Embed Size (px)
Citation preview
1
What If… The Washington Region
Grew Differently?
The TPB Regional Mobility and Accessibility Study
TPB Citizens Advisory CommitteePublic Forum in Oxon Hill, Maryland
September 20, 2005
2
Why look at alternative transportation and land use
scenarios?

3
Because the road ahead isn’t looking good…

4
Most Transportation Dollars Are Needed for Maintenance
Little money is available for new transportation projects
23%
77%
New Roads and Transit*
Operations & Preservation*
* Based on region’s 2003 Constrained Long-Range Plan
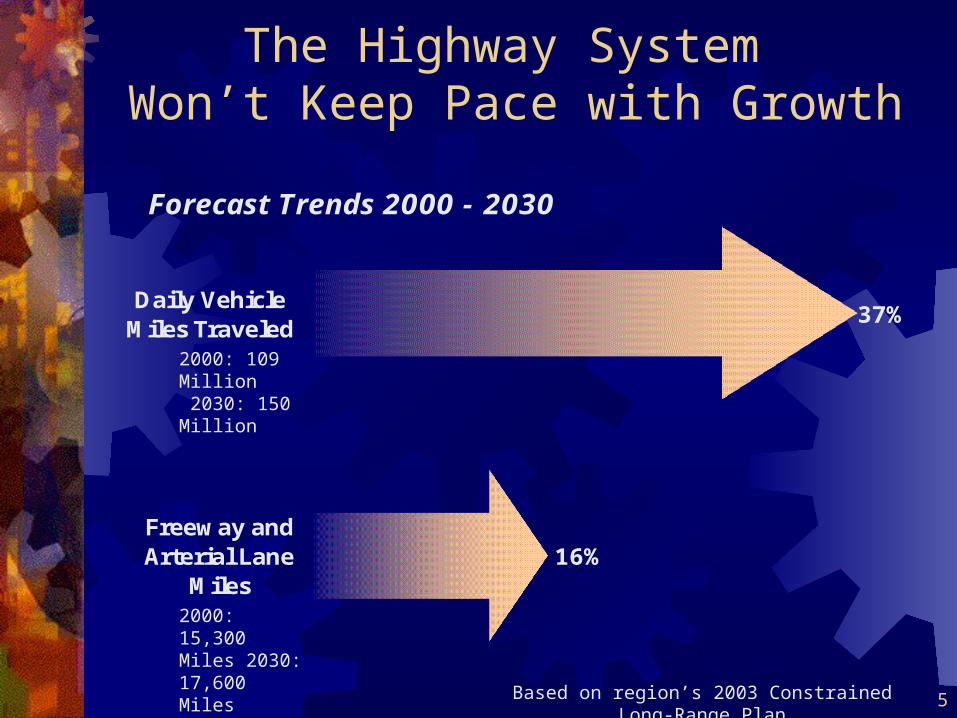
5
Forecast Trends 2000 - 2030
37%
16%
Daily VehicleMiles Traveled
Freeway andArterial Lane
Miles
The Highway System Won’t Keep Pace with Growth
2000: 109 Million 2030: 150 Million
2000: 15,300 Miles 2030: 17,600 Miles
Based on region’s 2003 Constrained Long-Range Plan
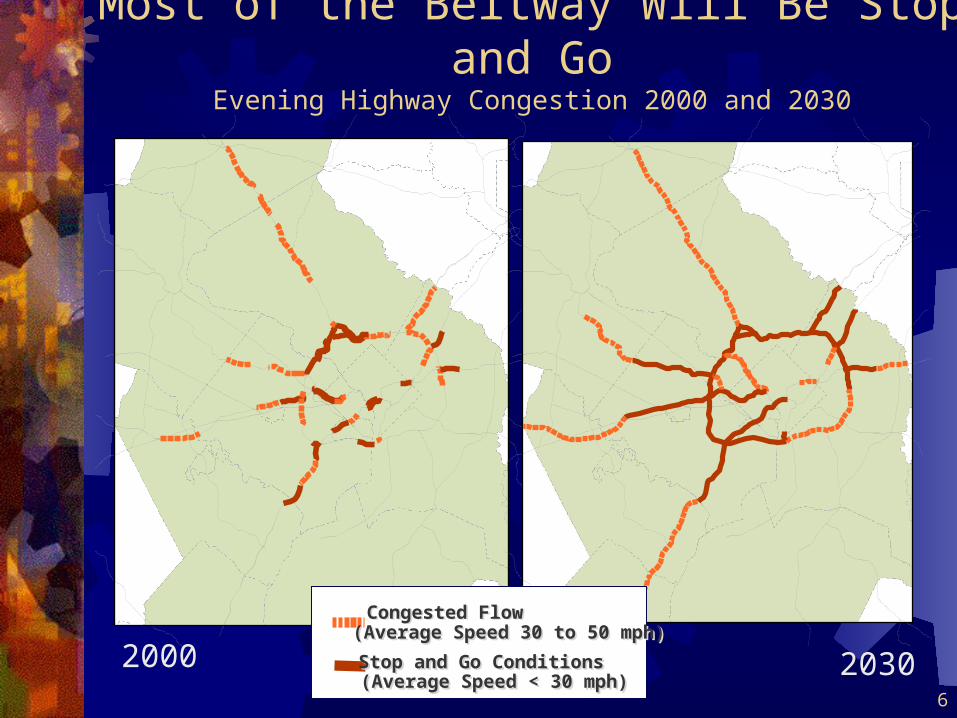
6
Most of the Beltway Will Be Stop and GoEvening Highway Congestion 2000 and 2030
2 0 3 02 0 3 0Based on the 2003 CLRPBased on the 2003 CLRP
Congested Flow Congested Flow (Average Speed 30 to 50 mph)(Average Speed 30 to 50 mph)
Stop and Go Conditions Stop and Go Conditions (Average Speed < 30 mph)(Average Speed < 30 mph)
2000 2030
7
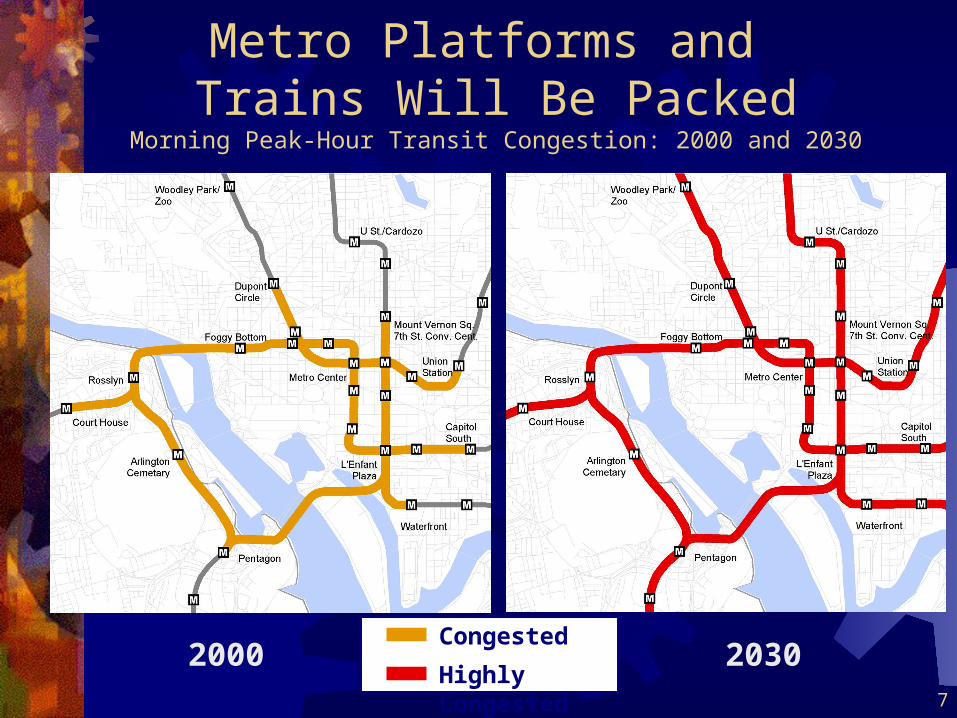
Metro Platforms and Trains Will Be Packed
Morning Peak-Hour Transit Congestion: 2000 and 2030
Congested
Highly Congested2000 2030
8
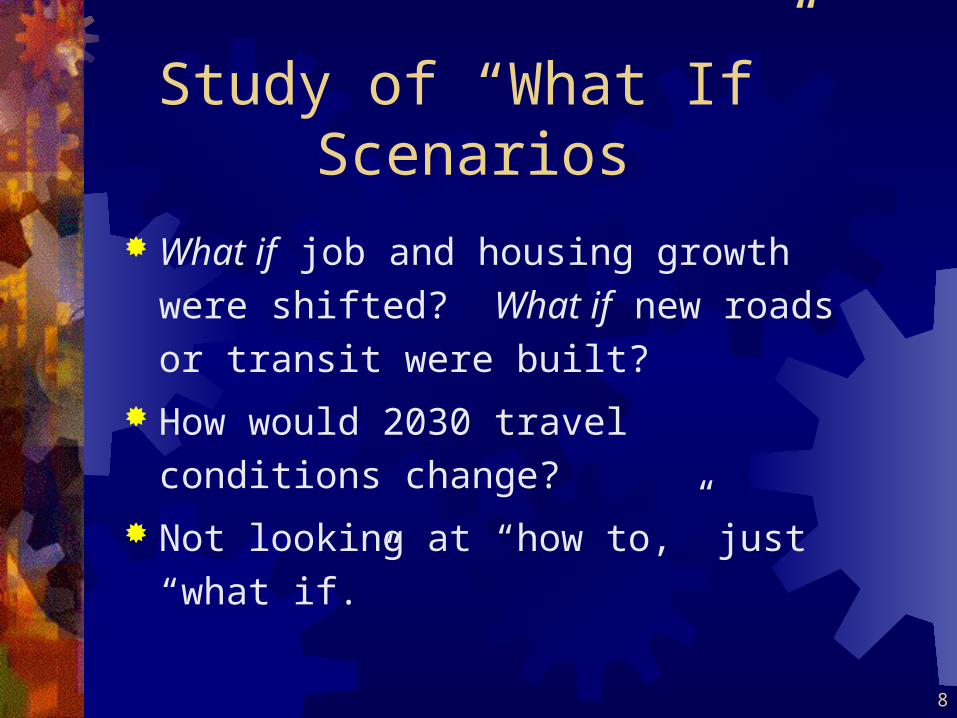
Study of “What If” Scenarios
What if job and housing growth were
shifted? What if new roads or transit were built?
How would 2030 travel conditions
change?
Not looking at “how to,” just “what if.”
9
Developing the Scenarios:
What are key issues related to land use and transportation?
10
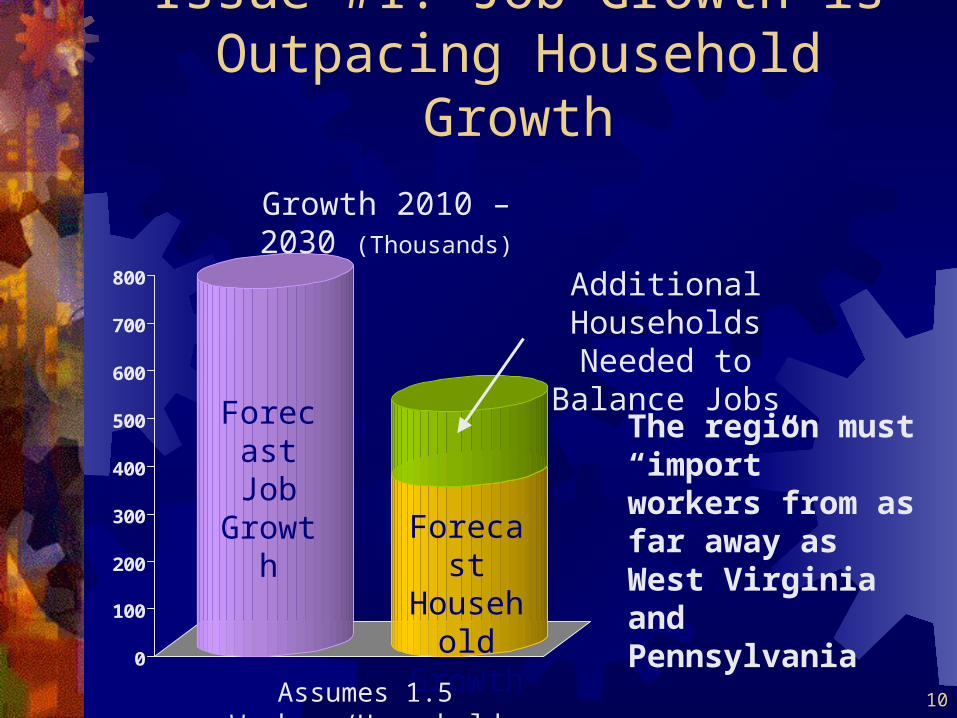
Issue #1: Job Growth is Outpacing Household Growth
0
100
200
300
400
500
600
700
800
The region must “import” workers from as far away as West Virginia and Pennsylvania
Forecast Job
GrowthForecast
Household Growth
Additional Households Needed to Balance Jobs
Growth 2010 – 2030 (Thousands)
Assumes 1.5 Workers/Household
11
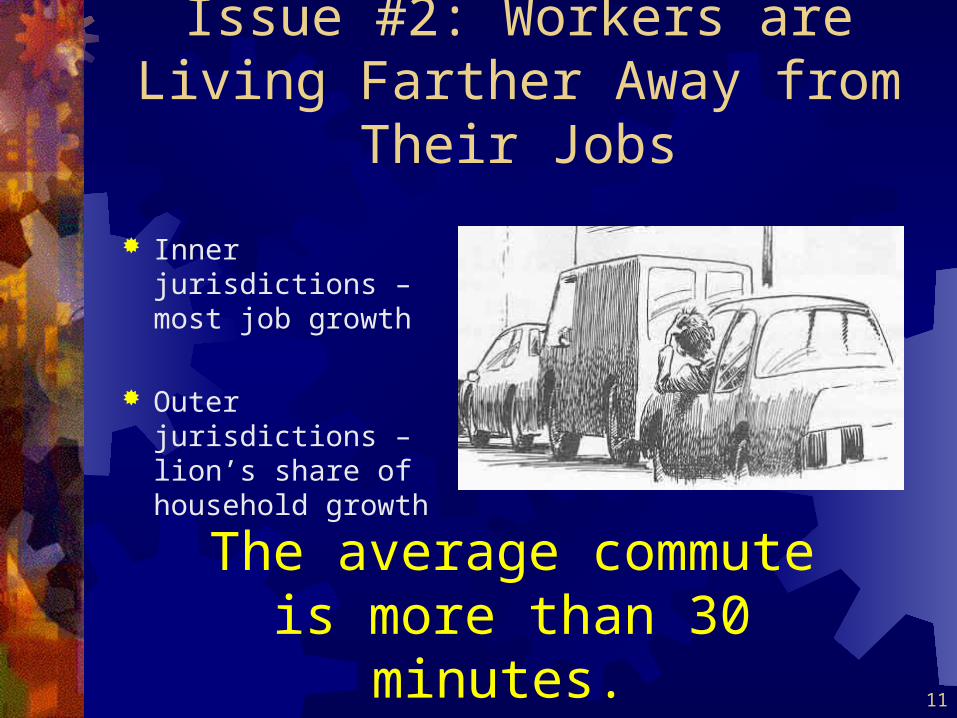
Issue #2: Workers are Living Farther Away from Their Jobs
Inner jurisdictions – most job growth
Outer jurisdictions – lion’s share of household growth
The average commute is more than 30 minutes.
12
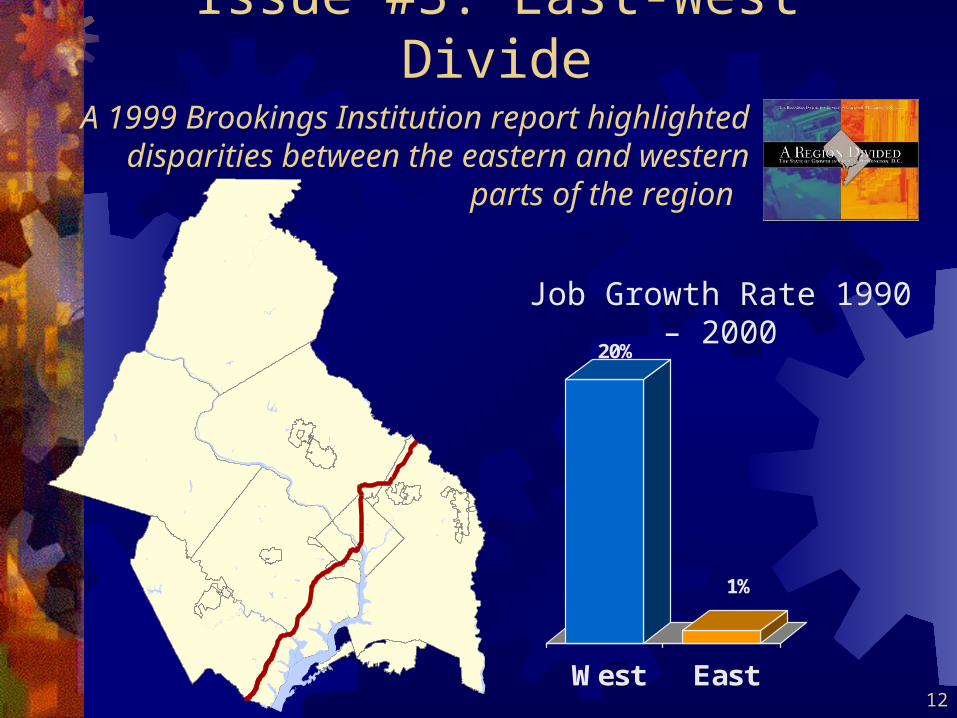
20%
1%
West East
Issue #3: East-West Divide
Job Growth Rate 1990 – 2000
A 1999 Brookings Institution report highlighted disparities between the eastern and western
parts of the region
13
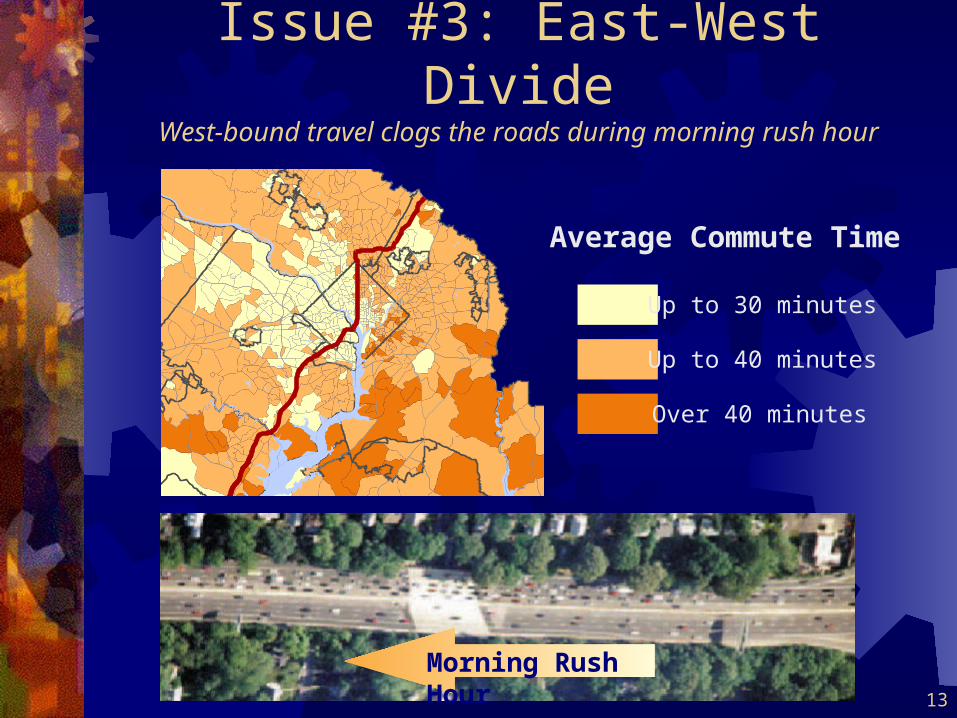
Issue #3: East-West DivideWest-bound travel clogs the roads during morning rush hour
Average Commute Time
Morning Rush Hour
Up to 30 minutes
Up to 40 minutes
Over 40 minutes
14
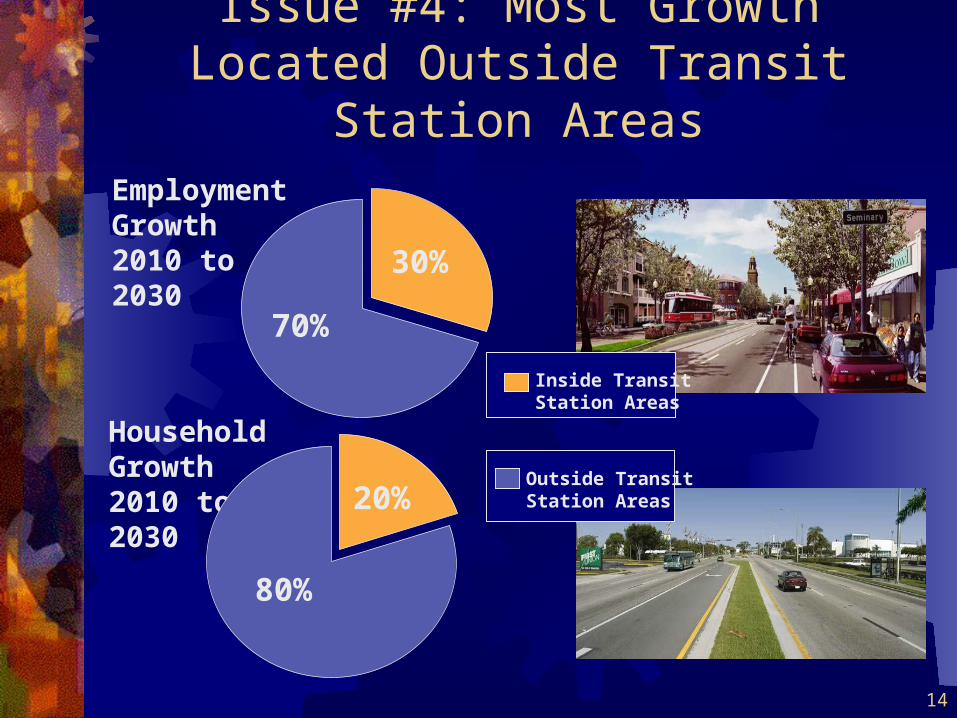
Issue #4: Most Growth Located Outside Transit Station Areas
HouseholdGrowth2010 to2030
Inside Transit Station Areas
Outside Transit Station Areas
EmploymentGrowth2010 to2030
30%
70%
20%
80%

15
Addressing the issues:
What if we shifted job and household
growth?
16
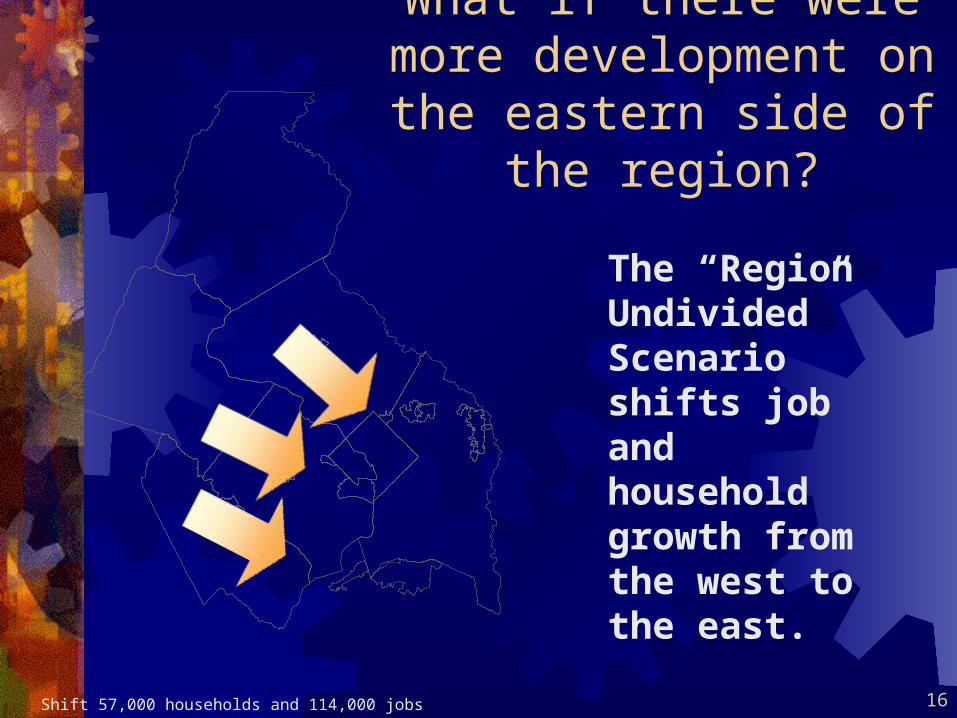
What if there were more development on the
eastern side of the region?
Shift 57,000 households and 114,000 jobs
The “Region Undivided” Scenario shifts job and household growth from the west to the east.
17
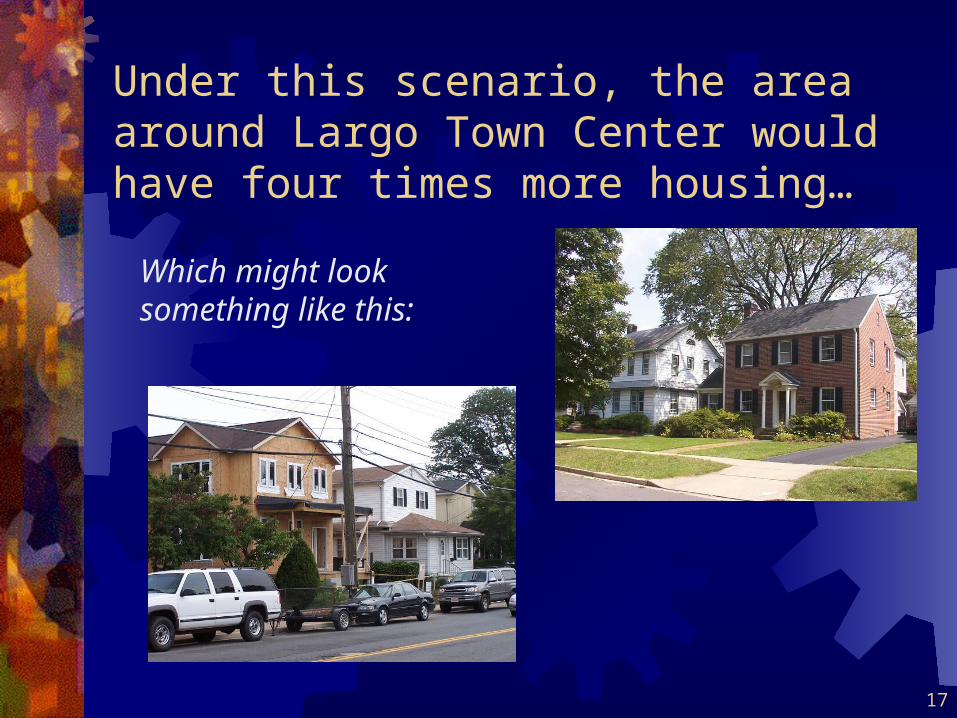
Under this scenario, the area around Largo Town Center would have four times more housing…
Which might look something like this:
18
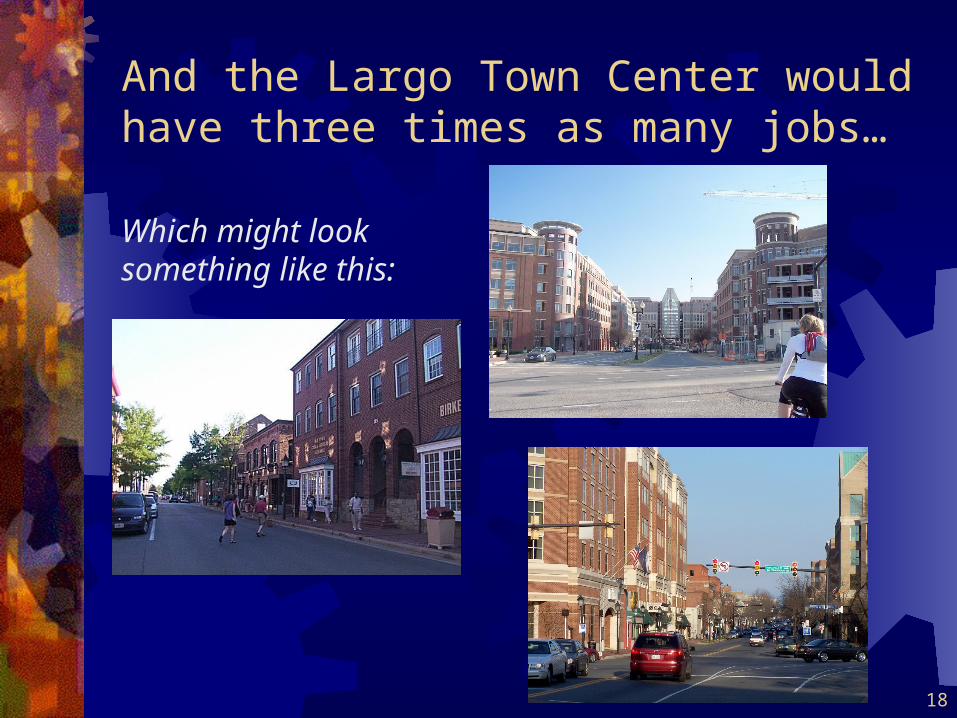
And the Largo Town Center would have three times as many jobs…
Which might look something like this:

19
How would 2030 travel conditions change?
Compared to baseline forecasts for 2030
-1%
5%
-1% Severe AM Peak Period Congestion
Daily Vehicle Miles of Travel
Transit Trips
“Region Undivided” Scenario
20
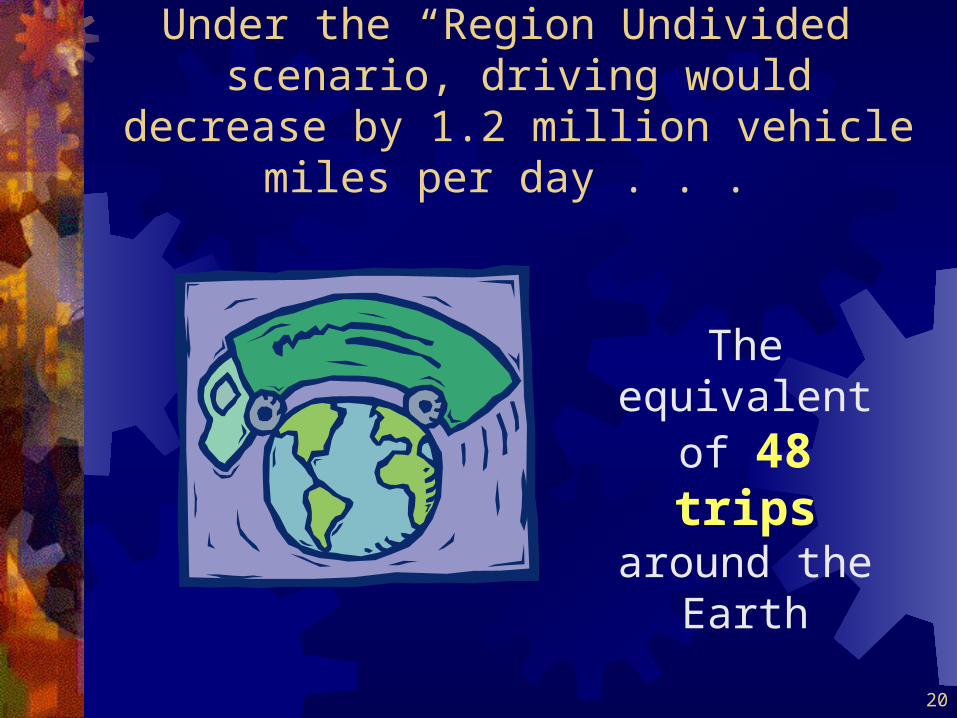
Under the “Region Undivided” scenario, driving would decrease by 1.2 million
vehicle miles per day . . .
The equivalent of 48 trips around the
Earth

21
In many places, the local impacts
would be even bigger.
The number of transit trips to Largo
would nearly double under the Region Undivided
Scenario.
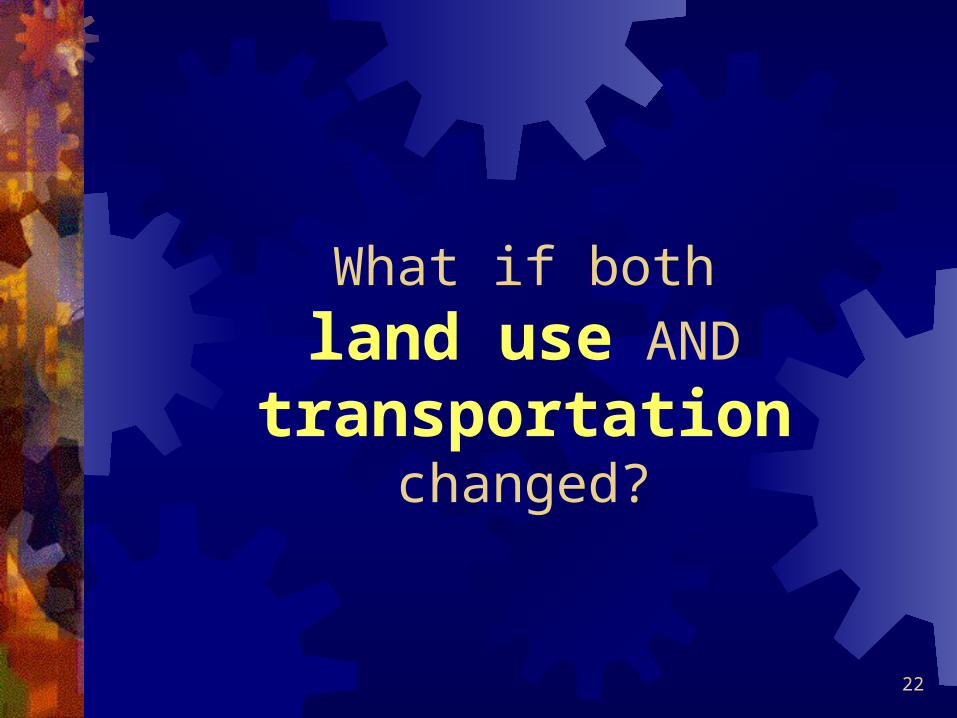
22
What if both
land use AND transportation
changed?
23
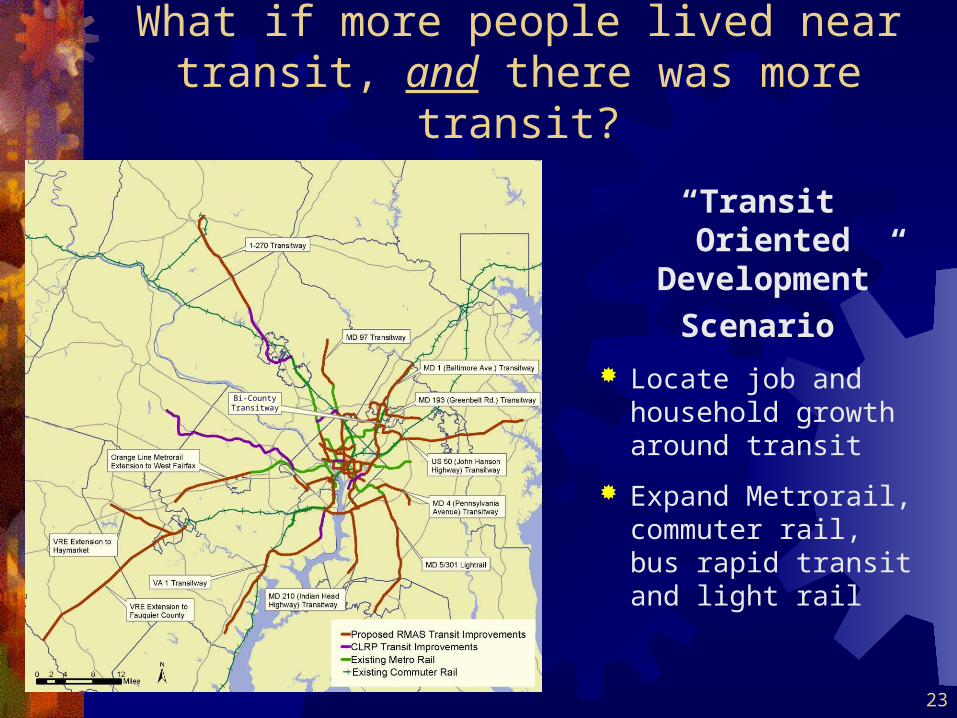
What if more people lived near transit, and there was more transit?
“Transit Oriented Development”
Scenario
Locate job and household growth around transit
Expand Metrorail, commuter rail, bus rapid transit and light rail
Bi-County Transitway

24
This scenario includes Rail over the
Woodrow Wilson Bridge
Rail Over the Woodrow Wilson
Bridge

25
The scenario also includes light rail or other rapid transit in southern Prince George’s County:
Light Rail from National Harbor to Anacostia
MD 5 Light Rail from Branch Ave Metro to Waldorf
Indian Head Highway Transitway
Pennsylvania Ave Transitway

26
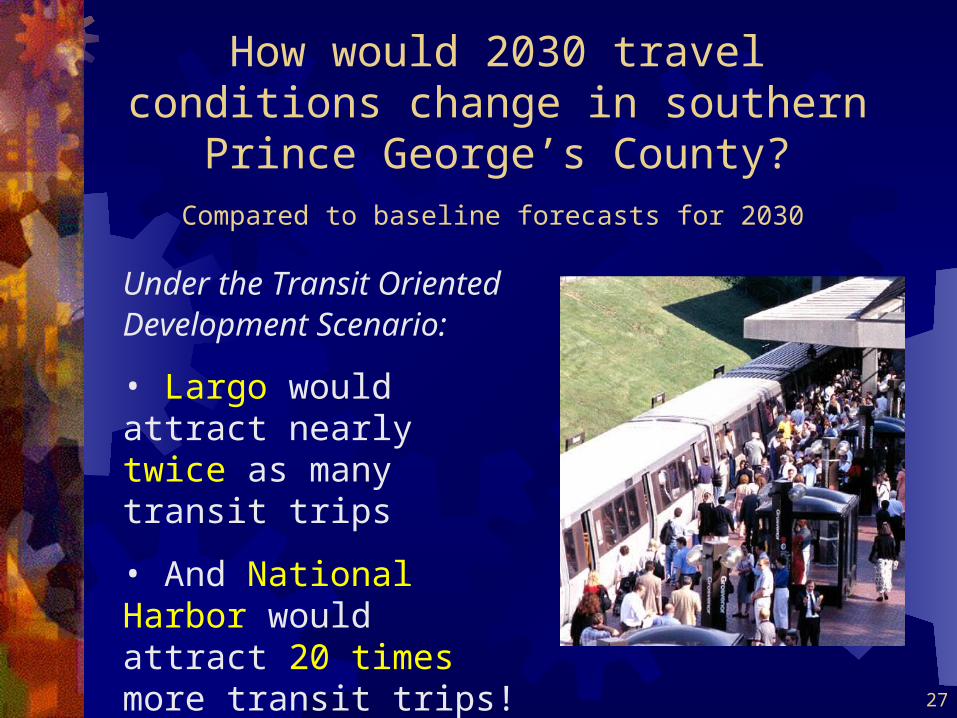
How would 2030 travel conditions change?
Compared to baseline forecasts for 2030
-1%
8%
-5% Severe AM Peak Period Congestion
Daily Vehicle Miles of Travel
Transit Trips
“Transit Oriented Development” Scenario
27
Under the Transit Oriented Development Scenario:
• Largo would attract nearly twice as many transit trips
• And National Harbor would attract 20 times more transit trips!
How would 2030 travel conditions change in southern Prince George’s
County? Compared to baseline forecasts for 2030
28
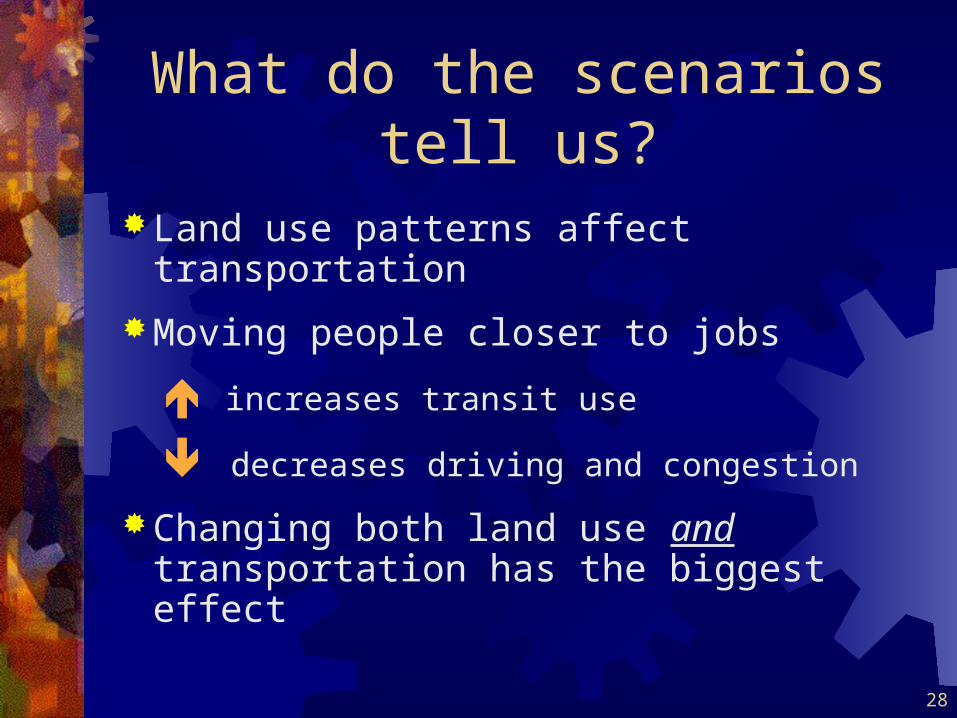
What do the scenarios tell us?
Land use patterns affect transportation
Moving people closer to jobs
increases transit use
decreases driving and congestion
Changing both land use and transportation has the biggest effect

29
Other things to think about
30
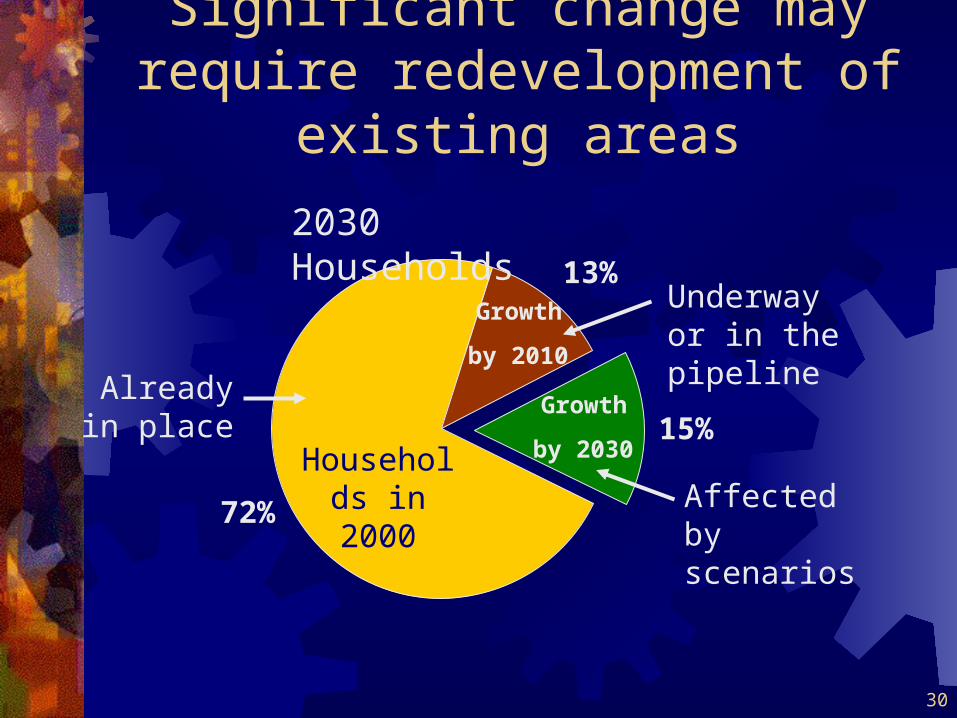
Significant change may require redevelopment of existing areas
Households in 2000
Growth
by 2010
Growth
by 2030
Affected by scenarios
2030 Households
72%
13%
15%
Underway or in the pipeline
Already in place

31
Change takes time
Courtesy of WMATA
Scenarios only look out to 2030, but impacts may be greatest in 2040, 2050, and beyond
For example, just look at how long it took to get Metro in place . . .
32
For more information, contact the Transportation Planning Board:
(202) 962-3200
www.mwcog.org/transportation