Embed Size (px)
Citation preview

1
Workforce and Economic DevelopmentOctober 2012
L. Wm. Seidman Research Institute

Seidman Research
• University Economist Projects• Work for Industry– Intel– A&D Projects– Mines
• Work for Govt– AZTC Report– Revenue Forecasting– Commerce Authority

For Today• Economic Development • Base Industries• Role of Workforce in Economic Development• The buzz around Technology• Defining the AZ Workforce Landscape• Comparing with other Metros• Looking to the Future• What will it take to compete?• Questions

Economic Development in AZ
• Structure– Commerce Authority– TREO– GPEC – Cities and Counties
• Objectives• Base Industries

Arizona Base Industries
• Based on both tradability and disproportionate size, many of the driving activities in Arizona can be grouped into one of three clusters: tourism and seasonal residents, high-technology manufacturing and associated wholesale trade, and call centers and back-office operations. A number of other activities that do not fit into one of these categories, such as copper mining, also help drive the state’s economy.

Base Industries cont.
• Each of these clusters is important in the Phoenix and Tucson metropolitan areas, though the specific leading industries within these categories vary between the two metro areas. In the balance of the state taken as a whole, only the tourism and seasonal residents cluster is a significant economic driver. Agriculture, mining, and government (particularly the federal government) are among the economic drivers in Arizona outside of the two major metro areas. Government also is important in the Tucson area, mostly due to the large size of the University of Arizona.

So what is important to attracting and retaining base Industries?
• Export based industries face pressures from businesses located anywhere on the planet. Their goal is to maximize profits and create positive returns on investments of capital.
Factors driving base industry migration
• Quality and depth of workforce• Quality of transportation Infrastructure that
allows the flow of resources in and products out in an efficient timely manner
• Quality of the energy, communications, and education infrastructure and programs
• Importance of Place, Moretti• Tax and Regulatory Policy

The buzz around Technology
• Knowledge Economy Pursuits• Our AZ Tech Report– Wages and signals– Mobility vs. pressure for local production– Competing with globalization and productivity– Matching tech workers with tech jobs
• Milken Report– 3 conclusions

Milken 1
For many years, Arizona enjoyed the Sun Belt boom. Drawnby relatively low costs and a high standard of living, newresidents flocked to the state from all over the country.Arizona experienced growth not only in housing, but also inmany high-tech fields. But the latest downturn has vividlydemonstrated that unfocused growth is not the path tostable long-term prosperity. Like the rest of the country,Arizona is confronting tough choices as it navigates a seriousrecession.
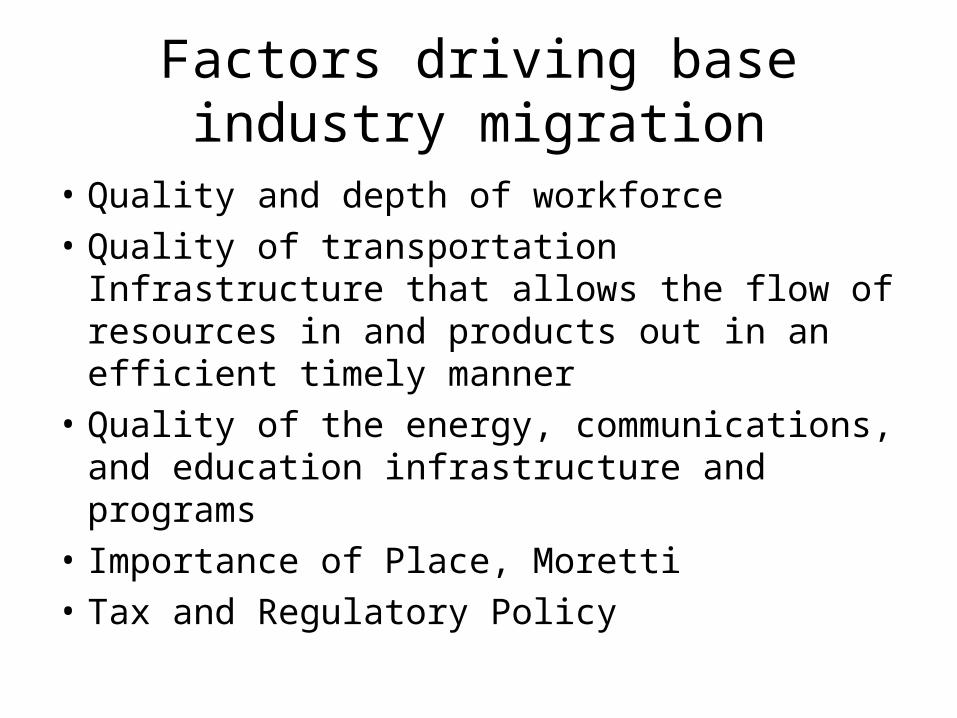
Milken 2To be clear, Arizona has pivotal resources with which to pursue more aggressive technology-based development.
It is hometo three large research universities (Arizona State University,the University of Arizona, and Northern ArizonaUniversity) and several mature high-tech industries.The state also has in place organizations dedicatedto promoting technology growth, such as ScienceFoundation Arizona, and boasts a unique abilityto attract businesses and talent from aroundthe country.
Milken 3
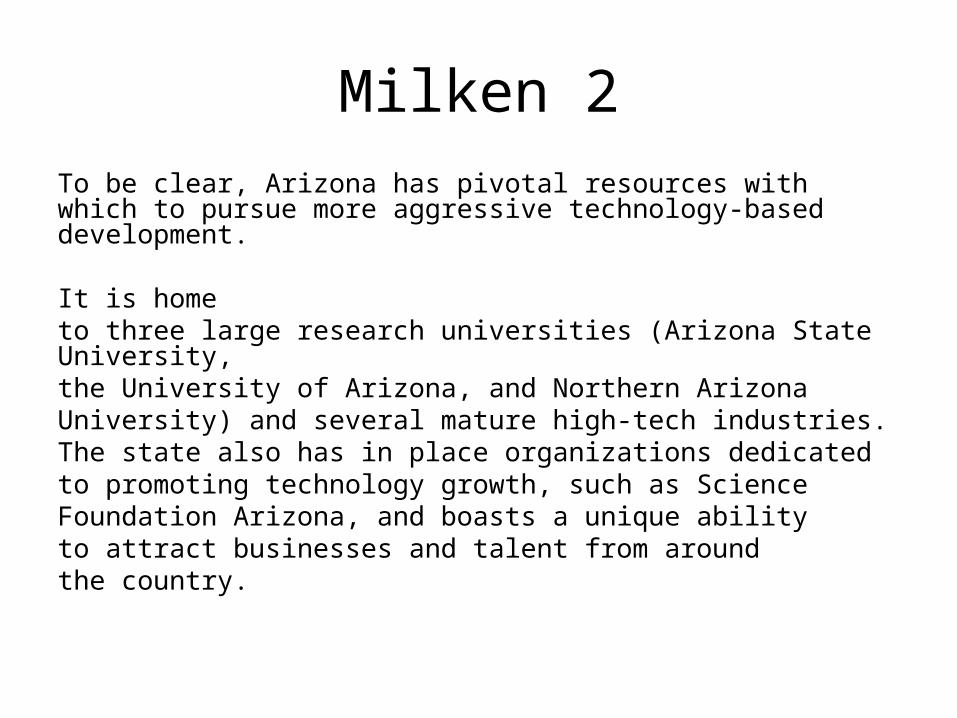
In order to compete on a national level—as well as withkey Western rivals such as Colorado, Utah, New Mexico,and Oregon—the state will need to supply the missingpieces of the puzzle: a deeper pool of skilled, educatedworkers; sufficient capital to fund research and expansionby entrepreneurs; and state-level leadership that is informedand committed to implementing well-considered, long-rangedevelopment strategies.
Examining the workforce landscape
• The Governor’s Council on Workforce Policy has developed the Arizona Workforce Connection website (http://www.arizonaworkforceconnection.com) as a source of information on recruiting and employment for businesses and job-seekers. Topics covered include educational and government programs, human resources contacts, legal and labor relations information, various incentive programs, and many other elements of the Arizona workforce environment.

Arizona Statewide---2011 Occupational Employment & Hourly Wage Estimates
Occ. Code Occupational Title10th
Percentile Wage
Median Wage
90th Percentile
Wage
Rounded Employ-
ment
Share of Employment
00-0000 All Occupations $8.60 $16.40 $39.19 2,380,180
11-0000 Management Occupations $20.14 $39.98 $80.66 128,090 5.38%
13-0000 Business & Financial Operations Occupations $16.05 $27.22 $46.12 116,000 4.87%
15-0000 Computer & Mathematical Occupations $17.93 $34.09 $56.09 66,420 2.79%
17-0000 Architecture & Engineering Occupations $19.13 $34.88 $57.58 49,400 2.08%
19-0000 Life, Physical, & Social Science Occupations $13.67 $23.08 $43.28 18,120 0.76%
21-0000 Community & Social Service Occupations $10.89 $17.93 $30.08 34,150 1.43%
23-0000 Legal Occupations $17.11 $33.99 $81.16 17,830 0.75%
25-0000 Education, Training, & Library Occupations $9.99 $18.79 $37.43 149,300 6.27%
27-0000 Arts, Design, Entertainment, Sports, & Media Occupations $9.11 $18.97 $36.37 26,480 1.11%
29-0000 Healthcare Practitioners & Technical Occupations $14.51 $31.03 $60.33 128,840 5.41%
31-0000 Healthcare Support Occupations $9.02 $12.84 $18.99 64,480 2.71%
33-0000 Protective Service Occupations $9.55 $19.73 $36.34 75,170 3.16%
35-0000 Food Preparation & Serving Related Occupations $7.72 $9.09 $15.23 220,290 9.26%
37-0000 Building & Grounds Cleaning & Maintenance Occupations $7.90 $10.31 $17.58 83,340 3.50%
39-0000 Personal Care & Service Occupations $7.86 $10.10 $18.48 69,460 2.92%
41-0000 Sales & Related Occupations $8.17 $12.71 $33.00 261,740 11.00%
43-0000 Office & Administrative Support Occupations $9.49 $15.20 $24.91 423,560 17.80%
45-0000 Farming, Fishing, & Forestry Occupations $7.70 $8.94 $12.41 11,170 0.47%
47-0000 Construction & Extraction Occupations $11.19 $18.09 $29.90 97,420 4.09%
49-0000 Installation, Maintenance, & Repair Occupations $10.52 $19.07 $32.20 95,380 4.01%
51-0000 Production Occupations $8.72 $14.25 $26.35 101,830 4.28%
53-0000 Transportation & Material Moving Occupations $8.34 $13.93 $26.26 141,710 5.95%
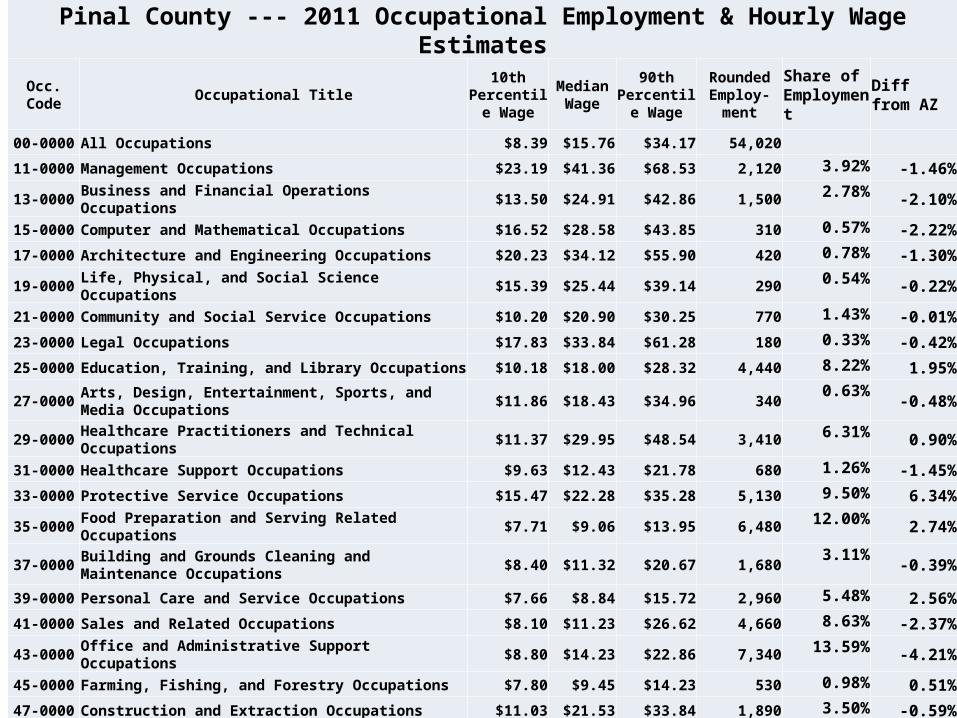
Pinal County --- 2011 Occupational Employment & Hourly Wage Estimates
Occ. Code Occupational Title10th
Percentile Wage
Median Wage
90th Percentile
Wage
Rounded Employ-
ment
Share of Employment Diff from AZ
00-0000 All Occupations $8.39 $15.76 $34.17 54,020
11-0000 Management Occupations $23.19 $41.36 $68.53 2,120 3.92% -1.46%
13-0000 Business and Financial Operations Occupations $13.50 $24.91 $42.86 1,500 2.78% -2.10%
15-0000 Computer and Mathematical Occupations $16.52 $28.58 $43.85 310 0.57% -2.22%
17-0000 Architecture and Engineering Occupations $20.23 $34.12 $55.90 420 0.78% -1.30%
19-0000 Life, Physical, and Social Science Occupations $15.39 $25.44 $39.14 290 0.54% -0.22%
21-0000 Community and Social Service Occupations $10.20 $20.90 $30.25 770 1.43% -0.01%
23-0000 Legal Occupations $17.83 $33.84 $61.28 180 0.33% -0.42%
25-0000 Education, Training, and Library Occupations $10.18 $18.00 $28.32 4,440 8.22% 1.95%
27-0000 Arts, Design, Entertainment, Sports, and Media Occupations $11.86 $18.43 $34.96 3400.63%
-0.48%
29-0000 Healthcare Practitioners and Technical Occupations $11.37 $29.95 $48.54 3,410 6.31% 0.90%
31-0000 Healthcare Support Occupations $9.63 $12.43 $21.78 680 1.26% -1.45%
33-0000 Protective Service Occupations $15.47 $22.28 $35.28 5,130 9.50% 6.34%
35-0000 Food Preparation and Serving Related Occupations $7.71 $9.06 $13.95 6,480 12.00% 2.74%
37-0000 Building and Grounds Cleaning and Maintenance Occupations $8.40 $11.32 $20.67 1,6803.11%
-0.39%
39-0000 Personal Care and Service Occupations $7.66 $8.84 $15.72 2,960 5.48% 2.56%
41-0000 Sales and Related Occupations $8.10 $11.23 $26.62 4,660 8.63% -2.37%
43-0000 Office and Administrative Support Occupations $8.80 $14.23 $22.86 7,340 13.59% -4.21%
45-0000 Farming, Fishing, and Forestry Occupations $7.80 $9.45 $14.23 530 0.98% 0.51%
47-0000 Construction and Extraction Occupations $11.03 $21.53 $33.84 1,890 3.50% -0.59%
49-0000 Installation, Maintenance, and Repair Occupations $12.61 $20.93 $32.80 2,970 5.50% 1.49%
51-0000 Production Occupations $9.47 $15.15 $26.19 2,600 4.81% 0.53%
53-0000 Transportation and Material Moving Occupations $8.09 $12.85 $21.79 3,320 6.15% 0.19%

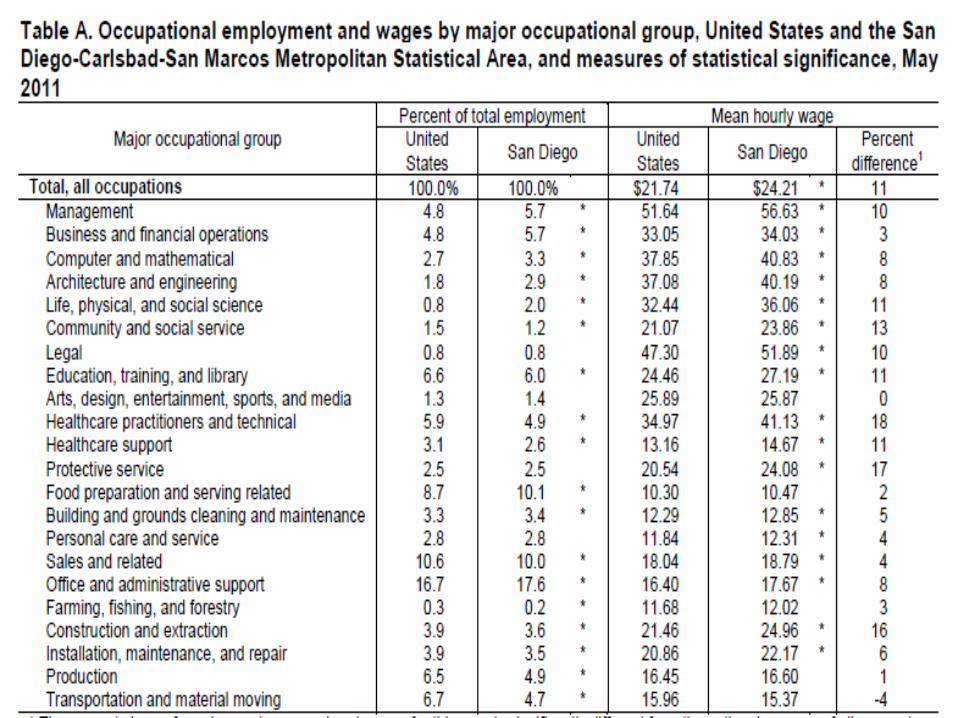
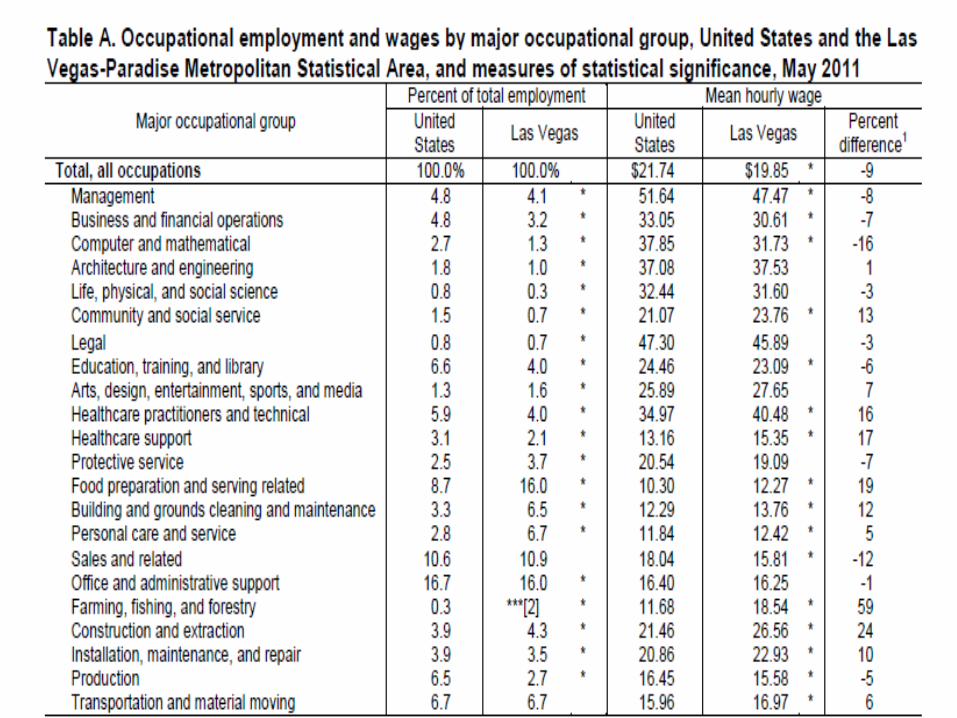
Metro Comparisons
• PHX• Tucson• San Diego• Las Vegas• Denver• Albuquerque• Salt Lake


Arizona Moving Forward
• Current look ahead• Reasons to question the traditional prospects


Educational Attainment, Age 25 and Older U.S. Arizona PinalSHARES in Percent No schooling completed 1.1 1.1 1.1 Nursery to 4th grade 0.9 1.0 0.9 5th and 6th grade 1.8 2.3 1.8 7th and 8th grade 2.4 2.3 2.7 9th grade 1.9 1.9 1.7 10th grade 2.4 2.2 2.9 11th grade 2.5 2.3 3.4 12th grade, no diploma 1.9 2.0 1.9 High school graduate, GED, or alternative 29.0 25.1 29.1 Some college, less than 1 year 6.3 7.7 9.5 Some college, 1 or more years, no degree 14.3 17.9 18.1 Associate's degree 7.5 8.0 9.2 Bachelor's degree 17.6 16.7 12.0 Master's degree 7.2 6.8 4.5 Professional school degree 2.0 1.7 0.8 Doctorate degree 1.2 1.1 0.6
Less Than High School 15.0 15.0 16.3 High school graduate, GED, or alternative 29.0 25.1 29.1 Some College/Associate's 28.1 33.5 36.8 Bachelor's degree 17.6 16.7 12.0 Master's or Professional 9.1 8.5 5.2 Doctorate degree 1.2 1.1 0.6

Unemploymentrate
Total, 25 years and over 6.6
Less than a high school diploma 11.3
High school graduates, no college 8.7
Some college or associate degree 6.5
Bachelor's degree and higher4.1
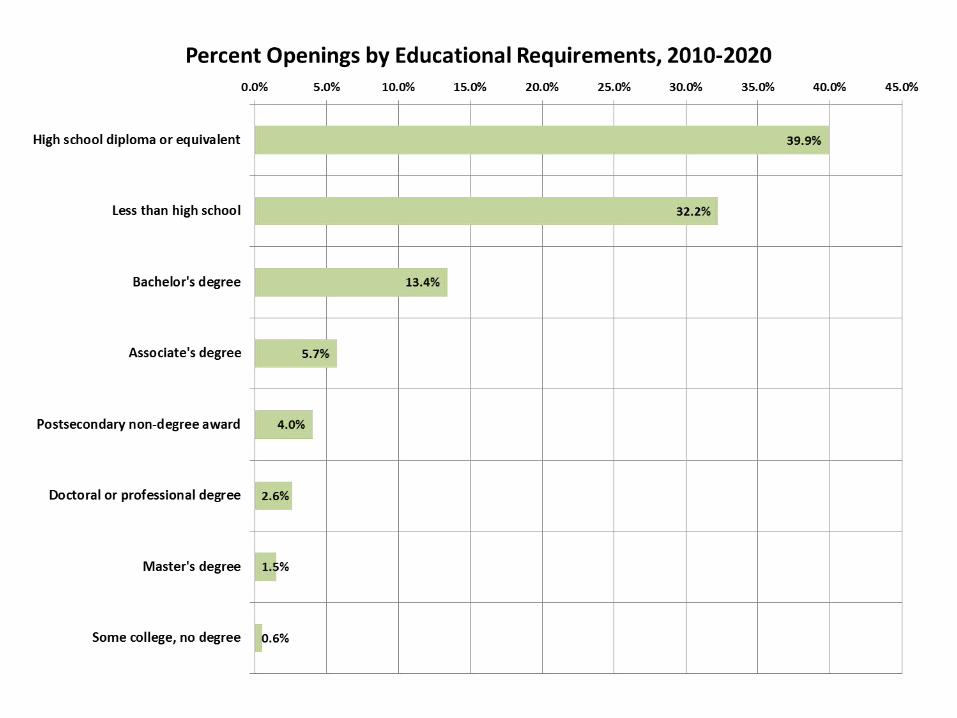
Will this picture change educational choice decisions among youth

Opportunities and Challenges
• A Chance to plan the future of Pinal County• Tax Base and Land/Water Ownership• Networking with Phx, Tucson• Networking as a SW Cluster• Competition will be fierce• Questions?????????