Embed Size (px)
Citation preview

1 www.conference-board.org © 2008 The Conference Board, Inc.
NameDirector, Associate Service
The Conference Board
Trusted Insights for Business Worldwide
Intangible Investment and Levels of Economic Development
Bart van Ark, Janet Hao, Carol Corrado and Charles HultenMarch 2010
The Conference Board

2 www.conference-board.org © 2008 The Conference Board, Inc.
Intangible Assets: a New Driver of the Modern Economy
Traditional assets can be touched or seen. land, plant and equipment.
Intangible assets cannot be touched or seen, such as software development of Microsoft, research and development of Johnson & Johnson, brand equity of Coca Cola and logistics management of Walmart.
We should capitalize intangible assets as we capitalize tangible assets because both use current resources in order to increase future production and consumption (Corrado, Hulten and Sichel, 2005).

3 www.conference-board.org © 2008 The Conference Board, Inc.
List of Intangible Assets
Computerized information Software (already in NA) Database
Innovative property R&D Mineral exploration and evaluation (already in NA) Copyright and licenses New products in financial industry Architectural and engineering designs
Economic Competencies Brand equity Firm-specific human capital Organizational structure
Source: Corrado, Hulten and Sichel (2005).

4 www.conference-board.org © 2008 The Conference Board, Inc.
Goal of This Research
Carrying out growth accounting using intangible assets.
Comparing intangible assets across 16 countries that have estimates of intangibles available.
Exploring the possible determinants of intangible investment.

5 www.conference-board.org © 2008 The Conference Board, Inc.
0
5
10
15
20
25
30
Intangible and Tangible Investment in the Market Sector (% GDP)
intangible investment
tangible investment
Source: Hao et al. (2009) for Germany, France, Italy and Spain; CHS (2009) for the US , and Marrano et al. (2009) for the UK.
6 www.conference-board.org © 2008 The Conference Board, Inc.
-2.00
-1.00
0.00
1.00
2.00
3.00
4.00
5.00
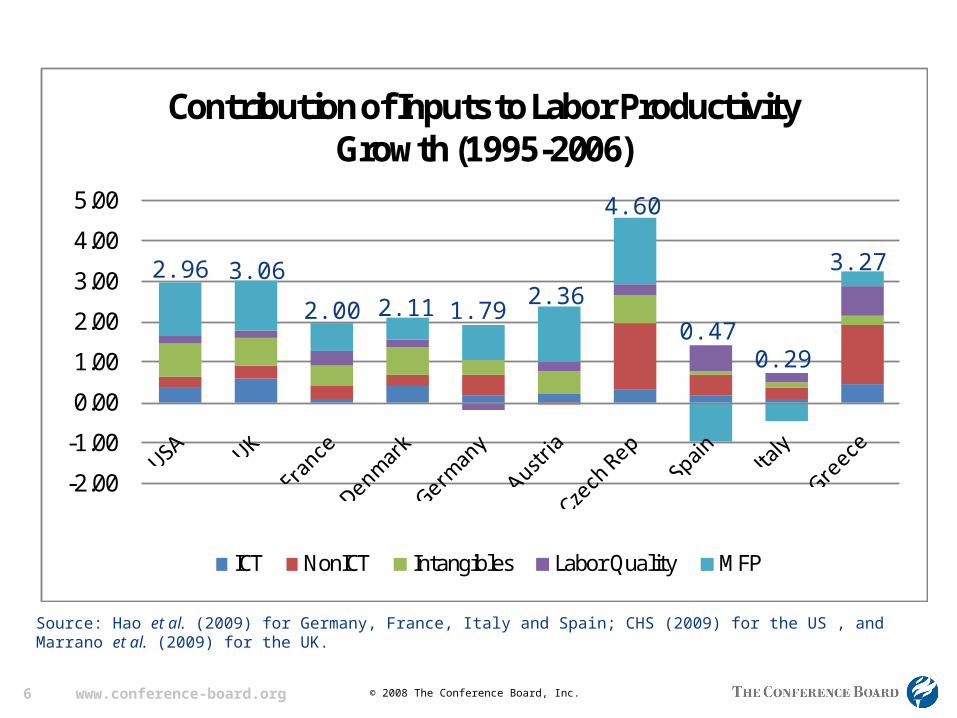
Contribution of Inputs to Labor Productivity Growth (1995-2006)
ICT NonICT Intangibles Labor Quality MFP
Source: Hao et al. (2009) for Germany, France, Italy and Spain; CHS (2009) for the US , and Marrano et al. (2009) for the UK.
2.96 3.06
2.00 2.11 1.792.36
4.60
0.470.29
3.27

7 www.conference-board.org © 2008 The Conference Board, Inc.
-2.00
-1.00
0.00
1.00
2.00
3.00
4.00
5.00
Contribution of Inputs to Labor Productivity Growth (1995-2006)
ICT NonICT Intangibles Labor Quality MFP
Source: Hao et al. (2009) for Germany, France, Italy and Spain; CHS (2009) for the US , and Marrano et al. (2009) for the UK.
50% 38%
37% 46% 42%54%
23%
8%16%
8%

8 www.conference-board.org © 2008 The Conference Board, Inc.
USA EU9 Germany France Italy Spain Austria Denmark UK Finland SwedenExcluding Intangible Capital (%)
LP growth 2.75 1.59 1.62 1.83 0.26 0.35 1.99 1.54 2.90 3.24 3.70Tangible deepening (ex. software)0.77 0.69 0.80 0.51 0.43 0.77 0.26 0.78 1.10 0.23 1.60Labour composition 0.20 0.24 -0.16 0.44 0.24 0.68 0.24 0.19 0.26 0.14 0.30MFP 1.78 0.66 0.98 0.88 -0.41 -1.10 1.49 0.57 1.54 2.86 1.80
Including Intangible Capital (%)LP growth 2.96 1.72 1.79 2.00 0.29 0.48 2.36 2.10 3.05 3.51 3.90Tangible deepening (ex. software)0.64 0.59 0.68 0.43 0.40 0.68 0.24 0.68 0.91 0.04 1.40Intangible deepening 0.83 0.41 0.38 0.48 0.12 0.12 0.55 0.72 0.69 0.75 1.80Labour composition 0.18 0.22 -0.15 0.40 0.22 0.64 0.22 0.17 0.22 0.12 0.30MFP 1.33 0.51 0.88 0.69 -0.45 -0.96 1.35 0.53 1.23 2.57 0.40
Contribution to LP Growth (1995-2006)
Source: Hao et al. (2009) for Germany, France, Italy, Spain, Austria and Denmark; CHS (2009) for the US , Marrano et al. (2009) for the UK, Jalava et al. (2007) for Finland, and Edquist (2009) for Sweden.Note: Finland is from 1995 to 2005, and Sweden is from 1995 to 2004.

9 www.conference-board.org © 2008 The Conference Board, Inc.
Correlation between Intangibles and Other Variables
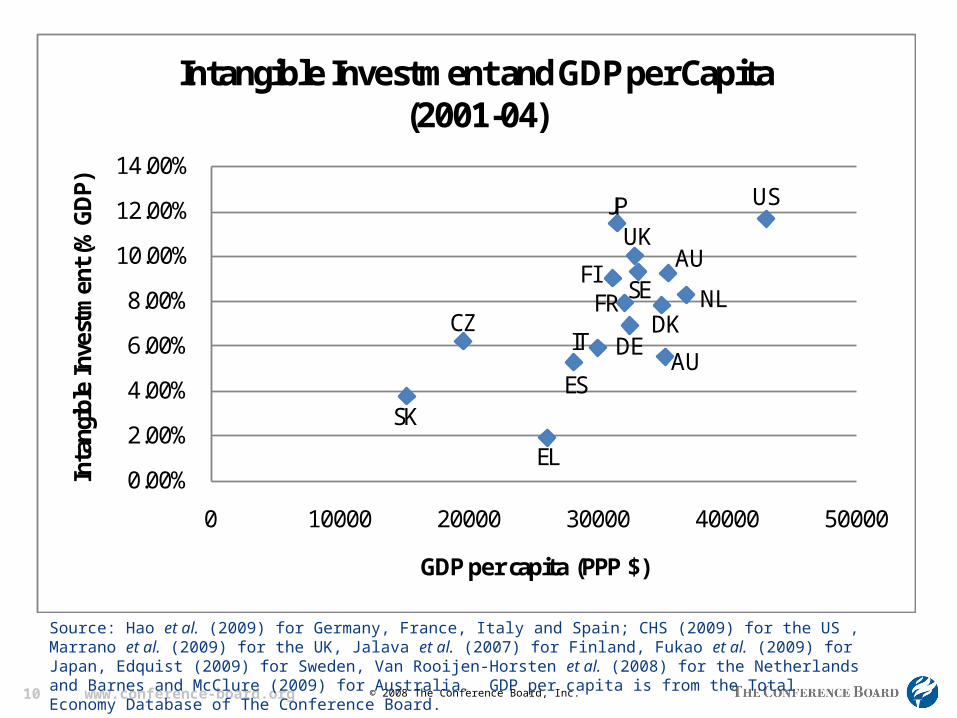
Wealthier countries invest greater proportions in intangible assets.
Higher intangible investments (% GDP) is associated with greater labor productivity.
Mature financial market is associated with heavy investment in intangible assets.
Government policy is associated with intangible investment.
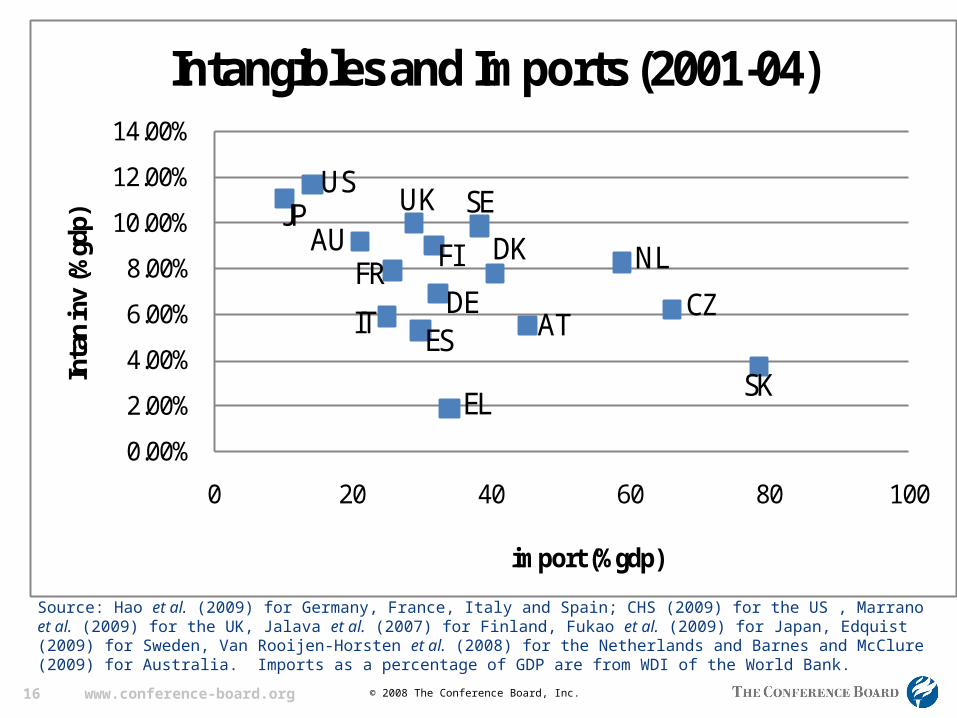
Openness is negatively correlated with intangible investment.
10 www.conference-board.org © 2008 The Conference Board, Inc.
0.00%
2.00%
4.00%
6.00%
8.00%
10.00%
12.00%
14.00%
0 10000 20000 30000 40000 50000
Inta
ngib
le In
vest
men
t (%
GD
P)
GDP per capita (PPP $)
Intangible Investment and GDP per Capita (2001-04)
SK
CZ
EL
USJPUK
AUSE
FINL
DKFR
DEAU
IT
ES
Source: Hao et al. (2009) for Germany, France, Italy and Spain; CHS (2009) for the US , Marrano et al. (2009) for the UK, Jalava et al. (2007) for Finland, Fukao et al. (2009) for Japan, Edquist (2009) for Sweden, Van Rooijen-Horsten et al. (2008) for the Netherlands and Barnes and McClure (2009) for Australia. GDP per capita is from the Total Economy Database of The Conference Board.

11 www.conference-board.org © 2008 The Conference Board, Inc.
0.00%
2.00%
4.00%
6.00%
8.00%
10.00%
12.00%
14.00%
0 10 20 30 40 50 60
Inta
ngib
le in
vest
men
t (%
GD
P)
LP-hour (PPP $)
Intangible Investment and Labor Productivity (2001-04)
USJP
AU
EL
SK
CZ
NLFR
UKAUFI
DKDE
ITES
Source: Hao et al. (2009) for Germany, France, Italy and Spain; CHS (2009) for the US , Marrano et al. (2009) for the UK, Jalava et al. (2007) for Finland, Fukao et al. (2009) for Japan, Edquist (2009) for Sweden, Van Rooijen-Horsten et al. (2008) for the Netherlands and Barnes and McClure (2009) for Australia.

12 www.conference-board.org © 2008 The Conference Board, Inc.
0.00
2.00
4.00
6.00
8.00
10.00
12.00
14.00
0 50 100 150
Inta
ngib
le in
vest
men
t (%
GD
P)
Market Capitalization (% GDP)
Intangible Investment and Market Capitalization (2001-04)
SK
EL
JP US
UK
CZ
AT IT
DEDK FI
NL
SEFR
ES
Source: Hao et al. (2009) for Germany, France, Italy and Spain; CHS (2009) for the US , Marrano et al. (2009) for the UK, Jalava et al. (2007) for Finland, Fukao et al. (2009) for Japan, Edquist (2009) for Sweden, Van Rooijen-Horsten et al. (2008) for the Netherlands and Barnes and McClure (2009) for Australia. Market capitalization is from Eurostat.

13 www.conference-board.org © 2008 The Conference Board, Inc.
0.00
2.00
4.00
6.00
8.00
10.00
12.00
14.00
0 0.05 0.1 0.15 0.2 0.25 0.3 0.35 0.4
Inta
ngib
le in
vest
men
t (%
GD
P)
Venture Capital (% GDP)
Intangible Investment and Venture Capital (2001-04)
USUK
EL
SK
SENL
DK
FIFR
ES
DE
ITAT
CZ
Source: Hao et al. (2009) for Germany, France, Italy and Spain; CHS (2009) for the US , Marrano et al. (2009) for the UK, Jalava et al. (2007) for Finland, Fukao et al. (2009) for Japan, Edquist (2009) for Sweden, Van Rooijen-Horsten et al. (2008) for the Netherlands and Barnes and McClure (2009) for Australia. Venture capital is from Eurostat.

14 www.conference-board.org © 2008 The Conference Board, Inc.
0.00%2.00%4.00%6.00%8.00%
10.00%12.00%14.00%
0 20 40 60 80 100 120
inta
n in
v (%
gdp)
days required to open a business
Intangibles and Barrier of Enterpreneurship
US
AUDK NL
UKSE JPFIFR
IT AT CZDE
ELSK
ES
Source: Hao et al. (2009) for Germany, France, Italy and Spain; CHS (2009) for the US , Marrano et al. (2009) for the UK, Jalava et al. (2007) for Finland, Fukao et al. (2009) for Japan, Edquist (2009) for Sweden, Van Rooijen-Horsten et al. (2008) for the Netherlands and Barnes and McClure (2009) for Australia. Days required to open a business is from WDI of the World Bank.

15 www.conference-board.org © 2008 The Conference Board, Inc.
0.00%
2.00%
4.00%
6.00%
8.00%
10.00%
12.00%
14.00%
0 0.5 1 1.5 2 2.5 3
inta
n in
v (%
gdp)
R&D as a % of gov budget
Intangibles and R&D in Gov Budget
USJPUK
FR
ES
SE
NLDE
DK
ITATCZSK
EL
Source: Hao et al. (2009) for Germany, France, Italy and Spain; CHS (2009) for the US , Marrano et al. (2009) for the UK, Jalava et al. (2007) for Finland, Fukao et al. (2009) for Japan, Edquist (2009) for Sweden, Van Rooijen-Horsten et al. (2008) for the Netherlands and Barnes and McClure (2009) for Australia. R&D as a share of governmetn budget is from Eurostat.
16 www.conference-board.org © 2008 The Conference Board, Inc.
0.00%
2.00%
4.00%
6.00%
8.00%
10.00%
12.00%
14.00%
0 20 40 60 80 100
Inta
n in
v (%
gdp)
import (%gdp)
Intangibles and Imports (2001-04)
USJP UK SE
AUFR
DK NLFI
DEIT ES AT
CZ
SKEL
Source: Hao et al. (2009) for Germany, France, Italy and Spain; CHS (2009) for the US , Marrano et al. (2009) for the UK, Jalava et al. (2007) for Finland, Fukao et al. (2009) for Japan, Edquist (2009) for Sweden, Van Rooijen-Horsten et al. (2008) for the Netherlands and Barnes and McClure (2009) for Australia. Imports as a percentage of GDP are from WDI of the World Bank.

17 www.conference-board.org © 2008 The Conference Board, Inc.
0.00%
2.00%
4.00%
6.00%
8.00%
10.00%
12.00%
14.00%
0 2 4 6 8 10
inta
n in
v (%
GDP)
FDI (% GDP)
Intangibles and FDI (2001-04)
JPUS
UK SEAU
FIFR NL
ES CZ
SKATIT
DEDK
EL
Source: Hao et al. (2009) for Germany, France, Italy and Spain; CHS (2009) for the US , Marrano et al. (2009) for the UK, Jalava et al. (2007) for Finland, Fukao et al. (2009) for Japan, Edquist (2009) for Sweden, Van Rooijen-Horsten et al. (2008) for the Netherlands and Barnes and McClure (2009) for Australia. FDI as a percentage of GDP is from WDI of the World Bank.

18 www.conference-board.org © 2008 The Conference Board, Inc.
Correlations (2001-04) intan inv (%GDP)
TFP (conventional)
FDI(share of gdp) -0.26 0.52imports(%gdp) -0.52 0.43exports (%gdp) -0.37 0.39high-tech exports (% of manufactured exports) 0.77 0.15
R&D in gov budget 0.80 -0.06time required to start a business (days) -0.57 -0.10Military Expenditure (% GDP) -0.04 0.27% population using computer 0.77 0.37%population using internet 0.69 0.48share researchers(all) in total emp 0.62 0.33share tertiary edu 0.39 -0.11sell goods in other countries--innov enterprises 0.46 -0.38
sell goods in other countries--non-innov enterprises -0.03 -0.49
Gross operating surplus/turnover of manufacturing(%) -0.34 0.13

19 www.conference-board.org © 2008 The Conference Board, Inc.
Conclusion and Future Research
Intangible assets explains about a quarter of LP growth in the US and larger countries of the EU.
Western Europe benefited more from intangible assets than catching-up countries did.
Catching-up countries such as Czech Republic, Greece and Slovakia benefited more from tangible assets than from intangible assets.
To find out what caused the cross-country difference, we need to look deeper into each economy and possibly carry out analysis at the industry level.

20 www.conference-board.org © 2008 The Conference Board, Inc.
Backup Slides

21 www.conference-board.org © 2008 The Conference Board, Inc.
Intangible Assets Depreciation Rates
SoftwareDatabases
0.3150.315
R&DMineral exploration and evaluation
0.20.2
Copyright and license costsDevelopment costs in the financial industryNew architectural and engineering designs
0.20.20.2
Advertising expenditureMarket researchFirm-specific human capitalOrganizational structure
0.60.60.40.4
Source: CHS (2005)

22 www.conference-board.org © 2008 The Conference Board, Inc.
Austria Czech
Republic Denmark Greece Slovakia
1. Computerized information 0.89 0.71 1.87 0.34 0.37 a) Software 0.85 0.71 1.85 0.33 0.37 b) Databases 0.04 0.01 0.03 0.01 0.00
2. Innovative property 3.14 2.80 3.06 0.62 1.76 a) R&D, including social sciences and humanities 1.74 1.03 1.68 0.18 0.21 b) Mineral exploration and evaluation - - - - - c) Copyright and license costs 0.10 0.04 0.16 0.02 0.04 d) Development costs in financial industry 0.63 0.55 0.54 0.16 0.37 e) New architectural and engineering designs 0.66 1.18 0.69 0.27 1.15
3. Economic competencies 2.42 2.93 2.93 0.63 2.39 a) Brand equity 0.25 1.37 0.63 0.15 1.04 Advertising expenditure 0.15 0.94 0.36 0.08 0.46 Market research 0.11 0.43 0.27 0.06 0.59 b) Firm-specific human capital 0.79 0.63 1.49 0.19 0.51 Continuing vocational training 0.46 0.63 1.07 0.17 0.51 Apprentice training 0.33 0.00 0.42 0.02 0.00 c) Organizational structure 1.38 0.93 0.81 0.29 0.83 Purchased 0.93 0.26 0.45 0.06 0.25 Own account 0.44 0.67 0.36 0.23 0.58
Total Investment (% GDP) 6.46 6.45 7.86 1.59 4.53
2006

23 www.conference-board.org © 2008 The Conference Board, Inc.
Source of Growth AnalysisGermany France Italy Spain Austria Denmark UK Finland Sweden EU9
ContributionsExcluding intangibles 1.62 1.83 0.26 0.35 1.99 1.54 2.90 3.24 3.70 1.59ICT deepening (ex. software)0.23 0.14 0.12 0.21 0.29 0.50 0.74 0.23 0.30 0.30Non-ICT deepening 0.57 0.37 0.31 0.56 -0.03 0.28 0.36 1.30 0.38Labour composition -0.16 0.44 0.24 0.68 0.24 0.19 0.26 0.14 0.30 0.24MFP 0.98 0.88 -0.41 -1.10 1.49 0.57 1.54 2.86 1.80 0.66
Including intangibles 1.79 2.00 0.29 0.48 2.36 2.10 3.05 3.51 3.90 1.72ICT deepening (ex. software)0.20 0.12 0.11 0.19 0.26 0.44 0.63 0.04 0.30 0.26Non-ICT deepening 0.48 0.31 0.29 0.49 -0.02 0.24 0.28 1.10 0.33Intangible deepening 0.38 0.48 0.12 0.12 0.55 0.72 0.69 0.75 1.80 0.41Labour composition -0.15 0.40 0.22 0.64 0.22 0.17 0.22 0.12 0.30 0.22MFP 0.88 0.69 -0.45 -0.96 1.35 0.53 1.23 2.57 0.40 0.51Source: Hao et al. (2009) for Germany, France, Italy, Spain; and Austria, Marrano et al. (2009) for the UK, Jalava et al. (2007) for Finland, Edquist (2009) for Sweden, and Van Rooijen-Horsten et al. (2008) for the Netherlands.

24 www.conference-board.org © 2008 The Conference Board, Inc.
To ensure value through your
participation in the world’s foremost
community of business leadership
Our promise