Embed Size (px)
Citation preview
Fuzzy Clustering :: Tutorial (Fuzzy Logic Toolbox™) jar:file:///C:/Program%20Files/MATLAB/R2011a/help/toolbox/fuzzy/hel...
1 of 14 28/7/2558 12:32
Fuzzy Clustering
On this page…
What is Data ClusteringFuzzy C-Means ClusteringSubtractive ClusteringData Clustering Using the Clustering GUI Tool
What is Data ClusteringClustering of numerical data forms the basis of many classification and system modeling algorithms. The purpose ofclustering is to identify natural groupings of data from a large data set to produce a concise representation of a system'sbehavior.
Fuzzy Logic Toolbox tools allow you to find clusters in input-output training data. You can use the cluster information togenerate a Sugeno-type fuzzy inference system that best models the data behavior using a minimum number of rules. Therules partition themselves according to the fuzzy qualities associated with each of the data clusters. Use thecommand-line function, genfis2 to automatically accomplish this type of FIS generation.
Back to Top
Fuzzy C-Means ClusteringFuzzy c-means (FCM) is a data clustering technique wherein each data point belongs to a cluster to some degree that isspecified by a membership grade. This technique was originally introduced by Jim Bezdek in 1981 [1] as an improvementon earlier clustering methods. It provides a method that shows how to group data points that populate somemultidimensional space into a specific number of different clusters.
Fuzzy Logic Toolbox command line function fcm starts with an initial guess for the cluster centers, which are intended tomark the mean location of each cluster. The initial guess for these cluster centers is most likely incorrect. Additionally, fcmassigns every data point a membership grade for each cluster. By iteratively updating the cluster centers and themembership grades for each data point, fcm iteratively moves the cluster centers to the right location within a data set.This iteration is based on minimizing an objective function that represents the distance from any given data point to acluster center weighted by that data point's membership grade.
The command line function fcm outputs a list of cluster centers and several membership grades for each data point. Youcan use the information returned by fcm to help you build a fuzzy inference system by creating membership functions torepresent the fuzzy qualities of each cluster.
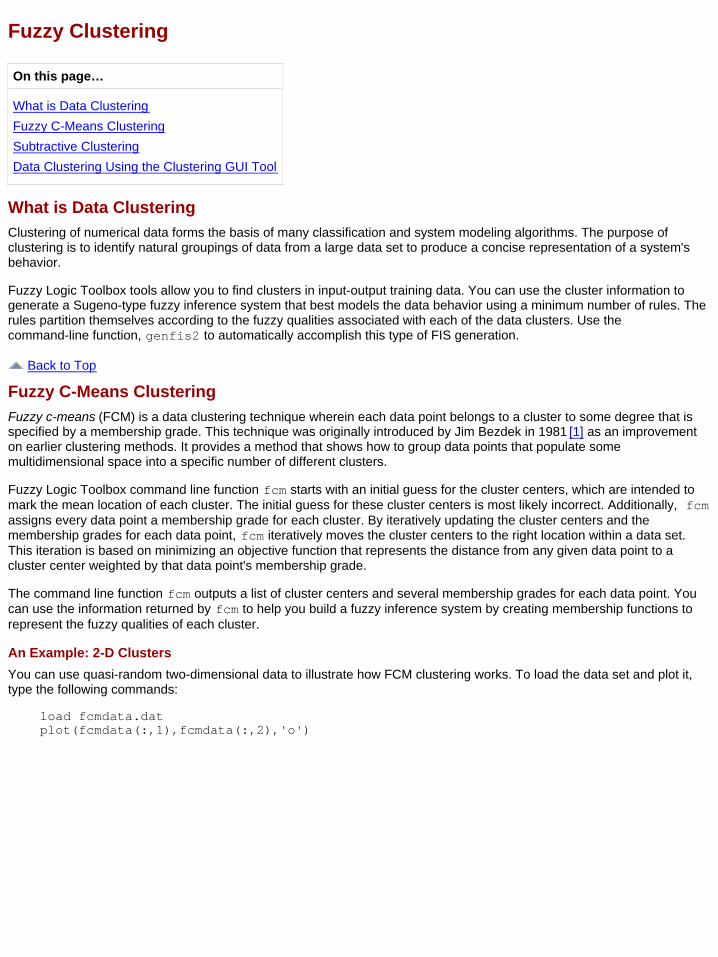
An Example: 2-D ClustersYou can use quasi-random two-dimensional data to illustrate how FCM clustering works. To load the data set and plot it,type the following commands:
load fcmdata.datplot(fcmdata(:,1),fcmdata(:,2),'o')
Fuzzy Clustering :: Tutorial (Fuzzy Logic Toolbox™) jar:file:///C:/Program%20Files/MATLAB/R2011a/help/toolbox/fuzzy/hel...
2 of 14 28/7/2558 12:32
Next, invoke the command-line function fcm to find two clusters in this data set until the objective function is no longerdecreasing much at all.
[center,U,objFcn] = fcm(fcmdata,2);
Here, the variable center contains the coordinates of the two cluster centers, U contains the membership grades foreach of the data points, and objFcn contains a history of the objective function across the iterations.
This command returns the following result:
Iteration count = 1, obj. fcn = 8.794048Iteration count = 2, obj. fcn = 6.986628.....Iteration count = 12, obj. fcn = 3.797430
The fcm function is an iteration loop built on top of the following routines:
initfcm — initializes the problemdistfcm — performs Euclidean distance calculationstepfcm — performs one iteration of clustering
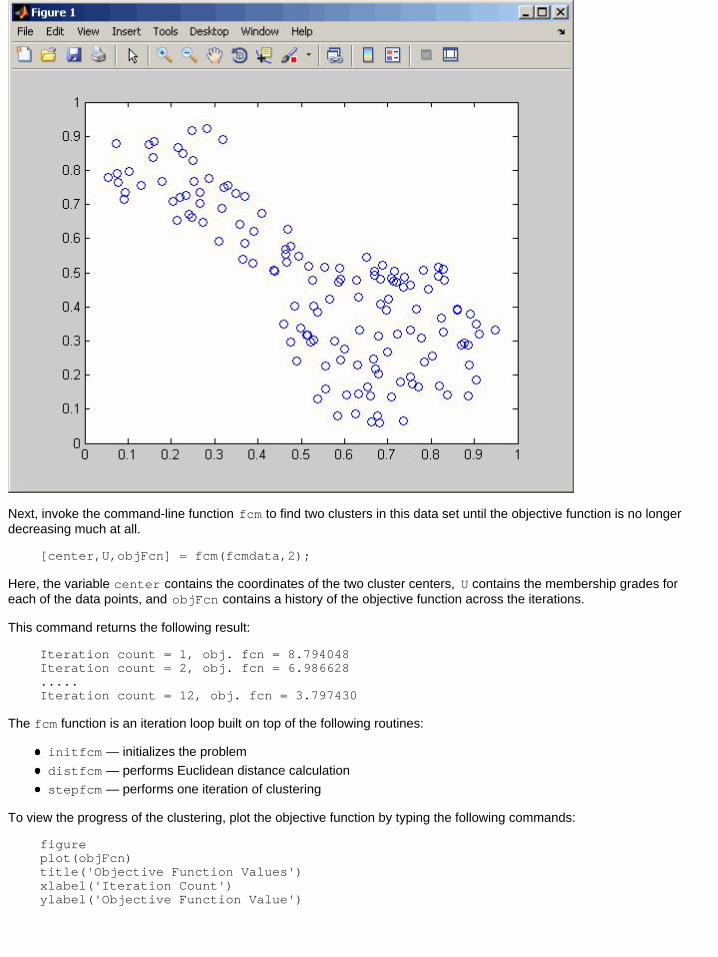
To view the progress of the clustering, plot the objective function by typing the following commands:
figureplot(objFcn)title('Objective Function Values')xlabel('Iteration Count')ylabel('Objective Function Value')
Fuzzy Clustering :: Tutorial (Fuzzy Logic Toolbox™) jar:file:///C:/Program%20Files/MATLAB/R2011a/help/toolbox/fuzzy/hel...
3 of 14 28/7/2558 12:32
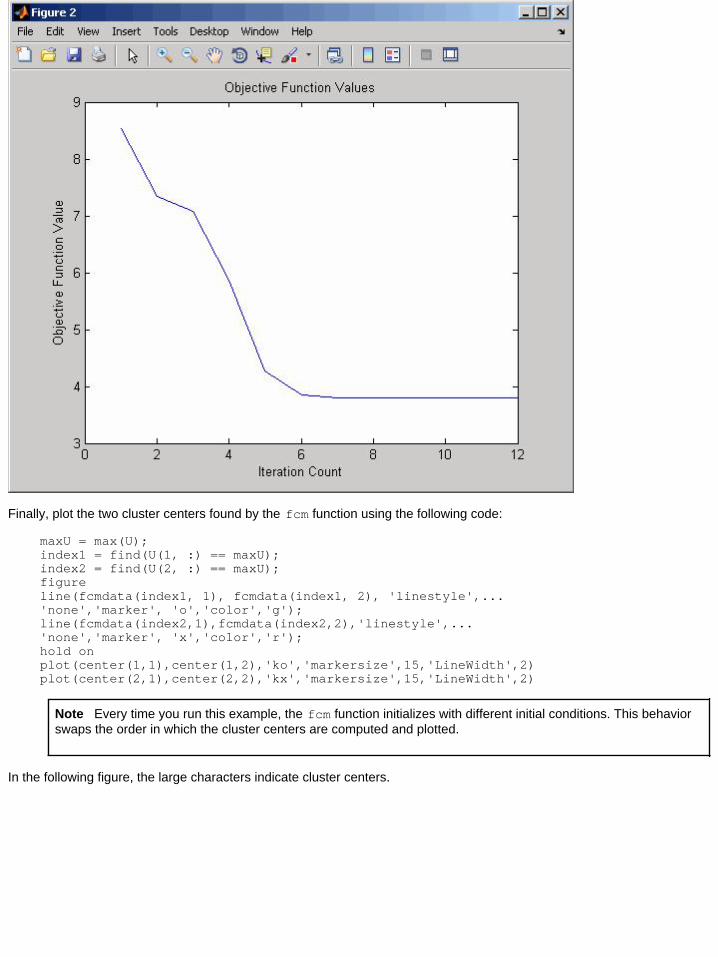
Finally, plot the two cluster centers found by the fcm function using the following code:
maxU = max(U);index1 = find(U(1, :) == maxU);index2 = find(U(2, :) == maxU);figureline(fcmdata(index1, 1), fcmdata(index1, 2), 'linestyle',...'none','marker', 'o','color','g');line(fcmdata(index2,1),fcmdata(index2,2),'linestyle',...'none','marker', 'x','color','r');hold onplot(center(1,1),center(1,2),'ko','markersize',15,'LineWidth',2)plot(center(2,1),center(2,2),'kx','markersize',15,'LineWidth',2)
Note Every time you run this example, the fcm function initializes with different initial conditions. This behaviorswaps the order in which the cluster centers are computed and plotted.
In the following figure, the large characters indicate cluster centers.
Fuzzy Clustering :: Tutorial (Fuzzy Logic Toolbox™) jar:file:///C:/Program%20Files/MATLAB/R2011a/help/toolbox/fuzzy/hel...
4 of 14 28/7/2558 12:32
Back to Top
Subtractive ClusteringIf you do not have a clear idea how many clusters there should be for a given set of data, Subtractive clustering, [2], is afast, one-pass algorithm for estimating the number of clusters and the cluster centers in a set of data. The clusterestimates, which are obtained from the subclust function, can be used to initialize iterative optimization-based clusteringmethods (fcm) and model identification methods (like anfis). The subclust function finds the clusters by using thesubtractive clustering method.
The genfis2 function builds upon the subclust function to provide a fast, one-pass method to take input-output trainingdata and generate a Sugeno-type fuzzy inference system that models the data behavior.
An Example: Suburban CommutingIn this example, you apply the genfis2 function to model the relationship between the number of automobile tripsgenerated from an area and the area's demographics. Demographic and trip data are from 100 traffic analysis zones inNew Castle County, Delaware. Five demographic factors are considered: population, number of dwelling units, vehicleownership, median household income, and total employment. Hence, the model has five input variables and one outputvariable.
Load and plot the data by typing the following commands:
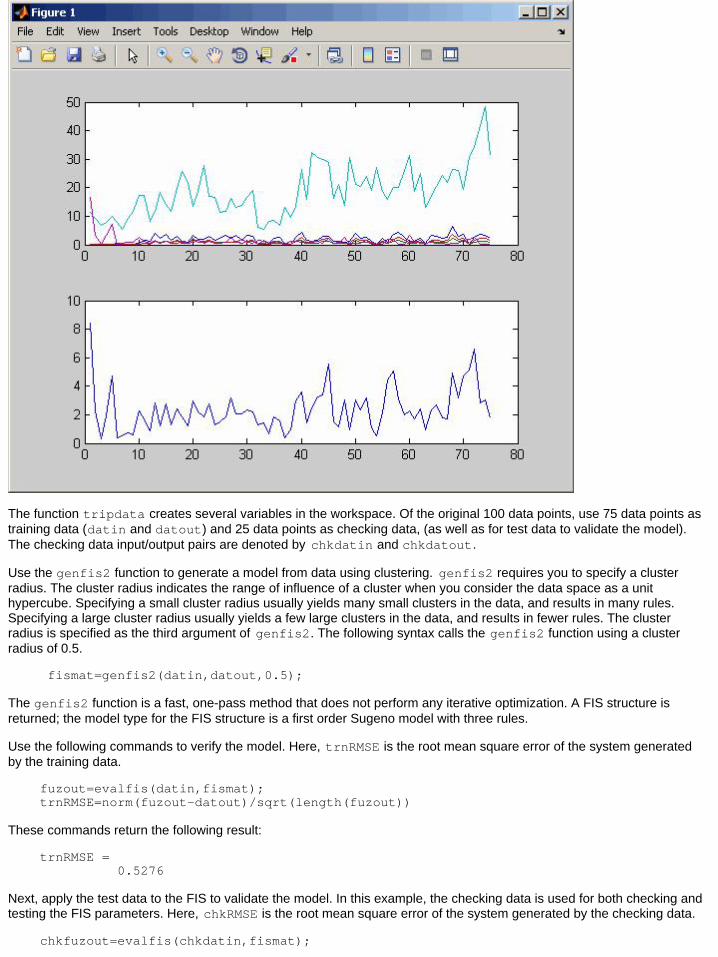
clearclose allmytripdatasubplot(2,1,1), plot(datin)subplot(2,1,2), plot(datout)
The next figure displays the input and the output data.
Fuzzy Clustering :: Tutorial (Fuzzy Logic Toolbox™) jar:file:///C:/Program%20Files/MATLAB/R2011a/help/toolbox/fuzzy/hel...
5 of 14 28/7/2558 12:32
The function tripdata creates several variables in the workspace. Of the original 100 data points, use 75 data points astraining data (datin and datout) and 25 data points as checking data, (as well as for test data to validate the model).The checking data input/output pairs are denoted by chkdatin and chkdatout.
Use the genfis2 function to generate a model from data using clustering. genfis2 requires you to specify a clusterradius. The cluster radius indicates the range of influence of a cluster when you consider the data space as a unithypercube. Specifying a small cluster radius usually yields many small clusters in the data, and results in many rules.Specifying a large cluster radius usually yields a few large clusters in the data, and results in fewer rules. The clusterradius is specified as the third argument of genfis2. The following syntax calls the genfis2 function using a clusterradius of 0.5.
fismat=genfis2(datin,datout,0.5);
The genfis2 function is a fast, one-pass method that does not perform any iterative optimization. A FIS structure isreturned; the model type for the FIS structure is a first order Sugeno model with three rules.
Use the following commands to verify the model. Here, trnRMSE is the root mean square error of the system generatedby the training data.
fuzout=evalfis(datin,fismat);trnRMSE=norm(fuzout-datout)/sqrt(length(fuzout))
These commands return the following result:
trnRMSE = 0.5276
Next, apply the test data to the FIS to validate the model. In this example, the checking data is used for both checking andtesting the FIS parameters. Here, chkRMSE is the root mean square error of the system generated by the checking data.
chkfuzout=evalfis(chkdatin,fismat);
Fuzzy Clustering :: Tutorial (Fuzzy Logic Toolbox™) jar:file:///C:/Program%20Files/MATLAB/R2011a/help/toolbox/fuzzy/hel...
6 of 14 28/7/2558 12:32
chkRMSE=norm(chkfuzout-chkdatout)/sqrt(length(chkfuzout))
These commands return the following result:
chkRMSE = 0.6179
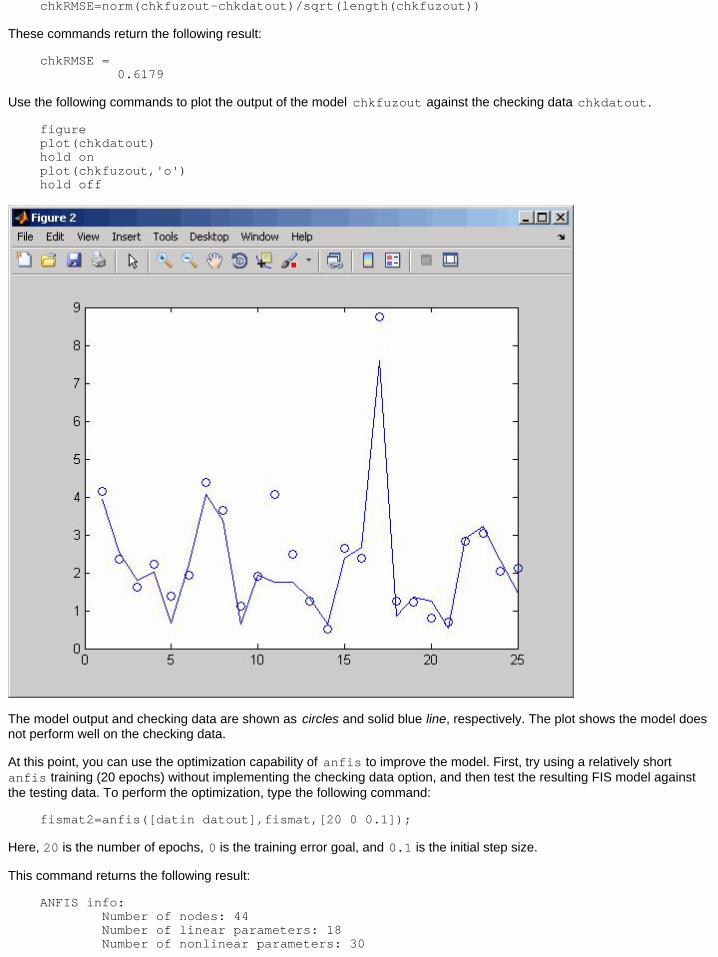
Use the following commands to plot the output of the model chkfuzout against the checking data chkdatout.
figureplot(chkdatout)hold onplot(chkfuzout,'o')hold off
The model output and checking data are shown as circles and solid blue line, respectively. The plot shows the model doesnot perform well on the checking data.
At this point, you can use the optimization capability of anfis to improve the model. First, try using a relatively shortanfis training (20 epochs) without implementing the checking data option, and then test the resulting FIS model againstthe testing data. To perform the optimization, type the following command:
fismat2=anfis([datin datout],fismat,[20 0 0.1]);
Here, 20 is the number of epochs, 0 is the training error goal, and 0.1 is the initial step size.
This command returns the following result:
ANFIS info: Number of nodes: 44 Number of linear parameters: 18 Number of nonlinear parameters: 30
Fuzzy Clustering :: Tutorial (Fuzzy Logic Toolbox™) jar:file:///C:/Program%20Files/MATLAB/R2011a/help/toolbox/fuzzy/hel...
7 of 14 28/7/2558 12:32
Total number of parameters: 48 Number of training data pairs: 75 Number of checking data pairs: 0 Number of fuzzy rules: 3
Start training ANFIS ...
1 0.527607.. 20 0.420275
Designated epoch number reached --> ANFIS training completed at epoch 20.
After the training is done, validate the model by typing the following commands:
fuzout2=evalfis(datin,fismat2);trnRMSE2=norm(fuzout2-datout)/sqrt(length(fuzout2))chkfuzout2=evalfis(chkdatin,fismat2);chkRMSE2=norm(chkfuzout2-chkdatout)/sqrt(length(chkfuzout2))
These commands return the following results:
trnRMSE2 = 0.4203chkRMSE2 = 0.5894
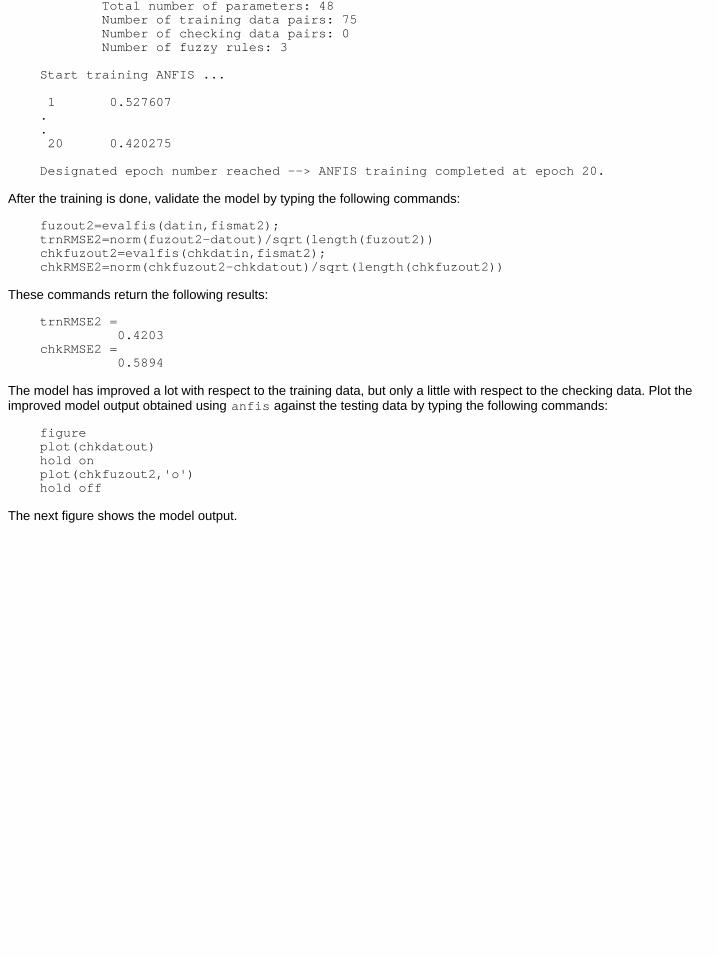
The model has improved a lot with respect to the training data, but only a little with respect to the checking data. Plot theimproved model output obtained using anfis against the testing data by typing the following commands:
figureplot(chkdatout)hold onplot(chkfuzout2,'o')hold off
The next figure shows the model output.
Fuzzy Clustering :: Tutorial (Fuzzy Logic Toolbox™) jar:file:///C:/Program%20Files/MATLAB/R2011a/help/toolbox/fuzzy/hel...
8 of 14 28/7/2558 12:32
The model output and checking data are shown as circles and solid blue line, respectively. This plot shows that genfis2can be used as a stand-alone, fast method for generating a fuzzy model from data, or as a preprocessor to anfis fordetermining the initial rules. An important advantage of using a clustering method to find rules is that the resultant rulesare more tailored to the input data than they are in a FIS generated without clustering. This reduces the problem of anexcessive propagation of rules when the input data has a high dimension.
OverfittingOverfitting can be detected when the checking error starts to increase while the training error continues to decrease.
To check the model for overfitting, use anfis with the checking data option to train the model for 200 epochs. Here,fismat3 is the FIS structure when the training error reaches a minimum. fismat4 is the snapshot FIS structure takenwhen the checking data error reaches a minimum.
[fismat3,trnErr,stepSize,fismat4,chkErr]= ... anfis([datin datout],fismat,[200 0 0.1],[], ... [chkdatin chkdatout]);
This command returns a list of output arguments. The output arguments show a history of the step sizes, the RMSE usingthe training data, and the RMSE using the checking data for each training epoch.
1 0.527607 0.617875 2 0.513727 0.615487 . . 200 0.326576 0.601531
Designated epoch number reached --> ANFIS training completed atepoch 200.
After the training completes, validate the model by typing the following commands:
Fuzzy Clustering :: Tutorial (Fuzzy Logic Toolbox™) jar:file:///C:/Program%20Files/MATLAB/R2011a/help/toolbox/fuzzy/hel...
9 of 14 28/7/2558 12:32
fuzout4=evalfis(datin,fismat4);trnRMSE4=norm(fuzout4-datout)/sqrt(length(fuzout4))chkfuzout4=evalfis(chkdatin,fismat4);chkRMSE4=norm(chkfuzout4-chkdatout)/sqrt(length(chkfuzout4))
These commands return the following results:
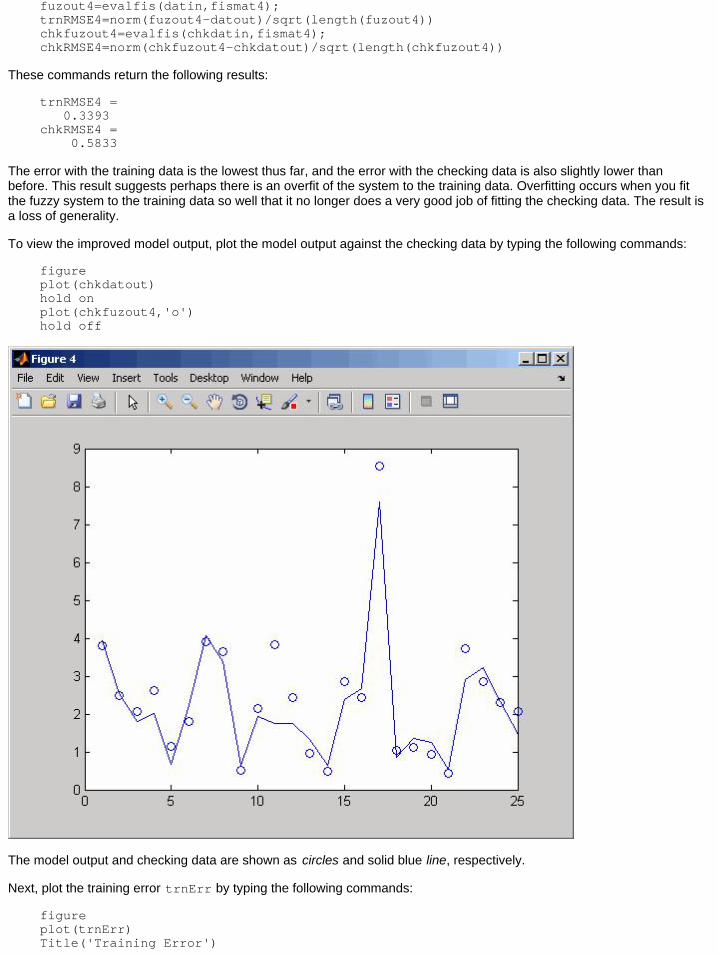
trnRMSE4 = 0.3393chkRMSE4 = 0.5833
The error with the training data is the lowest thus far, and the error with the checking data is also slightly lower thanbefore. This result suggests perhaps there is an overfit of the system to the training data. Overfitting occurs when you fitthe fuzzy system to the training data so well that it no longer does a very good job of fitting the checking data. The result isa loss of generality.
To view the improved model output, plot the model output against the checking data by typing the following commands:
figureplot(chkdatout)hold onplot(chkfuzout4,'o')hold off
The model output and checking data are shown as circles and solid blue line, respectively.
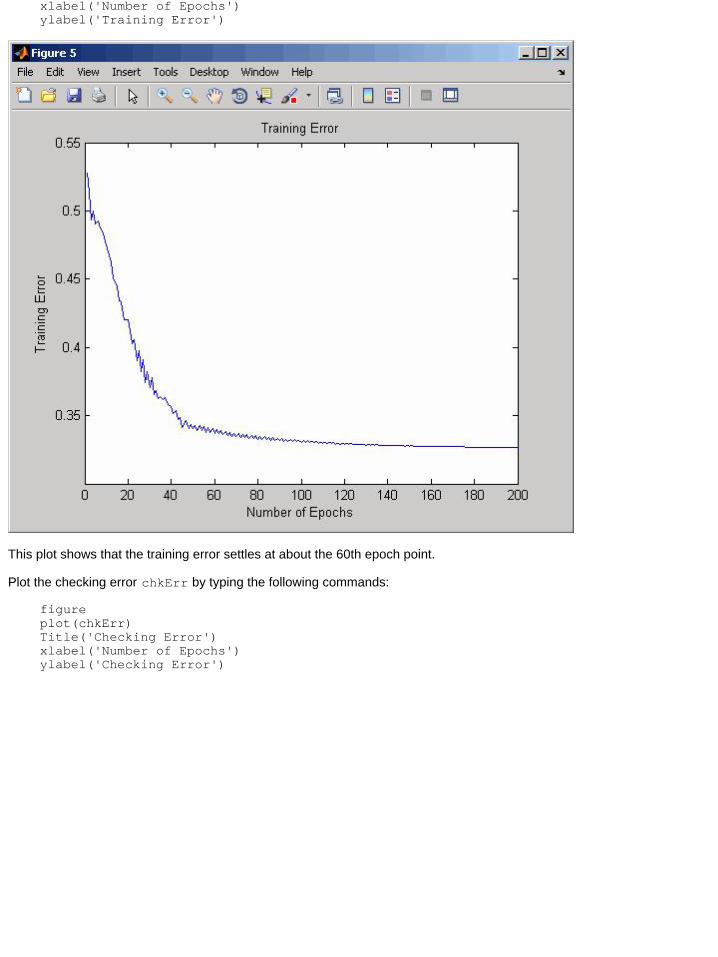
Next, plot the training error trnErr by typing the following commands:
figureplot(trnErr)Title('Training Error')
Fuzzy Clustering :: Tutorial (Fuzzy Logic Toolbox™) jar:file:///C:/Program%20Files/MATLAB/R2011a/help/toolbox/fuzzy/hel...
10 of 14 28/7/2558 12:32
xlabel('Number of Epochs')ylabel('Training Error')
This plot shows that the training error settles at about the 60th epoch point.
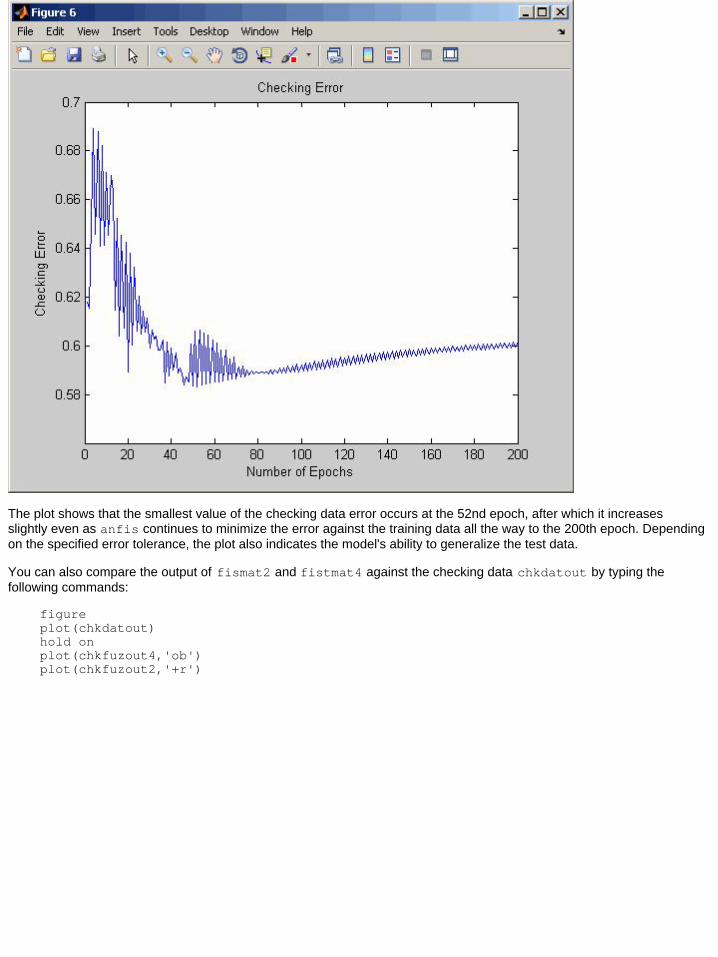
Plot the checking error chkErr by typing the following commands:
figureplot(chkErr)Title('Checking Error')xlabel('Number of Epochs')ylabel('Checking Error')
Fuzzy Clustering :: Tutorial (Fuzzy Logic Toolbox™) jar:file:///C:/Program%20Files/MATLAB/R2011a/help/toolbox/fuzzy/hel...
11 of 14 28/7/2558 12:32
The plot shows that the smallest value of the checking data error occurs at the 52nd epoch, after which it increasesslightly even as anfis continues to minimize the error against the training data all the way to the 200th epoch. Dependingon the specified error tolerance, the plot also indicates the model's ability to generalize the test data.
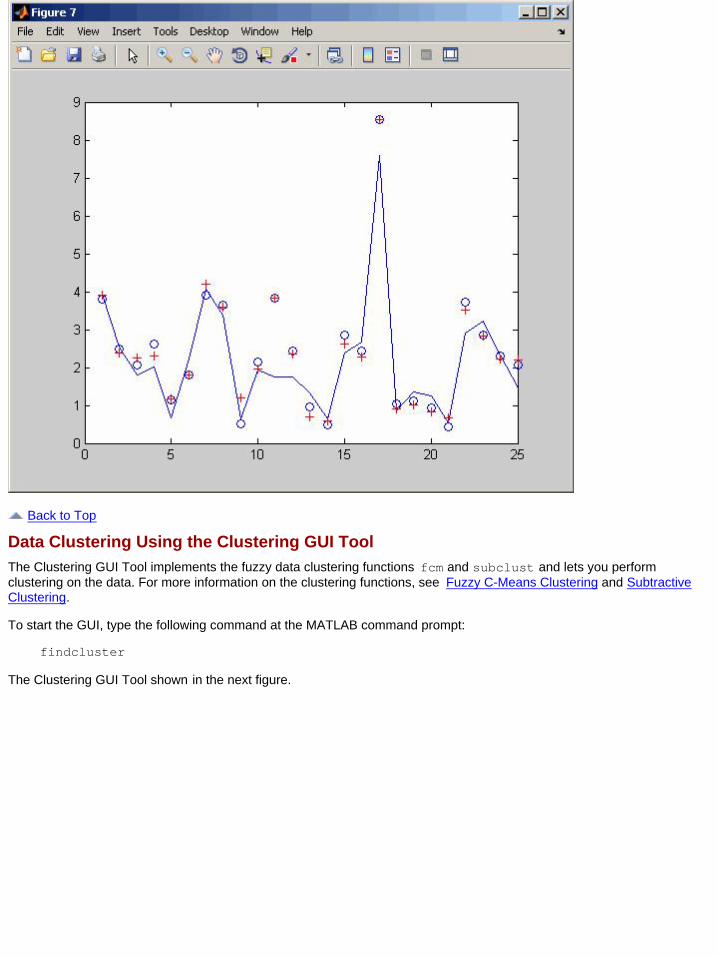
You can also compare the output of fismat2 and fistmat4 against the checking data chkdatout by typing thefollowing commands:
figureplot(chkdatout)hold onplot(chkfuzout4,'ob')plot(chkfuzout2,'+r')
Fuzzy Clustering :: Tutorial (Fuzzy Logic Toolbox™) jar:file:///C:/Program%20Files/MATLAB/R2011a/help/toolbox/fuzzy/hel...
12 of 14 28/7/2558 12:32
Back to Top
Data Clustering Using the Clustering GUI ToolThe Clustering GUI Tool implements the fuzzy data clustering functions fcm and subclust and lets you performclustering on the data. For more information on the clustering functions, see Fuzzy C-Means Clustering and SubtractiveClustering.
To start the GUI, type the following command at the MATLAB command prompt:
findcluster
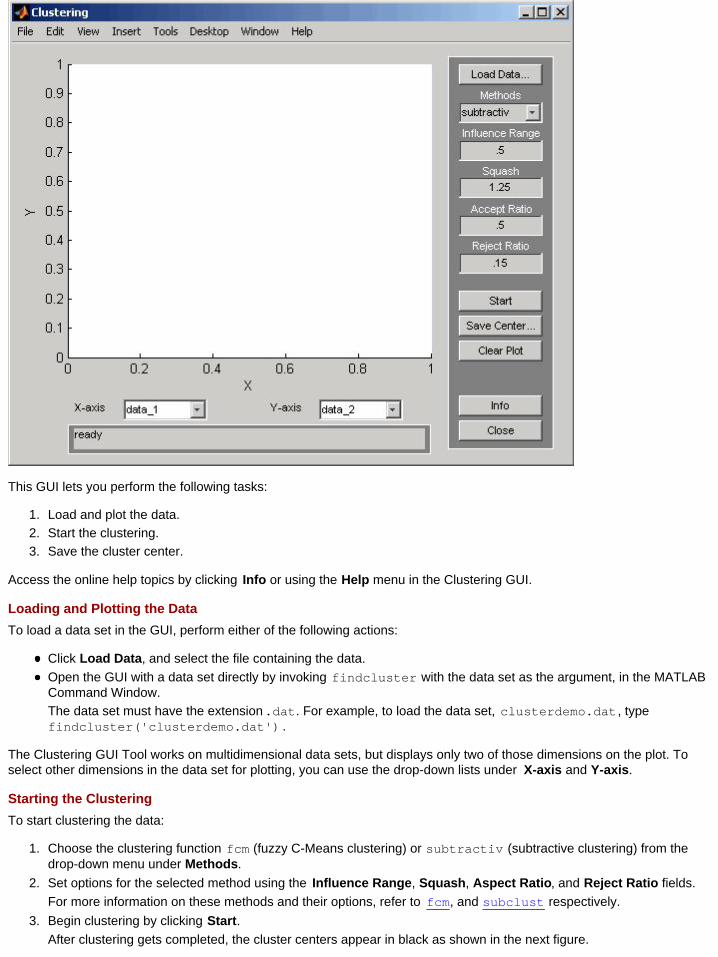
The Clustering GUI Tool shown in the next figure.
Fuzzy Clustering :: Tutorial (Fuzzy Logic Toolbox™) jar:file:///C:/Program%20Files/MATLAB/R2011a/help/toolbox/fuzzy/hel...
13 of 14 28/7/2558 12:32
This GUI lets you perform the following tasks:
Load and plot the data.1.Start the clustering.2.Save the cluster center.3.
Access the online help topics by clicking Info or using the Help menu in the Clustering GUI.
Loading and Plotting the DataTo load a data set in the GUI, perform either of the following actions:
Click Load Data, and select the file containing the data.Open the GUI with a data set directly by invoking findcluster with the data set as the argument, in the MATLABCommand Window.The data set must have the extension.dat. For example, to load the data set, clusterdemo.dat , typefindcluster('clusterdemo.dat') .
The Clustering GUI Tool works on multidimensional data sets, but displays only two of those dimensions on the plot. Toselect other dimensions in the data set for plotting, you can use the drop-down lists under X-axis and Y-axis.
Starting the ClusteringTo start clustering the data:
Choose the clustering function fcm (fuzzy C-Means clustering) or subtractiv (subtractive clustering) from thedrop-down menu under Methods.
1.
Set options for the selected method using the Influence Range, Squash, Aspect Ratio, and Reject Ratio fields.For more information on these methods and their options, refer to fcm, and subclust respectively.
2.
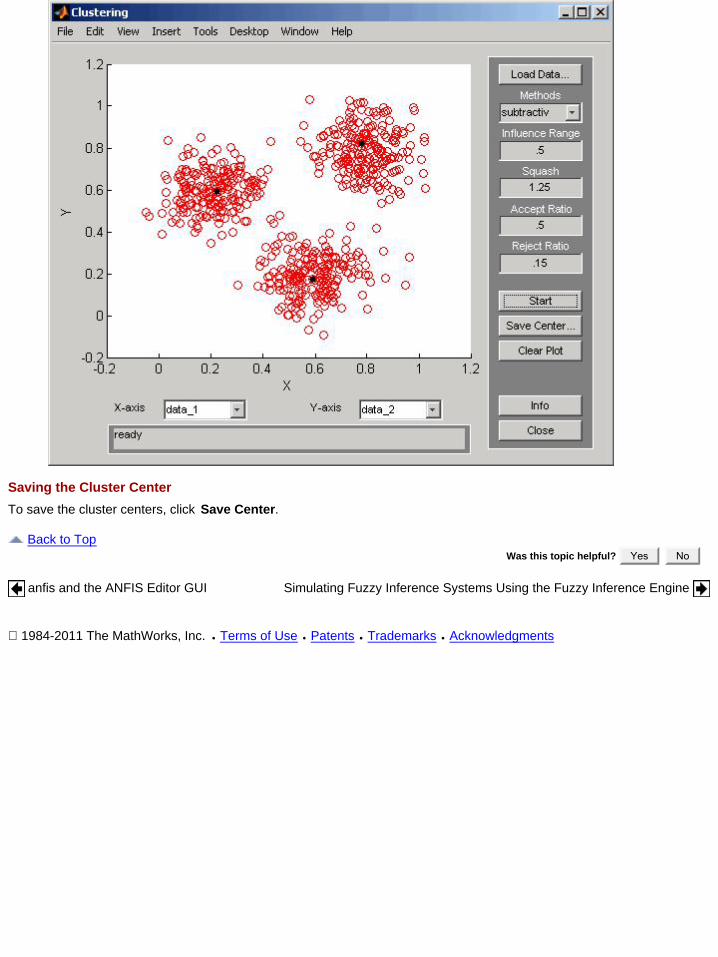
Begin clustering by clicking Start.After clustering gets completed, the cluster centers appear in black as shown in the next figure.
3.
Fuzzy Clustering :: Tutorial (Fuzzy Logic Toolbox™) jar:file:///C:/Program%20Files/MATLAB/R2011a/help/toolbox/fuzzy/hel...
14 of 14 28/7/2558 12:32
Saving the Cluster CenterTo save the cluster centers, click Save Center.
Back to TopWas this topic helpful? Yes No
anfis and the ANFIS Editor GUI Simulating Fuzzy Inference Systems Using the Fuzzy Inference Engine
ฉ 1984-2011 The MathWorks, Inc. • Terms of Use • Patents • Trademarks • Acknowledgments