Embed Size (px)
Citation preview

Luweero District State Of Environment Report 2004
1
1.0 INTRODUCTION
1.1 Location, size and administrative units
1.1.1 Location and Size
Luwero district lies North of Kampala, between latitude 20 North of the Equator and between 32
0 to 33
0
East. It is flanked by Mukono and Wakiso Districts in the South by Kiboga and Mubende Districts in the
West, Nakasongola and Masindi Districts in the North and Kayunga District in the East (fig. 1.1 & 1.2).
The total area of Luwero District is approximately 5572.2 km2 of which 5112.2 km
2 is dry land and the
rest is rivers and swamps.
1.1.2. Administrative Units
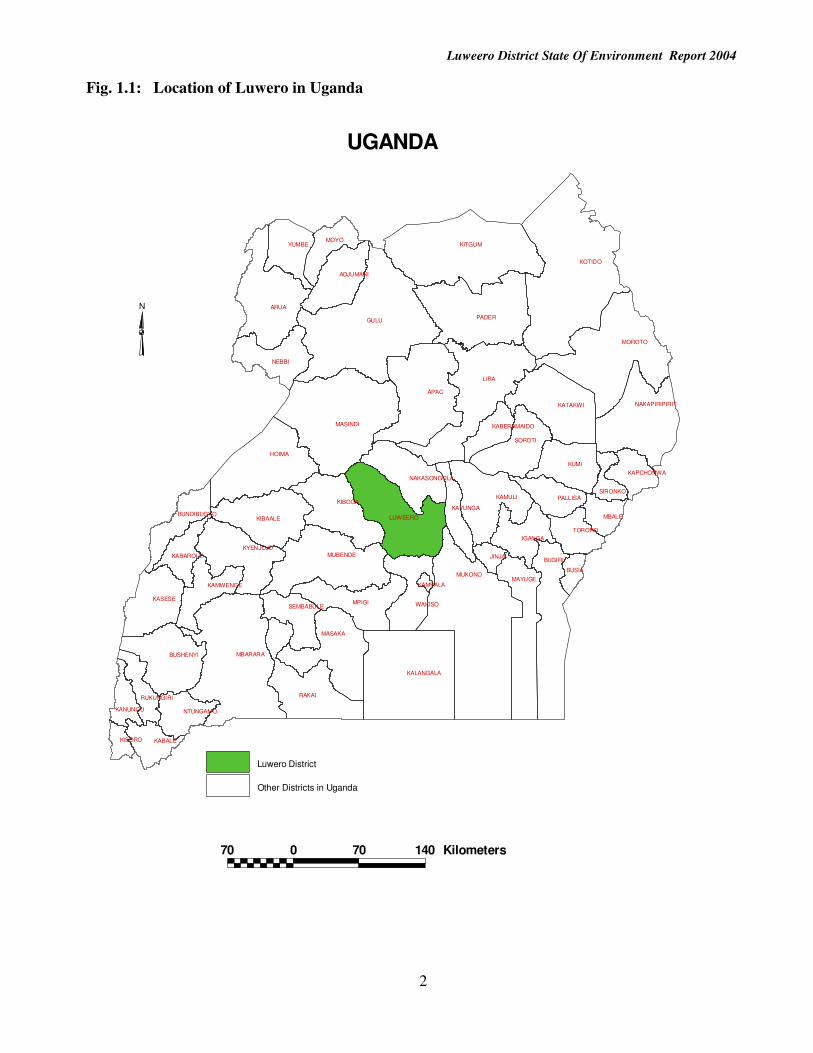
The district is divided into 3 counties, 17 sub-counties, 3 autonomous Town Councils, 136 parishes and
888 villages / LC Is (Figure 2). The Town Councils in the district are namely; Bombo, Luweero and
Wobulenzi, which is the most recently created. The district headquarters are in Luwero Town Council, a
road distance of about 64 km2 along the Kampala – Gulu highway.
1.2 Climate
It can be described as modified equatorial climate. The mean diurnal maximum temperatures range
between 180 and 35
0 while the corresponding minimum diurnal range is 8
0 and 25
0. The rainfall is well
distributed throughout the year, with the average annual rainfall being 1,300mm. The peak rain period is
March – May and October – November. The reliability of rainfall generally declines northwards. Dry
seasons occur from December – February and June – July.
1.3 Vegetation
Briefly the vegetation of Luwero may be classified in the following broad categories:
• Forest / Savanna mosaic This area is believed to have been covered by forests prior to the introduction of agriculture. It forms part
of the areas with an annual rainfall in excess of 1250mm situated in the southern zone of the district. It is
typically of mixed tree, thickets, shrubs and grassland formations.
• Moist Combretum woodland
It occurs in the central moist areas with rainfall between 1125 and 1250 mm per year. It is dominated by
Combretum and in the northern ecotonal zones and Terminalia woodland.
Luweero District State Of Environment Report 2004
2
Fig. 1.1: Location of Luwero in Uganda
GULU
KOTIDO
LIRA
MUKONO
KITGUM
APAC
MASINDI
MBARARA
PADER
ARUA
MOROTO
HOIMA
BUGIRI
RAKAI
KALANGALA
MPIGI
MUBENDE
KAMULI
KUMI
MASAKA
LUWEERO
KATAKWI
MAYUGE
KIBOGA
KIBAALE
NEBBI
SOROTI
KASESE
BUSHENYI
NAKAPIRIPIRIT
KYENJOJO
WAKISO
YUMBE
IGANGA
MOYO
ADJUMANI
PALLISA
NAKASONGOLA
KABALE
TORORO
KAMWENGE
MBALE
SEMBABULE
NTUNGAMO
KAYUNGA
KABAROLE
BUNDIBUGYO
RUKUNGIRI
JINJA
KAPCHORWA
KANUNGU
BUSIA
SIRONKO
KABERAMAIDO
KISORO
KAMPALA
70 0 70 140 Kilometers
N
UGANDA
Other Districts in Uganda
Luwero District
Luweero District State Of Environment Report 2004
3
Fig. 1.2: Luwero District boundaries and administrative units
NAKASEKE
KATIKAMU
BAMUNANIKA
NGOMA
WAKYATO KIKYUSABUTUNTUMULA
KAPEEKA
ZIROBWE
KIKAMULO
SEMUTO
LUWERO
NAKASEKE
KATIKAMU
NYIMBWA
BAMUNANIKA
KALAGALA
MAKULUBITA
LUWERO TOWN COUNCIL
BOMBO TOWN COUNCIL
WOBULENZI TOWN COUNCIL
KAMIRA
20 0 20 40 Kilometers
N
LUWEROAdministrative Boundaries
County Boundary
District Boundary
Parish Boundary
Subcounty Boundary
Murram Road (All weather)
Tarmac Road

Luweero District State Of Environment Report 2004
4
• Dry Combretum
This is a variant of the moist Combretum woodland occurring in the dry northern zone with less than
1125 mm of rainfall per year. This wooded savanna is, however, more open and the grass layer
continuous.
• Grass Savanna
This formation dominates the northern zone with about 1,000 mm of rainfall. Trees are generally absent.
• Seasonally flooded grass swamps
These occur extensively in all zones at the fringes of the permanent swamps, rivers in the north.
• Permanently flooded swamps
These occur mostly in zones fringing rivers Mayanja, Sezimbwa, Lugogo and Kafu. They are often
undifferentiated but are predominately covered with cyprerus papyrus and miscanthus violalaceous.
• Post cultivation vegetation
This occurs mostly in the southern cultivation zone. It occurs throughout the other zones. It is a type that
follows settlement and is closely associated with man and his activities.
1.4 Topography
The present topography is as a result of a number of ancient denudational processes on the rock systems
leaving a series of old erosion levels throughout the district. Hilly uplands dominate the south ancient
granitic rock out-rocks rise up in the north and wide interlocking valleys break up the low hills in the
central region and are seasonally flooded, bringing added diversity to the region.
1.5 Geology and Soils
1.5.1 Geology
The largest part of the district is underlain by metamorphic rocks of pre-Cambrian age. Roadwaski, 1960
and Omoding (1994) states that, the detailed stratigraphy of Luwero is very complex and the composition
of the rocks with in the same bed is not at all uniform. With few exceptions, however, most of the
geological formation consists of the basement complex systems as the oldest, overlain in places by a
succession of sedimentary strata which will have under gone a variable degree of metamorphosis. These
major geological formations are characterized by the presence of young intrusive rocks, mostly acidic
and less commonly basic. The youngest formation of Pleistocene is represented by the sands, quartz and
clays of alluvial or lacustrine origin.
The present landscape of Luwero in particular and Buganda in general is the result of a number of
ancient denudation processes which have left a series of old erosion levels throughout the region (NEAP,
1992). The account of the geomorphic history of Luwero which is also applicable to large parts of East,
Central and Southern Africa dates way back to the end of the Karoro era when, owing to a long period of

Luweero District State Of Environment Report 2004
5
quiescence, Buganda and other parts of Africa began to be reduced to a flood plain of sub-aerial erosion
with little or no relief (NEAP, 1992)
As a result of these changes, an elevated and dissected plateau consisting of a series of flat topped hills
and intervening valleys was formed by middle of the tertiary period.
1.5.2 Soils
The soils are generally red sandy loams in the north, and clay loams in the southern part of the district.
The clay loams are relatively fertile and can support all kinds of crops. In the northern areas, some parts
developed from sandy loam soils and fertility is low.
1.6 Population Size and Growth
According to the Population Census provisional results (2002), Luwero district has a total of 474,627
people of whom 234,916 are males and 239,711 females. The mean house hold size is 4.4 whereas the
sex ratio is 98.0 having fallen from 99.2 in 1991 and 102.5 in the 1980 censuses. The 2002 Census
reveled that the district has 106,050 households. The population living in households is 470,269 while
that living in Institutions is 4,358. The rural population is 419,349 constituting 88.3% of the total
population. The urban population is 55,278 constituting 11.7% of the total population. The distribution
in the different Sub counties is shown in table 1.1 below.
Table 1.1: Population by Sub County County Sub county Males Females Total
Bamunanika Bamunanika 12,264 12,582 24,846
Kalagala 15,733 16,058 31,791
Kamira 10,457 10,000 20,457
Kikyusa 11,523 11,625 23,148
Zirobwe 17,388 17,848 35,236
Katikamu Bombo T/C 5,933 6,382 12,315
Butuntumula 14,775 15,119 29,894
Katikamu 16,941 17,144 34,085
Luwero S/C 14,416 14,516 28,932
Luwero T/C 11,013 12,855 23,558
Makulubita 12,640 13,724 25,495
Nyimbwa 13,730 10,367 27,454
Wobulenzi T/C 9,038 11,719 19,405
Nakaseke Kapeeka 12,349 11,719 24,068
Kasangombe 9,224 9,551 18,775
Kikamulo 10,871 11,427 22,298
Nakaseke 9,710 10,235 19,945
Ngoma 8,488 8,059 16,547
Semuto 12,509 12,577 25,086
Wakyato 5,914 5,378 11,292
Total 234,916 239,711 474,627
Luwero DDP (2004-2007)

Luweero District State Of Environment Report 2004
6
In 1991 Luwero population constituted 2.09 of the total population of the Country and in 2002 the
proportion fell to 1.92. The population density rose from 66 in 1991 to 90 in 2002 whereas the growth
rate between 1980-1991 was 0.28 and rose to 2.63 between 1991-2002
Social economic characteristics
The main economic activity of Luwero District is agriculture. The majority of the people depend on
substance farming in the southern part of the district while the northern part is inhabited by semi-
nomadic pastolists.
1.7 Economic growth and development
1.7.1 Introduction
Following the civil strife that took place between 1980-1985 that resulted in the liberation of Uganda
from dictatorial leadership, much of the environment had been misused and degraded in this infamous
Luwero Triangle. During that straggle there was political turmoil that caused gross loss of life,
destruction of infrastructure and amenities, loss of hope, massive migration of parts of the population
and ‘massive poverty’. This scenario contributed to the general decline in economic growth and
performance in the area.
However, since the advent of the NRM leadership from 1986, there have been tremendous recovery
efforts to restore economic growth in the area through a number of government programmes as well as
by the civil society organization (CBOs and NGOs). Sustainable development in Luwero has been
achieved through in four aspects namely: physical (human made like machines infrastructure) capital,
natural capital (like soils, forests, water, wetlands), human capital (like investments in education, health,
nutrition of individuals) and social capital (institutional and cultural basis for the society to function).
Physical capital
Since 1986, the district has been able to register tremendous cumulative growth and development in
infrastructures like rural and feeder roads, health centres, school facilities and water sources. The district
is connected to the national power grid which is available in most parts of the district.
The communication network is availed by MTN, Celtel and Mango.
Natural capital
The natural capital offers the main support to the people of Luwero who are mainly engaged in
agricultural and livestock production. There are fertile soils supporting crops in the southern parts of the
district while the northern and north western parts support the livestock farming in the ‘cattle corridor’.
The main crops produced include coffee, bananas, rice, pineapples and other agricultural crops.
There are both private and government forest resources which supply various products i.e. timber for
furniture and construction, firewood and other forest products and services.
In the dry savannah areas, charcoal burning remains a big activity supporting the poor communities in
those areas.
Luweero District State Of Environment Report 2004
7
Human Capital
The district has a total population of 477,204. The population growth rate is 3.5. The family size is about
5 people per family. The urban centres have a higher population concentration than rural areas. There is
both skilled and unskilled labour force. The district has a strong and vibrant political leadership. There
are 106,050 households, 888 villages, 136 parishes and 19 sub-counties and 3 Town Councils. The
District Council has 37 members.
Financial Capital
The district has 52,000 graduated tax payers and has been generating revenue from local sources as
follows: shs 588m in 2003/2004 and shs 357m in 2004/2005 financial years. It has been receiving
Government grants and donor support worth 17.9b, 11.1b in 2003/04 and 2004/05 financial years
respectively. There are two banks and five micro finance institutions. There are numerous small and
medium size businesses covering retail, whole sale, food processing, hotels and lodges building
construction, carpentry, fuel service stations, repair and maintenance of machines (motorcycles, vehicles,
farm implements).
Social capital
There are a number of religious and cultural institutions. The Baganda are the dominant tribe. There are
about thirty registered NGOs and CBOs offering a wide range of services to the people. The district is
run along decentralization framework stretching from LCI to LCV. The centre devolved many roles,
functions and services to the lower local governments.
1.7.2 Environment and development
Environment provides the natural resources for the process of development. Development process
modifies the natural resources and environmental quality to human needs. The goal of both development
and environment is to improve human well being. However, the type of development adopted can cause
problems that destroy the environment that sustains it and lowers the quality of life which it endeavors to
enhance. The development problems include pressure on land and exhaustion of natural resources, urban
congestion, socio-cultural changes and pollution. Development effects include devegatation, soil erosion,
diseases, unemployment and under employment, natural resources degradation.
Under development environmental issues include inappropriate production methods arising from lack of
material resources and poor skills. These cause resource destruction by over using and mis-use resulting
in problems like overgrazing, deforestation and soil erosion. Inadequate provision of infrastructure and
social services e.g. water supply, roads, waste disposal services results in environmental diseases like
malaria, intestinal worms infections, typhoid. Under development is perpetuated by poverty.
1.7.3 Environment and economic opportunity
Environmental conditions contribute to people’s economic opportunities in many ways, especially in
rural areas because poor people tend to be highly dependant on natural resources for their livelihood.
Environment economic opportunities fit very well with the concept of sustainable livelihood. A
livelihood is sustainable when it can cope with and recover from stresses and shocks and maintain or
enhance its capabilities and assets presently and in future without undermining the natural resource base.

Luweero District State Of Environment Report 2004
8
1.7.4 Poverty and environment
According to MFPED (2000), poverty has many dimensions including low and highly variable levels of
income and consumption, physical insecurity, poor health, low levels of education, disempowerment, and
isolation (both social and geographical).
Poverty has been termed the worst enemy of environmental because it gives rise to poor lifestyles in
terms of production, consumption and living conditions. Poor life styles cause environmental degradation
in terms of depletion of resources which eventually reduce production and perpetuate poverty hence the
poverty cycle. For example poor agricultural yields due to degraded soils means that households must
obtain an alternative source of livelihood to make up for the shortfall. In case there are virtually no
alternative income generating opportunities, people resort to activities like charcoal production hence
reduced tree cover.
A poor person will be least concerned with environmental quality. The foremost concern is to provide
members of family with daily substance of whatever quality. There is a need to address poverty among
communities in order to solve environmental degradation.

Luweero District State Of Environment Report 2004
9
2.0 The State of Environment
2.1 Land use
The Land use pattern in the district is shown below:
Arable land and settlements 4,834.8 km2
(86.8%)
Forests: 277.44 km2 (5%)
Rivers & wetlands 460 km2 (8.3%)
2.1.1 Crop production
Crop production dominates the district’s agricultural activities. About 70% of farm holdings are engaged
in crop production as a major activity. The major crops grown are shown in table 2.1.1.
Table 2.1.1: Crop production trends
Year 1998 1999 2000
S/N Crops Area
(Ha)
Yield
(tons
/Ha)
Prod.
(Tons/
Ha)
Area
(Ha)
Yield
(Ton
s/
Ha)
Prod.
(Tons/
Ha)
Area
(Ha)
Yield
(Ton
s/
Ha)
Prod.
(Tons /
Ha)
1 Bananas 12,669 4.7 59,544.3 14,750 4.7 69,325 16,250 4.7 76,375
2 Finger Millet 3,016 2.0 6,032.0 3116 2.0 6232 3166 2.0 632
3 Maize 16,238 2.1 34,099.8 17,049 2.1 35,802.9 17,901 2.1 37,592.1
4 Sorghum 3,140 1.8 5,652 3440 1.8 6192 3540 1.8 6372
6 Sweet
Potatoes
27,534 8.5 234,039 30,534 8.5 259,539 32,650 8.5 277,525
7 Irish Potatoes 3,246 7.6 24,669.6 3550 7.6 26,980 3650 7.6 27,740
8 Cassava 10,025 11.25 112,781.3 1,030 11.25 146,587.5 15050 11.25 169,312.5
9 Beans 1,569 1.6 21,710.4 14,658 1.6 23,452.8 15,150 1.6 24,240
10 Ground Nuts 1,128 1.1 1240.8 1,280 1.1 1408 1310 1.1 1441
11 Soya beans 2,026 11.1 2228.6 12,050 1.1 2365 2250 1.1 2475
12 Simsim 232 0.7 162.4 330 0.7 231 340 0.7 238
13 Coffee 18,682 4.75 88,739.5 19,182 4.75 91,114.5 19,685 4.75 93,503.75
14 Tomatoes 800 2.5 2000 900 2.5 2250 950 2.5 2375
15 Cabbages 570 2.7 1539 670 2.7 1809 770 2.7 2079
16 Pineapples 3500 14.3 50,050 3700 14.3 52,910 4200 14.3 60,060
Agriculture Department (2004)
Other food crops are
� Upland rice
� Field pears, cow peas
� Sunflower
� Yams
� Sugar canes
� Vegetables (Onions, Greens, Spices, Eggplants, Okra, French beans)
� Fruits (Mangoes, Avocado)
Luweero District State Of Environment Report 2004
10
Other traditional Cash crops are
� Cocoa, vanilla
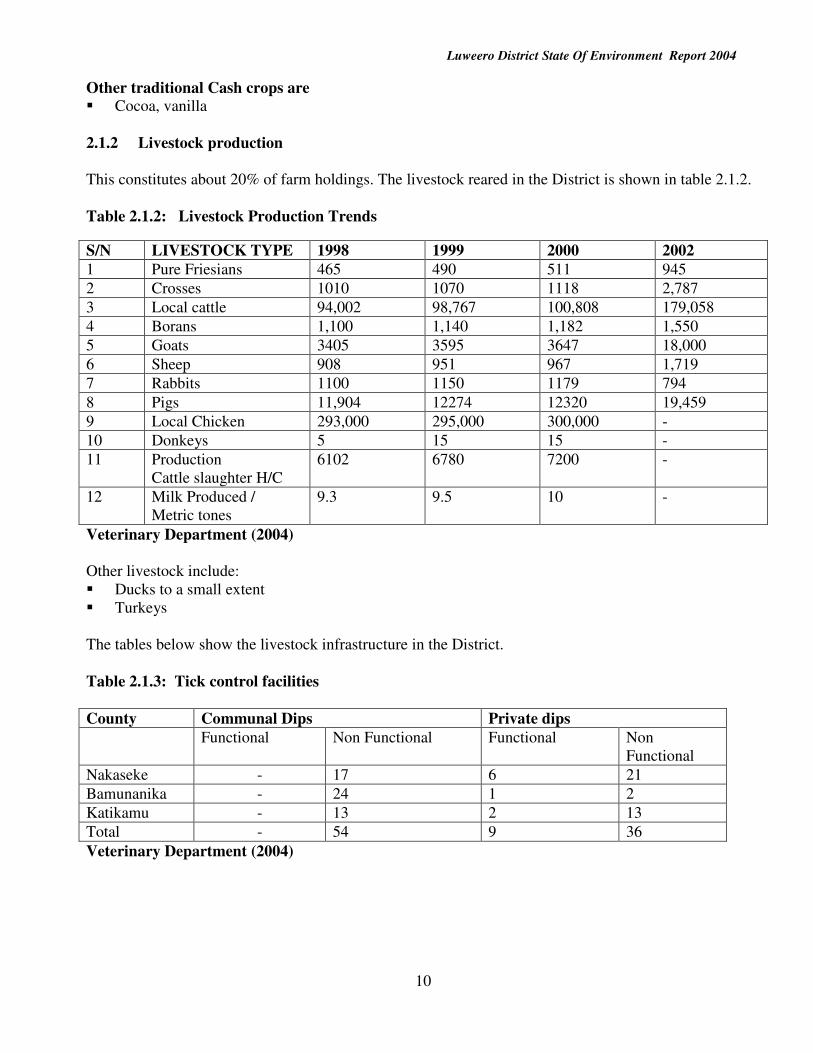
2.1.2 Livestock production
This constitutes about 20% of farm holdings. The livestock reared in the District is shown in table 2.1.2.
Table 2.1.2: Livestock Production Trends
S/N LIVESTOCK TYPE 1998 1999 2000 2002
1 Pure Friesians 465 490 511 945
2 Crosses 1010 1070 1118 2,787
3 Local cattle 94,002 98,767 100,808 179,058
4 Borans 1,100 1,140 1,182 1,550
5 Goats 3405 3595 3647 18,000
6 Sheep 908 951 967 1,719
7 Rabbits 1100 1150 1179 794
8 Pigs 11,904 12274 12320 19,459
9 Local Chicken 293,000 295,000 300,000 -
10 Donkeys 5 15 15 -
11 Production
Cattle slaughter H/C
6102 6780 7200 -
12 Milk Produced /
Metric tones
9.3 9.5 10 -
Veterinary Department (2004)
Other livestock include:
� Ducks to a small extent
� Turkeys
The tables below show the livestock infrastructure in the District.
Table 2.1.3: Tick control facilities
County Communal Dips Private dips
Functional Non Functional Functional Non
Functional
Nakaseke - 17 6 21
Bamunanika - 24 1 2
Katikamu - 13 2 13
Total - 54 9 36
Veterinary Department (2004)

Luweero District State Of Environment Report 2004
11
Table 2.1.4: Diary fenced farms (2002)
County No. of farms Pure exotic Crosses T/H/C
Nakaseke 15 113 515 643
Bamunanika 18 95 523 636
Katikamu 64 294 1151 1509
Total 97 502 2189 2788
Veterinary Department (2002)
Table2.1.5: Zero grazing units
County Units Exotic Crosses
Nakaseke 85 45 65
Katikamu 675 313 455
Bamunanika 56 16 56
Total 816 374 576
Veterinary Department (2002)
Table 2.1.6: Institutional Farms
Farm Exotic Crosses Total
Bugema Adventist
College
44 26 70
Bukalasa Agric. College 12 36 46
Katikamu SDA 3 14 17
New Hope 3 8 11
Kiwoko Hospital - 8 -
Total 62 92 154
Veterinary Department (2002)
Table 2.1.7: Cattle Ranches
County Ranches Crosses Local T.H / C
Nakaseke 15 1,138 21,213 32,593
Katikamu 7 349 5,517 5,866
Bamunanika 6 563 3,209 8,839
Total 28 2,045 29,937 31,982
Veterinary Department (2002)
Slaughters
Table 2.1.8: Urban slaughters
Towns Cattle Goats Sheep Pigs
Wobulenzi 840 120 24 136
Luweero 494 202 12 216
Bombo 150 26 24 -
Total 1484 490 60 354
Veterinary Department (2002)

Luweero District State Of Environment Report 2004
12
Table 2.1.9: Village Slaughters
County Cattle Goats Sheep Pigs
Nakaseke 1,074 138 24 354
Bamunanika 612 150 30 336
Katikamu 540 72 18 42
Total 2,227 357 72 732
Veterinary Department: Meat Inspection (2002)
Table 2.1.10: Live stock markets
Market Operation date
Ngoma Every Tuesday of the week
First Monday of every month
Kamira Last Friday of every month
Naluvule (Kapeeka) Second and last Thursday of every month
Nabisojjo
Kalagala
Kabubbu
Kinyogoga
Veterinary Department (2002)
Livestock issues
• Weeds
• Termites
• Long dry spells
• Over grazing
• Bush burning
• Low awareness among the cattle keepers
• Drugs are very expensive
• Lack of vaccines e.g. for Foot and Mouth Disease (FMD), CBPP
• Poor marketing systems – no weighing of animals
• Diseases
� Tick Born Diseases (TBD)
� Worms
� Tryps
� FMD
� CBPP
� TB
� Brucella
♦ Pests (ticks and tsetse flies)
2.1.3 Fish farming
It constitutes about 0.01% of farm holdings.

Luweero District State Of Environment Report 2004
13
Fish species reared are:
Clarias (cat fish)
Mimor caup (Kisinja).
Fish species existing in natural water bodies (minor lake & rivers)
Oreochiromis Niloticus
Clarias
Protopterus (Mamba)
Table 2.1.11: Fish production trends
S/N Item 1998 1999 2000 2001
1 Farmers 40 61 78 81
2 Fish ponds 48 78 104 112
3 Stocked Dams 36 61 88 102
Fisheries Department (2004) Table 2.1.12: Existing fish ponds and their status in Luweero District No. Sub county Fish
ponds Stocked Un-
stocked Species
1. Nakaseke 26 20 6 Tilapia 2. Kikamulo 18 11 7 Tilapia 3. Bamunanika 16 6 10 Tilapia 4. Zirobwe 13 2 11 Clarias 5. Makulubita 23 10 13 Tilapia 6. Nyimbwa 16 9 7 Tilapia 7. Bombo T/C 6 2 4 Tilapia 8. Luweero T/C 4 2 2 Tilapia 9. Wobulenzi T/C 8 3 5 Tilapia 10. Kamira 3 Nil 3 Nil 11. Kapeeka 6 1 5 Tilapia 12. Kalagala 10 5 5 Tilapia 13. Wakyato 2 Nil 2 Nil 14. Kikyusa 1 Nil 1 Nil 15. Butuntumula 4 Nil 4 - 16 Kasangombe 4 2 2 Tilapia 17. Semuto 7 Nil 7 - 18. Luweero 6 4 2 Tilapia 19. Katikamu 8 2 6 Tilapia 20. Nyimbwa 14 9 5 Tilapia TOTAL 195 88 107 Source: Fisheries Department (2004.)
2.1.4 Apiary production
It constitutes about 0.02%
Types (races) of bees found in the district
� Apis melifera (small blackish)
� Apis cerana (bigger in size & brownish, long hair on the body.
� Black African bees (very active, not good for keeping).

Luweero District State Of Environment Report 2004
14
Table 2.1.13: Apiary production trends
S/N ITEM 1998 1999 2000 2001
1 KTB Hives 235 540 940 600
2 Local Hives 8000 13000 18000 20400
3 Longs troth 45 120 160 240
4 Honey Production
(Kg)
23000 25000 29000 75000
5 Bees wax (Kg) 500 560 600 1000
Entomology Department (2004)
Table 2.1.14: Silculture
S/N Item 1998 1999 2000 2001
1 Farmers 6 6 8 10
2 Silk produced (Kg) 1000 1020 1058 1080
3 Estimated farm gate
price of silk
produced shs/Kg
2400 2400 2400 2400
Entomology Department (2004)
2.1.5 Land degradation
Land degradation is the physical, chemical or biological impairment of the attributes of land. It is a
serious problem in the district.
Causes of land degradation
� Poor methods of cultivation
� Continuous / over cultivation
� Lack of water and soil conservation measures
� Inadequate application of organic matter
� Deforestation especially in Sub Counties of Semuto, Kapeeka, Ngoma, Kinyogoga, Kamira and
Zirobwe (fig. 2.1.1 and 2.1.2).
The figure below shows deforestation for farm improvement and charcoal burning in Kinyogoga
Sub-county. This eventually results into soil erosion and siltation of water bodies.

Luweero District State Of Environment Report 2004
15
Fig. 2.1.1: Deforestation in Kinyogoga Sub-county Fig. 2.1.2: Charcoal Burning in Kinyogoga
Sub- County
Source: Environment Department (2004)
� Overgrazing in Ngoma, Kinyogoga, Kamira, Wakyato sub-counties.
� Inappropriate range management
Overstocking is being practiced and it leads to over grazing. Cattle keeping areas are characterized
by pasture and water scarcity, which in turn is part of the reason for migration during dry season
� Nomadism and culture
Communal grazing is being practiced, depending entirely on natural pasture and keep as many
animals as they are capable of handling often out of step with the carrying capacity of the area.
� Bush burning
Bush burning is practiced as a custom, culture or social habit. The fires are rampant before 2002 but
the rates are reducing due to scarcity of communal grazing areas and pasture. The fires are normally
applied to encourage new growth for pasture and control ticks. Some times the fires are set by
hunters to ease the capture of wild animals. If fires are not done properly they encourage the
emergence of fire tolerant species which may not be suitable for pasture.
� Agrochemicals
Pesticides are spayed on animals regularly. They may be washed into water bodies. They also affect
the bees and therefore honey production.
� Soil erosion
This is experienced through out the district. It has been particularly caused by extensive clearance of
vegetation cover, uncontrolled bush burning, over grazing and cultivation of fragile areas (e.g.
wetlands). The mentioned activities weaken the soil structure and expose the soil surface to erosion
processes (Fig. 2.1.3).

Luweero District State Of Environment Report 2004
16
Fig. 2.1.3: Soil erosion in Kinyogoga Sub-county
Source: Environment Department (2004)
� Ignorance which leads to inappropriate utilization of land resources, wasteful and injurious
consequences.
� Poverty which adversely affects the ability and willingness of the land users to practice
conservation. Poverty reduces the horizon of land uses and discourages long term planning or
investment in land conservation.
� Agro chemicals
Its contribution is minimal as few farmers (about 10%) are utilizing agro-chemicals. The chemicals
basically used are: UREA, DAP, NPK, and CAN fertilizers, insecticides / pesticides, fungicides and
acaricides.
Effects of land degradation
� Poor or low agricultural production
� Food insecurity
� Low income generation capacity
� Loss or destruction of natural resources e.g. forests, wet lands or swamps.
� Increased poverty
� Malnutrition and weak population
2.1.6 Land tenure
Land tenure refers to the manner in which land is owned, occupied, used and disposed of in a
community. It simply means ownership. The management and control of land is one factor that can
minimize land degradation and hence increase the productivity of land.
The 1995 Constitution of the Republic of Uganda ushered in new land tenure systems and created land
rights. This was to make sure that people occupying the land have security of tenure over it and thus
precipitate development in the long run.

Luweero District State Of Environment Report 2004
17
Article 237 of the Constitution provides that land in Uganda belongs to the citizens of Uganda and shall
rest in them in accordance with the land tenure system provided for in the constitution.
It provides further that the Government or a Local Government may, subject to article 26 of the
Constitution, acquire land in the public interest, and the conditions governing such land shall be as
prescribed by parliament.
The Government or Local Government as determined by parliament by law, shall hold in trust the forest
reserves, game reserves, National parks and any land to be reserved for ecological and tourist purposes
for the common good of all citizens.
The Land Act 1998 has several provisions to protect the environment. In particular, Section 44 requires
the person who owns or occupies any piece of land in Uganda to manage and utilize it in accordance with
the National Environment Statute 1995 and other environment-related sectoral laws. Section 45, which
provides for the control of environmentally sensitive areas, further strengthens this position. Further
more, the Act has provisions for the decentralized management of land through the establishment of
District Land Boards. Among others, the District Land Boards are empowered to hold and allocate land
in the District, which is not owned, by any person or authority. Together with decentralized
environmental management, Section 45 ensures that environmental issues can or should be handled at the
local level.
Land tenure systems in the District
Customary tenure
Is a traditional method of owning, occupying and using land regulated by the customary land law of any
given community or a specific area. The land may be owned either by the community, clan, king, chief
families or individuals.
Free-hold tenure
This is where a person owns registered land for ever or for a short period as may by fixed as long as she
observes the law governing it. The owner can lease out, sell, borrow money using a freehold title, pass
on the land by will, and sub-divide the land to create rights for other people.
Mailo
This is where a person owns registered land forever, under a land system where land was formerly given
to the Baganda chiefs in and out side Buganda by the 1900 agreement. The owner can lease out, sell,
borrow money using a mailo title, pass on the land by will or sub-divide the land to create different
interests.
However, the customary and legal rights of the lawful and bonafide occupants of the mailo land and their
successors in title must at the same time be recognized on the land. The ownership of mailo land allows
the separation of ownership of the land from the ownership of the things made or put on it by a lawful or
bonafide occupant.
Leasehold tenure
This is where the occupying and use of land is based on an agreement with the owner of the land at
payment of a premium. The owner of the land allows that person to occupy and use the land for a

Luweero District State Of Environment Report 2004
18
specified period of time, usually five years, forty nine years or ninety nine years in return for regular rent
payments. The grant may also be made in return for services or it may be free.
The person who occupies and leases the land can give that land as security for a debt or sub-let it to
another person.
Lawful and bonafide occupants.
Lawful and bonafide occupants are new concepts introduced in our land law language by the Land Act,
1998.
Lawful occupant refers to a person occupying land by virtue of the repealed Busuulu and Envujjo law of
1928 ( in case of Buganda ) or
A person who entered the land with the consent of the registered land owner including a purchaser.
A person who had occupied land as a customary at time of acquiring the lease. Bonafide occupants
refers to a person who before the coming into force of the 1995 Constitution; had occupied and utilized
the land without challenge by the registered owner (or agent) for twelve years or more.
Had been settled on the land by government argent of the government which may include a Local
authority.
The lawful and bonafide occupants in their land ownership capacity are referred to as tenants by
occupancy.
The District Land Board and Land Tribunal are in place.

Luweero District State Of Environment Report 2004
19
2.2 Forests and woodlands
2.2.1. Introduction
A forest is a type of vegetation dominated by trees, many species of which are tall at maturity and have
straight trunks. The canopy is typically deep, being composed of several layers of foliage and the
herbaceous vegetation is generally open and lacks the tussock-forming grasses which are so
characteristic of many types of savanna. For woodlands trees are characteristically shorter than in the
forests and canopy is less dense.
The District has eleven gazetted forest reserves with a total area of 27,739 hectare seven of these reserves
are central forest reserves under the management of the National Forest Authority and the remaining four
are Local Forest reserves controlled by the District. The central forest reserves or savanna wood lands
with the dominant tree species being combretum, terminalia, Acacias and piliostigma in wetlands. Cattle
grazers have heavily encroached on the central forest reserves leading to overgrazing. The combretum
and terminalia species have attracted charcoal burners in central forest reserves.
The Local forest reserves were initially planted with eucalyptus. The trees were harvested and no
replanting has been done. These reserves are encroached on by cultivators. In Semuto and Makulubita
Sub-counties there are swamp and tropical high forests on private land. The acreage is difficult to
quantify. These forests are now being cleared to grow upland rice and are in danger of being entirely
destroyed. On farmland in other parts of the District the common tree species are Albizia Coriaria which
is however being over harvested because it produces good timber for furniture. The Muvule (Milicia
excelsa) has been over harvested and is more difficult to come by.
2.2.2. Forest Area by category
The forest reserves and their area in the District are shown in table 2.2.1 below.
Table 2.2.1: Forest reserves by area and category
Name of Reserve Area
Ha
Natural
(Savanna
Wood land)
(Pine) Plantation (Broad
leaved)
1 Kabwika
Mujwalanganda
8,285
- -
2 Kapimpini 6,202 √ - -
3 Kamusenene 6,197 √ - -
4 Kagogo 689 √ √ -
5 Wankweyo 4,946 √ - -
6 Mbale 1,207 √ √ -
7 Wangu 31 - - √
8 Bbowa 10 - - √
9 Bbombo 65 - - √
10 Kalagala 16 - - √
11 Nabika 91 - - √
Total 27,739 6 2 5
Forestry Department (2004)

Luweero District State Of Environment Report 2004
20
2.2.3. Ownership, distribution and management
Most of the central forest reserves are located in Ngoma and Wakyato Sub Counties. The table 2.2.2 and
figure 2.2.1 show the distribution of the various forest reserves: -
Table 2.2.2: Forest reserves ownership and distribution
Ownership Name of Forest
reserve
Acreage
(Ha) Central Forest
Reserve
Local Forest
Reserve
Location
(Sub-county)
Kabwika
Mujwalanganda
8285 √ Kinyogoga
Kampipini 6202 √ Wakyato /
Ngoma
Kamusenene 6197 √ Ngoma
Kagogo 689 √ Wakyato
Wankweyo 4946 √ Wakyato
Mbale 1207 √ Butntuntumula
Wangu 31 √ Butntuntumula
Bombo 65 √ Nyimbira
Bbowa 10 √ Makulubita
Kalagala 16 √ Kalagala
Nabika 91 √ Nakaseke
Forestry Department (2004)
Private Plantations
A few farmers have set up private plantations of mainly Eucalyptus trees. Unfortunately this tree is
being attacked by disease whose treatment has not yet been discovered. The table 2.2.3 indicates the
farmers who have so far established tree plantations in the District.
Table 2.2.3: Tree farmers in the District
Name Species Acreage (ha) planted Sub county
Rev. Mulindwa W Eucalyptus 15
Ssegujja Eucalyptus 5 Nyimbwa
Dr. Tonda Eucalyptus 3 Makulubita
Mulindwa Pine 5 Katikamu
Ssenjala Envir.
Protection Eucalyptus 5 Zirobwe
Ssetanda Eucalyptus 5 Kikyusa
Bwaba Musisi 5 Kikyusa
Kasirye I Eucalyptus 4 Katikamu
New hope Eucalyptus 3 Nyimbwa
Sempa Eucalyptus 3 Katikamu
Ssebabi Eucalyptus/Pine 2 Kikyusa
Edirisa 2 Makulubita
Forestry Department (2004)

Luweero District State Of Environment Report 2004
21
Fig. 2.2.1 Distribution of the forest reserves in Luwero District
Kamusenene
WankweyoKapimpini Mbale
Kabwika-Mujwalanganda
Kagogo
Nabika
Bombo
Wangu
Bowa
Kalagala (Busakwa)
10 0 10 20 30 Kilometers
N
LUWERO
District BoundaryForest Reserves
Gazzeted Areas

Luweero District State Of Environment Report 2004
22
Management
The National Forestry Authority
The National Forestry Authority is responsible for the sustainable management of Uganda’s state- owned
central Forest reserves. The Authority provides forestry support services to local Governments and the
private sectors.
The District Forestry Services
The District Forestry Services directs management of Local Forest Reserves by the District and advisory
support to assist with the management of trees on farm, forests on customary land and privately owned
natural forests and woodlands.
The role of Local Governments in Forestry Management
The Uganda Constitution 1995 (Article 237), The Land Act (1998), and the Forest Reserves
(Declaration) Order (1988) empower Local Governments to hold in trust for the people and to protect
forest reserves.
The National Forest Plan 2002 emphasizes the roles and responsibilities of the Local Governments and
these include among others: collecting and retaining tax revenue accruing from forestry activities on
private lands and Local forest reserves, mobilizing funds for forestry management, developing and
enforcing bye-laws, creating and managing Community Forest Reserves, watershed management,
support and ensuring quality control of forestry extension services, brokering between farmers and
service providers and providing market information.
2.2.4 Utilization
The main forest products from the District are charcoal, timber, firewood and palms for fencing.
Charcoal is mainly got from the combretum and terminalia species common in the central forest
reserves. The main species producing timber are albizia and maesopsis. Most of these products are
consumed in Kampala.
2.2.5 Opportunities
The private sector
Private sector plays a big role in forestry development. There are a number of private tree farmers and
nursery operators in the district. Land is also available in central forest reserves for private developers to
plant trees. Luwero being near Kampala, there is ready market for forest products and this is an
incentive to attract private developers.
The following investors have acquired land in forest reserves for tree planting. These include:
� Nanga Farm – Mbale 100 ha pine
� Nankabirwa – kagogo – 20 ha

Luweero District State Of Environment Report 2004
23
District forestry services
The forests and tree planting Act 2003 established District forest services. This effectively decentralized
forestry and as such the District can plan for forestry development. This can be done with support from
other lead agencies such as NEMA, FORI, NFA and UWA.
Agroforestry
Agroforestry is a collective name for land use systems and technologies in which woody perennials are
deliberately used on the same land management units as agricultural crops, animal or combination of the
two in some form of spatial arrangement or temporal sequence. The agroforestry systems being practiced
include:
• Agropastoral
• Silvopastoral
• Agrosilvopastoral
• Entomo-forestry
• Buffer zone agroforestry systems
2.2.6 Threats
The main threat to the forest estate in the District is encroachment both by cattle grazers and cultivators.
Encroachers have invaded all the central and local forest reserves. Unless these encroachers are evicted
the forest estate will be completely degraded.
The introduction of upland rice is also leading to rapid deforestation. The current land tenure system also
discourages Bibanja owners from planting long term trees since they are not allowed to own-them.

Luweero District State Of Environment Report 2004
24
2.3 Water Resources
The major water sources in the district include:
• Surface water (rivers, streams and wetlands)
Major rivers in the district include Kafu, Sezibwa, Lugogo, Lwajali, Mayanja, and Danze
• Ground water (boreholes, protected and un protected springs, swallow well)
• Piped water in Town Councils
2.3.1 Water supply
Water supply situation is as shown in the table 2.3.1 and figure 2.3.1 below. The average safe water
supply is 57%. Luweero Town Council, Kikamulo sub-county and Semuto sub- county have safe water
coverage of more than 90%. The following sub-counties and Town Council has safe water coverage
below 50%:
• Bombo Town Council
• Butuntumula Sub-county
• Kapeeka Sub-county
• Ngoma Sub-county
• Kalagala Sub-county
• Kamira Su-county
• Zirobwe Sub-county

Luweero District State Of Environment Report 2004
25
Table 2.3.1: Luwero District Local Government situation analysis for water supply as of June 30, 2004.
Based on updates of the GIS survey data carried out in March 2000.
County Popul. SITUATION ANALYSIS AS AT June 30, 2004 Popul.
Subcounty 2003 Spgs DBH Working MSW HDW HAW RWJ RWT Pop. Coverage 2004
DBH Served (%) - 2004
207624 12 351 297 0 229 0 0 0 125,250 212815
Bombo TC 14892 2 19 17 8 6,600 44 15264
Butuntumula 34230 38 26 40 13,800 40 35086
Katikamu 44774 1 53 52 47 22,800 51 45893
Luweero 33103 58 53 47 22,950 69 33931
Luweero TC 15665 55 50 4 15,600 100 16057
Makulubita 28788 1 39 28 55 16,800 58 29508
Nyimbwa 28571 5 69 53 27 20,700 72 29285
Wobulenzi TC 7601 3 20 18 1 6,000 79 7791
142305 0 191 171 0 260 7 0 16 91,350 145863
Kapeeka 24080 17 12 40 9,600 40 24682
Kasangombe 22553 11 11 64 12,900 57 23117
Kikamulo 23706 58 55 46 23,400 99 24299
Nakaseke 21146 31 29 34 13,800 65 21675
Ngoma 9654 7 6 3 10 3,750 39 9895
Kinyogoga 3550 9 5 0 5 2,250 63 3639
Semuto 20898 33 31 60 7 19,350 93 21420
Wakyato 16718 25 22 13 1 8,550 51 17136
152354 0 195 179 0 92 0 0 0 67,500 156163
Bamunanika 27274 47 43 17 15,450 57 27956
Kalagala 36802 35 32 41 15,750 43 37722
Kamira 22908 26 21 4 6,900 30 23481
Kikyusa 26439 41 40 12 13,800 52 27100
Zirobwe 38931 46 43 18 15,600 40 39904
TOTAL 502283 12 737 647 0 581 7 0 16 284,100 57 514840
Population served per source: Spg-150, DBH-300, (MSW,HDW,HAW)-150
NB: Wobulenzi TC, Bombo TC and Luweero TC have piped water systems.
KEY: Spgs=springs, DBH=Deep Boreholes, MSW=Motorised shallow wells
HDW= Hand dug wells,RWJ= Rainwater jars,RWT=Rainwater tanks,GFS= Gravity flow schemes

Luweero District State Of Environment Report 2004
26
Fig. 2.3.1: Luwero District Situation analysis for water supply
Situation Analysis For Water Supply As At June 30, 2004
0
20
40
60
80
100
120
Bom
bo T
C
Butu
ntu
mula
Katikam
u
Luw
eero
Luw
eero
TC
Makulu
bita
Nyim
bw
a
Wobule
nzi T
C
Kapeeka
Kasangom
be
Kik
am
ulo
Nakaseke
Ngom
a
Kin
yogoga
Sem
uto
Wakyato
Bam
unanik
a
Kala
gala
Kam
ira
Kik
yusa
Zirobw
e
Sub County
%ag
e C
overa
ge
Situation Analysis

Luweero District State Of Environment Report 2004
27
2.3.2 Water for production
Water for production is mainly used for live stock consumption. The table 2.4.2 shows the
newly constructed valley tanks in the District.
Table 2.3.2: New Valley tanks constructed under the programme of water for production No. Sub county Location Volume
(lts) trapezoidal dimension
1. Kamira Kabunyata 10,000,000 Top length 97.5m, width 32.5m, with bottom length 77.5m, width 12.5m and depth 5m.
2. Kikyusa Masinga " " 3. Ngoma Katuugo " " 4. Ngoma Kyabigulu " " 5. Kapeeka Kivumu " " 6. Kikyusa Katabona " "
7. Kikamulo Katangira " " 8. Wakyato Kiswaga " " 9. Butuntumula Kyamuyinula " " Veterinary Department (2004)
2.3.3 Water uses
The water is used as follows:
• Domestic – human consumption
• Agriculture (water for production)
• Industrial – limited use in the district
2.3.4 Water quality
The water quality parameters are shown in the table 2.3.3 below. The PH for water sources
ranged from 5.61 – 7.32 which range falls in water quality standards for drinking water. On
average turbidity was less than 5 and water was odourless, clear and safe for drinking. The yields
were also good. In unique cases where E. Coli are more than 60, it is recommended that water is
boiled before it is drunk.

Luweero District State Of Environment Report 2004
28
Table 2.3.3: Water quality results as at 16/5/2003
No. Village/ Location Parish Sub-County Season Yield PH Turbi
dity E Coli/
100mls
Colour Odour Comments
1 Lukyamu P/S Lukyamu Kalagala Wet Good 6.85 10 0 Milky Clayey smell Water safe for drinking
2 Lunyolya Lunyolya Kalagala Wet Good 6.32 <5 0 Clear Odourless Water safe for drinking
3 Busoke Busoke Kalagala Wet Good 5.61 70 1 Milky Clayey smell Water safe for drinking
4 Busika Town (Top Care Nursery)
Busika Kalagala Dry Good 6.93 <5 0 Clear Odourless Water safe for drinking
5 Kyoga Kayindu Kalagala Wet Good 6.60 <5 0 Clear Odourless Water safe for drinking
6 Mpangati Bukimi Zirobwe Wet Good 6.98 <5 3 Clear Odourless Water safe for drinking
7 Kyasampawo Kalanamu Kalagala Wet Good 7.24 <5 0 Clear Odourless Water safe for drinking
8 Kityokelo Nakaseeta Kasangombe Not yet done
9 Buyengwa Nakaseeta Kasangombe Dry Good 6.50 <5 0 Clear Odourless Water safe for drinking
10 Mpwedde Mpwedde Kasangombe Wet Good 6.40 <5 0 Clear Odourless Water safe for drinking
11 Sakabusolo Sakabusolo Kasangombe Dry Good 6.70 <5 4 Slightly Milky
Clayey Smell
Water safe for drinking
12 Lukyamu Lukyamu Kasangombe Wet Good 6.35 <5 0 Clear Odourless Water safe for drinking
13 Namasujju Lukyamu Kasangombe Wet Good 6.51 < 5 0 Clear Odourless Water safe for drinking
14 Lukumbi Segalye Semuto Dry Good 6.52 <5 0 Clear Odourless Water safe for drinking
15 Kimera Kimera Semuto Not yet done
16 Kyogga Baptist Kikyusa Semuto Not yet done
17 Bukatira Segalye Semuto Dry Good 6.22 <5 7 Slightly Milky
Odourless Water safe for drinking
18 Namusale Namusale Kapeeka Dry Good 6.69 <5 1 Slightly Milky
Odourless Water safe for drinking
19 Bangi Namusale Kapeeka Wet Good 6.00 <5 0 Clear Odourless Not yet done

Luweero District State Of Environment Report 2004
29
20 Kibose Kibose Kikamulo Not yet done
21 Butiikwa Magoma Kikamulo Dry Good 6.18 <5 1 Clear Odourless Water safe for drinking
22 Kiwoko Central 1
Kiwoko Town Kikamulo Dry Good 6.70 < 5 0 Clear Odourless Water safe for drinking
23 Namirali Mifunya Nakaseke Wet Good 5.98 150 more than 100
Orange-Brown
Clayey Smell
Water unsafe for drinking
24 Luvunvu Mifunya Nakaseke Wet Good 6.60 60 42 Brownish
Clayey Smell
Water safe for drinking
25 Butayunja Mifunya Nakaseke Dry Good 6.55 < 5 15 Slightly Milky
Clayey Smell
Water safe for drinking
26 Kalagala Kyamutakasa Nakaseke Wet Good 5.78 < 5 0 Clear Odourless Water safe for drinking
27 Tebalyala Kigombe Luweero Wet Good 6.41 < 5 0 Slightly Milky
Clayey Smell
Water safe for drinking
28 Ndagga Katuugo Luweero Not yet done
29 Kiwumpa A Kigombe Luweero Dry Good 6.04 <5 54 Milky clayey smell Water safe for drinking
30 Buwongo Kagugo Luweero Wet Good 6.27 <5 0 clear Odourless Water safe for drinking
31 Nsaasi Bweyeyo Luweero Dry Good 6.04 <5 0 clear Odourless Water safe for drinking
32 Kibisi Busula Katikamu Wet Good 6.31 <5 2 clear Odourless Water safe for drinking
33 Butanza A Kyalugondo Katikamu Wet Good 6.20 10 0 Milky Clayey smell Water safe for drinking
34 Kyalugondo Kyalugondo Katikamu Wet Good 6.47 <5 0 clear Odourless Water safe for drinking
35 Bukusu Ngogolo Butuntumula Not yet done
36 Ndeeba Bukambaga Butuntumula Not yet done
37 Buyegwe Nakaseeta Kasangombe Not yet done
38 Nakaseeta Nakaseeta Kasangombe Wet Good 6.48 <5 0 clear Clayey smell Water safe for drinking
39 Kibale Namusale Kapeeka Wet Good 6.52 8 0 clear Odourless Water safe for drinking
40 Kitawelwa A Mifunya Nakaseke Wet Good 6.40 <5 0 Clear Odourless Water safe for drinking

Luweero District State Of Environment Report 2004
30
41 Kitawelwa B Mifunya Nakaseke Wet Good 6.30 <5 0 Clear Odourless Water safe for drinking
42 Vvumba Vvumba Kalagala Dry Good 6.77 140 0 Milky Clayey smell Water safe for drinking
43 Kiwumpa B Kigombe Luweero Dry Good 6.25 <5 0 Clear Odourless Water safe for drinking
44 Kabuye Umea Kabakedi Luweero Dry Good 5.75 <5 0 Milky Clayey smell Water safe for drinking
45 Butanza B Kyalugondo Katikamu Dry Good 6.27 <5 0 Clear Odourless Water safe for drinking
46 Bweyeyo Bweyeyo Luweero Dry Good 6.18 <5 15 Clear Odourless Water safe for drinking
47 Bulema Bukambaga Butuntumula Dry Good 6.45 <5 6 Clear Odourless Water safe for drinking
48 Bulemezi Busika Kalagala Dry Good 6.77 140 0 Slightly Milky
Clayey smell Water safe for drinking
49 Mulungi Omu Katuugo Luweero Not yet done
50 Kibula Kabakedi Luweero Not yet done
51 Sakabusolo Kagugo Luweero Not yet done
52 Kigombe Kigombe Luweero Not yet done
53 Kibanvu Kigombe Luweero Wet Good 6.2 <5 0 Clear Clayey smell Water safe for drinking
54 Kitto Kikoma Katikamu Not yet done
55 Lukomera Migadde Katikamu Dry Good 6.17 <5 0 clear Odourless Water safe for drinking
56 Kazinga Bukeeka Katikamu Not yet done
57 Bukalasa Kikoma Katikamu Not yet done
58 Kikoza Kyalugondo Katikamu Not yet done
59 Kalembwe Migadde Katikamu Wet Good 5.88 <5 0 clear Odourless Water safe for drinking
61 Kikuumango Nakaseeta Kasangombe Wet Good 6.02 <5 1 Clear Odourless Water safe for drinking
62 Kiwemba Kigege Nakaseke Wet Good 6.45 <5 0 Clear Odourless Water safe for drinking
63 Lugo-Nakkazi Kamuli Kikamulo Wet Good 6.06 <5 0 Clear Odourless Water safe for drinking

Luweero District State Of Environment Report 2004
31
64 Kiwoko Central 2
Kasana Kikamulo Wet Good 6.01 <5 0 Clear Odourless Water safe for drinking
65 Kiwoko Kasana Kasana Kikamulo Wet Good 6.11 17 0 slightly Milky
Odourless Water safe for drinking
66 Namaliga South Namaliga Bombo T/C Wet Good 5.92 <5 1 Clear Odourless Water safe for drinking
67 Busiika Kawerimidde
Busiika Kalagala Dry Good 9.39 70 0 slightly Milky
clayey smell Water safe for drinking
68 Katikamu Proper Wobulenzi Wobulenzi T/C
Dry Good 6.76 <5 1 slightly Milky
clayey smell Water safe for drinking
69 Namaliga East Namaliga Bombo T/C Dry Good 6.18 <5 0 Clear Odourless Water safe for drinking
70 Nsaasi UMEA Bweyeyo Luweero Dry Good 6.04 <5 0 Clear Odourless Water safe for drinking
71 Bulinde Kyalugondo Katikamu Dry Good 7.03 <5 17 Clear clayey smell Water safe for drinking
72 Kitwalanye Makulubita Makulubita
Not yet done
73 Bukooba Makulubita Makulubita
Not yet done
74 Nakikonge Makulubita Makulubita
Not yet done
75 Lubugo Makulubita Makulubita
Not yet done
76 Bwetyaba Makulubita Makulubita Wet Good 7.32 148 0 Milky clayey smell Water safe for drinking
77 Busiika Coffee Factory
Busiika Kalagala Dry Good 6.70 52 68
slightly Milky
clayey smell To be boiled before drinking
78 Butiikwa Magoma Kikamulo Dry Good 6.18 <5 1 Clear clayey smell Water safe for drinking
80 Lwankuba A Busiika Kalagala Wet Good 6.41 <5 1
Clear Odourless Water safe for drinking
81 Busakwa Kayindu Kalagala Wet Good 6.42 <5 0 Clear Odourless Water safe for drinking
82 Wabikokoma Busiika Kalagala Wet Good 6.08 <5 0 Clear Odourless Water safe for drinking
83 Wobulenzi College
Kikoma Wobulenzi T/C
Wet Good 6.97 <5 0 Clear clayey smell Water safe for drinking
84 Mpande Kalule Nyimbwa Wet Good 6.62 <5 0 Clear clayey smell Water safe for drinking
85 Nakafumu Busiika Kalagala Wet Fair 6.33 7 0 Clear Odourless Water safe for drinking
Water Department (2004)

Luweero District State Of Environment Report 2004
32
2.4 Wetland Resources
2.4.1 Introduction
Wetland is a vegetation area of land that is flooded permanently or seasonally and stays wet long
enough for certain pants and animals to grow even when there has been no rain. (SOER – 1998).
• Wetland coverage is approximately 7% of the district area.
• Types (riverine), Wetlands – Permanent and seasonal wetlands
• Swamp forests – Semuto, Makulubita – dominated by trees and other woody vegetation.
2.4.2 Wetlands types in Luwero
A. Fresh water emergent reed swamps typically dominated by a single reed species.
• Papyrus Swamp
• Riverine and associated flood plains swamp with rooted papyrus
• Phragmites swamps
• Typha swamps
B. Fresh water surface floating vegetation communities dominated by:
• Eichhornia ssps
• Pistia
C. Seasonally flooded herbaceous wetlands
• Echinochloa
• Cyperus
• Loudetia
D. Seasonally flooded wooded grassland (Northern parts of the District)
• Acacia – e.g. R. Kafu
E. Fresh water riverine forests dominated by
• Acacia, Ficus, Combretum
• Phoenix
• Alchornea
The wetlands cover about 7% of the district area.
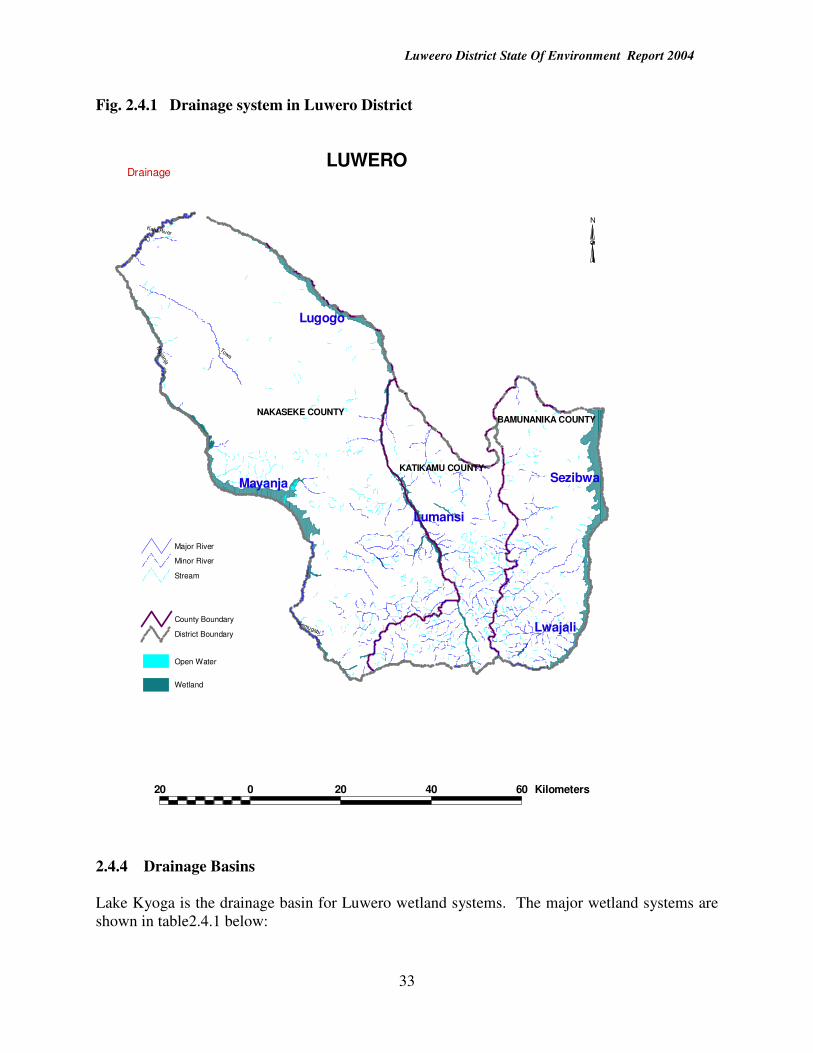
2.4.3 Distribution
Wetlands are distributed throughout the District (fig. 2.4.1). The Northern part of the district is
dominated by seasonally flooded wooded grassland. The Southern part is dominated by seasonal
wetlands characterized by palms and thickets. Permanent swamp forests are found in Semuto
sub-county. Permanent papyrus swamps marks the boundaries of the district.
Luweero District State Of Environment Report 2004
33
Fig. 2.4.1 Drainage system in Luwero District
NAKASEKE COUNTY
KATIKAMU COUNTY
BAMUNANIKA COUNTY
Towa
Maya
nja
Semugabi
Kafu River
Mayanja Sezibwa
Lugogo
Lwajali
Lumansi
20 0 20 40 60 Kilometers
N
LUWERO
Open Water
Wetland
County Boundary
District Boundary
Major River
Minor River
Stream
Drainage
2.4.4 Drainage Basins
Lake Kyoga is the drainage basin for Luwero wetland systems. The major wetland systems are
shown in table2.4.1 below:
Luweero District State Of Environment Report 2004
34
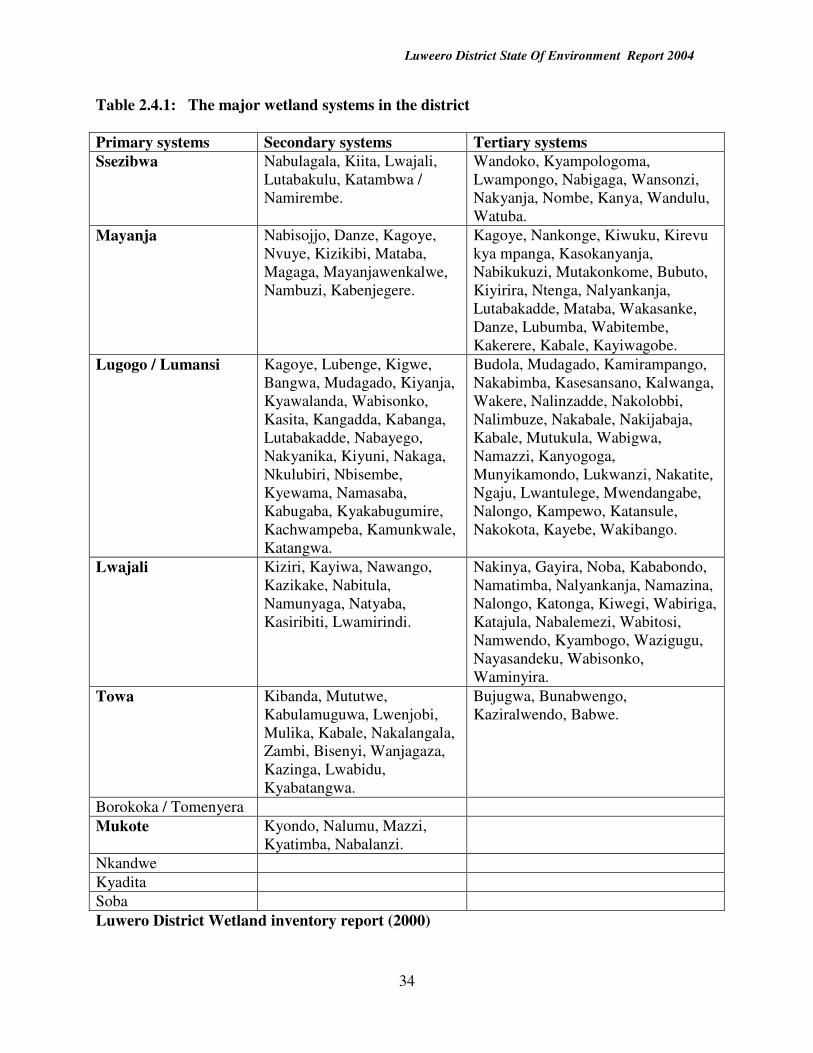
Table 2.4.1: The major wetland systems in the district
Primary systems Secondary systems Tertiary systems
Ssezibwa Nabulagala, Kiita, Lwajali,
Lutabakulu, Katambwa /
Namirembe.
Wandoko, Kyampologoma,
Lwampongo, Nabigaga, Wansonzi,
Nakyanja, Nombe, Kanya, Wandulu,
Watuba.
Mayanja Nabisojjo, Danze, Kagoye,
Nvuye, Kizikibi, Mataba,
Magaga, Mayanjawenkalwe,
Nambuzi, Kabenjegere.
Kagoye, Nankonge, Kiwuku, Kirevu
kya mpanga, Kasokanyanja,
Nabikukuzi, Mutakonkome, Bubuto,
Kiyirira, Ntenga, Nalyankanja,
Lutabakadde, Mataba, Wakasanke,
Danze, Lubumba, Wabitembe,
Kakerere, Kabale, Kayiwagobe.
Lugogo / Lumansi Kagoye, Lubenge, Kigwe,
Bangwa, Mudagado, Kiyanja,
Kyawalanda, Wabisonko,
Kasita, Kangadda, Kabanga,
Lutabakadde, Nabayego,
Nakyanika, Kiyuni, Nakaga,
Nkulubiri, Nbisembe,
Kyewama, Namasaba,
Kabugaba, Kyakabugumire,
Kachwampeba, Kamunkwale,
Katangwa.
Budola, Mudagado, Kamirampango,
Nakabimba, Kasesansano, Kalwanga,
Wakere, Nalinzadde, Nakolobbi,
Nalimbuze, Nakabale, Nakijabaja,
Kabale, Mutukula, Wabigwa,
Namazzi, Kanyogoga,
Munyikamondo, Lukwanzi, Nakatite,
Ngaju, Lwantulege, Mwendangabe,
Nalongo, Kampewo, Katansule,
Nakokota, Kayebe, Wakibango.
Lwajali Kiziri, Kayiwa, Nawango,
Kazikake, Nabitula,
Namunyaga, Natyaba,
Kasiribiti, Lwamirindi.
Nakinya, Gayira, Noba, Kababondo,
Namatimba, Nalyankanja, Namazina,
Nalongo, Katonga, Kiwegi, Wabiriga,
Katajula, Nabalemezi, Wabitosi,
Namwendo, Kyambogo, Wazigugu,
Nayasandeku, Wabisonko,
Waminyira.
Towa Kibanda, Mututwe,
Kabulamuguwa, Lwenjobi,
Mulika, Kabale, Nakalangala,
Zambi, Bisenyi, Wanjagaza,
Kazinga, Lwabidu,
Kyabatangwa.
Bujugwa, Bunabwengo,
Kaziralwendo, Babwe.
Borokoka / Tomenyera
Mukote Kyondo, Nalumu, Mazzi,
Kyatimba, Nabalanzi.
Nkandwe
Kyadita
Soba
Luwero District Wetland inventory report (2000)

Luweero District State Of Environment Report 2004
35
2.4.5 Uses and functions (wetland benefits)
The benefits from the wetlands are categorized as follows:
1. Goods/Products – Fish, water, fruits, medicine, wild meat, firewood, timber, craft
materials, sand, clay, gravel, mulching materials, grass, thatching materials, and land for
farming.
2. Services/Functions
• Ground water recharge and discharge – District depend on ground water supply heavily.
• During water supply protection and storage
• Water quality protection and purification
• Erosion and sediment control
• Climate modification
• Wildlife / habitat function
• Transport
• Flow regulation
3. Attributes
• Biodiversity conservation
• Aesthetics
• Cultural heritage
Table 2.4.2: Major wetland uses and threats in the District
Uses Threats Effects
Grazing ♦ Overgrazing, pesticide use,
bush burning
♦ Invasion by unpalatable grass
species
♦ Soil erosion
♦ Development of species and
vegetation composition affected
♦ Animals scared away
♦ Biodiversity loss
Cultivation ♦ Uncontrolled cultivation e.g.
rice in semuto, Kapeeka ,
Nakaseke and Kasangombe
(fig. 2.4.2)
♦ Biodiversity loss
♦ Soil erosion
♦ Fore gone services
♦ Water pollution
Wood harvesting ♦ Deforestation ♦ Reduced tree cover
Harvesting of Phoenix poles
and leaves ♦ Over exploitation ♦ Phoenix extinction
Sand and clay extraction
especially in urban centres ♦ Over exploitation ♦ Scattered open pits
Brick making ♦ Deforestation
♦ Over exploitation of sand and
clay
♦ Soil erosion
♦ Scattered open pits
Propagation of eucalyptus tree
species ♦ Out competing wetland plants
species
Building construction
especially in urban centres
Luwero District Wetland Inventory Report (2000)

Luweero District State Of Environment Report 2004
36
Fig. 2.4.2 Wetland encroachment due to rice growing in Semuto Sub-county
2.4.6 Wetland ownership
Wetlands are “held in trust by the Government and Local Governments for the good of all
citizens of Uganda in accordance with the constitution 1995. However, there are some people
whose land had wetlands in it before the National Environment Act CAP (153) was enacted.
These people are obliged to use the wetland in accordance with existing laws (Land Act 1998,
Forestry and tree planting Act etc).
2.4.7 Opportunities in wetlands management
• Promotion of fish farming under NAADS and PAF programs and by NGOs
• Creation of wetlands department under Natural resources sector.
• Dam construction to provide water for livestock.
The table 2.4.3 shows the common wetland animals in wetlands.

Luweero District State Of Environment Report 2004
37
Table 2.4.3: Common wetland animals
Birds Mammals Fish Reptiles
Grey herons Bush bucks Cat fish (Clarias) Tortoises
Hammerkops Oribis Tilapia
(Oreochromis)
Frogs
Guinea Fowls Duikers Mamba
(Protopterus)
Snakes
African Marsh
Harriers
Wild pigs
Glossy Ibis Monkeys
Crowned Cranes Warthogs
Saddle Bill Storks Edible rats
Open Bill Storks Reed bucks
Shoe Bills Hippos
Yellow Billed
Storks
Sitatunga
African Jacana
Blue Headed Coucal
Marabou Storks
Luwero District Wetland inventory report (2000)

Luweero District State Of Environment Report 2004
38
2.5. Biodiversity
Biodiversity refers to the total variety of life on earth. Biodiversity includes (Biological
hierarchy).
• Genetic diversity – diversity within species
• Species diversity – diversity among species
• Ecosystem diversity – diversity among ecosystems.
2.5.1 Ecosystem Diversity
The major ecosystem in Luwero District includes;
i. Forest – Savannah woodland and plantations, swamp forests
ii. Wetlands and rivers – Covers approximately 7% of the District area.
Rich in flora and fauna
Wetlands species are highly specialized and if their inhabitants are disturbed the impact is great,
leading to decline and even extinction of some species.
iii. Grassland
iv. Bush land: Dominates the Northern part of the district.
v. Modified biodiversity ecosystems. These are rich in wildlife species. These include
agro- systems, forest plantations, urban and systems.
2.5.2 Species Diversity
The high ecosystem diversity in the District implies high species diversity. These include birds,
invertebrates, primates, plant species, butterflies, and reptiles, fish.
2.5.3 Genetic Diversity
Provide options for improving livelihoods of the committees.
Variability in climatic conditions translates into a variety of genetic resources.
The ecosystems provide a great range of variable habitats that hold a great variety of genetic
resources.
2.5.4 The values of Biodiversity
According to Ehrlich and Ehrlich 1992, Biodiversity values can be classified as follows: -
a) Ethical values
These are based mainly in religious feelings of individual’s in many cultures; that other
forms of life have intrinsic value and hence deserve protection from destruction by
humanity. These views vary from society to society and are not applied equally to all
organisms.

Luweero District State Of Environment Report 2004
39
b) Aesthetic Values
These derive from the natural beauty of many living organisms. The more conspicuous
such as birds, butterflies, reptiles, flowering plants are widely acknowledged and support
extensive economic activities e.g. Ecotourism, fish sporting, Ecosystems like forests,
wetlands, grasslands after sights of great beauty for many people.
c) Direct Economic values
Humanity obtains direct benefits from other living organisms in terms of food (fish, plants,
animals, mush rooms) and other useful materials (craft materials, water, medicine, timber,
firewood, building materials etc).
Wild plants (relatives of our crops) represent important reservoirs of genes that are
essential for improving the crops or developing new strains that are resistant to various
environmental constraints such as pests and diseases.
a) Indirect Economic Values
These include functions and attributes of the ecosystems. They are flood control, water
flow regulation, ground water recharge and discharge, drinking water supply and storage,
water quality protection and purification, erosion and sediment control, carbon retention,
climate modification habitat function and recreation.
2.5.5 Threats to biodiversity (Biodiversity Loss)
Biodiversity losses are due to the following causes:
i. Habitat conversion/destruction
Forests, wetlands, have been converted for agricultural purposes and settlements. Conversion for
settlements is common in urban areas where as for agricultural purposes in rural areas. Crops
like rice, yams; sugarcanes have been grown extensively in wetlands. Rice growing in wetlands
is common in sub-counties of Semuto, Kasangombe, Kapeeka and Nakaseke.
Deforestation is a big issue through out the district. It is very high is sub-counties of Ngoma,
Wakyato, Zirobwe, Kamira, Kikyusa and Semuto.
Overgrazing and bush burning are common practices in cattle keeping areas of
Ngoma, Wakyato, Kamira.
ii. Over exploitation of biodiversity goods.
Over exploitation is high specifically for some wetland products e.g. Phoenix poles and leaves.
The poles are used for making fences.
Illegal hunting is also common in Ngoma, Wakyato and Kinyogoga sub-counties.
iii. Pollution
This affects the wetlands and rivers biodiversity. The sources of pollution are sediments and
agrochemicals from the catchments areas. This is mainly due to poor agricultural practices.

Luweero District State Of Environment Report 2004
40
iv. Ignorance
2.5.6 Opportunities for biodiversity conversation
a. Presence of viable biodiversity populations especially in the Northern part of the
district.
b. Presence of environmental institutions (DEC, LECS, Environment Department,
DTPC, District Council).
c. Committed technical staff.
d. Political support for conservation.
e. Availability of policies and legal framework.
f. Linkages with conservation organizations (NEMA, UWA, WID, NFA)
2.5.7 Wildlife Resources
Wildlife is defined as any wild plant or animal of a species native to Uganda and includes wild
animals that migrate through Uganda ( MTWA, 1996).
Luweero has ecological communities ranging from grasslands, woodlands, forests and wetland
ecosystems. The above ecosystems favour existence of diverse wildlife including birds,
invertebrates, primates, butterflies.
Wild life is often found on private or communally owned land outside protected area systems.
However, the state still “owns” wildlife on such land (MTTI, 1999). The wildlife statute
1996(No. 14) empowers UWA to manager wildlife everywhere. Consequently, the land-owners
or land users generally do not benefit from wildlife inhabiting their land and so do not take
responsibility for their management or protection, resulting in change of land-use, increased
human-wildlife conflicts and illegal hunting.
These have in turn contributed to the decline in animal population quality of wildlife resources
and continued negative perception of wildlife and of habitat as a non-viable land use.
The growing problem of human – wildlife conflict perpetuates poverty among the local
communities who are already impoverished. People lose property and lives due to wildlife
invasions and transmission of diseases both to human beings and their livestock.
Un controlled hunting - contribute to the removal of vegetation, which affects the habitats for
wildlife.
Status of wildlife
According to general surveys under taken by the Ministry of Tourism, wildlife and antiquities,
Luwero has a significant wildlife population.

Luweero District State Of Environment Report 2004
41
Problem animals
A problem animal includes any animal which posse’s danger to human life or property (wild life
status 1996). A problem animal may be a vermin or not. Most of the problem animals are
scheduled animals but not all the scheduled animals are dangerous.
Problem animals in the District include:
Animal Sub-county (Where common)
Buffalo Ngoma
Hippopotamus Ngoma
Hyena Kinyogoga , Ngoma , Wakyato, Butuntumula
Leopards
Crocodiles Ngoma ( Kafu, Mayanja river systems)
Lions, Pythons
Elephants
Elephants used to exist in Luwero District. Elephants are habitual migrants and have been
known to use specific migrating routes. In Uganda, there were established migratory routes
between Bunyoro and Katonga; Kibale and Mubende; Murchison to Southern Sudan. However,
due to the rapidly expanding human population and increasing agricultural and industrial
development, some of these elephant’s migratory routes were cut off. This situation left some
isolated pockets of elephant and populations, which were not within protected areas.
Brocks and Buss (1962) reported a large resident herd of elephants in North Bulemezi between
Mayanja and Lugogo swamps in Luwero District, which intermingled with migratory herds of
other elephants population in Uganda before their routes were cut off. UWA reported that these
elephants composed of about 45 individual and the population was not viable as there was no
lager exchange of genetic materials with other elephant populations.
The elephants were confirmed in the area and they were posing a threat to human lives and
destroying crops and water dams.
In order to solve the conflict between the elephants and the communities in Ngoma and Wakyato
Sub-counties the elephants were translocated by UWA to the Murchison Falls Natural Park.

Luweero District State Of Environment Report 2004
42
2.6 Physical and urban areas
2.6.1 Housing and settlement
According to the Luwero Socio-Economic Survey conducted in 2000, the majority of house
holds (75%) in the District own the dwellings in which they live. This is 6% points lower than
the figure revealed by the 1991 Population and Housing Census of 81%. On the other hand, the
households had gone up by 32% points (15% against 12%) compared to 1991 population census.
Those having houses which are neither owned nor rented constitute 10% of the total households
with two rooms. This compares well with the figures revealed by the 1991 census of two rooms
for Uganda as a whole.
The majority of houses in the District are roofed with iron sheets (84%) as shown in the table
below. A marked variation is revealed when the rural houses are compared to the urban areas,
with those roofed with iron sheets constituting 98% of the total households in the urban and 82%
in the rural areas. Some households (0.3%) were reported to be roofed with other roofing
materials. These materials include: tiles, wood and banana fibres.
Table 2.6.1: Showing the distribution of households by type of roofing materials by
rural – urban residence.
Roofing
materials
Rural Urban Total
Household % Household % Household %
Thatch 14,640 18 110 1 14,750 16
Iron sheets 68,530 82 10,120 98 78,650 84
Others 170 0 70 1 240 0.3
Total 83,340 100 10,290 100 93,630 100
2.6.2 Small scale industrial establishments
These are mostly located in the Town Councils. They include metal fabricators (windows and
door frames manufacture and metal welding), carpentry, blacksmith, aluminum casting, brick
making, clay works (ceramics).
♦ Weaving
♦ Handicraft and leather bags
• Food processing
• Maize grinding and packing
• Ground nuts hulling and grinding
• Rice hulling
• Coffee processing
♦ Garages

Luweero District State Of Environment Report 2004
43
Pollution
The pollutants produced by the existing industries are pollutants in nature. Some of these are a
health hazard to humans and environment. Table 2.6.2 shows some of the industries and their
pollutants.
Table: 2.6.2: Agro-industrial establishments and nature of pollutants in Luwero
Industry / Activity Nature of Pollutant Health outcome
Coffee (hulling) Coffee dust Asthma and allergic
alveolitis
Coffee (hulling) Coffee husks Pricks feet and eyes as
specks
Cotton ginning Cotton moulds Lung diseases
Grain milling Flour moulds and husks Occupational asthma,
coughs
Milk processing Milk spillages and washouts Diarrhea and offensive
smell
Metal fabrications Metal scraps Pricks
Garages Motor oils, lubricants,
grease, oil filters
Lead poisoning and cancer
Wood / carpentry Wood dust, moulds Bronchial asthma
2.6.3 Solid waste management
Solid waste refers to any matter prescribed to be waste and any matter, whether liquid, solid,
gaseous, or radioactive, which is discharged, emitted, or deposited in the environment in such
volume, composition or manner as to cause an alteration to the environment.
Municipal waste is basically waste generated in household, businesses, hotels, schools, markets,
gardens and non-chemical industries and applies both to rural and urban areas.
Solid waste management encompasses generation, storage, collection, transportation and
disposal. Urban authorities have the responsibility of ensuring safe reliable and cost effective
removal and disposal of solid wastes.
Solid waste management in urban areas is still bad resulting in careless and indiscriminate open
waste space dumping which has created unsanitary conditions in the urban centres. This results
into un pleasant odours and are fertile grounds as breeding sites for flies and other vectors. They
may also result in the pollution of both surface and ground water through the leachate and
impairing the permeability of soils as well as blockage of drainage systems.
Urban solid waste can be classified into sources and types of wastes. Wastes are classified either
by source or their nature.

Luweero District State Of Environment Report 2004
44
Categorization by source
Types of wastes
a. Domestic / Household wastes (including kitchen refuse)
These refer to wastes from commercial units and markets that are related to items sold e.g.
food stuffs, vegetable peelings, plastics, glass, cloth cuttings and sweepings from streets and
shops, institutional refuge and wastes from public places and that generated by hawkers.
Kitchen – organic wastes mainly (peelings, banana leaves etc)
Polythene
Plastics
Glass
b. Construction debris – stones, wood, bricks. They arise from demolition, excavation
c. Small scale industrial wastes
Consists of refuse generated from industrial operations. i.e. chemicals, dust, husks
d. Hazardous solid wastes
These wastes include used dry cells, used tyres, wastes from slaughter houses, sharp cutting
objects such as used razors and broken glass.
e. Medical or clinical wastes
It includes wastes from medical institutions like clinics, hospitals, dispensaries etc. These
include the following:
• Pathological and infectious wastes
• Pathological and surgical wastes
• Drug and chemical residues and containers
• Discarded linens, clothing and bandages
• Disposable needles, syringes and surgical instruments etc.
The wastes generated can also be generalized into the following:
A. Biodegradable wastes
These are mainly organic wastes such as peelings of potatoes, bananas, sawdust etc and
constitute the bulk of the wastes generated.

Luweero District State Of Environment Report 2004
45
B. Non-biodegradable wastes
These include polythene bags, plastic products, pesticide residues, process wastes, highly
inflammable and volatile substances, abandoned vehicles, used tyres, industrial wastes including
metal scraps and medical wastes e.g. needles, plastics, glass bottles and syringes.
Hazardous and clinical wastes require special treatment, handling and disposal. These wastes
some times are disposed off without treatment and are usually mixed with domestic and
commercial wastes.
Solid waste storage
Primary storage
Primary storage refers to the temporary holding of the solid wastes at or close to their point of
generation and often involves use of containers such as house hold and public bins, skips, refuse
bunkers or open dumps. Primary storage is a responsibility of individual households.
Secondary storage
This refers to that occurring at an intermediate point between the primary storage stage and
ultimate disposal of wastes. This is a responsibility of the Urban Councils. Refuse bankers / skips
are provided for this purpose at strategic locations.
In some cases the refuse bankers / skips are not emptied in time. Over flow of skips some times
occurs due to poor dumping by the users, largely attributed to carelessness.
Collection and transportation of wastes
Small percentage of wastes is collected. The remainder is disposed off on site using methods
such as burying and burning. The Town Council vehicles are available for waste collection and
transportation to dumping grounds.
Recycling and reusing
The Urban Councils has less capacity to recycle and reuse wastes. Some individuals have taken
initiatives.
The Town Councils do not have gazetted disposal sites. They use dumping grounds.
Environmental concerns due to poor waste disposal
• Careless and indiscriminate open dumping
This creates unsightly and unsanitary conditions within the Town Councils e.g. along
the roads, highways and households.
• Delay in delivery of solid wastes to the dumping site
This results in nuisance dumps and unpleasant odors, which attract flies and other
vectors. Such dumps also lead to pollution of land and ground and surface water through
leachate.

Luweero District State Of Environment Report 2004
46
• Open solid waste dumps can also be a public health risk. Direct contact with refuse can
be dangerous and unsafe to the public, as infectious diseases such as cholera and
dysentery can be spread through contact with these wastes. They also provide suitable
breeding grounds for vermins and flies and other disease vectors, and can also contain
pathogenic micro organisms.
• Some categories of solid wastes block permeability of soils and drainage systems,
including water courses, open drains thus posing difficulties in the functioning and
maintenance of such facilities.
Challenges in solid waste management
a. Poor enforcement of laws and regulations regarding waste management
b. Low awareness on the implications of poor waste handling among the community.
c. Negative attitude towards responsible waste handling
d. Inadequate funding
e. Inadequate skips / refuse bankers

Luweero District State Of Environment Report 2004
47
2.7 Social welfare and Environment
2.7.1 Transport and communications
2.7.1 Roads
There are mainly four categories of roads in the District (table 2.7.1). These cover a total
distance of 325g km (2001). There is one weather road (tarmac) which runs through the District
from the southern part to the north (Gulu road).
(169 km) feeder roads of an estimated length of (534 kms) and the local roads locally called
“Bulungi- Bwansi” (1295 km). Tarmac roads are maintained by Works Department of the
Ministry of works while the feeder and Bulungi-Bwansi are maintained by the Local
Governments. Fig. 2.7.1 shows a bridge being constructed over Lugogo River along Ngogolo –
Kalagala road.
Table 2.7.1: Road categories and their conditions
Category Length Km Condition Responsibility
Tarmac Trunk road 57 Good MOW HC (Directly)
Trunk feeder roads 307 Fairly good MOW HC (Directly
District Feeder roads 608 Fair District Local Government
Access roads 2287 Poor Sub County / Community
Issues
� Aged road plants with frequent break down
� In adequate tool kits in the mechanical workshop
� Failure to restore borrow areas (fig. 2.7.2)
Fig. 2.7.1 Bridge construction over Lugogo River (Ngogolo – Kalagala road)
Source: Environment Department (2004)

Luweero District State Of Environment Report 2004
48
Fig. 2.7.2 Borrow area (Ngogolo – Kalagala road)
Environment Department (2004)
2.7.2 Postal and telecommunication services
The district has both post and telecommunications infrastructures.
Postal Services
Luwero has a main post office located in Luwero Town Council and another in Wobulenzi Town
Council. There also a number of sub-postal offices spread throughout the district in small urban
centres.
Generally, postal services offered in the district include:
• Ordinary mail conveyance
• Express mail
• Registered and Expedite Mail Service
In addition, the postal department offers other services such as:
• Letter boxes rentals
• Private bags and sell cards
• Delivery of money through Ordinary Money Order
• Post bank services
• Telegraphic money orders
Furthermore, the district is served by the Post Bus which has helped in fast mail conveyance.

Luweero District State Of Environment Report 2004
49
Mass media
Accessibility to mass media is high in the district. Newspapers and FM radio stations are
available in English and local languages particularly Luganda.
The mass media especially those broadcasting in Luganda, is a good tool for awareness rising
and can be used to keep people informed throughout the district. The people also have access to
televisions.
2.7.3 Education
Education at all levels play a vital role in promoting sustainable development through capacity
building of the population in various skills, as well as raising awareness on various issues of
national importance and improving general standards of living.
Education Institutions in the District
The education institutions are categorized as Government aided and private owned as shown in
the table below:
Table 2.7.2: Education Institutions in Luwero
Institution Government aided Private Total
Pre-Primary
(Nursery)
- 115 115
Primary 325 72 397
Secondary 20 56 76
Primary Teachers
Collage
1 - 1
Polytechnics 2 - 2
Universities - 2 2
Education (2004)
Primary Education
School categories
Primary Schools are categories as shown in the table below.
Table 2.7.3: Schools and their categories
Grade I Grade II Grade III Grade IV Total
45 40 92 106 283
Education (2002)
Grade I school has 700 pupils or more
Grade II school has 450 pupils to 699 pupils

Luweero District State Of Environment Report 2004
50
Grade III must be a p7 school with between 280 to 499 pupils.
Grade IV school is a school with less than 280 pupils and is a full primary.
Primary schools are further categorised into clusters. There are 14 cluster centres each headed by
a Chairperson who is a head teacher. These clusters are named after the host school / centre
school as indicated in the table below.
Table 2.7.4: Cluster centres per county
County Cluster
Katikamu Katikamu Sebamala
Kalasa
Ndejje
Sempa
Kasiiso
Luwero Boys
Bamunanika Zirobwe St. Augustine
Kiziba C/U
Kalanamu Primary school
Malungu Primary school
Nakaseke Kiziba R/C
Kijaguzo
Bukeeka
Kiwoko C/u P/S
Education (2004)
Enrollment
Table 2.7.5: Primary Schools enrollment by gender and class
2002 2003 Total Class
Male Female Male Female 2002 2003
P1 23,166 24,501 22,632 22,948 47,667 45,580
P2 12,826 13,084 12,192 12,336 25,860 24,528
P3 13,403 13,820 12,161 12,406 27,223 24,567
P4 12,461 13,172 11,842 12,323 25,633 24,165
P5 10,154 10,844 10,361 11,200 20,998 21,561
P6 7,696 8,433 8,650 9,361 16,129 18,011
P7 4,669 4,799 5,160 5,643 9,468 10,803
Total 85,172 87,806 82,998 86,217 172,978 169,215
Education (2004)

Luweero District State Of Environment Report 2004
51
School drop out
The annual school census conducted by the ministry of education (2002-2003) indicated that the drop out rate was highest for P1 (40.64%), followed by P6 (24.19%), P5 (11.72%), P4 (9.10%), P3 (1.79%) and P2 (0.81%).
Causes of school drop outs
1. Parents social economic status
2. Early marriages
3. Pregnancy
4. Cultural and traditional
5. Poor academic status of the pupil
6. Parents are illiterate and ignorant
7. Long distance from homes to schools
Staffing in Government aided primary Schools
Table 2.7.6: Teachers by qualification
Year Teachers Grade
2003 2004
Un trained 631 418
Grade II 20 4
Grade III 1,835 2,227
Grade V 334 470
Graduates 24 47
Total 2,843 3,166
Education (2004)
Untrained teachers are attending an in service course at Nakaseke CORE PTC.
Performance in Primary Leaving Examination
The PLE performance and performance percentages for 2002 and 2003 are shown in the tables 2.7.7 and 2.7.8 respectively.

Luweero District State Of Environment Report 2004
52
Table 2.7.7: PLE performance
2002 2003 Total Division
Male Female Male Female 2002 2003
1 432 371 842 683 803 1,525
2 1,540 1,463 1,907 2,163 3,003 4,070
3 676 844 627 812 1,520 1,439
4 639 680 494 547 1,319 1,041
U 819 877 277 611 1,696 888
X 334 316 589 276 650 865
Total 3,440 4,551 4,736 5,092 8,991 9,828
Education (2004)
Table 2.7.8: PLE performance percentage changes (2002 & 2003)
Division Male Female Total
1 94.9 84.1 90.0
2 23.8 47.8 35.5
3 -7.8 -3.7 -5.3
4 -22.7 -19.6 -21.0
U -66.1 -39.1 -47.6
X 76.3 -12.7 33.1
Total 37.7 11.9 9.3
From the above table, there was 9.3% increase in the number of pupils that sat for PLE between
2002 and 2003. It also shows a 90% increase in division 1, 35.5% increase in division 2 and
33.1% increase in division X. The decrease is shown in the following grades: 5.3% division 3,
21% division 4 and 47.6% division X.
School Facility
School facility provision is supported by the School Facility Grant (SFG). The facilities provided
in financial years 2002/03 and 2003/04 are shown in the table 2.7.9 below.
Table 2.7.9: School facilities in the year 2002/03 and 2003/04
School facility FY 2002-2003 FY 2003-2004
Classrooms Constructed 76 58
Teachers Houses 08 06
Latrines (stances) 103 70
Desks (Furniture) 851 980
Total 1,038 1,114
Education (2004)
Latrines are categorized as follows:
08 stances for Teachers

Luweero District State Of Environment Report 2004
53
19 stances for disabled children (2002/03)
14 stances for disabled children (2003/04)
76 stances for ordinary pupils
Classrooms under SFG programme are disability friendly.
The Ministry of Education has supplied instructional materials in primary schools under super
books cycle program annually. In 2002 schools received super books cycle 8. 76,814 books for
P3 and P4 were received. In 2003 schools received super books cycle 9 with 85,711 books for
P5, P6 and P7. The pupil to book ratio is 1: 3 (appendix 1).
Sports facilities are also available for Government aided schools. These include: a play ground
and 2 balls (net ball and foot ball) per school. In general schools lack sports equipment and
indoor games.
Special Needs Education
Special needs education is offered for different categories of disabled children.
Special needs schools
The schools in table 2.7.10 below offer special needs education.
Table 2.7.10: Special needs education unit schools in inclusive Government aided schools
Unit school Types of special needs education
Luwero Boys Hearing impairment
Nsawo Primary School Mental learning difficulties
Balitalwogi P/S Visual impairment
Kalasa mixed Mental / learning difficulties
Katikamu Sebamala Inclusive / ML/LD
Lutete mixed Inclusive/ML/LD

Luweero District State Of Environment Report 2004
54
Enrollment in special needs schools
The table 2.7.11 gives the number of children with disability in schools.
Table 2.7.11: Children with special needs education inclusive Government
aided schools
2002 2003
Total
DISABILITY
TYPE Male Female Male Female 2002 2003
Mental
/Learning
Difficulties
707 621 519 582 1,328 1101
Hearing
Impairment
360 174 466 490 534 956
Visual
Impairment
525 96 431 332 842 763
Motor /
Physical
Handicap
639 203 332 314 621 646
Total 2,231 1,094 519 582 3,325 1,101
Education (2004)
Staffing in special needs schools
Special needs Education coordinators are Grade II teachers running special needs activities at
cluster centre level. Table 2.7.12 shows the staffing levels.
Table 2.7.12: Staffing special needs education
Grade Grade 5 Graduates SNECOs
No. 8 2 21
Information regarding secondary education is given in annex 1.

Luweero District State Of Environment Report 2004
55
2.7.4 Health
There is a strong link between the quality of the environment and health. What happens in the environment directly or indirectly affects health. When people’s health is affected, their ability to develop and manage their environment is undermined. Environmental health is that aspect of public health concerned with all factors, circumstances and conditions in the environment that can exert an influence on human health and well being.
The living and non-living disease agents that affect health are found in the environment. Poor living and working conditions expose people to physical, chemical and biological pollution and to adverse psychological and social factors that may harm health. Similarly, the environmental condition of human settlements is a basic factor governing physical and mental health and social wellbeing and general quality of life of the people who live in them. The level of hygiene in human settlements is very crucial.
Humans through their Endeavour to survive also influence their environment, mostly negatively overgrazing, cultivation of wetlands, deforestation.
Health Infrastructure
Organizational structure for health programs implementation For the purpose of proper planning, implementation and monitoring of health services, the district is divided into 4 functional parts called Health Sub Districts (HSD – table 2.7.13). Each HSD is equivalent to a constituency, has a headquarter and is led by a Medical Officer. These are:
HSD HEADQUARTER 1. Katikamu North HSD Luwero HC IV 2. Katikamu South HSD Nyimbwa HC IV 3. Bamunanika HSD Kalagala HC IV 4. Nakaseke HSD Nakaseke HC IV 5. Ngoma HSD Ngoma HC IV
Table 2.7.13: Health units by Health Sub District (HSD) HSD Hospital HC IV HCIII HCII Total GVT NGO GVT NGO GVT NGO GVT NGO Katikamu North
0 0 1 0 2 3 7 2 15
Katikamu South
1 0 1 0 8 2 3 7 22
Nakaseke 1 1 1 0 6 1 4 3 17 Bamunanika 0 0 1 0 4 3 4 6 18 Total 2 1 4 0 20 9 18 18 72 (3 HOSPITALS, 4 HC Ivs, 25 HC III AND 37 HC IIs) HC II - Out patient only HC III - Out patient services, martenity, general ward and laboratory.

Luweero District State Of Environment Report 2004
56
HC IV - Out patient services, maternity, wards, theatre, laboratory and blood transfusion. Hospital - Same as HC IV plus X-ray
Fig. 2.7.3: Bamugolodde Health Centre II Fig. 2.7.4: Kikoma Health Centre III under construction (2004) under completion (2004)
Source: Environment Department (2004) Table 2.7.14: Health / Demography Indicators
Doctors to population ratio 1:25,000 Population with access to safe water 54% Household Pit latrine coverage 60% Anemic Children (6-12 yrs) ( 2000) 3.2% Goitre infected Children (2000) 62.5% Under five stunted (2000) 40% Under five yrs under weight children (2000) 23% Delivery in health units 25% Total fertility rate 6.9% DPT3 66% BCG 78% Measles Immunization 63% TT (pregnant mothers) 43% TT (non- pregnant mothers) 28% Infant mortality rates 112/1000 Less than 5 mortality rate 150/1000 Maternal mortality rate 550/100000 Life expectancy in years 46 Life expectancy for male 43.3 Life expectancy for female 49.5 Total fertility 6.9 Acute malnutrition 7% Stunting rate 36% Safe Latrine Coverage Access to safe water 57% DDHS’s Office (2004)

Luweero District State Of Environment Report 2004
57
Accessibility to health services Geographical access Only 43% (59/136) of the parishes have at least one Health Units (HU). 57% (77/136) of the parishes do not have HUs. This means that the majority of the people have to walk a distance of more than 5 km to the nearest health facility for care. All the HUs are however easily accessible (roads are passable). Economic access All services in the Government health facilities are free with exception of Nakaseke Hospital where there is a private wing. Private Not for Profit (PNFP) health units charge a small fee for their services.
Table 2.7.15: Trends of health indicators 2001/02, 2003/03, 2003/04. Indicator 2001/02
(%) 2002/03 (%)
2003/04 (%)
Target2004/05 (%)
OPD utilization 54 75 76 85
DPT3 Immunization coverage
66 66 65 80
Deliveries at Health facilities
25 30 36 50
Measles Immunization coverage
63 70 63 80
Pit latrine coverage
54 62 66 75
TT (Preg. Mothers)
43 29 43 50
TT (Non Preg. Mothers)
28 28 28 50
BCG Immunization
78 88 78 80
Infant Mortality Rate per 100,000 birth
112
Under 5 years mortality rate per 1,000
550
150 DDHS’s Office (2004)
♦ Out patient attendance is commonly determined by among other factors disease pattern, disease control and preventative measures in place and availability of drugs at health units.

Luweero District State Of Environment Report 2004
58
♦ The number of mothers delivering under trained health workers is dependant on accessibility and availability of the services and trained providers. HC IIs at Parish level are presently the nearest Government Health facilities to communities but unfortunately not all parishes have been provided for and not all existing HC IIs have trained providers for safe deliveries.
♦ Mass immunization programmes like the current Tetanus programmee have improved coverage for specific antigens while the continuous sensitization and mobilization of communities for routine immunization of children is expected to continuously improve coverage.
♦ Sustained Public Health interventions in place and effective implementation are expected to gradually reduce mortality rates.
The figure 2.7.4.3 shows the trend of health indicators from 2001 to 2004.
Fig. 2.7.5: Trends of health indicators 2001/02, 2002/03, 2003/04
Trends of health indicators 2001/02, 2003/04 and 2004/05
020406080
100
OP
D
Deliv
eries
Pit
latr
ine
TT
(N
on
Indicator
% 2001/02
2002/03
2003/04
Target 2004/05
Top Ten Causes of Morbidity in the district � Malaria, � Acute Respiratory Tract Infection � HIV/AIDS � Tuberculosis � Diarrhoreal diseases � Malnutrition (under nutrition) � Anaemia � Intestinal worms � Trauma/Accidents � Skin infections Health Priority areas The Minimum Health Care Package (UNMHCP) 1. Control of communicable diseases: malaria, STD / HIV / Aids, Tuberculosis/Leprosy 2. Integrated management of Child Illness (IMCI) 3. Sexual and Reproductive Health and Rights 4. Immunization for children (under 1) and women of child bearing age 5. Environmental Health, hygiene and sanitation 6. School Health 7. Health Education and Promotion

Luweero District State Of Environment Report 2004
59
8. Epidemic and disaster prevention, preparedness and response 9. Improving Nutrition 10. Interventions against diseases targeted for elimination or eradication 11. Strengthening Mental Health Services 12. Provision Essential Clinical Care
• Ear / Eye care
• Disability and rehabilitation
• Oral Health – Dental care
• Accidents and other injuries Nutrition status Key indicators normally used for assessing nutritional stratus of children, women and men include:
♦ Infant feeding practices
♦ Anthropometric measurements
♦ Prevalence of anaemia
♦ Vitamin A deficiency
♦ Supplementation and iodisation of salt Limited district specific data is available for most of the above indicators. Children’s nutrition status Going by the Uganda Health and Demographic Survey results (2000), 40% of children under the age of 5 years are stunted i.e. they are short for their age. 23% of children under the age of 5 years are under weight, which reflects either stunting or wasting or a combination of both. Micronutrients Iodine and iron The latest nutrition survey involving school children (6-12 years) done in the district (Olico Okui et al, 2000) revealed that 3.2% of the children in Luwero were anaemic and that 25% of the homes in the district consume salt with less iodine than the required standard. Due to the low iodine levels in salt, 62% (295/472) of the children examined were found to have Goitre (Edokooli). Vitamin A Vitamin A is a food nutrient required in small quantities for the body to function properly. Vitamin A helps children to grow well, be strong, stay healthy, resist diseases and has good eye sight. Improving Vitamin A status in children reduces the severity of childhood illness. Vitamin A also helps mothers to resist disease and hence contributes to reduction in maternal deaths. The vitamin A given to mothers becomes available to the infant through breast feeding. According to the National Vitamin A Capsule Supplementation (VACS) schedule all children aged 6 months to 5 years should receive a high doze of Vitamin A capsule every 6 months (biannually). All mothers who have delivered should also receive a high doze of Vitamin A capsule within 8 weeks from the time of delivery. Vitamin A supplementation is therefore conducted twice every year. The target population for Vitamin A is 90% of children under 5 years of age. And for mothers the target population is 5.2% of the total district population (women expected to deliver at least once per year). During the last Vitamin A supplementation exercise in the district (May – June 2004) coverage of 33% for children was attained. Vitamin A is now available in the Health Units throughout the year.

Luweero District State Of Environment Report 2004
60
A nutritional unit was established and is functional at Luwero HC IV while another exists at
Kiwoko Hospital.
HIV / AIDS Pandemic
In Africa, HIV / AIDS is largely a rural / urban poor issue, where a matrix of socio-economic,
cultural and gender related vulnerabilities indicate that the links between AIDS, food security
and poverty are strong and deadly (UNEP, 2000b).
Prevalence of HIV
Prevalence refers to total number of cases of the disease in the population. It has been difficult to
get district specific prevalence figures. Using data from Voluntary Counseling and Testing
(VCT) centres, 17-35% of the clients are found positive (NOT a true picture of the population).
Currently the VCT services are offered in the following centres in the HSD:
Katikamu North Katikamu South Bamunanika Nakaseke
Luwero HC IV Nyimbwa HC IV Kalagala HC IV Nakaseke
Hosp.
Butuntumula HC III Bombo HC III Bamunanika HC III Kiwoko Hosp.
Bishop Asili HC III Katikamu Kisule HC II Zirobwe HC III Semuto HC III
Kasaala HC III Bombo Military Hosp. Wabusana HC III Ngoma HC IV
Bowa HC III
Makulubita HC III
Ngoma HC IV, Bowa HC III, Makulubita HC III and Wabusana HC III offer outreach VCT
services.
VCT results from different sites in the district are shown in the tables below:
Table 2.7.16: VCT RESULTS (static and out reaches) July 2003 to June 2004
VCT Sites Total
counseling
Total
Tested
Total
Female
Total
Male
TRF
TRM
(M&F)
Total
Reactive
T%
Reactive
Luwero 3278 2216 1230 986 341 200 541 24.4
Semuto 808 520 273 247 59 23 82 16.0
Kalagala 3119 1363 896 466 219 82 301 22.1
Nyimbwa 1019 799 550 249 122 42 164 21.0
Bombo 612 238 160 78 52 20 72 30.3
Bamunanika 228 228 165 63 66 23 89 39.0
Katikamu 727 226 141 85 76 28 104 46.0
Zirobwe 1521 183 123 60 29 13 42 23.0
Total 11312 5772 3538 2234 964 431 1395 24.2
DDHS’S OFFICE (2004)

Luweero District State Of Environment Report 2004
61
Table 2.7.17: HIV Antibody Testing for 2003 and 2004
Year 2003 2004
Total Counseled 5840 11312
Total Tested 3042 5772
Total Females 1650 3538
Total Males 1392 2234
Total Reactive Females 525 964
Total Reactive Males 324 431
Total Reactive (Absolute No. s) 849 1395
Total Reactive (%) 27.9 24.2
DDHS’S OFFICE (2004)
Possible reasons for the high HIV / AIDS prevalence
• All clients are volunteers
• The decision to take a test is influenced by many factors among which are:
o High degree of suspicion about HIV status, long illness, loss of spouse or partner.
o Anticipation of benefits when one thinks s/he is positive.
Table 2.7.18: VCT Out Reaches and Post Test Centres (PTC) Membership (July 2003-
June 2004)
VCT Sites VCT
C’llors
C /
Aides
Parishes Out
reaches
Com.
Sensitized
PTC
Total
PTC
Females
PTC
Males
Luwero 5 10 15 3 1293 318 211 107
Semuto 2 2 7 10 665 291 191 100
Kalagala 2 8 8 34 1590 126 74 52
Nyimbwa 3 12 6 48 283 164 105 59
Bombo 3 5 5 34 4192 299 199 100
Bamunanika 2 1 6 40 1431 456 303 153
Katikamu 3 8 8 19 2882 365 246 118
Zirobwe 3 29 8 8 4680 481 303 178
Total 23 75 63 196 17016 2500 1633 867
DDHS’S OFFICE (2004)
Prevention of Mother To Child Transmission (PMTCT) of HIV Services
The strategy for prevention of mother to child transmission of HIV has been introduced 6
centres:
• Luwero HC IV
• Bombo Military Hospital
• Kiwoko Hospital
• Butuntumula HC III
• Kasaala HC III
• Nakaseke Hospital

Luweero District State Of Environment Report 2004
62
PMTC Package includes:
• Quality ANC, Intra-natal and post natal care
• Routine screening for malaria syphilis
• Voluntary confidential counseling and testing for HIV.
• Antiretroviral (ART) drugs for mothers who are HIV positive and their babies.
• Prophylaxis for malaria.
• Replacement feeds for the mothers who opt not to breastfeed their babies
• Counseling on safer sex
• Family planning counseling
• Spouse and community involvement
The goal for provision of ART therapy is to reduce virus load as much as possible and to restore
and / or preserve immune function.
Impact of the HIV / AIDS
Burden on the Health Sector
• Bed occupancy in hospitals by AIDS patients rose from 50% to 70%.
• 60% of TB patients are HIV co-infected.
• Increase in infant and young child morbidity and mortality.
• Increase in drug budget for treatment of opportunities infections and other related
illnesses.
• Increase in work load for few health workers.
Burden on Agricultural Sector
HIV /AIDS is a threat to sustainable agriculture and rural development through its systematic
impact (FAO / UNAIDS 1999). At the household level, HIV / AIDS can result in labour
shortages and declining productivity, reduced income, increase in expenditure on medical
treatments and an increase in the number of dependants relying on a small number of productive
family members.
The study on the impact of HIV / AIDS on agricultural sector and rural livelihoods in Uganda
(Luwero, Iganga and Masaka) showed that the fisheries community registered the highest
proportion of HIV / AIDS related deaths (58%) while the pastoral community had the highest
portion of ill people (28%).
Burden on Civil Services
• Labour and human capital is severely affected.
• Reduction of life expectancy.
• Increase in expenses to meet funeral expenses (burial, coffins, transport).
• Time lost by civil servants to care for the sick with AIDS, attend funeral ceremonies.
• Increased number of orphans.
• No productivity in terms of labour, poor output, poor income and poor GDP.

Luweero District State Of Environment Report 2004
63
2.7.5 Gender and environment
Introduction
Gender refers to socially and culturally defined roles, attributes and privileges of females and
male. There exist biological differences between women and men but different societies in the
world interpret and engineer the innate (God- made) differences into set of social expectations
about behaviors, activities, rights, power and resources they have. The differences in activities of
women and men often change with time, space or technology but there are also interesting
similarities for instance caring for the young with a family is almost universally a female role
and that of national defense is predominantly for men.
Gender equality
Gender equality may be understood in three dimensions: equality before and after the law:
equality of opportunity in economic, political, social and other fields: and equality in dignity
(internal worth) of the person between women and men.
Gender and its influence on livelihoods
Livelihood can be defined as capabilities, assets, and activities required for a means of living
(DFID, 1999). Rights, needs, responsibilities, roles and power of women and men impact on
livelihoods in a profound way. Social norms, customs, laws as well as economic institutions such
as markets shape roles and relationships between women and men and influence what resources
women and men have access to, what activities they can or cannot carry out, and in which ways
and levels they can participate in the economy and in the society (table 2.8.1).
Societal norms that systematically define and maintain gender roles within a specific context
often result in conditioning women and men to access, use and benefit from livelihood assets
along gender parameters.
The table 2.8.1 shows gender influence on livelihood assets.

Luweero District State Of Environment Report 2004
64
Table 2.7.19: The gender influence on livelihood assets
Livelihood Assets Gender influence
Natural Capital; e.g. land,
water, livestock,
environment
♦ Rights to natural capital are defined on the basis of
‘perceived permanence’ thus under patriarchal systems boys
/ men are favored to inherit and / or own land and large
livestock species e.g. cows.
♦ Water and fuel provision for household use socially ascribed
to women. However, men can provide these for sale /
monetary gain.
♦ Since men control most capital assets, they bear a heavier
burden for paying taxes.
Human Capital; e.g.
skills, knowledge,
information, health
♦ Bias towards training and educating boys in situations of
inadequate resources thus higher illiteracy rates and limited
opportunity for managerial jobs among women.
♦ Women’s triple roles (productive, reproductive and
community management) limit the time available to them for
continued training)
♦ Gender role stereotyping condition women and men to join
specific occupations; women driven to the lower paying job.
♦ Skewed power relations often expose women to ill health
and risks e.g. violence, HIV / AIDS.
♦ Marketing agricultural produce is predominantly by men
(except for petty trading).
Social Capital; e.g.
networks, trust,
connectivity
♦ Women’s heavy domestic workload constrains their
sustainable participation in networks.
♦ Spousal control can prohibit women from joining networks.
♦ Clan decision-making structures are a male domain; thus
women’s views and interests are submerged.
♦ Men’s gender roles expose them to opportunities for
networking.
Physical Capital; e.g.
transport, shelter,
equipment
♦ Mechanized transport is largely a preserve of men.
♦ Women carry loads on heads, backs, etc
♦ Women in most parts of the district are not expected to own
physical capital assets.
♦ Access to and use of modern tools / machines is
stereotypically male (design and task).
From the above table, it may be deduced that the ability of women and men to harness the
various livelihood assets is significantly influenced by social cultural considerations. Women and
men make livelihood choices within the context of their homes, cultures and communities where
gender roles, privileges and attributes, say status and power are defined. For example women are
reported to prefer less remunerative enterprises where they control the income.
Women and men have different needs and roles and ignoring gender issues may lead to
unwanted consequences and therefore failed environment management programs and activities.

Luweero District State Of Environment Report 2004
65
2.8 Environmental disasters
2.8.1 Introduction
A disaster is an occurrence of a sudden or major misfortune, which disrupts the basic fabric and
normal functioning of a society (or community). It also refers to an event or series of events
which gives rise to causalities and /or damage or loss of property, infrastructure, essential
services or means of livelihood on a scale which is beyond normal capacity of the affected
communities to cope with unaided. Disaster can also be a description of a catastrophic situation
in which the normal patterns of life (or ecosystem) have been disrupted and extraordinary,
emergency interventions are required to save and preserve human lives and / or the environment.
The environmental disasters in the district are droughts, HIV/AIDS, wars and conflicts, pests and
diseases.
2.8.2 Drought
Drought results from climatic changes. Some of these changes are induced by humans e.g.
deforestation, poor agricultural practices and wetland cultivation. As a result, droughts, which
contribute to crop failures, famine and food shortages, have become common in the district.
Droughts and the resultant famine situations compound poverty among the peasants,
incapacitating the communities from participating in economic development, lowering the
nutritional status which results in increased illness and death and contributing to loss of livestock
and even migration. During drought periods the people put a lot of pressure on natural biological
resources.
The Government has constructed valley dams and valley tanks in the cattle corridor sub-counties
to address drought issues.
2.8.3 Pests and diseases
There has been increasing severity and number of crop and animal diseases in the district. These
include coffee wilt, cassava mosaic virus, banana wilt and banana wilt, Foot and Mouth Disease
(FMD). Pests include cotton boll worms, banana weevils and tsetse flies.
Banana wilt disease
Banana Bacterial Wilt (BWW) is a new disease that was first reported in Uganda in September,
2004 in Mukono District. By August 2004 the disease had been confirmed in Luwero District.
BBW is caused by bacteria Xanthomonas campestris p.v. Musacearum and has been observed in
nearly all cultivated banana varieties causing wilting of plants at all ages. When plants are
affected at fruiting stage, bunches ripen prematurely with reddish brown discoloration in banana
fingers. Male buds also wither off. The fruits in affected plants cannot be eaten by both man and
animals. The infection is mainly spread through banana planting materials, contaminated tools
such as pangas and knives used in plantations, insects and browsing animals which visit banana
plants. BWW is a serious threat to both household and national food security.

Luweero District State Of Environment Report 2004
66
BBW was first realized in Luwero District late in the year 2003 Sub-counties namely: Zirobwe,
Kikyusa and Kamira. By the end of year 2004 the disease had spread to all other banana growing
Sub-counties which include: Katikamu, Maulubita, Nyimbwa, Luwero, Butuntumula,
Kasangombe, Nakaseke, Semuto, Kapeeka, Kikamulo, Wakyato, Bamunanika, Kalagala plus the
neighbouring Town Councils of Wobulenzi, Luwero and Bombo.
The prevalence of the disease is alarming that the food security situation in the District is at stake
since banana is a major food crop. The disease has been found to be very destructive to the
banana plants with disease incidence of 70% - 80% and losses of up 90%.
In an effort to control the spread of and eradicate BBW disease, Plan Uganda, an NGO and
development partner in the District in conjunction with Luwero District Local Government
carried out training in BBW disease incidence, effects and control for community leaders and
farmers in Bamunanika, Kalagala, Zirobwe, Kikyusa, Katikamu, Makulubita, Luwero and
Nyimbwa Sub-counties.
Foot and Mouth Disease
FMD is a viral disease attacking all cloven footed animals i.e. cattle, sheep, goats and pigs. It
occurs in 7 types (A, O, C, SAT 1, SAT 2, SAT 3, Asia 1). Types A and O are common in
Luwero.
Losses caused by the disease are reduction in milk production, high expenditure on treatment,
deaths of animals particularly calves, infertility among animals.
Outbreaks have been experienced in sub-counties of Ngoma, Wakyato, Kamira and Kinyogoga
in 2003. Quarantine was declared in the district and phased lifting of ban has been going on until
2005.
2.8.4 HIV / AIDS
Aids prevalence in the district is 17-35% (VCT centres results). This rate is very high and it has
had a significant impact on agricultural, health sectors as well as civil services. This has highly
affected to economic growth of the district.
2.8.5 Wars and conflicts
Wars and conflicts are classified as human made disasters because the principal direct causes are
identifiable human actions, deliberate or other wise.
During the period 1981-1986 a civil conflict (the NRM bush war) raged in Luwero triangle of
which Luwero District is part. It is estimated that over 50,000 people were displaced and another
500,000 lost lives. To deny the NRM rebels hiding places Government forces destroyed forests.
The coffee industry in this area collapsed as people fled their homes and abandoned their coffee
plantations. Infrastructure such as roads, schools, health facilities, trading centres and permanent
houses were all vandalized. Cattle and other livestock were looted leaving the returnees after the
war in 1986 to start life afresh.

Luweero District State Of Environment Report 2004
67
3.0 Responses to Environmental Change
3.1 Key Environmental issues in the District
The table 3.1 below shows the environmental issues in the District.
Table 3.1: Environmental issues, causes, impacts and practical solutions
Issue Cause Facilitators Effect Solution
Wetlands
degradation
• Cultivation :Yams,
Maize Sugarcanes,
Rice
• Construction
especially in urban
areas
• Uncontrolled
excavation of sand
and clay
• Overgrazing & bush
burning
• Over exploitation of
wetland products
especially Palm
leaves and poles
• Deforestation
• Low awareness
• Inadequate
policies and
laws
• Lack of
coordination
• Conflicts and
rivalry
• Low technical
capacity
• Economic
reforms
• Reduced and
unreliable rain
fall
• Reduced soil
fertility
• Poor yields
• Loss of
biodiversity
• Floods
• Awareness creation
• Introduction of
appropriate
agricultural
technologies
• Environmental
inspections
• Participatory
Wetland Action
Planning
• Restoration
initiatives
Deforestation
• Competition with
other land use forms
e.g. Agriculture,
Settlements etc
• High demand for
charcoal, firewood,
poles, timber etc
• Inadequate
knowledge about the
values of forests and
trees and
implications of their
degradation
• Inefficient
harvesting &
utilization of wood.
• Inefficient fuel cook
stoves
• Inadequate law
Enforcement
• Poverty
• Increased
population
• Poor licensing
mechanism
• Loss of
biodiversity
• Loss of
employment
especially by
the youth
• Loss of water
catchment
areas
• Awareness creation
• Promotion of energy
saving technologies
• Promotion of
income generating
activities
• Tree planting
promotion
• Law enforcement
• Bye law / ordinance
formulation
• Stream line issue of
licensing
• Alternative sources
of energy
Poor solid
waste
Disposal
• No gazetted areas
for waste disposal
• Few skips / refuse
• Form an
enormous
public health
• Awareness creation
• Procurement of
more refuse bankers

Luweero District State Of Environment Report 2004
68
especially in
Town
Councils and
urban centres
bankers
• Roaming animals
• Bad habits of
disposal
• Large volumes of
refuse produced
[vegetable matter,
plastics, metal,
glass, paper,
polyethene etc]
• Abattoirs in poor
hygienic conditions
• Dumping in
wetlands and on
individual farms
and aesthetic
problems
• Accumulation
of buvera in
soil reduces or
abstracts
infiltration
process and
hence distorts
water
distribution
system in the
soil.
• Law enforcement
Overgrazing
especially in
sub-counties
of Ngoma,
Wakyato,
Kamira
• Communal grazing
• Many animals are
kept far beyond
carrying capacity
• Soil erosion
and siltation of
water sources.
• Awareness creation
Bush burning
• It is uncontrolled
• Emergence of
fire tolerant
species which
my not be
suitable for
pasture.
• Soil erosion
• Awareness creation
Soil erosion
• Inappropriate
farming techniques
• Devegetation
• Cultivation of the
fragile areas i.e.
steep slopes,
wetlands, forests.
• Reduce soil
fertility and
productivity.
♦ Food
insecurity
♦ Malnutriti
on
• Importation of
food
• Erosion
features e.g.
gullies
• Poverty
• Awareness creation
• Soil conservation
measures
• Law enforcement
• Environmental
inspections
• Environmental
planning
Vermins
problem
animals and
illegal
hunting
• Inadequate funding
• Lack of inspections
• Reduced
agricultural
productivity
• Vermins and
problem animals
control
• Regular inspections
• Funding
Poor health • Low pit latrine • Water borne, • Awareness creation

Luweero District State Of Environment Report 2004
69
and sanitation coverage - 57%
• Low accessibility to
safe water - 54%
• Poor nutrition
water -washed
and water
related diseases
e.g. diarrhea,
typhoid, skin
infections and
malaria.
• Law enforcement
• Increase
accessibility to safe
water
• Improve nutrition
Pollution
� Industrial
activities
� Noise
pollution
� Water
pollution
• Coffee hulling -
coffee dust, coffee
husks
• Grain milling -
flour moulds and
husks
• Garages -
motor oils, oil
filters, lubricants
• Metal fabrications
- metal scraps
• Wood/ carpentry -
wood dust, moulds
• Generators at petrol
stations, open
• Video show rooms,
local radios, open
sawn wood mills
• No architectural
treatment
• Mis- use of
Agrochemicals.
• Sedimentation
• Asthma,
allergic
alveolitis,
pricks
• Coughs,
occupational
asthma
• Lead
poisoning,
cancer
• Pricks
• Bronchial
asthma
• Hearing
impairment
• Eutrophication
• Poor water
quality
• Water related
diseases
• Awareness creation
• EIA/ Environmental
Audits
• Environmental
inspections
3.2 Trends of key environmental issues
• Deforestation particularly on private land is very high. Even if the current trends were
halted, it would take time to replace lost forests and trees. The biodiversity lost will never
be replaced.
• Massive degradation of wetlands particularly for rice growing. The forest swamps in
Semuto are highly modified and in some cases lost.
• Disease burden i.e. Malaria, HIV/ AIDS.
• Increased severity and number of pests and disease e.g. banana wilt, coffee wilt, foot and
mouth diseases. These threaten the districts economic prospects since her main source of
revenue is agriculture.

Luweero District State Of Environment Report 2004
70
• Poor waste management in Town Councils.
• Poverty among the communities and therefore increased dependence degradation of
natural resources.
3.3 Emerging issues and practices
• Promotion of rice growing and hence massive deforestation and encroachment on
wetlands.
• Improving cattle farms in unsustainable manner and has encouraged massive
deforestation and charcoal burning.
• Negative propaganda against immunization programmes.
• Growing concern within the communities about the safety and reliability of condoms on
the market.
3.4 Policy response
In general Uganda has had a number of policy responses to address environmental issues. Many
new policies, strategies and action plans, laws and regulations have been introduced. The country
has a very progressive Constitution that provides for the right of every citizen to a clean and
healthy environment. There is in place a comprehensive national environment management
policy that promotes the use of economic instruments, public participation and environmental
information and education. Others include the Vision 2025, Poverty Eradication Action Plan
(PEAP), and Plan for Modernization of Agriculture (PMA). Table 3.2 below shows key
environmental and other related sectoral policies.

Luweero District State Of Environment Report 2004
71
Table 3.2: Key environmental and other sectoral policies
Policy Goal(s)
National Environment
Management Policy 1995 • Sustainable social and economic development
which maintains or enhances environmental quality
and resource productivity on a long term basis that
meets the present generation without compromising
the ability of future generation to meet their own
needs.
National Policy for the
Conservation and Management of
Wetlands Resources 1995
• Establish the principles by which wetlands
resources can be optimally used now and in the
future.
• To end practices which reduce wetlands
productivity.
• To maintain the biological diversity of natural or
semi-natural wetlands
• To maintain wetlands function and values
• To integrate wetlands concerns into the planning
and decision making of other sectors
The Draft National Soils Policy for
Uganda 2000 • To streamline soil management methods
(framework).
• To improve and maintain soil quality and
productivity on a sustainable basis.
Water Policy 1995 • To sustainably manage and develop the water
resources in a coordinated and integrated manner so
as to secure / provide water of an acceptable quality
for all social and economic needs.
Wildlife Policy 1995 • To conserve in perpetuity the resource within the
national parks and other wildlife areas, and to
enable the people of Uganda and the global
community to derive ecological, economic,
aesthetic, scientific and educational benefits from
wildlife.
• To generate revenue to support these conservation
efforts and hereby contribute to the national
economy.
The Forest Policy 2001 • An integrated forest sector that achieves sustainable
increases in the economic, social and environmental
benefits from forests and trees by all the people of
Uganda, especially the poor and vulnerable.
The Draft National Fisheries
Policy • To ensure increased and sustainable fish production
and utilization by properly managing capture
fisheries, promoting aquaculture and reducing post-
harvest losses.
(SOER 2000/2001)

Luweero District State Of Environment Report 2004
72
3.5 Environment Institutional structures and reforms
National Environment Management Authority (NEMA)
This institution was created by the National Environment Statute 1995. NEMA is mandated to
monitor, supervise and coordinate environmental matters in Uganda. NEMA works together with
Local Governments, civil society, communities and development partners. NEMA relates
horizontally with other sectors as provided for in the National Environment Act CAP 153 and
links vertically with local Governments through the Local Government Act 1997.
Central Government functions
1. National Policy formulation and guidance
2. National Legislation and regulation
3. Standards and Quality Control
4. Monitoring / Inspection and supervision
5. Capacity building
Local Governments
Both the National Environment Act CAP 153 and the Local Government Act 1997 provide for
the devolution of environmental management activities to the districts and Lower Local
Governments. These Local Governments are directly responsible for financing environmental
management activities in their respective jurisdictions.

Luweero District State Of Environment Report 2004
73
Fig. 3.1: Structure of decentralized environmental management in Uganda
National Environment Management Authority
District Support Coordination Unit
District Council
Other Sectoral
Committees
District Environment District District
Committee Technical Environment
Planning Officer
Committee
Sub-county Environment Committee
Parish Environment Committee
Village Environment Committee
Specific decentralized environment functions
1. Soil conservation
2. Control and management of bush fires
3. Management of waste and environment sanitation
4. Protection and maintenance of local water resources
5. Provision of water services
6. Management of quarrying of stones, lime, clay and murram
7. Management and protection of local forests, lakeshores, river banks and streams
Functions of Local Governments
• Planning
• Raising public awareness,
• Mobilization and monitoring environment related issues.

Luweero District State Of Environment Report 2004
74
But the capacity at Local Government level is weak and most lower Local Environment
Committees are not functional.
The functions of the District Council
• Set long range development goals for the District
• Based on analysis of alternative options presented by DTPC set objectives for 3-5 years
District Development Plan (DDP).
• Facilitate the DTPC in formulation of District Development Plan
• Ensure that environment impact of DPP has been considered before approval and
implementation.
• Debate and approve the District Environment Action Plan and bye-laws.
• Communicate plans to adjacent Districts, sub-counties, NEMA and line ministries.
• Over see the implementation of plans.
Functions of the District Environment Committee (DEC)
• To coordinate the activities of the District Council relating to the management and
natural resources.
• To ensure that environmental concerns are integrated in all plans and projects approved
by the District Council.
• To assist the development and formulation of byelaws relating to the management of the
environment.
• To promote the dissemination of information about the environment through education
and out reach programs.
• To coordinate with NEMA on all issues relating to environment management.
• To coordinate the activities of Local Environment Committees (LECs) in the
management of the environment.
• To receive reports from the Local Environment Committees and advise the Local
Environment Committees.
• To prepare a district state of the environment report every year.
Functions of the Lower Local Committees (LECs)
• To prepare a local environment work plan which shall be consistent with the National
Environment Action Plan and the District Action Plan.
• To carry out public environment education campaigns.
• To mobilize the people with in its local jurisdiction to conserve natural resources through
self help.
• To mobilize people within its local jurisdiction to restore degraded environmental
resources through self help.
• To mobilize people within its local jurisdiction to improve their natural environment
through voluntary self help.
• To monitor all activities within its local jurisdiction to ensure that such activities do not
have any significant impact on the environment.

Luweero District State Of Environment Report 2004
75
• To report any events or activities which have or are likely to have significant impacts on
the environment to the District Environment Officer or to the appropriate executive
committee, local council or such other person as the District Council may direct.
• To carry out such other duties as may be prescribed by the District Council or Urban
Council in consultation with the Authority.
3.6 Public Participation
Broad public participation in decision making is an important element of Agenda 21 because,
combined with greater accountability, it is a basis to the concept of sustainable development.
The right of the public to participate in environmental matters is enshrined in the Constitution
1995, the various sectoral statutes; the National Environment Statute 1995, the Local
Government Act 1997.
Under decentralized environment management, the District Environment Committee is mandated
to ensure free and open participation of the community in its deliberations and in formulation of
bye-laws.
3.7 Community participation in District planning
Environmental mainstreaming
Environmental mainstreaming is an active process of understanding the environmental context of
development planning, identifying potential impacts and mitigation measures, budgeting for
mitigation measures and monitoring implementation of mitigation activities of development
programmes to ensure sustainable development.
Importance of mainstreaming environment into development plans
♦ To reduce servicing cost of investment
♦ To reduce negative impacts of investments on the people and the environment
♦ To promote wise use of natural resources
The District and Sub-county Local Governments are charged with development planning
including environmental management in accordance with the Local Government Act 1997.
Environmental mainstreaming in principle follows the process of developing the development
plans that begins at the parish level through a participatory approach. Environmental
mainstreaming takes place during planning, implementation and evaluation of the project cycle.
The National Environment Act CAP 153 Section 15 (2)– b state that the function of the District
Environment Committee shall ensure that environmental concerns are integrated in all plans and
projects approved by the District Council.
The DDP guidelines from MoLG provide that:

Luweero District State Of Environment Report 2004
76
♦ In the preparation of the DDP document, the Local Government should indicate in the
introductory chapter, environmental quality indicators with respect to the national standards,
regional, inter-district and intra-district levels.
♦ Data should be collected on wetlands, forests, land use, and wildlife and water resources to
provide a basis for development planning.
♦ Environmental issues are considered as crosscutting in all sectoral plans. The LGDP II
assessment manual has strengthened this provision by making environmental integration in
the sectoral plans as one of the quality indicators of the DDP.
Under the LGDP II operations manual, it is also a requirement that during monitoring and
reporting, all projects planned and implemented should be assessed for their compliance to
environmental standards as a performance measure.
Public input into district planning is encouraged through:
• Normal presentation in council structures: District Environment Committee (DEC),
Development Committees, District Council.
• Active solicitation of public views on district plans
• Solicitation of public views on new activities using the EIA scoping process
• Placing responsibility for natural resource management on the communities through bye-
laws that encourage locally made natural resource plans or activities.
• Educating public on environmental issues and planning procedures.
• Provide incentives for community involvement in environmental planning.
3.8 Environmental Information and Education
Environmental information
An effective natural resources and environmental information system is needed to facilitate
the collection, storage, analysis and dissemination of environmental information as a key
component for developing a regular monitoring and evaluation of environmental activities. In
order to monitor the dynamics in the quality of Uganda’s environment, the NEAP process
identified the following core datasets and subsequent efforts to address environmental
information have been focusing on them.
• Demographic data
• Agricultural information and farming systems
• Energy consumptions patterns and availability
• Soils, water, protected areas and biodiversity
• Climate and topographic information
• Infrastructure and general socioeconomic trends
• Land use and land use changes
Under the National Environment Act CAP 153 the Districts are obligated to prepare District
State Of Environment Reports annually.

Luweero District State Of Environment Report 2004
77
Environmental Education
Environment Education is a life process of teaching and learning about the environment in
order to acquire knowledge skills and attitudes necessary to understand and appreciate the
inter-relatedness among people, their culture and biophysical surroundings for the purpose of
developing responsibility for life, resources and development of present and future
generations.
The main goals of environment education
• To foster the awareness of and concerns about the economic, social, political and
ecological independence in urban and rural areas.
• To provide every person with opportunity to acquire knowledge, values, attitudes,
commitment and skills needed to protect the environment.
• To create new patterns of behavior of individuals, groups and society as a whole towards
the environment.
Objectives of Environment Education
• Awareness
To acquire an awareness of and sensitivity to the total environment and its allied
problems.
• Knowledge
To attain a variety of experience in and acquire a basic understanding of the environment
and its associated problems.
• Attitude
To help people acquire a set of values and feelings of concern for the environment and
motivation for actively participating in environmental improvement and protection.
• Skills
To acquire the skills for identifying and solving environmental problems.
• Participation
To provide an opportunity to be actively involved at all levels in working towards
resolution of environmental problems.
Awareness and training has been done for the communities, technical staff school
environment coordinators, school inspectors and head teachers and political leaders in the
District in the following fields:
• Environment management and environment impact assessment and audit.
• Environment management tools for NGOs and CBOs.
• Formal and non-formal education for schools and communities.
• Bye-law formulation and enforcement
• District State Of Environment reporting and environment information management.
• Environment awareness for communities

Luweero District State Of Environment Report 2004
78
The figures below show stakeholders participating in environment training workshop and pupils
interpreting a wetland poster.
Fig. 3.2: Participants in Environment Fig. 3.3: Pupils of Luwero Boys interpreting
management workshop a wetland planning poster
Source: Environment Department (2004)
Fig. 3.4: Participants making Lorena energy Fig. 3.5: Participant finishing Lorena
saving stove energy saving stove
Source: Environment Department (2004)
3.9 Implementation of environment and sectoral policies and government interventions
3.9.1 Establishment of Environment Department
The Environment Department was created in 1999 and its major objective is to increase the
District’s capacity to plan and implement environmental programmes leading to better economic
and social development while maintaining or improving the environment.

Luweero District State Of Environment Report 2004
79
3.9.2 Achievements realized by Environment Department
• Functional District Environment Committee
• Environment awareness creation among the communities, NGOs, leaders and schools
• Capacity building in environment management
• Conduct wetlands inventory and compilation of wetland status report
• Environmental mainstreaming in development plans and programs
• Promote Formal Environment Education in Schools (fig…..)
• Enforcing environmental laws and regulations
• Initiate environmental ordinance formulation process
• Promotion of environmental restoration initiatives particularly by NGOs.
• Maintaining linkages between the District and NEMA, Wetlands, NGOs and other
organizations.
3.10 National Agricultural Advisory Services (NAADS)
NAADS is a new programme in the Ministry of Agricultural Animal Industry and Fisheries
(MAAIF) created under the Plan for modernisation of Agriculture (PMA), as one of the
government efforts to reduce poverty. The programme is responsible for provision of
agricultural advice to farmers. It gives farmers, particularly the poor, women, youths and people
with disabilities (PWDS), powers to ask for advisory services for their priority enterprises.
In the past, farmers have been waiting for extension workers to bring services to them but now,
the farmers have to identify the advice they need and contract the person or firm or company to
provide it.
NAADS was established under an Act of Parliament i.e. The National Agricultural Advisory
Services Act 2001. The Act States:-
An Act to provide for the establishment of an organization known as the National Agricultural
Advisory Services ( NAADS), its composition , functions and administration, for the promotion
of market oriented agriculture , and to provide for other related and incidental matter”.
NAADS vision
A decentralized, farmer- owned and private sector serviced extension delivery system
contributing to the realization of the agriculture sector development objectives.
NAADS mission
To increase farmer access to information , knowledge and technology for profitable agricultural
production.
NAADS guiding principles.
� Farmer empowerment.
� Fostering participatory processes.
� Targeting agricultural services to the poor.

Luweero District State Of Environment Report 2004
80
� Mainstreaming gender.
� Deepening decentralisation.
� Market oriented farming ( as a business)
� Intensifying productivity and specialization.
� Managing natural resource productivity.
� Increasing institutional efficiency.
� Contracting out services.
� Better linkages ( research – advisors – farmers)
� Harmonization with in PMA principles
NAADS components
� Advisory and information services to farmers.
� Technology development and linkages with markets.
� Quality assurance of services.
� Private sector institutional development.
� Programme management and monitoring.
NAADS operational sub-counties in Luwero District.
NAADS programme started being implemented in the FY 2002/2003 with the following sub-
counties:-
� Bamunanika
� Katikamu
� Butuntumula
� Kapeeka
� Ngoma
In the FY 2003/2004 two other sub-counties were brought on board i.e. Kasangombe and
Luwero.
The programme operates in all the parishes of the above sub-counties.
Integration of Natural Resources and environment concerns in the NAADS program
Sustainable natural resources and environment management is a key principle of NAADS
program.
Natural resources and environment concerns are integrated in the NAADS activities shown
below:
• Farmer institution development
• Advisory services delivery

Luweero District State Of Environment Report 2004
81
• Capacity building of service providers and Subject Matter Specialists
• Awareness creation
• Enterprise selection
• Terms Of reference and specification development
• Monitoring and evaluation
Natural resources and environment based enterprise development and promotion
Environmentally friendly enterprises promoted under NAADS include apiary, fish farming,
agroforestry, fruit tree growing as shown in the figures below.
Fig. 3.4: Fish farming Technology Fig. 3.5: Apiary Technology Development Site
Development Site at Kikoma, at Kakinzi, Butuntumula Sub-county
Katikamu Sub-county
Source: Environment Department (2004)
Key challenges / constraints in natural resources integration
• Inadequate appreciation of the benefits to be derived from natural resources management
due to lack of information.
• Capacity of NGOs to guide farmers in natural resources integration during enterprise
selection
• Availability of competent service providers in natural resources management
• Inadequate implementation of environment mitigation measures specified in the terms of
references
Luweero District State Of Environment Report 2004
82
Lessons learned
• Focused awareness creation of the viability of natural resources and environmentally
friendly enterprises among stakeholders is paramount.
• Partnership approach by concerned stakeholders will yield positive results faster.
• In-depth understanding and pro-active participation of Local Governments, NGOs and
service providers in the development and promotion of natural resources and
environment management is crucial.
3.11 Zonal Agricultural Production in the District
Zonal agricultural production refers to production where varied agro-ecological zones are
organized and encouraged to specialize in commodities / enterprises.
Agricultural Zone
An agricultural zone is a broad area with similar socio-economic background and in which
ecological conditions, farming systems and practices are fairly homogenous.
Benefits of zonal agricultural production
• Enhances economies of scale in production, agro-processing and exploration of markets
(domestic, regional and international)
• Enhances efficient delivery of advisory and other support technologies, services
• Enhances effective accessibility to sustained product volumes for marketing
• Improves market access and marketing efficiency
• Enhances exploitation of comparative and competitive advantages resulting into reduced
transaction costs are also achieved with agricultural zoning.
Key factors considered when zoning
• Agro-ecology
• Farming systems / management
• Socio-economic factors
• Geo-politics
• Infrastructure
• Land
• On-going agriculture based programmes / initiatives
Key factors considered when selecting enterprise by zone
• Agro-ecological environment
• Profitability
• Export potential
• Infrastructure for production, processing and marketing
• Potential for value addition
• Land size and tenure
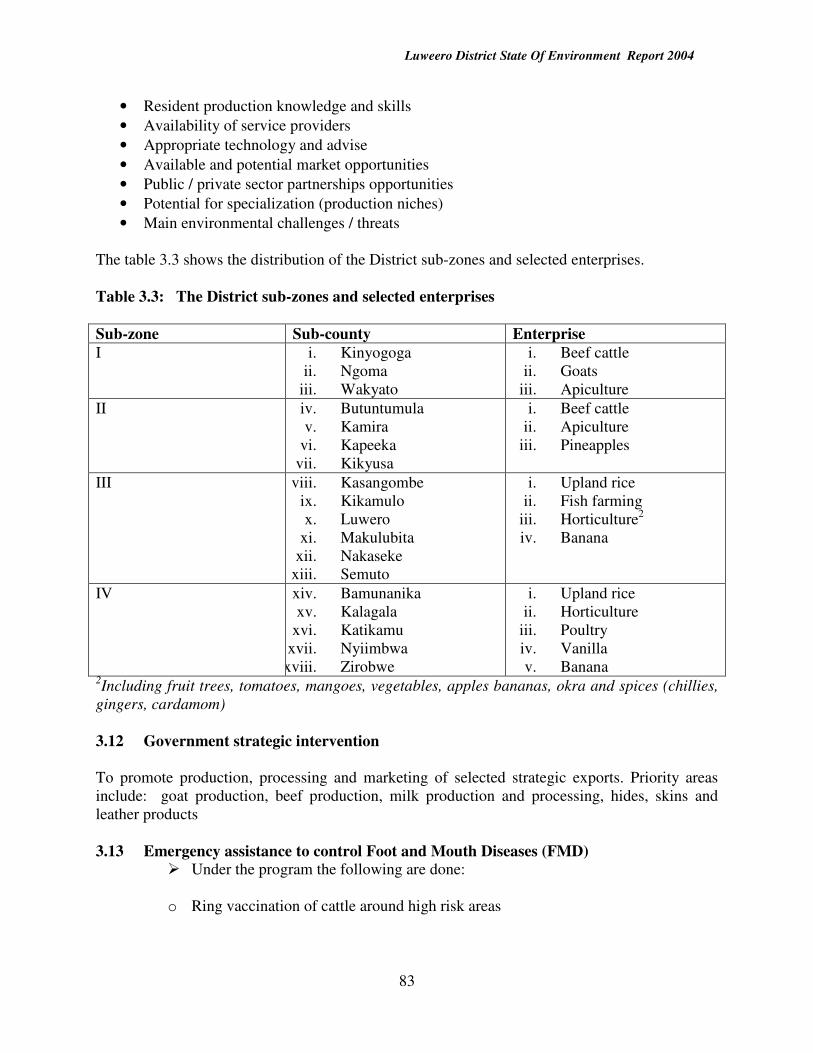
Luweero District State Of Environment Report 2004
83
• Resident production knowledge and skills
• Availability of service providers
• Appropriate technology and advise
• Available and potential market opportunities
• Public / private sector partnerships opportunities
• Potential for specialization (production niches)
• Main environmental challenges / threats
The table 3.3 shows the distribution of the District sub-zones and selected enterprises.
Table 3.3: The District sub-zones and selected enterprises
Sub-zone Sub-county Enterprise
I i. Kinyogoga
ii. Ngoma
iii. Wakyato
i. Beef cattle
ii. Goats
iii. Apiculture
II iv. Butuntumula
v. Kamira
vi. Kapeeka
vii. Kikyusa
i. Beef cattle
ii. Apiculture
iii. Pineapples
III viii. Kasangombe
ix. Kikamulo
x. Luwero
xi. Makulubita
xii. Nakaseke
xiii. Semuto
i. Upland rice
ii. Fish farming
iii. Horticulture2
iv. Banana
IV xiv. Bamunanika
xv. Kalagala
xvi. Katikamu
xvii. Nyiimbwa
xviii. Zirobwe
i. Upland rice
ii. Horticulture
iii. Poultry
iv. Vanilla
v. Banana 2Including fruit trees, tomatoes, mangoes, vegetables, apples bananas, okra and spices (chillies,
gingers, cardamom)
3.12 Government strategic intervention
To promote production, processing and marketing of selected strategic exports. Priority areas
include: goat production, beef production, milk production and processing, hides, skins and
leather products
3.13 Emergency assistance to control Foot and Mouth Diseases (FMD)
� Under the program the following are done:
o Ring vaccination of cattle around high risk areas

Luweero District State Of Environment Report 2004
84
o Establishment of epidemic surveillance network to ensure rapid identification of
new foci of infection
o Quarantine and movement control to contain the spread of infection from
outbreak areas by infected livestock, livestock products and disease vectors
o Mandatory reporting by the Veterinarians and farmers of any occurrence to
prevent spread
o Sensitization of all stakeholders i.e. Butchers, Farmers, Livestock traders,
transporters and Local authorities.

Luweero District State Of Environment Report 2004
85
3.14 NGOs and CBOs Environmental initiatives
The table 3.4 below shows the NGOs and CBOs that implement environment activities in the
District.
Table 3.4: NGOs and CBOs Environmental initiatives NGO / CBO Area of
operation Field of operation
Plan International / JEEP
Bamunanika and Katikamu Counties, Makulubita Sub-county
• Classroom construction
• Provision of scholastic materials/instructional Material.
• Desk / furniture
• Water tanks provision
• Environmental awareness, Energy saving technologies promotion, tree planting, exchange visits
AMREF Butuntumula • Supporting orphans
• HIV/AIDS/STIs/TB, Malaria control,
• Safe water and basic sanitation,
• Family health
• Construction of classrooms
• Provision of desks
• Education
• Micro credit promotion VEDCO Bamunanika,
Katikamu & Nakaseke counties
• Sustainable Agriculture
• Income generating activities
• Agro forestry
• Tree nurseries CARITAS KASANAENSIS
All Sub-counties
• Sustainable agriculture
• Agricultural competitions
• Income generating activities World Vision Kasangombe,
Nakaseke, Kapeeka
• Classroom and teachers construction
• Water tanks provision
• Instructional materials
• Supply desks
• HIV / AIDS
• Sustainable agriculture LUDFA All Sub-
counties Agroforestry, soil & water conservation, study tours, Sustainable Agriculture
LEMA All sub-county
Environment capacity building, advisory services, agro forestry, wood lot and plantation establishment tree nurseries establishment.
ADRA Butuntumula, Bamunanika, Katikamu, Wobulenzi, Nyimbwa, Bombo
Environmental awareness, agro forestry, nursery establishment, biogas technology, sustainable agriculture, FAL.
ACEPA Nyimbwa Environmental awareness, tree nursery establishment, formal environmental education promotion
Environment Department (2004)

Luweero District State Of Environment Report 2004
86
4.0 Recommendations
• Awareness creation on environmental issues especially among the communities should be
intensified.
• Promotion of appropriate agricultural technologies in order to address wetland conversion
and deforestation.
• Capacity building of Lower Local Environment Committees and ensure that they are
functional.
• Promote restoration initiatives (re-forestation, energy saving technologies, soil and water
conservation measures)
• Promotion of income generating activities to alleviate poverty among the communities
that are heavily dependant on natural resources.
• Ensure environmental mainstreaming in development plans and programs
• Enforce environmental laws and regulations.
• Ensure regular environmental monitoring and inspection.
• Provide adequate funds for environmental activities.
• Intensify collaborations among different stakeholders in environment management

Luweero District State Of Environment Report 2004
87
References
1. Luwero District Development plan 2004-2007
2. District Departmental Reports 2004
3. National Wetlands Programme (1999/2000). Luwero District wetland inventory report.
4. Government of Uganda (1998). The Land Act 1998. Uganda Printing and Publishing
Corporation. Entebbe Uganda.
5. Government of Uganda (2000). The National Environment (Wetlands, River Banks,
Lakeshores Management) Regulations 2000. Kampala, Uganda.
6. Ministry of Water, Lands and Environment 2001Forest Policy. Kampala, Uganda.
7. NEMA (1999). State of Environment Report for Uganda 1998.
8. NEMA (2001). State of Environment Report for Uganda 2000/2001.

Luweero District State Of Environment Report 2004
88
ANNEX 1: Education information
1. School enrollment by gender per sub-county
Pupils by Gender and Class per Sub-County (2003)
County Subcounty Sex Class
P 1 P 2 P 3 P 4 P 5 P 6 P 7 Total
Bam Bam Male 1,113 590 617 648 586 527 279 4,360 Female 1,166 586 667 648 627 520 296 4,510 Total 2,279 1,176 1,284 1,296 1,213 1,047 575 8,870
Kalagala Male 1,379 721 797 781 733 682 379 5,472 Female 1,318 751 784 806 767 709 470 5,605 Total 2,697 1,472 1,581 1,587 1,500 1,391 849 11,077
Kamira Male 930 433 413 396 339 279 147 2,937 Female 907 415 445 410 348 253 149 2,927 Total 1,837 848 858 806 687 532 296 5,864
Kikyusa Male 1,031 503 463 414 355 248 146 3,160 Female 1,056 531 507 453 388 299 171 3,405 Total 2,087 1,034 970 867 743 547 317 6,565
Zirobwe Male 1,695 959 892 848 754 642 400 6,190 Female 1,660 970 853 879 818 737 413 6,330 Total 3,355 1,929 1,745 1,727 1,572 1,379 813 12,520
Kat Bombo T/ C Male 808 555 652 535 459 405 219 3,633 Female 818 498 569 547 557 433 224 3,646 Total 1,626 1,053 1,221 1,082 1,016 838 443 7,279
Butuntumula Male 1,745 994 954 845 706 620 314 6,178 Female 1,766 1,059 941 965 732 652 317 6,432 Total 3,511 2,053 1,895 1,810 1,438 1,272 631 12,610
Katikamu Male 1,440 772 823 775 657 517 365 5,349 Female 1,329 662 719 663 563 450 340 4,726 Total 2,769 1,434 1,542 1,438 1,220 967 705 10,075
Luwero Male 1,534 673 678 673 543 494 326 4,921 Female 1,458 672 683 666 645 588 346 5,058 Total 2,992 1,345 1,361 1,339 1,188 1,082 672 9,979
Luwero T/C Male 622 442 462 559 525 484 305 3,399

Luweero District State Of Environment Report 2004
89
Female 732 491 497 610 580 583 380 3,873 Total 1,354 933 959 1,169 1,105 1,067 685 7,272
Makulubita Male 977 630 626 648 582 432 220 4,115 Female 1,007 681 671 642 594 531 276 4,402 Total 1,984 1,311 1,297 1,290 1,176 963 496 8,517
Pupils by Gender and Class per Sub-County (2003)
County Subcounty Sex Class
Primary 1 Primary 2 Primary 3 Primary 4 Primary 5 Primary 6 Primary 7 Total
Nyimbwa Male 1,036 630 601 554 571 479 342 4,213 Female 1,005 575 603 633 591 538 346 4,291 Total 2,041 1,205 1,204 1,187 1,162 1,017 688 8,504
Wobulenzi T/C Male 1,090 597 633 661 643 512 338 4,474 Female 1,218 606 705 705 796 629 430 5,089 Total 2,308 1,203 1,338 1,366 1,439 1,141 768 9,563
Nak Kasangombe Male 1,108 512 530 558 442 367 196 3,713 Female 1,013 504 539 591 467 349 237 3,700 Total 2,121 1,016 1,069 1,149 909 716 433 7,413
Kapeeka Male 1,401 651 702 648 555 428 253 4,638 Female 1,448 711 654 665 586 419 220 4,703 Total 2,849 1,362 1,356 1,313 1,141 847 473 9,341
Kikamulo Male 1,124 539 524 517 418 328 190 3,640 Female 1,208 559 530 539 421 333 209 3,799 Total 2,332 1,098 1,054 1,056 839 661 399 7,439
Kinyogoga Male 26 29 12 15 19 9 0 110 Female 36 10 18 14 15 8 0 101 Total 62 39 30 29 34 17 0 211
Male 862 353 358 389 294 264 154 2,674 Nakaseke Female 936 389 408 398 357 293 182 2,963 Total 1,798 742 766 787 651 557 336 5,637
Ngoma Male 742 507 399 345 274 180 101 2,548 Female 831 565 466 410 323 215 101 2,911 Total 1,573 1,072 865 755 597 395 202 5,459
Semuto Male 1,254 748 708 740 645 561 365 5,021 Female 1,335 739 784 751 723 623 449 5,404 Total 2,589 1,487 1,492 1,491 1,368 1,184 814 10,425
Wakyato Male 715 354 317 293 261 192 121 2,253
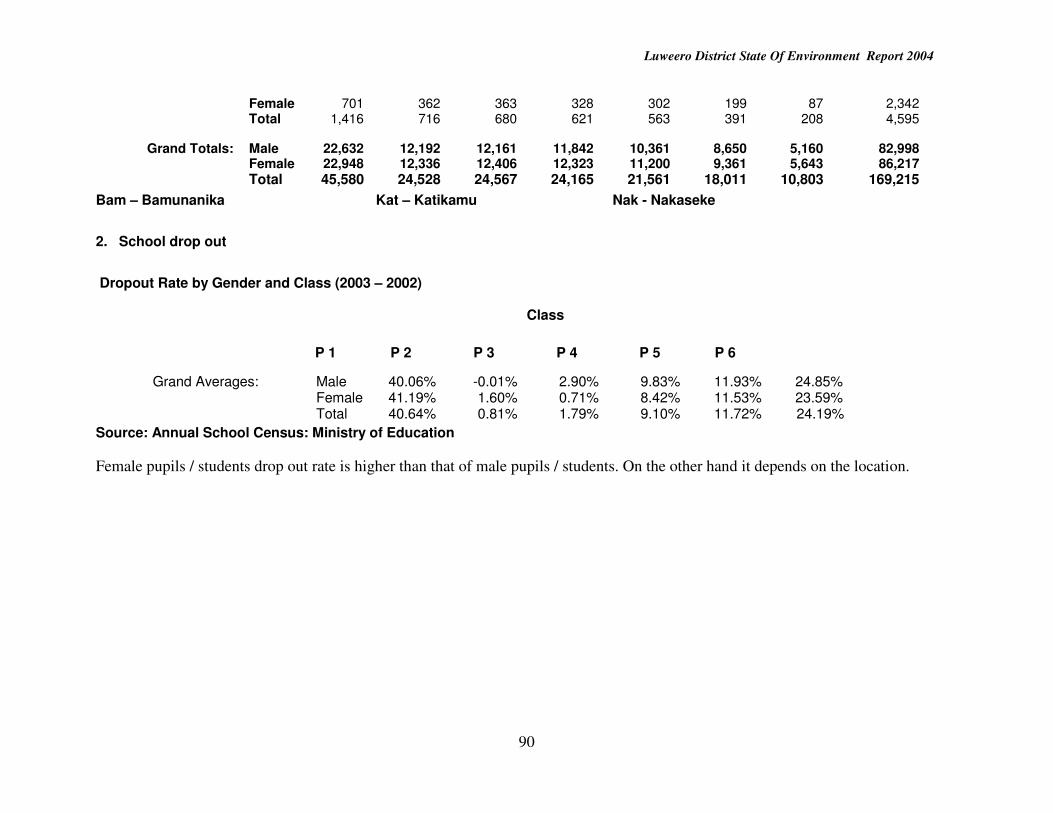
Luweero District State Of Environment Report 2004
90
Female 701 362 363 328 302 199 87 2,342 Total 1,416 716 680 621 563 391 208 4,595
Grand Totals: Male 22,632 12,192 12,161 11,842 10,361 8,650 5,160 82,998 Female 22,948 12,336 12,406 12,323 11,200 9,361 5,643 86,217 Total 45,580 24,528 24,567 24,165 21,561 18,011 10,803 169,215
Bam – Bamunanika Kat – Katikamu Nak - Nakaseke
2. School drop out
Dropout Rate by Gender and Class (2003 – 2002) Class
P 1 P 2 P 3 P 4 P 5 P 6
Grand Averages: Male 40.06% -0.01% 2.90% 9.83% 11.93% 24.85% Female 41.19% 1.60% 0.71% 8.42% 11.53% 23.59% Total 40.64% 0.81% 1.79% 9.10% 11.72% 24.19%
Source: Annual School Census: Ministry of Education
Female pupils / students drop out rate is higher than that of male pupils / students. On the other hand it depends on the location.

Luweero District State Of Environment Report 2004
91
3. Pupil to Teacher ratio
Pupil : Teacher Ratios per sub County for all Schools
County Subcounty Students Total Teachers Pupil Teacher Ratio
Bamunanika Bamunanika 8,870 181 49
Kalagala 11,077 266 42
Kamira 5,864 119 49
Kikyusa 6,565 140 47
Zirobwe 12,520 280 45
Katikamu Bombo T/C 7,279 148 49
Butuntumula 12,610 273 46
Katikamu 10,075 246 41
Luwero 9,979 205 49
Luwero T/C 7,272 210 35
Makulubita 8,517 159 54
Nyimbwa 8,504 190 45
Wobulenzi T/C 9,563 235 41
Nakaseke Kaasangombe 7,413 165 45
Kapeeka 9,341 183 51
Kikamulo 7,439 166 45
Kinyogoga 211 5 42
Nakaseke 5,637 117 48
Ngoma 5,459 103 53
Semuto 10,425 228 46
Wakyato 4,595 92 50
Grand Totals and Average: 169,215 3,711 46

Luweero District State Of Environment Report 2004
92
4. Pupil: Classroom ratio for all Schools per Sub County
County Subcounty
County Subcounty Total Students Total Classrooms Pupil:Classroom
Bamunanika Bamunanika 8,870 129 68.76
Kalagala 11,077 179 61.88
Kamira 5,864 87 67.40
Kikyusa 6,565 59 111.27
Zirobwe 12,520 173 72.37
Katikamu Bombo T/C 7,279 97 75.04
Butuntumula 12,610 197 64.01
Katikamu 10,075 193 52.20
Luwero 9,979 159 62.76
Luwero T/C 7,272 156 46.62
Makulubita 8,517 149 57.16
Nyimbwa 8,504 147 57.85
Wobulenzi T/C 9,563 161 59.40
Nakaseke Kaasangombe 7,413 99 74.88
Kapeeka 9,341 134 69.71
Kikamulo 7,439 92 80.86
Kinyogoga 211 0 0.00
Nakaseke 5,637 83 67.92
Ngoma 5,459 66 82.71
Semuto 10,425 171 60.96
Wakyato 4,595 61 75.33
National Totals and Average 169,215 2,592 65.28
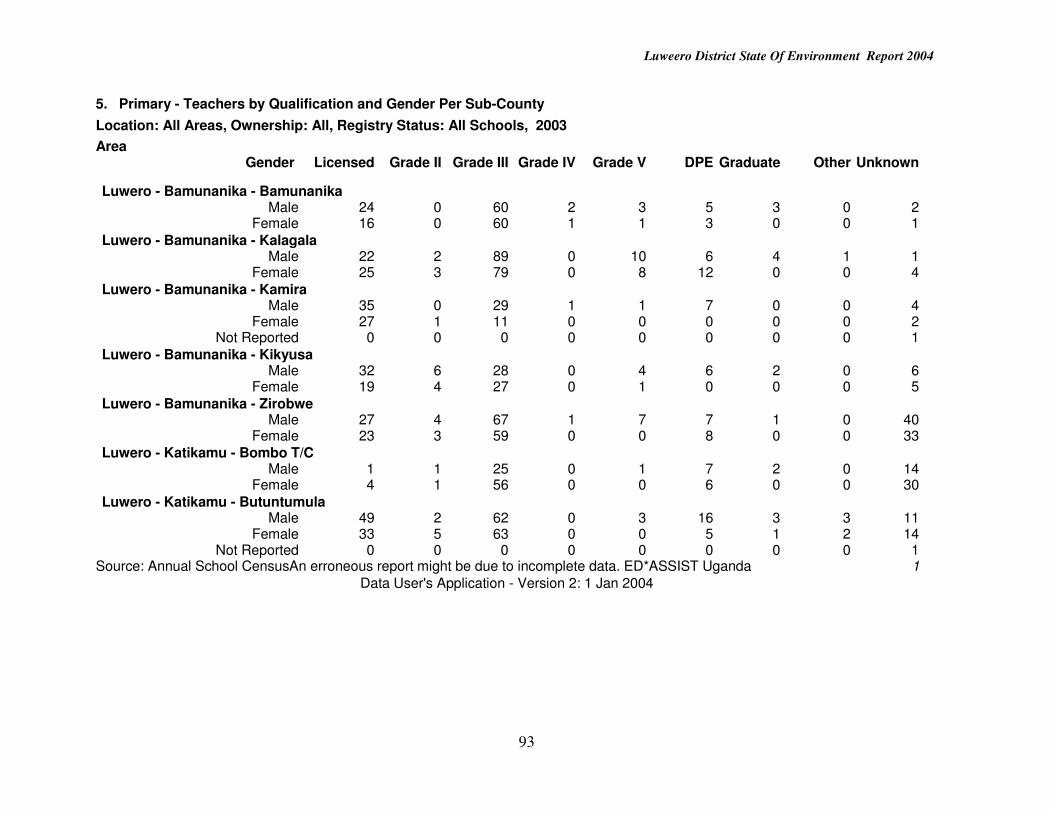
Luweero District State Of Environment Report 2004
93
5. Primary - Teachers by Qualification and Gender Per Sub-County
Location: All Areas, Ownership: All, Registry Status: All Schools, 2003
Area Gender Licensed Grade II Grade III Grade IV Grade V DPE Graduate Other Unknown
Luwero - Bamunanika - Bamunanika Male 24 0 60 2 3 5 3 0 2 Female 16 0 60 1 1 3 0 0 1
Luwero - Bamunanika - Kalagala Male 22 2 89 0 10 6 4 1 1 Female 25 3 79 0 8 12 0 0 4
Luwero - Bamunanika - Kamira Male 35 0 29 1 1 7 0 0 4 Female 27 1 11 0 0 0 0 0 2 Not Reported 0 0 0 0 0 0 0 0 1
Luwero - Bamunanika - Kikyusa Male 32 6 28 0 4 6 2 0 6 Female 19 4 27 0 1 0 0 0 5
Luwero - Bamunanika - Zirobwe Male 27 4 67 1 7 7 1 0 40 Female 23 3 59 0 0 8 0 0 33
Luwero - Katikamu - Bombo T/C Male 1 1 25 0 1 7 2 0 14 Female 4 1 56 0 0 6 0 0 30
Luwero - Katikamu - Butuntumula Male 49 2 62 0 3 16 3 3 11 Female 33 5 63 0 0 5 1 2 14 Not Reported 0 0 0 0 0 0 0 0 1 Source: Annual School CensusAn erroneous report might be due to incomplete data. ED*ASSIST Uganda 1
Data User's Application - Version 2: 1 Jan 2004

Luweero District State Of Environment Report 2004
94
Primary - Teachers by Qualification and Gender Per Sub-County
Location: All Areas, Ownership: All, Registry Status: All Schools, 2003
Area Gender Licensed Grade II Grade III Grade IV Grade V DPE Graduate Other Unknown
Luwero - Katikamu - Katikamu Male 16 3 57 3 10 11 5 2 0 Female 20 2 95 4 5 4 1 0 8
Luwero - Katikamu - Luwero Male 30 2 55 1 8 13 1 0 3 Female 26 0 57 2 1 1 1 0 4
Luwero - Katikamu - Luwero T/C Male 11 0 48 0 3 7 2 1 21 Female 4 4 65 0 4 1 0 5 33 Not Reported 0 0 0 0 0 0 0 0 1
Luwero - Katikamu - Makulubita Male 23 3 35 1 10 5 1 0 5 Female 20 3 41 1 2 7 2 0 0
Luwero - Katikamu - Nyimbwa Male 9 0 45 4 10 4 4 0 3 Female 8 1 67 6 6 10 1 0 11 Not Reported 0 0 0 0 0 0 0 0 1
Luwero - Katikamu - Wobulenzi T/C Male 7 0 56 5 3 12 5 0 4 Female 14 1 88 8 9 13 2 2 6
Luwero - Nakaseke - Kaasangombe Male 14 0 41 0 1 7 1 0 31 Female 7 0 35 0 1 0 0 0 27 Source: Annual School CensusAn erroneous report might be due to incomplete data. ED*ASSIST Uganda 2
Data User's Application - Version 2: 1 Jan 2004
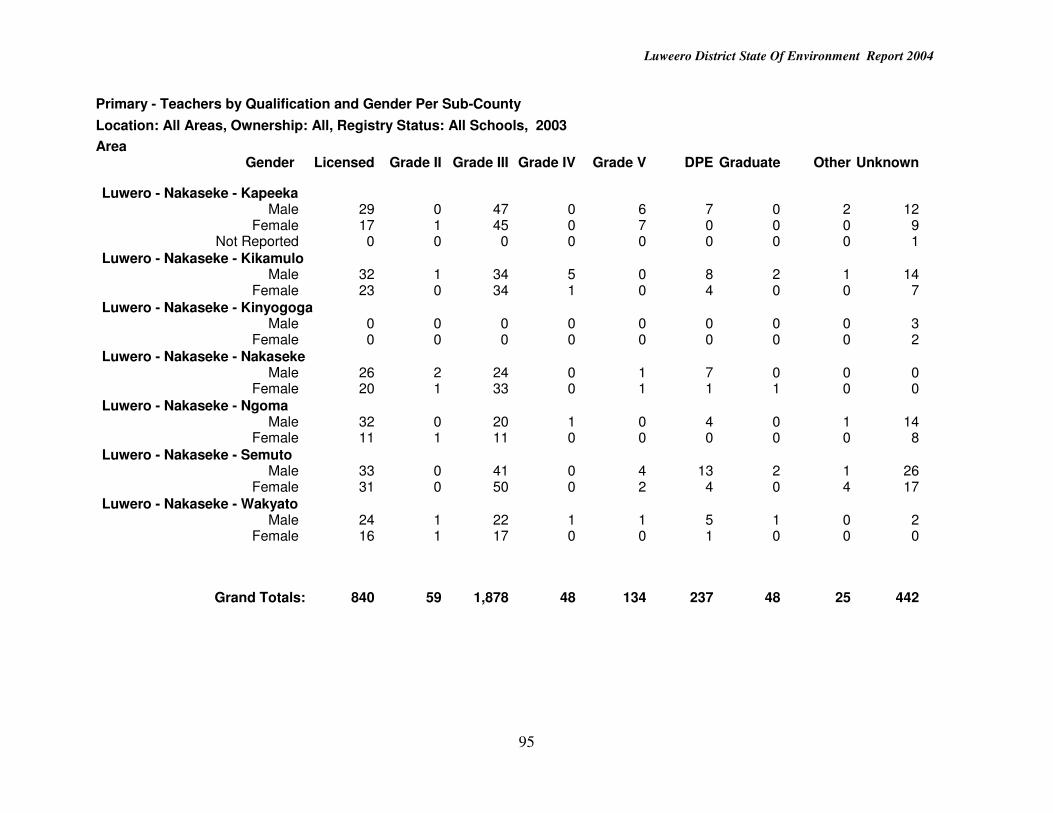
Luweero District State Of Environment Report 2004
95
Primary - Teachers by Qualification and Gender Per Sub-County
Location: All Areas, Ownership: All, Registry Status: All Schools, 2003
Area Gender Licensed Grade II Grade III Grade IV Grade V DPE Graduate Other Unknown
Luwero - Nakaseke - Kapeeka Male 29 0 47 0 6 7 0 2 12 Female 17 1 45 0 7 0 0 0 9 Not Reported 0 0 0 0 0 0 0 0 1
Luwero - Nakaseke - Kikamulo Male 32 1 34 5 0 8 2 1 14 Female 23 0 34 1 0 4 0 0 7
Luwero - Nakaseke - Kinyogoga Male 0 0 0 0 0 0 0 0 3 Female 0 0 0 0 0 0 0 0 2
Luwero - Nakaseke - Nakaseke Male 26 2 24 0 1 7 0 0 0 Female 20 1 33 0 1 1 1 0 0
Luwero - Nakaseke - Ngoma Male 32 0 20 1 0 4 0 1 14 Female 11 1 11 0 0 0 0 0 8
Luwero - Nakaseke - Semuto Male 33 0 41 0 4 13 2 1 26 Female 31 0 50 0 2 4 0 4 17
Luwero - Nakaseke - Wakyato Male 24 1 22 1 1 5 1 0 2 Female 16 1 17 0 0 1 0 0 0
Grand Totals: 840 59 1,878 48 134 237 48 25 442

Luweero District State Of Environment Report 2004
96
6. Students with Adequate Seating/Writing Space Per Sub-County (2003)
County Subcounty Class
P 1 P 2 P 3 P 4 P 5 P 6 P 7 Total
Bamunanika Bamunanika 1,207 783 828 884 853 786 471 5,812 Kalagala 1,204 836 994 1,067 945 958 605 6,609
Kamira 371 261 423 465 319 329 234 2,402
Kikyusa 521 397 348 404 438 374 263 2,745
Zirobwe 1,578 1,119 1,011 971 956 884 634 7,153
Katikamu Bombo T/C 695 686 743 759 756 679 387 4,705
Butuntumula 701 773 842 861 853 825 452 5,307
Katikamu 1,227 726 954 931 895 785 596 6,114
Luwero 1,885 859 1,072 949 867 749 519 6,900
Luwero T/C 615 461 461 539 604 510 331 3,521
Makulubita 711 495 531 570 565 556 373 3,801
Nyimbwa 713 748 866 914 914 882 627 5,664
Wobulenzi T/C 633 371 465 381 414 374 338 2,976
Nakaseke Kaasangombe 965 484 664 732 596 550 365 4,356
Kapeeka 911 522 524 556 640 591 357 4,101
Kikamulo 549 289 316 299 331 362 298 2,444
Nakaseke 867 499 525 594 477 443 284 3,689
Ngoma 396 277 287 299 255 141 66 1,721
Semuto 1,221 844 804 855 807 819 623 5,973
Wakyato 320 285 356 376 391 334 199 2,261
Grand Total Students: 17,290 11,715 13,014 13,406 12,876 11,931 8,022 88,254

Luweero District State Of Environment Report 2004
97
7. Primary - Number of Toilets/Latrine Rooms/Stances by Type per Sub-County Location: All Areas, Ownership: Government, Registry Status: All Schools, 2003
Area Types of Toilets/Latrine Teachers Girls Boys Mixed Rooms/ Only Only Only Use Totals
Luwero - Bamunanika - Bamunanika
...with Doors 25 42 36 5 108
...with Shutters 5 14 14 6 39
...without Doors/Shutters 0 3 5 2 10
Totals for Area: 30 59 55 13 157
Luwero - Bamunanika - Kalagala
...with Doors 22 47 48 5 122
...with Shutters 6 29 25 0 60
...without Doors/Shutters 6 6 7 6 25
Totals for Area: 34 82 80 11 207
Luwero - Bamunanika - Kamira
...with Doors 8 20 20 0 48
...with Shutters 5 10 8 0 23
...without Doors/Shutters 1 7 15 3 26
Totals for Area: 14 37 43 3 97
Luwero - Bamunanika - Kikyusa
...with Doors 20 26 16 0 62
...with Shutters 17 24 17 0 58
...without Doors/Shutters 4 4 13 0 21
Totals for Area: 41 54 46 0 141
Luwero - Bamunanika - Zirobwe
...with Doors 22 66 55 5 148
...with Shutters 13 16 13 6 48
...without Doors/Shutters 2 9 13 6 30
Totals for Area: 37 91 81 17 226
Luwero - Katikamu - Bombo T/C
...with Doors 13 28 11 0 52
...with Shutters 0 15 11 6 32
...without Doors/Shutters 3 2 0 0 5
Totals for Area: 16 45 22 6 89

Luweero District State Of Environment Report 2004
98
Primary - Number of Toilets/Latrine Rooms/Stances by Type per Sub-County Location: All Areas, Ownership: Government, Registry Status: All Schools, 2003
Area Types of Toilets/Latrine Teachers Girls Boys Mixed Rooms/ Only Only Only Use Totals
Luwero - Katikamu - Butuntumula
...with Doors 11 32 29 0 72
...with Shutters 7 26 20 0 53
...without Doors/Shutters 5 9 11 1 26
Totals for Area: 23 67 60 1 151
Luwero - Katikamu - Katikamu
...with Doors 31 42 34 0 107
...with Shutters 15 19 9 2 45
...without Doors/Shutters 5 16 29 1 51
Totals for Area: 51 77 72 3 203
Luwero - Katikamu - Luwero
...with Doors 30 69 59 0 158
...with Shutters 9 30 26 1 66
...without Doors/Shutters 0 3 3 0 6
Totals for Area: 39 102 88 1 230
Luwero - Katikamu - Luwero T/C
...with Doors 21 44 37 4 106
...with Shutters 20 37 32 4 93
...without Doors/Shutters 1 5 2 0 8
Totals for Area: 42 86 71 8 207
Luwero - Katikamu - Makulubita
...with Doors 18 26 43 0 87
...with Shutters 7 14 8 0 29
...without Doors/Shutters 3 17 13 0 33
Totals for Area: 28 57 64 0 149
Luwero - Katikamu - Nyimbwa
...with Doors 17 38 37 2 94
...with Shutters 11 39 22 1 73
...without Doors/Shutters 1 6 12 2 21
Totals for Area: 29 83 71 5 188
Primary - Number of Toilets/Latrine Rooms/Stances by Type per Sub-County Location: All Areas, Ownership: Government, Registry Status: All Schools, 2003
Area Types of Toilets/Latrine Teachers Girls Boys Mixed Rooms/ Only Only Only Use Totals
Luwero - Katikamu - Wobulenzi T/C
...with Doors 9 40 28 0 77
...with Shutters 1 7 7 0 15
...without Doors/Shutters 2 2 7 0 11
Totals for Area: 12 49 42 0 103
Luwero - Nakaseke - Kaasangombe
...with Doors 11 32 27 2 72
...with Shutters 7 14 12 2 35

Luweero District State Of Environment Report 2004
99
...without Doors/Shutters 1 5 5 3 14
Totals for Area: 19 51 44 7 121
Luwero - Nakaseke - Kapeeka
...with Doors 6 18 23 5 52
...with Shutters 4 23 23 0 50
...without Doors/Shutters 6 20 12 7 45
Totals for Area: 16 61 58 12 147
Luwero - Nakaseke - Kikamulo
...with Doors 10 30 18 0 58
...with Shutters 9 8 15 0 32
...without Doors/Shutters 2 7 10 5 24
Totals for Area: 21 45 43 5 114
Luwero - Nakaseke - Nakaseke
...with Doors 13 18 13 2 46
...with Shutters 2 10 10 0 22
...without Doors/Shutters 0 1 14 7 22
Totals for Area: 15 29 37 9 90
Luwero - Nakaseke - Ngoma
...with Doors 10 8 7 4 29
...with Shutters 4 5 4 0 13
...without Doors/Shutters 1 3 2 4 10
Totals for Area: 15 16 13 8 52
Primary - Number of Toilets/Latrine Rooms/Stances by Type per Sub-County Location: All Areas, Ownership: Government, Registry Status: All Schools, 2003
Area Types of Toilets/Latrine Teachers Girls Boys Mixed Rooms/ Only Only Only Use Totals
Luwero - Nakaseke - Semuto
...with Doors 29 46 37 0 112
...with Shutters 9 22 21 2 54
...without Doors/Shutters 2 4 3 3 12
Totals for Area: 40 72 61 5 178
Luwero - Nakaseke - Wakyato
...with Doors 12 20 21 4 57
...with Shutters 0 5 5 1 11
...without Doors/Shutters 1 13 12 0 26
Totals for Area: 13 38 38 5 94
National Totals: 535 1,201 1,089 119 2,944
Source: Annual School CensusAn erroneous report might be due to incomplete data. ED*ASSIST Uganda

Luweero District State Of Environment Report 2004
100
8. Secondary Education
Table 62: Pupils by Gender and Class per Sub-County (2003)
County Subcounty Secondary 1Secondary 2Secondary 3Secondary 4Secondary 5Secondary 6 Total
Bamunanika Bamunanika Male 70 52 31 39 18 9 219 Female 74 57 43 38 14 18 244 Total 144 109 74 77 32 27 463
Kalagala Male 142 127 98 119 101 86 673 Female 124 135 120 110 99 84 672 Total 266 262 218 229 200 170 1,345
Kamira Male 59 63 46 0 0 0 168 Female 40 30 8 0 0 0 78 Total 99 93 54 0 0 0 246
Kikyusa Male 93 86 55 54 0 0 288 Female 73 48 48 36 0 0 205 Total 166 134 103 90 0 0 493
Zirobwe Male 96 82 76 81 24 27 386 Female 98 87 71 70 20 21 367 Total 194 169 147 151 44 48 753
Katikamu Bombo T/C Male 63 51 55 57 10 16 252 Female 42 34 40 36 20 12 184 Total 105 85 95 93 30 28 436
Butuntumula Male 96 81 108 76 33 35 429 Female 88 87 85 65 38 36 399 Total 184 168 193 141 71 71 828
Katikamu Male 56 55 48 52 35 37 283 Female 49 61 67 48 27 29 281 Total 105 116 115 100 62 66 564
Luwero Male 15 4 3 0 2 0 24 Female 8 6 4 0 0 0 18 Total 23 10 7 0 2 0 42
Luwero T/C Male 259 230 205 174 113 108 1,089 Female 297 194 180 108 67 60 906 Total 556 424 385 282 180 168 1,995
Makulubita Male 62 69 48 60 0 0 239 Female 75 78 59 42 0 0 254 Total 137 147 107 102 0 0 493

Luweero District State Of Environment Report 2004
101
Nyimbwa Male 231 211 197 155 76 76 946 Female 284 175 156 155 88 82 940
Total 515 386 353 310 164 158 1,886
Secondary - Pupils by Gender and Class per Sub-County (2003)
County Subcounty Secondary 1Secondary 2Secondary 3Secondary 4Secondary 5Secondary 6 Total
Katikamu Wobulenzi T/C Male 236 201 204 194 135 144 1,114 Female 214 187 179 148 82 120 930 Total 450 388 383 342 217 264 2,044
Nakaseke Kaasangombe Male 48 37 19 5 0 0 109 Female 51 31 24 14 0 0 120 Total 99 68 43 19 0 0 229
Kikamulo Male 65 52 35 25 0 0 177 Female 69 38 24 23 0 0 154 Total 134 90 59 48 0 0 331
Nakaseke Male 20 13 12 7 0 0 52 Female 30 13 8 10 0 0 61 Total 50 26 20 17 0 0 113
Semuto Male 119 99 78 50 0 0 346 Female 132 88 75 62 0 0 357 Total 251 187 153 112 0 0 703
Wakyato Male 20 12 5 3 0 0 40 Female 9 11 8 3 0 0 31 Total 29 23 13 6 0 0 71
Grand Totals: Male 1,750 1,525 1,323 1,151 547 538 6,834 Female 1,757 1,360 1,199 968 455 462 6,201 Total 3,507 2,885 2,522 2,119 1,002 1,000 13,035
Source: Annual School Census Ministry of Education

Luweero District State Of Environment Report 2004
102
9. Secondary - Students:Teacher Ratio Per Sub-County (2003)
County Subcounty Total Students Total Teachers Students Teacher Ratio
Bamunanika Bamunanika 463 39 12
Kalagala 1,345 91 15
Kamira 246 14 18
Kikyusa 493 37 13
Zirobwe 753 44 17
Katikamu Bombo T/C 436 25 17
Butuntumula 828 33 25
Katikamu 564 35 16
Luwero 42 14 3
Luwero T/C 1,995 99 20
Makulubita 493 27 18
Nyimbwa 1,886 142 13
Wobulenzi T/C 2,044 96 21
Nakaseke Kaasangombe 229 10 23
Kikamulo 331 23 14
Nakaseke 113 10 11
Semuto 703 45 16
Wakyato 71 6 12
Grand Totals and Average: 13,035 790 17
Source: Annual School: 1 Jan 2004 Ministry of Education

Luweero District State Of Environment Report 2004
103
10. secondary Students: Classroom Ratio Per Sub-County
County Subcounty Total Total Total Students Classrooms Pupil: Classroom
Bamunanika Bamunanika 463 4 115.75
Kalagala 1,345 33 40.76
Kamira 246 1 246.00
Kikyusa 493 12 41.08
Zirobwe 753 17 44.29
Katikamu Bombo T/C 436 8 54.50
Butuntumula 828 18 46.00
Katikamu 564 18 31.33
Luwero 42 4 10.50
Luwero T/C 1,995 47 42.45
Makulubita 493 8 61.63
Nyimbwa 1,886 43 43.86
Wobulenzi T/C 2,044 32 63.88
Nakaseke Kaasangombe 229 4 57.25
Kikamulo 331 8 41.38
Nakaseke 113 6 18.83
Semuto 703 18 39.06
Wakyato 71 4 17.75
National Totals and Average 13,035 285 45.74
Source: Annual School Census. Ministry of Education

Luweero District State Of Environment Report 2004
104
11. Secondary - Teachers by Qualification and Gender Per Sub-County Level
Location: All Areas, Ownership: All, Registry Status: All Schools, 2003
Region Gender Licensed Grade II Grade III Grade IV Grade V DPE Graduate Other Unknown
Luwero - Bamunanika - Bamunanika Male 4 0 0 0 0 12 8 0 0 Female 0 0 0 0 0 9 6 0 0
Luwero - Bamunanika - Kalagala Male 0 0 0 0 2 18 19 5 20 Female 0 1 0 0 0 8 13 0 5
Luwero - Bamunanika - Kamira Male 0 0 0 0 0 3 1 6 0 Female 0 0 0 0 0 2 1 1 0
Luwero - Bamunanika - Kikyusa Male 0 0 4 0 1 15 2 4 3 Female 0 0 0 0 0 4 1 1 2
Luwero - Bamunanika - Zirobwe Male 0 0 0 0 8 10 16 4 0 Female 0 0 0 0 0 3 2 1 0
Luwero - Katikamu - Bombo T/C Male 0 0 0 0 0 9 4 0 0 Female 0 0 0 0 0 5 6 1 0
Luwero - Katikamu - Butuntumula Male 0 0 0 0 2 7 6 3 3 Female 0 0 0 0 8 2 1 0 0 Not Reported 0 0 0 0 0 0 0 0 1
Luwero - Katikamu - Katikamu
Male 0 0 0 0 2 14 7 0 2 Female 0 0 0 0 0 4 4 0 2
Luwero - Katikamu - Luwero Male 0 0 0 0 4 0 3 5 0 Female 0 0 0 0 0 0 0 2 0
Luwero - Katikamu - Luwero T/C Male 3 2 0 0 5 31 31 8 3 Female 1 0 0 0 0 4 8 3 0

Luweero District State Of Environment Report 2004
105
Secondary - Teachers by Qualification and Gender per Sub-County
Location: All Areas, Ownership: All, Registry Status: All Schools, 2003
Region Gender Licensed Grade II Grade III Grade IV Grade V DPE Graduate Other Unknown
Luwero - Katikamu - Makulubita Male 1 0 1 0 2 8 5 3 0 Female 0 0 0 0 0 5 2 0 0
Luwero - Katikamu - Nyimbwa Male 7 0 0 0 1 23 72 1 2 Female 1 0 0 0 4 10 21 0 0
Luwero - Katikamu - Wobulenzi T/C Male 1 0 0 0 10 21 34 2 1 Female 0 0 0 0 2 11 13 0 1
Luwero - Nakaseke - Kaasangombe Male 0 0 0 0 0 4 1 1 0 Female 0 0 0 0 0 2 2 0 0
Luwero - Nakaseke - Kikamulo Male 2 0 0 0 0 7 3 1 4 Female 0 0 0 0 0 1 3 0 2 kaseke – Nakaseke Male 0 0 0 0 0 4 0 4 0 Female 0 0 0 0 0 2 0 0 0
Luwero - Nakaseke - Semuto Male 0 0 0 0 7 11 7 0 6 Female 0 0 0 0 5 5 4 0 0
Luwero - Nakaseke - Wakyato

Luweero District State Of Environment Report 2004
106
Male 1 0 0 0 0 0 0 0 5
Grand Totals: 21 3 5 0 63 274 306 56 62
Source: Annual School CensusAn erroneous report might be due to incomplete data. ED*ASSIST Uganda 3
Data User's Application: 1 Jan 2004
Secondary - Teachers by Qualification and Gender Per Sub-County Level Report
Location: All Areas, Ownership: All, Registry Status: All Schools, 2003
Area Gender Licensed Grade II Grade III Grade IV Grade V DPE Graduate Other Unknown
Luwero - Bamunanika - Bamunanika Male 4 0 0 0 0 12 8 0 0 Female 0 0 0 0 0 9 6 0 0
Luwero - Bamunanika - Kalagala Male 0 0 0 0 2 18 19 5 20 Female 0 1 0 0 0 8 13 0 5
Luwero - Bamunanika - Kamira Male 0 0 0 0 0 3 1 6 0 Female 0 0 0 0 0 2 1 1 0
Luwero - Bamunanika - Kikyusa Male 0 0 4 0 1 15 2 4 3 Female 0 0 0 0 0 4 1 1 2
Luwero - Bamunanika - Zirobwe Male 0 0 0 0 8 10 16 4 0 Female 0 0 0 0 0 3 2 1 0
Luwero - Katikamu - Bombo T/C Male 0 0 0 0 0 9 4 0 0 Female 0 0 0 0 0 5 6 1 0
Luwero - Katikamu - Butuntumula Male 0 0 0 0 2 7 6 3 3 Female 0 0 0 0 8 2 1 0 0 Not Reported 0 0 0 0 0 0 0 0 1
Luwero - Katikamu - Katikamu
Male 0 0 0 0 2 14 7 0 2 Female 0 0 0 0 0 4 4 0 2
Luwero - Katikamu - Luwero

Luweero District State Of Environment Report 2004
107
Male 0 0 0 0 4 0 3 5 0 Female 0 0 0 0 0 0 0 2 0
Luwero - Katikamu - Luwero T/C Male 3 2 0 0 5 31 31 8 3 Female 1 0 0 0 0 4 8 3 0
Secondary - Teachers by Qualification and Gender Per Sub-County Level Report
Location: All Areas, Ownership: All, Registry Status: All Schools, 2003
Area Gender Licensed Grade II Grade III Grade IV Grade V DPE Graduate Other Unknown
Luwero - Katikamu - Makulubita Male 1 0 1 0 2 8 5 3 0 Female 0 0 0 0 0 5 2 0 0
Luwero - Katikamu - Nyimbwa Male 7 0 0 0 1 23 72 1 2 Female 1 0 0 0 4 10 21 0 0
Luwero - Katikamu - Wobulenzi T/C Male 1 0 0 0 10 21 34 2 1 Female 0 0 0 0 2 11 13 0 1
Luwero - Nakaseke - Kaasangombe Male 0 0 0 0 0 4 1 1 0 Female 0 0 0 0 0 2 2 0 0
Luwero - Nakaseke - Kikamulo Male 2 0 0 0 0 7 3 1 4 Female 0 0 0 0 0 1 3 0 2
Luwero - Nakaseke - Nakaseke Male 0 0 0 0 0 4 0 4 0 Female 0 0 0 0 0 2 0 0 0
Luwero - Nakaseke - Semuto Male 0 0 0 0 7 11 7 0 6 Female 0 0 0 0 5 5 4 0 0
Luwero - Nakaseke - Wakyato Male 1 0 0 0 0 0 0 0 5
Grand Totals: 21 3 5 0 63 274 306 56 62
Source: Annual School CensusAn erroneous report might be due to incomplete data. ED*ASSIST Uganda
Data User's Application: 1 Jan 20

Luweero District State Of Environment Report 2004
108
12. Secondary - Number of Toilets/Latrine Rooms/Stances by Type per Sub-County Location: All Areas, Ownership: All, Registry Status: All Schools, 2003
Area Types of Toilets/Latrine Teachers Girls Boys Mixed Rooms/ Only Only Only Use Totals
Luwero - Bamunanika - Bamunanika
...with Doors 2 4 4 0 10
...with Shutters 0 0 0 0 0
...without Doors/Shutters 0 0 0 0 0
Totals for Area: 2 4 4 0 10
Luwero - Bamunanika - Kalagala
...with Doors 2 2 2 0 6
...with Shutters 3 32 32 0 67
...without Doors/Shutters 0 2 2 0 4
Totals for Area: 5 36 36 0 77
Luwero - Bamunanika - Kamira
...with Doors 0 1 1 1 3
...with Shutters 0 1 1 1 3
...without Doors/Shutters 0 0 0 0 0
Totals for Area: 0 2 2 2 6
Luwero - Bamunanika - Kikyusa
...with Doors 5 5 5 0 15
...with Shutters 4 4 4 0 12
...without Doors/Shutters 0 0 0 0 0
Totals for Area: 9 9 9 0 27
Luwero - Bamunanika - Zirobwe
...with Doors 2 4 4 0 10
...with Shutters 3 5 3 0 11
...without Doors/Shutters 0 0 0 0 0
Totals for Area: 5 9 7 0 21
Luwero - Katikamu - Bombo T/C
...with Doors 2 2 2 0 6
...with Shutters 0 0 0 0 0
...without Doors/Shutters 0 0 0 0 0
Totals for Area: 2 2 2 0 6
Secondary - Number of Toilets/Latrine Rooms/Stances by Type per Sub-County Location: All Areas, Ownership: All, Registry Status: All Schools, 2003
Area Types of Toilets/Latrine Teachers Girls Boys Mixed Rooms/ Only Only Only Use Totals
Luwero - Katikamu - Butuntumula
...with Doors 2 3 3 1 9
...with Shutters 1 2 2 0 5
...without Doors/Shutters 0 0 0 1 1
Totals for Area: 3 5 5 2 15
Luwero - Katikamu - Katikamu
...with Doors 4 8 5 0 17

Luweero District State Of Environment Report 2004
109
...with Shutters 0 0 0 0 0
...without Doors/Shutters 0 0 0 0 0
Totals for Area: 4 8 5 0 17
Luwero - Katikamu - Luwero
...with Doors 1 2 2 0 5
...with Shutters 0 0 0 0 0
...without Doors/Shutters 0 0 0 0 0
Totals for Area: 1 2 2 0 5
Luwero - Katikamu - Luwero T/C
...with Doors 6 10 10 0 26
...with Shutters 2 4 3 0 9
...without Doors/Shutters 0 2 1 0 3
Totals for Area: 8 16 14 0 38
Luwero - Katikamu - Makulubita
...with Doors 0 2 0 1 3
...with Shutters 0 0 0 0 0
...without Doors/Shutters 0 4 2 1 7
Totals for Area: 0 6 2 2 10
Luwero - Katikamu - Nyimbwa
...with Doors 8 25 18 4 55
...with Shutters 5 2 1 0 8
...without Doors/Shutters 2 3 3 0 8
Totals for Area: 15 30 22 4 71
Secondary - Number of Toilets/Latrine Rooms/Stances by Type per Sub-County Location: All Areas, Ownership: All, Registry Status: All Schools, 2003
Area Types
Toilets/Latrine Teachers Girls Boys Mixed Rooms/ Only Only Only Use Totals
Luwero - Katikamu - Wobulenzi T/C
...with Doors 6 11 12 0 29
...with Shutters 1 1 1 0 3
...without Doors/Shutters 0 0 0 0 0
Totals for Area: 7 12 13 0 32
Luwero - Nakaseke - Kaasangombe
...with Doors 0 2 2 0 4
...with Shutters 0 2 2 0 4
...without Doors/Shutters 0 0 0 0 0
Totals for Area: 0 4 4 0 8
Source: Annual School Census An erroneous report might be due to incomplete data. ED*ASSIST Uganda2 Data User's Application: 1 Jan 2004