Embed Size (px)
Citation preview

DGMS Annual Report,2006
1
1.0 Introduction Under the Constitution of India “Regulation of Labour and Safety in Mines and Oilfields” is a
central subject (Entry 55 of the Seventh Schedule of Article 246). The matter is regulated by
the Mines Act, 1952 and the Rules and Regulations framed thereunder. It extends to whole of
India including territorial water i.e. upto 12 nautical miles in the sea measured from
appropriate base line. These statutes are administered by Directorate-General of Mines Safety
(DGMS) under the Union Ministry of Labour & Employment.
1.1 Historical Background Although exploitation of minerals has been going on in the country from pre-Christian era, it was
only towards the end of 19th Century that attempts were made by the state for regulation of
employment and working conditions therein. Following the International Labour Conference in
Berlin in 1890, the then Government of UK through the Secretary of State for India asked the
Government of India to consider the desirability of undertaking legislation for inspection of
mines in general and coal mines in particular and for regulation of employment therein of men,
women and children. Accordingly in 1894, Mr. James Grundy was appointed as first ever
Inspector of Mines in India within the organization of Geological Survey of India. Mr. Grundy
recommended that provisions be made for the minimum age of employment; notice of opening
and of accidents, first-aid, management and supervision etc. Major disasters at Kolar Gold Field
in 1897 and at Khost Coal Mines, Baluchistan (presently in Pakistan) in 1898 expedited
finalisation of the first Mines Act which was enacted on 22nd March, 1901. A Bureau of Mines
Inspection was started in Calcutta on 7th January 1902 to administer the provisions of the
Mines Act, 1901. The organization was renamed as Department of Mines and its office was
shifted to Dhanbad in 1908. In 1960, the organization was renamed as Office of the Chief
Inspector of Mines. Again in 1967 the name of the organization was changed to Directorate-
General of Mines Safety (DGMS). In 1988 DGMS was declared a Scientific and Technological
Organization.
Apart from administering the Mines Act and legislation framed thereunder, DGMS also
administers certain allied legislation. A list of legislation administered by DGMS is given at
Appendix-I.
1.2 Organizational Set-up of DGMS Directorate-General of Mines Safety is a multi-disciplinary organization with Inspecting Officers
from Mining, Mechanical and Electrical engineering and Occupational Health disciplines.
Officers appointed to different technical posts in DGMS are selected by U.P.S.C. They are
required to have Degree in Mining or Mechanical or Electrical Engineering with several years of
experience, varying from seven to ten years of working in responsible capacity in mines or allied
industry. Besides, officers of mining cadre posses First Class Mine Manager's Certificate of

DGMS Annual Report,2006
2
Competency. The Occupational Health cadre is manned by qualified and experienced
medical personnel.
The organization has its headquarters at Dhanbad (Jharkhand) and is headed by the Director-
General of Mines Safety. At the headquarters, the Director-General is assisted by specialist
staff-officers in mining, electrical and mechanical engineering, occupational health, law,
survey, statistics, administration and accounts disciplines. The headquarters has a technical
library and S&T laboratory as a back-up support to the organization. Extensive computerization
has been done in head office and in the field offices to upgrade the standard of work. The head
office and some of the field offices have access to the internet enabling these to place
themselves at par with other developed countries of the world so far as the communication with
the use of computer is concerned. DGMS has a plan to establish a network for all its offices
through Internet. A web page on DGMS has already been launched during the centenary year.
The field organization has a two-tier network of field offices. The area of jurisdiction of DGMS
covering the entire country is divided into six zones, each under the charge of a Deputy
Director-General. There are three to four Regional offices under each zonal office. Each
Region is under the charge of a Director of Mines Safety. There are in all 21 such Regional
Offices. Sub-regional offices have been set up in important areas of concentrated mining
activities away from Regional office. There are five such sub-regional offices, each under the
charge of a Deputy Director. Each Zone, besides having inspecting officers of mining cadre has
officers in electrical, mechanical engineering and occupational health disciplines.
Organization chart of DGMS are at Appendix-IIA & IIB. Table - 1 shows the discipline-wise
strength of inspecting officers as on 31.12.2006. A statement showing posting of Group ‘A’ &
‘B’ officers in DGMS during the year 2006 are given at Appendix-III.
TABLE:1 STRENGTH OF INSPECTING OFFICERS AND SANCTIONED
POSTS AS ON 31.12.2006
DESIGNATION DISCIPLINE MINING ELECTRICAL MECHANICAL O. H
S P S P S P S P
Director General 1 - - - - - - -
Dy. Director General 7 7 1 1 - - - -
Director 29 29 4 4 2 2 - -
Dy. Director 82 57 18 11 10 5 1 1
Assistant Director 1 - - - - - Gr.I: 3 Gr.II: 5
2 3
Total 120 93 23 19 12 7 9 6
S – Sanctioned P - In Position

DGMS Annual Report,2006
3
1.3 Role and Function of DGMS Enforcement of the provision of the Mines Act, 1952 and Rules, Regulations and Order made
thereunder and drafting appropriate legislation to absorb the technical advancement as well as
to make the same comprehensive, practicable and legally sound. Setting standards, by
overseeing compliance thereof as intensively as the resources permit and through a variety of
promotional initiatives and awareness programme, the officers of DGMS exercise preventive
as well as educational influence over the mining industry. DGMS is also promoting the
concept of ‘self-regulation’ as well as 'workers' participation in safety management. With
changing scenario, attempts are being made to superimpose its traditional role of seeking
compliance by legal sanctions and work prohibition optimally, with advisory and other safety
promotional initiatives; thereby creating an environment in which safety is given due priority.
Current functions of DGMS broadly include:
1. Development and updating of legislation and issue of guidelines and circulars
periodically.
2. Inspection – overseeing compliance of the statutes by the management through sample
inspection as and when required
3. Investigation into:
(a) accidents
(b) dangerous occurrences - emergency response
(c) complaints & other matters and
(d) taking corrective action and action against delinquents
4. (a) Grant of :
(i) statutory permission, exemptions & relaxations
(ii) approval of mine safety equipment, material & appliances
(b) Interactions for development of safety equipment, material and
safe work practices
5. Safety promotional initiatives including:
(a) Organization of -
National Conference on Safety in Mines
National Safety Awards
Safety Weeks & Campaigns
(b) Safety Information Dissemination
(c) Preview of project reports & mining plans
(d) Promoting -
- safety education and awareness programme
- workers’ participation in safety management through -
o workmen’s inspector
o safety committee
o tripartite reviews
6. Conduct of examinations for grant of competency certificates.

DGMS Annual Report,2006
4
1.4 Gazette Notification Following gazette notifications were issued during the year 2006:
TABLE:2 Notification No.
& date
Brief subject
1. SO 57(E) dated 19.1.2006
Central Government extends the duration for a further period of three months of Central Saunda court of inquiry for a further period of three months from 17.1.2006 to 16.4.2006
2. GSR 73 dated 20.3.2006
Notification regarding use of electrical appliances in Oil Mines.
3. SO 483(E) dated 3.4. 2006
Central Government extends the duration for a further period of three months from of Central Saunda court of inquiry from 17.4.2006 to 16.7.2006.
4. SO 522(E) dated 10.4.2006
Constitution of Advisory Committee and appointment of Committee for the State of Goa to advise the Central Government on the matters arising out of administration of the Iron Ore Mines, Manganese Ore Mines and Chrome Ore Mines Labour Welfare Fund Act, 1976.
5. SO 615(E) dated 26.4. 2006
Central Government extends the duration of GDK 8A court of inquiry for a further period of six months from 21.4.2006 to 20.10.2006
6. SO 2100 dated 17.5.2006
Central Government appoints the officers as Inspectors of Mines subordinate to the Chief Inspector of Mines.
7. SO 778(E) dated 18.5.2006
Appointment of Committee under Section 12 of the Mines Act, 1952.
8. SO 1756(E) dated 12.10. 2006
Appointment of Shri PC Parakh, former Secretary, Ministry of Coal to hold formal inquiry into the causes and circumstances attending to the accident occurred on 6.9.2006 in the Bhatdee Colliery of M/s. Bharat Coking Coal Limited.
9. SO 1863 (E) dated 31.10.2006
Appoint of Shri MM Sharma, Dy.Director-General of Mines Safety as Chief Inspector of Mines.
1.5 Measures to improve safety in mines:
Since mining is beset with many inherent hazards, detailed precautions have been laid down in
the Mines Act, Rules and Regulations framed thereunder to guard against dangers in mines
and it is the responsibility of the mine management to comply with the same. While the onus
of providing for and ensuring safety in mines rests with the mine management, DGMS has the
responsibility to see that the safety statute is kept updated to absorb the technical
advancements as well as to make the same comprehensive, practicable, legally sound and also
to carry out periodic inspection of mines to oversee compliance of safety laws. The Mines Act
and the subordinate legislations framed thereunder is periodically updated for the purpose.
Each and every accident involving fatality is enquired into by an officer or a team of officers of
DGMS. A few accidents involving serious bodily injury and most of the important dangerous
occurrences are also investigated by DGMS Officers. Arising out of inspections and enquiries
conducted by DGMS, one or more of the following actions, as appropriate, is taken: -
(a) drawing the attention of the mine management about the contraventions of the
statutes etc.;
(b) withdrawal of statutory permission, approval, relaxation or exemption granted ;

DGMS Annual Report,2006
5
(c) serving an improvement notice ;
(d) imposition of a prohibitory order ;
(e) suspension of statutory certificate of competency held by managerial and
supervisory personnel, if found negligent in the discharge of duties;
(f) prosecution of person(s) held responsible;
(g) punitive action taken departmentally by mining companies.
Mine management is also addressed to take steps as are considered necessary by the
inspecting/enquiry officer to rectify the defects or deficiencies in working condition or
system.
1.6 Inspection & Enquiries Discipline-wise number of inspections and enquiries made by the inspecting officers are given
in table:3.
TABLE:3 NUMBER OF INSPECTIONS AND ENQUIRIES MADE DURING THE YEAR 2006
Discipline of Inspection Service
Coal Mines
Metal Mines Oil Mines
Inspections Enquiries Inspections Enquiries Inspections Enquiries
Mining 2869 803 2299 320 85 25
Electrical 903 43 243 0 111 0
Mechanical 307 66 52 9 16 2
Occupational Health
113 39 36 9 7 0
TOTAL 4192 951 2630 338 219 27

DGMS Annual Report,2006
6
1.7 Improvement Notices & Prohibitory Orders
1.7.1 Coal Mines
106 (one hundred six) improvement notices under various provisions of the statutes were
issued as a result of inspections of the mines during the year 2006. These improvement
notices were issued for various types of serious defects, details of which are given in table:4
below :
TABLE:4 IMPROVEMENT NOTICES ISSUED UNDER SECTIONS 22(1) AND 22A(1)
OF THE MINES ACT, 1952 IN COAL MINES DURING 2006
SL.NO. NATURE OF DEFECT NO. OF CASES
1. High benches in opencast workings 15
2. Inadequate support 6
3. Poor ventilation 4
4. Inadequate coal dust suppression 8
5. Isolation stopping 1
6. Improper/ non-provision of travelling road 1
7. Danger of Inundation 2
8. Unstable workings 0
9. Lag in stowing 0
10. Accumulation of gases 0
11. Defective Electrical installation 17
12. Inadequate earth leakage protection 0
13. Defective winding rope 0
14. Other defects in winding installation 5
15. Defective shot-firing practices 1
16. Others 46
TOTAL 106
61 (sixty-one) prohibitory orders under Section 22(3), 22A(2) and 22(1A) of the Mines Act,
1952 were issued during the year 2006. These orders were imposed for various dangerous
conditions prevailing at the mines, details of which are given in table 5:
TABLE:5 PROHIBITORY ORDERS ISSUED UNDER SECTIONS 22(3) AND 22A(2) AND 22(1A) OF THE MINES ACT,1952
IN COAL MINES DURING 2006 SL.NO. NATURE OF DEFECT NO. OF CASES 1. High benches in opencast workings 17 2. Inadequate support 6 3. Poor ventilation 7 4. Inadequate coal dust suppression 3 5. Isolation stopping 0 6. Improper/ non-provision of travelling road 0 7. Danger of Inundation 5 8. Unstable workings 0 9. Lag in stowing 0 10. Accumulation of gases 0 11. Defective Electrical installation 0 12. Inadequate earth leakage protection 0 13. Defective winding rope 0 14. Other defects in winding installation 3 15. Defective shot-firing practices 1 16. Others 19 TOTAL 61

DGMS Annual Report,2006
7
1.7.2 Metalliferous Mines
In metalliferous mines inadequate benching and unstable slope in opencast workings and
non-appointment of manager and supervisory officials in the mines were the main reasons for
which improvement notices and prohibitory orders were issued. Notices issued under Sections
22(1) & 22A(1) of the Mines Act, 1952 during the year 2006 were 64 (sixty four). Prohibitory
orders under Sections 22(1A), 22A(2) and 22(3) issued in Metalliferous Mines during the year
2006 were 211 (two hundred eleven). Details of the improvement notices and prohibitory
orders issued during 2006 are given in table: 6 & 7 respectively.
TABLE:6 IMPROVEMENT NOTICES ISSUED UNDER SECTIONS 22(1) AND 22A(1) OF
THE MINES ACT,1952 IN METALLIFEROUS MINES DURING 2006
SL.NO. NATURE OF DEFECT No. of cases
1. Non-appointment of qualified manager and supervisory officials 6
2. Inadequate benching and sloping in opencast workings 50
3. Miscellaneous 8
TOTAL 64
TABLE:7 PROHIBITORY ORDERS ISSUED UNDER SECTIONS 22(3), 22A(2) & 22(1A)
OF THE MINES ACT,1952 ISSUED IN METALLIFEROUS MINES DURING 2005
SL.NO. NATURE OF DEFECT No. of cases
1. Non-appointment of qualified manager and supervisory officials -
2. Inadequate benching and sloping in opencast workings 206
3. Miscellaneous 5
TOTAL 211
1.7.3 Oil Mines
No prohibitory order was issued in oil mines during the year 2006.
1.8 Permission, relaxations and exemptions
1.8.1 Coal Mines
916 (nine hundred sixteen) permissions/ exemptions and relaxations were granted in
coalmines during the year 2006. Details of such cases are given in table:8.
TABLE:8 PERMISSIONS, RELAXATIONS & EXEMPTIONS GRANTED IN
COAL MINES DURING 2006
SL.NO. Particulars of Permissions, Relaxations & Exemptions No. of cases
1. Extraction of coal by methods other than bord & pillar beneath areas free from surface features
33
2. Extraction of coal by methods other than bord & pillar below surface features
11
3. Extraction of coal by bord & pillar methods beneath areas free from surface features
156
4. Extraction of coal by bord & pillar methods beneath surface features 83
5. Development below surface features including development in contiguous seams/ sections
72
6. Blasting coal off the solid 47
7. Development within 60m. of waterlogged workings 20
8. Workings within 7.5m. / Adjustment of mine boundaries 24
9. Exemptions from different provisions of regulations 114
10. Others 356
TOTAL 916
DGMS Annual Report,2006
8
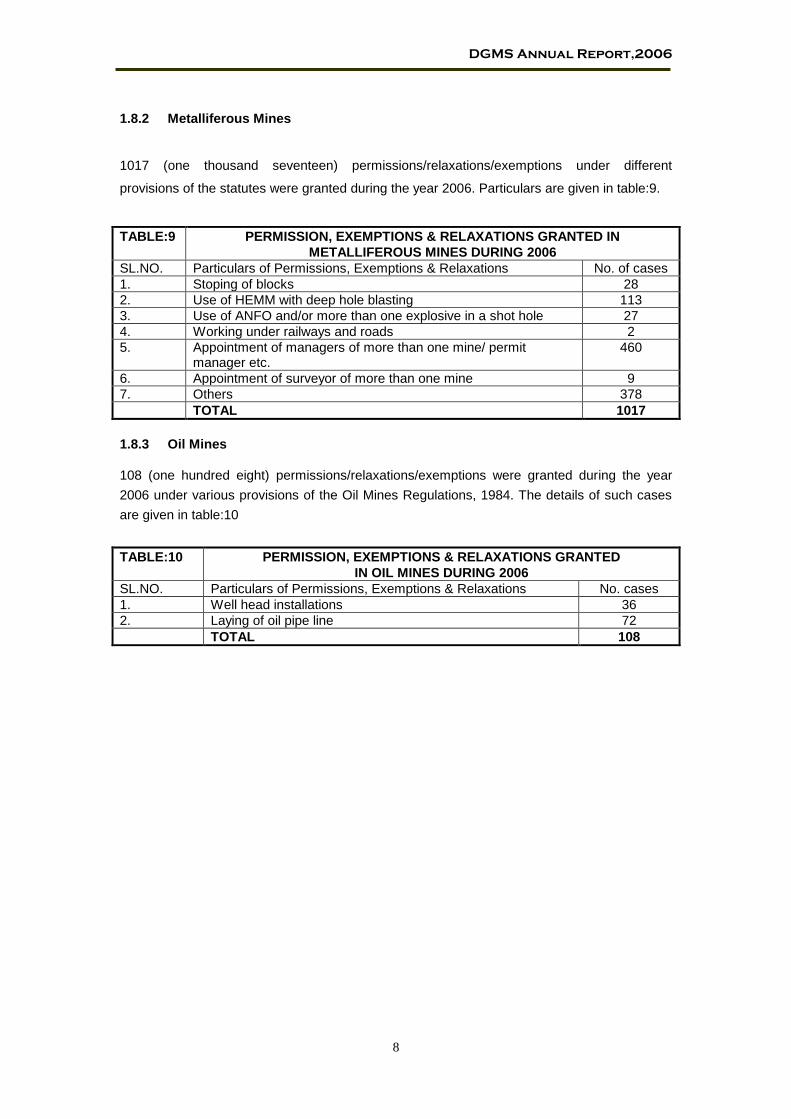
1.8.2 Metalliferous Mines
1017 (one thousand seventeen) permissions/relaxations/exemptions under different
provisions of the statutes were granted during the year 2006. Particulars are given in table:9.
TABLE:9 PERMISSION, EXEMPTIONS & RELAXATIONS GRANTED IN
METALLIFEROUS MINES DURING 2006
SL.NO. Particulars of Permissions, Exemptions & Relaxations No. of cases
1. Stoping of blocks 28
2. Use of HEMM with deep hole blasting 113
3. Use of ANFO and/or more than one explosive in a shot hole 27
4. Working under railways and roads 2
5. Appointment of managers of more than one mine/ permit manager etc.
460
6. Appointment of surveyor of more than one mine 9
7. Others 378
TOTAL 1017
1.8.3 Oil Mines
108 (one hundred eight) permissions/relaxations/exemptions were granted during the year
2006 under various provisions of the Oil Mines Regulations, 1984. The details of such cases
are given in table:10
TABLE:10 PERMISSION, EXEMPTIONS & RELAXATIONS GRANTED
IN OIL MINES DURING 2006
SL.NO. Particulars of Permissions, Exemptions & Relaxations No. cases
1. Well head installations 36
2. Laying of oil pipe line 72
TOTAL 108

DGMS Annual Report,2006
9
1.9 Prosecutions
6 (six) prosecutions were instituted in coalmines during the year 2006. In respect of non-coal
mines, 22 (twenty two) prosecutions were launched during 2006. Contraventions of provisions
of statute for which these prosecutions were instituted are given in tables: 11 & 12.
Details of prosecution cases as on 31.12.2006.
Coal Non-coal Pending Disposed
No. of prosecution launched during the year 2006
No. of prosecution launched during the year 2006
Total pending cases upto 31.12.2006
Total disposed cases upto 31.12.2006
06 22 954 209
TABLE:11 PROSECUTIONS INSTITUTED IN RESPECT OF COAL MINES DURING 2006
SL.NO. CONTRAVENTION NO. OF CASES
1. Contraventions leading to accidents 5
2. Non-submission or submission of incorrect plans, returns, notices etc.
-
3. Non-appointment of qualified persons as senior supervisory officials
-
4. Contraventions under Indian Electricity Act or Rules 1
5. Other violation of serious nature -
6. Miscellaneous violations -
TOTAL 6
TABLE:12 PROSECUTIONS INSTITUTED IN RESPECT OF NON-COAL MINES
DURING 2006
SL NO. CONTRAVENTION NO. OF CASES
1. Contravention leading to accidents 17
2. Contravention of orders under sections 22(1A), 22(3), Reg. 108 etc.
1
3. Non-appointment of qualified persons as senior supervisory officials
-
4. Non-appointment of qualified persons as subordinate supervisory officials
-
5. Non-provisions of protective equipment -
6. Other miscellaneous contraventions 4
TOTAL 22

DGMS Annual Report,2006
10
2.0 Coal Mines
2.1 General Number of operating coalmines during 2006 was 575 as compared to 565 in 2005. Company-
wise number of coal mines and production is given in table: 13.
TABLE: 13 Number of Mines during 2006 Production
(in million
tonnes) COMPANY Underground Opencast Both Total
Coal India Limited 293 140 42 475 337
Singareni Collieries Company Limited
52 11 0 63 35
Others 9 25 3 37 50
TOTAL 354 176 45 575 422
Table-14 shows the number of underground coalmines having gassy seams of different
degrees.
TABLE : 14 UNDERGROUND COAL MINES HAVING GASSY SEAMS
OF DIFFERENT DEGREES
Degree of gassiness Number of Mines
2005 2006*
I only 265 264
II only 107 106
III only 15 15
I & II 9 9
I & III 1 1
II & III 3 3
I, II & III - -
TOTAL 400 398 *Provisional
During the year total numbers of working mines have increased from 565 in 2005 to 575 in
2006. Output of coal increased from 420.00 million tonnes in 2005 to 422.00 million tonnes in
2006. Coal mines under M/s.Coal India Limited contributed 337.00 million tonnes of coal
during the year 2006. Average daily employment in mines marginally increased from 399,000
in 2005 to 400,000 in 2006. The output per manshift is remained same to 3.35. Trend in
average daily employment and output per manshift in coalmines is given table: 15.

DGMS Annual Report,2006
11
TABLE: 15 PLACEWISE DISTRIBUTION OF AVERAGE DAILY EMPLOYMENT AND
OUTPUT AND PRODUCTIVITY IN COAL MINES Year Belowground Opencast Above
Ground Total Output
per manshift
Employ ment (in ‘000 number
Output (in ‘000 tonnes)
Employ ment (in ‘000 number
Output (in ‘000 tonnes)
Employ ment (in ‘000 number)
Employ ment (in ‘000 number)
Output (in ‘000 tonnes)
1951 178 30199 36 4784 138 352 34983 0.35
1961 230 44887 60 10822 121 411 55709 0.45
1971 228 58552 43 17090 111 382 75642 0.67
1981 302 76205 55 51120 156 513 127325 0.81
1991 316 70731 67 167206 171 554 237757 1.40
1992 312 71062 67 178879 173 552 249941 1.47
1993 308 73672 68 186935 170 546 260607 1.53
1994 293 70644 67 196878 164 524 267522 1.63
1995 287 68512 68 216074 158 513 284586 1.80
1996 281 70127 68 233970 157 506 304097 1.91
1997 279 69062 68 247619 156 503 316681 2.01
1998 270 68571 69 251324 152 491 319895 2.09
1999 258 68101 71 247088 147 476 315189 2.12
2000 249 66225 69 268092 140 458 334317 2.34
2001 239 64134 69 277379 130 438 341513 2.51
2002 225 65330 69 297982 129 423 363312 2.75
2003 216 63632 69 315556 132 417 379188 2.91
2004 211 61921 70 347347 124 405 407268 3.19
2005 205 64087 70 356758 124 399 420845 3.35
2006* 204 63000 71 359000 125 400 422000 3.35
*Provisional
2.2 Accidents
2.2.1 Major Accidents Three major accidents took place during the year 2006 which have been described below: (1) Bhatdee colliery, BCCL Date of accident: 06.09.2006, Time: 1945 hours, Number of persons killed: 50 Court of Inquiry has been instituted. (2) Shyamsundarpur colliery, ECL Date of accident: 30.11.2006, Time: 0545 hours, Number of persons killed: 6
While thirteen loaders were loading coal from the rib of the last slice of a pillar in a caving
district, a hanging roof measuring about 10m (length) x 5m (width) x 1.2 m (thick) came down
without any prior sound, four loaders escaped while three loaders and the Mining Sirdar
narrowly escaped receiving minor injuries, rest six loaders were trapped under the falled roof
and were recovered dead.

DGMS Annual Report,2006
12
(3) Venkatesh Khani No.7, SCCL Date of accident: 11.12.2006, Time: 0930 hours, Number of persons killed: 4 While last slice in last fender (1/3 part pillar) of pillar in a depillaring panel was being worked
by a continuous miner and shuttle car combination, a sudden massive roof fall measuring
about 47m (L) x 13m (B) x 2m to 6m (Thick) occurred in the goaf extending to the immediate
outbye junction, wherein six persons got trapped, of which four succumbed instantaneously to
the injuries and the two with serious injuries could be rescued after about 5 hours.
2.2.2 Accident scenario
The year 2006 saw a downward trend in the number of fatal accidents as compared to 2005,
but numbers of fatalities were more than the previous year. Number of fatal accidents during
the year 2006 was 79 and number of fatalities was 138 as compared to 96 accidents and 117
fatalities during the year 2005.
Table: 16 indicate the trend of accidents and rates of fatalities.
TABLE: 16 TREND IN FATAL ACCIDENTS AND FATALITY RATES PER 1000
PERSONS EMPLOYED IN COAL MINES (10 YEARLY AVERAGE)
YEAR Av. No. of accidents Accident rate Av. No. of fatality Fatality rate
1901-1910 74 0.77 92 0.94
1911-1920 138 0.94 176 1.29
1921-1930 174 0.99 219 1.24
1931-1940 172 0.98 228 1.33
1941-1950 236 0.87 273 1.01
1951-1960 222 0.61 295 0.82
1961-1970 202 0.48 260 0.62
1971-1980 187 0.46 264 0.55
1981-1990 162 0.30 186 0.35
1991-2000 140 0.27 170 0.33
2001-2006* 89 0.21 117 0.28

DGMS Annual Report,2006
13
Table: 17 gives year-wise fatal accidents, fatalities, and death rates in coalmines.
TABLE: 17 TREND IN FATAL ACCIDENTS AND DEATH RATES IN COAL MINES (YEAR-WISE)
Year No. of fatal
accidents
No. of persons
killed
Death Rate
Per ‘000 persons employed
Per 100,000 manshifts worked
Per million tonnes output
1951 278 319 0.91 0.32 9.12
1961 222 268 0.65 0.22 4.81
1971 199 231 0.60 0.21 3.05
1981 165 184 0.36 0.12 1.45
1991 138 143 0.26 0.08 0.60
1992 165 183 0.33 0.11 0.73
1993 156 176 0.32 0.10 0.68
1994 156 241 0.46 0.15 0.90
1995 137 219 0.43 0.14 0.77
1996 131 146 0.29 0.09 0.48
1997 143 165 0.33 0.10 0.52
1998 128 146 0.30 0.10 0.46
1999 127 138 0.29 0.09 0.44
2000 117 144 0.31 0.10 0.43
2001 105 141 0.32 0.10 0.41
2002 81 97 0.23 0.07 0.27
2003 83 113 0.27 0.09 0.30
2004 87 96 0.24 0.07 0.23
2005 96 117 0.29 0.09 0.29
2006* 79 138 0.36 0.11 0.34 * Provisional
Year 2006 saw a downward trend in the number of serious accidents and number of persons
seriously injured. Number of serious accidents was 793 and number of persons injured was
823 as compared to 1106 and 1138 respectively during the year 2005. As far as the serious
accident rate is concerned, it has decreased marginally. The serious injury rate per thousand
persons employed in 2006 was 2.13 as compared to 2.85 in 2005. The above rate per lakh
manshifts worked decreased to 0.67 in 2006 from 0.91 in 2005. The rate per million tonnes
output decreased to 2.04 in 2006 from 2.70 in 2005. Table: 18 gives year-wise number of
serious accidents, no. of persons injured and serious injury rate.
TABLE: 18 TREND IN SERIOUS ACCIDENTS AND SERIOUS INJURY RATES IN COAL
MINES (YEAR-WISE) Year No. of serious
accidents No. of persons injured
Serious injury rates
Per ‘000 persons employed
Per 100,000 manshifts worked
Per million tonnes output
1991 803 854 1.54 0.50 3.59
1992 810 894 1.62 0.53 3.58
1993 854 903 1.65 0.68 3.46
1994 717 775 1.48 0.47 2.90
1995 757 813 1.58 0.51 2.86
1996 677 723 1.43 0.45 2.38
1997 678 726 1.44 0.46 2.29
1998 523 560 1.14 0.37 1.75
1999 595 650 1.37 0.44 2.06
2000 661 707 1.54 0.49 2.11
2001 667 720 1.64 0.53 2.10
2002 629 665 1.57 0.50 1.83
2003 563 590 1.42 0.45 1.56
2004 962 991 2.45 0.77 2.42
2005 1106 1138 2.85 0.91 2.70
2006* 793 823 2.13 0.67 2.04 * Provisional

DGMS Annual Report,2006
14
2.2.3 Analysis of accidents
All fatal accidents and major serious accidents were inquired into by officers of DGMS. An
analysis of accidents enumerated in the following paragraphs is based on the findings of such
enquiry and information submitted by the mine management.
2.2.3A By place
Total 79 fatal accidents involving 138 persons occurred during the year 2006 compared to 96
fatal accidents and 117 fatalities during 2005. Fatality rate (overall) has increased to 0.36 in
2006 from 0.24 during the year 2005. Serious injury rate during the year 2006 has decreased
to 2.13 as compared to 2.85 in 2005 for overall injury rates. 44(56%) fatal accidents occurred
belowground with a fatality rate of 0.50, 24(30%) in opencast workings with fatality rate of 0.39
and 11(14%) in surface operation with fatality rate of 0.09 during the year 2006. It may be
mentioned that out of 400,000 average daily employment 51% was in belowground workings,
18% was in opencast workings and the remaining 31% was engaged in surface operations.
Table 19 gives the trend of fatal and serious accidents with fatality rate in different working
places.
TABLE: 19 TREND IN FATAL & SERIOUS ACCIDENTS AND DEATH & SERIOUS
INJURY RATES; (PLACEWISE) - COAL MINES
PER THOUSAND PERSONS EMPLOYED
YEAR Fatal accidents & death rates Serious accidents & ser. injury rates
BG OC AG Overall BG OC AG Overall 1991 80
(0.26) 25
(0.39) 33
(0.20) 138
(0.26) 577
(1.96) 60
(1.00) 166
(0.98) 803
(1.54)
1992 107 (0.39)
32 (0.52)
26 (0.18)
165 (0.33)
587 (2.14)
49 (0.79)
174 (1.01)
810 (1.62)
1993
101 (0.39)
24 (0.37)
31 (0.19)
156 (0.32)
632 (2.19)
57 (0.83)
165 (1.01)
854 (1.65)
1994 93 (0.59)
39 (0.64)
24 (0.15)
156 (2.08)
560 (2.08)
50 (0.86)
107 (0.67)
717 (1.48)
1995 91 (0.60)
26 (0.38)
20 (0.13)
137 (0.43)
549 (2.07)
69 (1.05)
139 (0.93)
757 (1.58)
1996
75 (0.31)
27 (0.42)
29 (0.19)
131 (0.29)
478 (1.83)
71 (1.10)
128 (0.86)
677 (1.43)
1997
94 (0.41)
27 (0.42)
22 (0.14)
143 (0.33)
440 (1.71)
79 (1.25)
158 (1.05)
677 (1.44)
1998 80 (0.36)
24 (0.35)
24 (0.16)
128 (0.30)
346 (1.41)
72 (1.06)
105 (0.70)
523 (1.14)
1999
74 (0.33)
30 (0.43)
23 (0.16)
127 (0.29)
408 (1.73)
77 (1.19)
110 (0.81)
595 (1.37)
2000
62 (0.30)
38 (0.74)
17 (0.13)
117 (0.31)
444 (1.92)
108 (1.67)
109 (0.82)
661 (1.54)
2001 67 (0.43)
26 (0.38)
12 (0.10)
105 (0.32)
464 (2.10)
73 (1.12)
130 (1.07)
667 (1.64)
2002 48 (0.27)
22 (0.32)
11 (0.11)
81 (0.23)
434 (2.07)
92 (1.43)
103 (0.80)
629 (1.57)
2003
46 (0.33)
23 (0.35)
14 (0.13)
83 (0.27)
380 (1.85)
82 (1.30)
101 (0.77)
563 (1.42)
2004
49 (0.27)
32 (0.47)
06 (0.05)
87 (0.24)
757 (3.69)
82 (1.24)
123 (1.02)
962 (2.45)
2005 49 (0.34)
28 (0.41)
19 (0.16)
96 (0.24)
843 (4.23)
98 (1.45)
165 (1.37)
1106 (2.8)
2006 44 (0.50)
24 (0.39
11 (0.09)
79 (0.36)
603 (3.03)
72 (1.29)
119 (1.02)
793 (2.13)
* Provisional Note - Figures in bracket indicate death/injury rate

DGMS Annual Report,2006
15
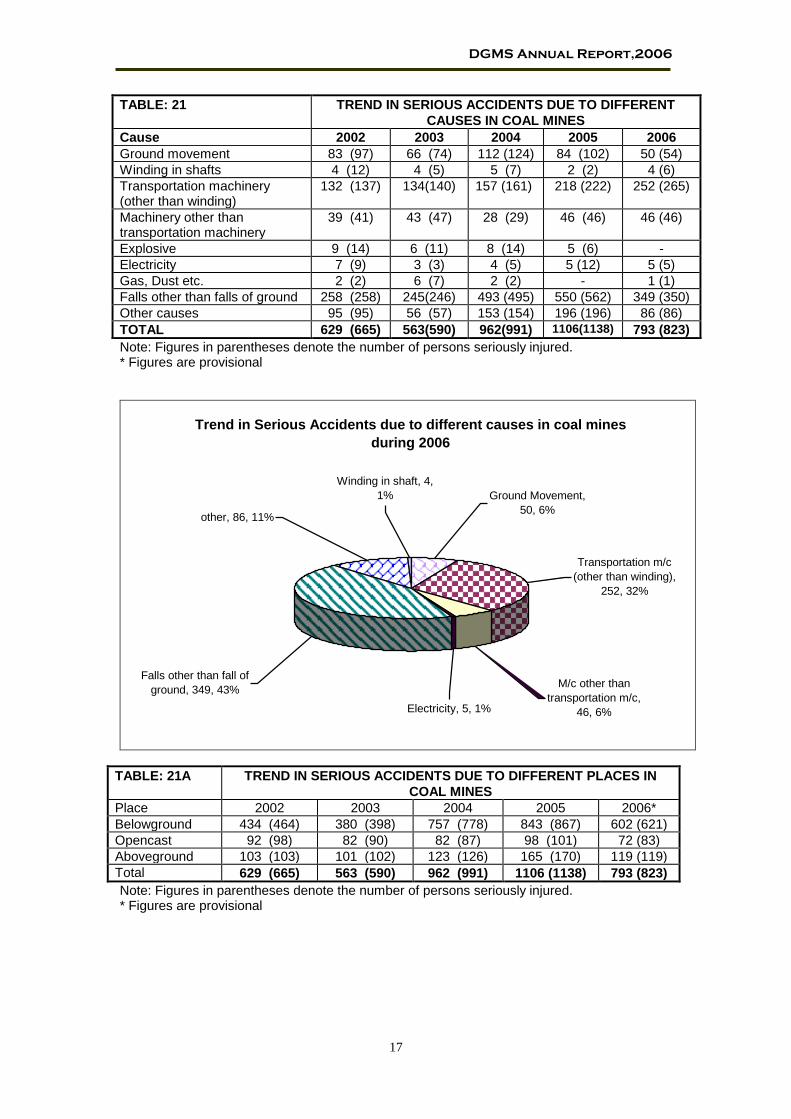
2.2.3B By cause Tables 20 & 21 give the trend in fatal and serious accidents in coalmines due to different
causes during the year 2006 compare with last four years followed by graphical
representation. As can be seen 18 (23%) of fatal accident were caused by ground movement,
24 (30%) due to transportation machinery (other than winding), 9 (11%) due to machinery
other than transportation machinery, and falls other than falls of ground contributed 11 (14%)
while other causes such as electricity contributed 3 (4%) and explosives contributed 1 (1%).
793 serious accidents occurred during the year out of which 349 (44%) were caused by falls
other than falls of ground, transportation machinery (other than winding) contributed 252
(32%), ground movement 50 (6%) while other causes contributed 86 (11%) of all serious
accidents.

DGMS Annual Report,2006
16
TABLE:20 TREND IN FATAL ACCIDENTS DUE TO DIFFERENT
CAUSES IN COAL MINES
Cause 2002 2003 2004 2005 2006*
Ground movement 35 (48) 24 (33) 33 (38) 25 (32) 18 (27)
Winding in shafts - 1 (1) - 1 (1) 3 (3)
Transportation machinery (other than winding)
22 (22) 33 (34) 29 (30) 36 (37) 24 (25)
Machinery other than transportation machinery
9 (9) 11 (14) 6 (6) 11 (11) 9 (9)
Explosive 4 (4) 3 (3) 5 (6) 2 (2) 1 (1)
Electricity 4 (4) 1 (1) 4 (4) 4 (4) 3 (3)
Gas, Dust etc. - 2 (3) 2 (2) - 4 (53)
Falls other than falls of ground 6 (9) 6 (6) 5 (5) 12 (12) 11 (11)
Other causes 1 (1) 2 (18) 3 (5) 5 (18) 6 (6)
TOTAL 81 (97) 83 (113) 87 (96) 96 (117) 79 (138)
Note: Figures in parentheses denote the number of persons killed. * Figures are provisional
Trend in Fatal Accidents due to different causes in coal mines
during 2006
Winding in shaft, 3,
4%
Electricity, 3, 4%
Falls other than fall of
ground, 11, 14%
Explosive, 1, 1%
M/c other than
transportation m/c, 9,
11%
other, 6, 8%
Gas, dust, 4, 5%
Ground Movement,
18, 23%
Transportation m/c
(other than w inding),
24, 30%
TABLE:20A TREND IN FATAL ACCIDENTS IN DIFFERENT PLACES
OF COAL MINES
Place 2002 2003 2004 2005 2006*
Belowground 48 (61) 46 (72) 49 (57) 49 (69) 44 (102)
Opencast 22 (22) 23 (24) 32 (33) 28 (29) 24(25)
Aboveground 11 (14) 14 (17) 6 (6) 19 (19) 11 (11)
Total 81 (97) 83 (113) 87 (96) 96 (117) 79 (138)
Note: Figures in parentheses denote the number of persons killed. * Figures are provisional
DGMS Annual Report,2006
17
TABLE: 21 TREND IN SERIOUS ACCIDENTS DUE TO DIFFERENT
CAUSES IN COAL MINES
Cause 2002 2003 2004 2005 2006
Ground movement 83 (97) 66 (74) 112 (124) 84 (102) 50 (54)
Winding in shafts 4 (12) 4 (5) 5 (7) 2 (2) 4 (6)
Transportation machinery (other than winding)
132 (137) 134(140) 157 (161) 218 (222) 252 (265)
Machinery other than transportation machinery
39 (41) 43 (47) 28 (29) 46 (46) 46 (46)
Explosive 9 (14) 6 (11) 8 (14) 5 (6) -
Electricity 7 (9) 3 (3) 4 (5) 5 (12) 5 (5)
Gas, Dust etc. 2 (2) 6 (7) 2 (2) - 1 (1)
Falls other than falls of ground 258 (258) 245(246) 493 (495) 550 (562) 349 (350)
Other causes 95 (95) 56 (57) 153 (154) 196 (196) 86 (86)
TOTAL 629 (665) 563(590) 962(991) 1106(1138) 793 (823)
Note: Figures in parentheses denote the number of persons seriously injured. * Figures are provisional
Trend in Serious Accidents due to different causes in coal mines
during 2006
Electricity, 5, 1%
Falls other than fall of
ground, 349, 43%M/c other than
transportation m/c,
46, 6%
other, 86, 11%
Winding in shaft, 4,
1% Ground Movement,
50, 6%
Transportation m/c
(other than winding),
252, 32%
TABLE: 21A TREND IN SERIOUS ACCIDENTS DUE TO DIFFERENT PLACES IN
COAL MINES
Place 2002 2003 2004 2005 2006*
Belowground 434 (464) 380 (398) 757 (778) 843 (867) 602 (621)
Opencast 92 (98) 82 (90) 82 (87) 98 (101) 72 (83)
Aboveground 103 (103) 101 (102) 123 (126) 165 (170) 119 (119)
Total 629 (665) 563 (590) 962 (991) 1106 (1138) 793 (823)
Note: Figures in parentheses denote the number of persons seriously injured. * Figures are provisional

DGMS Annual Report,2006
18
2.2.3B.1 Ground movement
During the year 2006, ground movement accounted for 18 (22.78%) fatal accidents and 50
(6.31%) serious accidents. Further break-up of fatal accidents due to ground movement is
given in table: 22.
TABLE: 22 FATAL ACCIDENTS DUE TO GROUND MOVEMENT IN COAL
MINES DURING THE YEAR 2006
Cause No. of accidents Persons killed Persons seriously inj.
1.Fall of roof 13 22 9
2.Fall of side (a) belowground 2 2 1 (b) opencast 1 1 -
Sub-Total 3 3 1
3.Others (a) bumps - - - (b) air blast - - - (c) land slide - - - (d) collapse of pillar 1 1 1 (e) over hang 1 1 1
Sub-Total 2 2 1
GRAND TOTAL 18 27 11
2.2.3B.2 Roof fall
Strata control is a major problem affecting safety and productivity in underground mines.
Experience of the past clearly brings out that roof fall is one of the predominant causes of
fatalities in belowground coalmines and that trend continues even today. There were 18
accidents due to ground movement involving 27 fatalities and 11 serious injuries occurred due
to this cause during the year 2006, out of which 13 accidents were due to fall of roof and 5
accidents were due to side fall and over hangs. Roof fall accidents accounted for 16.46% of all
fatal accidents in coalmines and it contributed 29.55% of all fatal accidents in belowground
operations. Further critical analysis of roof fall accidents for the last five years 2002 to 2006
revealed the following:
I. Physical and Working Condition factors -
1. Method of work: Accident mainly occurred in Bord and Pillar districts and equally
both in development and depillaring. 53% of the fatal accidents occurred in B&P
development, 27% in depillaring districts (27% in caving districts and 11% in stowing
districts), 0% in longwall faces and 7% in other places.
2. Height of working: 85% of the fatal accidents occurred in gallery height upto 3m,
14% in 3m. to 5 m.
3. Width of gallery: 7% of the fatal accidents occurred in width of galleries between 0 -
3.0m and 7% in width between 3.01 -3.5m, 19% between 3.51-4.00m, 39% between
4.01 -4.50m and 28% above 4.50 m.
4. Distance from face: 63% of the accidents occurred within 5 m. of the working face
and 9% between 5.01 to 10 m. 7% between 10.01-20m. Thus 72% of the accident
occurred within 10 m. of the freshly exposed roof from the face of working. About 13%

DGMS Annual Report,2006
19
of the accident occurred in other roadways where either roof supports were being
replaced or no attention was paid for checking old existing supports.
5. Type of support: 37% of the fatal accidents accounted in areas supported by timber
support only, 36% in roof bolts & others and in 3% of the cases supports were not
provided at all. Areas supported by timbers were more prone for roof fall. Steel
supports, especially roof bolts, are more stable if they are fixed properly and in time.
6. Adequacy of support: Accident analysis revealed that in 50% of cases supports
provided was inadequate, which means sufficient number of supports are not
provided before engaging persons at work and majority of the accidents could have
been averted had proper supports were provided before engaging the persons at work
and front line supervisors been attentive for providing adequate supports.
7. Operation at the time of accident: 27% of the fatal accidents occurred during
loading operation, 11% during dressing, 14% during supporting, that is 52% of the
accidents occurred during primary job of face preparation and manual loading. This
can be avoided by adequately training the face workers for paying more attention
towards identification of bad roof and testing for its weakness and by providing
temporary supports before erecting permanent support. 12% of the cases occurred
during withdrawal of supports and 19 % in other activities.
8. Time elapsed after blasting: 33% of the roof fall accidents occurred within 30
minutes of blasting operation which correlates with the operation at the time of
accident as mentioned above. This also means that sufficient time is not allowed for
the roof to settle before engaging persons. 3% occurred between ½ - 1 hour, 9%
between 1 to 2 hours and 23% of the fatal accidents occurred beyond 2 hours of
blasting operation and in 33% of cases no blasting operation was carried out within 4
hours.
II. Geological factors -
9. Thickness of seam: 44% of the fatal accidents occurred in coal seam having
thickness upto 3.0 m., 29% in 3 to 6 m. and 7% in seams with thickness between 6-
9m. Thus roof fall occurred in all types of coal seams irrespective of their thickness.
10. Depth of cover: 44% of the fatal accidents accounted in depth of cover upto 100 m,
29% in 101 to 200m. and 16% between 201 to 300. Practically roof fall accidents
occurred at every place irrespective of the depth in proportion to the working plan at
various depths.
11. Thickness of fall: In case of 27% of the fatal accidents thickness of fallen strata
varying between 0 to 0.15m, in 31% between 0.16 to 30 m. (i.e. 58% of the accidents
had thickness of fall between 0- 0.3m) and in 26% between 0.31 to 1.0 m. thick and
in 15% beyond 1.00m thick. Fall of the roof was mainly due to geological reasons
such as presence of slicken sides, hidden slip planes, or due to weathering of strata

DGMS Annual Report,2006
20
etc. which could have been effectively controlled had adequate and timely supports
been provided.
12. Nature of fallen strata: 39% of the fatal accidents occurred due to fall of sand stone
roof, 27% due to coal and 22% due to shale, remaining due to combination of any
two. Indicating that practically all types of roof is likely to fall in absence of adequate
supports.
III. Personal factors -
13. Designation: 27% of the persons involved in roof fall accidents were supportmen,
47% loaders, 3% drillers and 4% subordinate supervisory staff. Mainly face workers
were involved in the accidents as they are first to approach the face and stay beneath
the green roof areas for longer duration.
14. Age: In 41% of the total accidents persons involved were in the age group of 31-40
years, 9% between 41-45, 18% between 46-50, and 32% 56-60 years. and 9%
between 56-60 years. The available data indicates that more susceptible are between
56-60 years which accounts about 32% of the total fatalities.
15. Shift of working: 51% of the fatal accidents took place in 1st shift, 29% in 2nd shift
and 20% 3rd shift. Thus roof fall occurred equally in all the shifts, but marginally more
in first shift due to more number of persons employed during day time.
16. Hours at work: 10% of the roof fall accidents occurred in first two hours of the work,
40% between second and forth hour, 27% between fourth & fifth hours, 18% of the
fatal accidents took place during fifth & seventh hours of the shift and 2% during last
hour.
IV. Management factors -
17. Responsibility: 29% of the fatal accidents were caused due to fault of management
and Subordinate Supervisory Staff; 34% of the fatal accidents due to fault of
Subordinate Supervisory Staff alone, in 8% of the cases management alone was
responsible and 12% cases were declared as misadventure.
18. Company: Company-wise analysis indicates that 75% of roof fall accident occurred in
CIL, Subsidiary-wise 18% in ECL, 21% in SECL, 9% in WCL, 15% in BCCL, 5% in
CCL, 6% in MCL, 23% in SCCL and 3% in TISCO.
Detailed statistical analysis of roof fall accidents that occurred during last 5 years have been
represented in tabular and graphically in the following tables:

DGMS Annual Report,2006
21
1. Distribution of fatal roof fall accidents by method of work
Method of
work
Number of accidents
2002 % 2003 % 2004 % 2005 % 2006 % total %
Board & Pillar Development
11
50
7
44
15
58
11
61
6
46
50
53
Longwall Development
0 0 0 0 0 0 0 0 0 0 0 0
Depillaring Caving 8 36 5 31 5 19 3 17 5 38 26 27
Stowing 2 9 4 25 2 8 1 6 1 8 10 11
Total
Depillaring 10 45 9 56 7 27 4 22 6 46 36 38
Longwall Depillaring Caving
0
0
0
0
0
0
0
0
0
0
0
0
Stowing 0 0 0 0 0 0 2 11 0 0 2 2
Total
Longwall 0 0 0 0 0 0 2 11 0 0 2 2
Other Places 1 5 0 0 4 15 1 6 1 8 7 7
Total 22 100 16 100 26 100 18 100 13 100 95 100

DGMS Annual Report,2006
22
2. Distribution of fatal roof fall accidents by height of working
Height of
working
(metres)
Number of accidents
2002 % 2003 % 2004 % 2005 % 2006 % total %
0 - 2 3 14 2 13 4 15 2 11 2 15 13 14
2 - 3 18 82 12 75 18 69 12 67 8 62 68 71
3 - 5 1 5 2 13 4 15 4 22 2 15 13 14
5 & above 0 0 0 0 0 0 0 0 1 8 1 1
not available 0 0 0 0 0 0 0 0 0 0 0 0
Total 22 100 16 100 26 100 18 100 13 100 95 100
3. Distribution of fatal roof fall accidents by width of gallery
width of
gallery
Number of accidents
(metres) 2002 % 2003 % 2004 % 2005 % 2006 % total %
0.00- 2.00 0 0 0 0 2 8 0 0 1 8 3 3
2.01- 3.00 0 0 0 0 3 12 1 6 0 0 4 4
3.01- 3.50 4 18 0 0 1 4 0 0 2 15 7 7
3.51- 4.00 4 18 4 25 4 15 4 22 2 15 18 19
4.01- 4.50 9 41 8 50 12 46 5 28 2 15 36 39
4.51 & above 5 23 4 25 4 15 8 44 6 46 27 28
not applicable
0 0 0 0 0 0 0 0 0 0 0 0
Total 22 100 16 100 26 100 18 100 13 100 95 100

DGMS Annual Report,2006
23
4. Distribution of fatal roof fall accidents by distance from face
Distance
from
face
Number of accidents
(metres) 2002 % 2003 % 2004 % 2005 % 2006 % total %
0.00- 5.00 15 68 9 56 15 58 11 61 9 69 59 63
5.01- 10.00 4 18 3 19 2 8 0 0 0 0 9 9
10.01- 20.00 1 5 2 13 2 8 1 6 1 8 7 7
20.01 & above
1 5 0 0 2 8 4 22 1 8 8 8
not applicable
1 5 2 13 5 19 2 11 2 15 12 13
Total 22 100 16 100 26 100 18 100 13 100 95 100
5. Distribution of fatal roof fall accidents by type of roof support
Type of
support
Number of accidents
2002 % 2003 % 2004 % 2005 % 2006 % total %
No support 2 9 0 0 1 4 0 0 0 0 3 3
Timber supports only
6 27 9 56 11 42 5 28 4 31 35 37
Timber and steel supports
2 9 1 6 7 27 1 6 0 0 11 12
Roof bolts and others 10 45 6 38 4 15 9 50 7 54 36 37
Other supports
2 9 0 0 3 12 3 17 2 15 10 11
Total 22 100 16 100 26 100 18 100 13 100 95 100

DGMS Annual Report,2006
24
6. Distribution of fatal roof fall accidents by adequacy of support
Adequacy of support
Number of accidents
2002 % 2003 % 2004 % 2005 % 2006 % total %
Adequate 12 55 9 56 15 58 4 22 5 38 45 47
Inadequate 10 45 7 44 11 42 13 72 6 46 47 50
Not applicable* 0 0 0 0 0 0 1 6 2 15 3 3
Total 22 100 16 100 26 100 18 100 13 100 95 100
* Provisional

DGMS Annual Report,2006
25
7. Distribution of fatal roof fall accidents by operation at the time of accident
operation at
the time of
accident
Number of accidents
2002 % 2003 % 2004 % 2005 % 2006 % total %
Cutting 0 0 0 0 0 0 0 0 1 8 1 1
Charging 0 0 0 0 0 0 0 0 0 0 0 0
Drilling 3 14 1 6 0 0 2 11 1 8 7 7
Drilling & Charging 0 0 0 0 0 0 0 0 0 0 0 0
Dressing 3 14 3 19 1 4 2 11 1 8 10 11
Dressing & Supporting 2 9 0 0 0 0 1 6 0 0 3 3
Loading (manual) 5 23 5 31 9 35 5 28 2 15 26 27
Loading by machine 3 14 1 6 0 0 1 6 1 8 6 6
Stowing 0 0 0 0 0 0 0 0 0 0 0 0
Supporting 3 14 1 6 3 12 2 11 1 8 10 11
Tramming 1 5 1 6 1 4 0 0 0 0 3 3
Withdrawal of supports 2 9 3 19 4 15 1 6 1 8 11 12
Roof testing 0 0 0 0 0 0 0 0 0 0 0 0
Others 0 0 1 6 8 31 4 22 5 38 18 19
Total 22 100 16 100 26 100 18 100 13 100 95 100

DGMS Annual Report,2006
26
8. Distribution of fatal roof fall accidents by time elapsed after blasting
time elapsed
after blasting
(hours)
Number of accidents
2002 % 2003 2004 % 2005 % 2006 % total %
0.00- 0.50 3 14 5 31 13 50 1 6 9 69 31 33
0.51- 1.00 0 0 1 6 1 4 0 0 0 0 2 2
1.01- 1.50 3 14 2 13 2 8 1 6 0 0 8 8
1.51- 2.00 0 0 0 0 1 4 0 0 0 0 1 1
2.01 & above 8 36 3 19 1 4 9 50 1 8 22 23
not applicable 8 36 5 31 8 31 7 39 3 23 31 33
Total 22 100 16 100 26 100 18 100 13 100 95 100
9. Distribution of fatal roof fall accidents by thickness of seam
Seam
thickness
(metres)
Number of accidents
2002 % 2003 % 2004 % 2005 % 2006 % total %
0.00- 3.00 11 50 7 44 14 54 6 33 4 31 42 44
3.01- 6.00 2 9 7 44 8 31 8 44 4 31 29 32
6.01- 9.00 2 9 0 0 3 12 0 0 2 15 7 7
9.01 & above 1 5 2 13 1 4 2 11 2 15 8 8
not available 6 27 0 0 0 0 2 11 1 8 9 9
Total 22 100 16 100 26 100 18 100 13 100 95 100

DGMS Annual Report,2006
27
10. Distribution of fatal roof fall accidents by depth of cover
Depth of
cover
(metres)
Number of accidents
2002 % 2003 % 2004 % 2005 % 2006 % total %
0- 100 9 41 8 50 12 46 8 44 4 31 41 44
101- 200 8 36 3 19 6 23 6 33 5 38 28 29
201- 300 2 9 4 25 3 12 4 22 3 23 16 17
301- 400 2 9 1 6 3 12 0 0 1 8 7 7
401 &
above 0 0 0 0 0 0 0 0 0 0 0 0
not
available 1 5 0 0 2 8 0 0 0 0 3 3
Total 22 100 16 100 26 100 18 100 13 100 95 100
11. Distribution of fatal roof fall accidents by thickness of fall
Thickness of fall
(metres)
Number of accidents
2002 % 2003 % 2004 % 2005 % 2006 % total %
0.00- 0.15 5 23 4 25 10 38 6 33 1 8 26 27
0.16- 0.30 8 36 5 31 8 31 3 17 5 38 29 31
0.31- 1.00 6 27 3 19 5 19 7 39 4 31 25 26
1.01 & above 3 14 3 19 3 12 2 11 3 23 14 15
not applicable 0 0 1 6 0 0 0 0 0 0 1 1
Total 22 100 16 100 26 100 18 100 13 100 95 100

DGMS Annual Report,2006
28
12. Distribution of fatal roof fall accidents by nature of fallen strata
Nature of
fallen strata
Number of accidents
2002 % 2003 % 2004 % 2005 % 2006 % total %
Coal 6 27 4 25 12 46 3 17 1 8 26 27
Shale 3 14 5 31 5 19 6 33 3 23 22 23
Sandstone 11 50 6 38 7 27 6 33 6 46 36 39
Coal & Shale 0 0 0 0 0 0 1 6 3 23 4 4
Coal & Sandstone 1 5 0 0 0 0 1 6 0 0 2 2
Shale & Sandstone 1 5 1 6 2 8 1 6 0 0 5 5
Total 22 100 16 100 26 100 18 100 13 100 95 100
13. Distribution of persons killed in roof fall accidents by designation
Category of
mine worker Number of persons killed
2002 % 2003 % 2004 % 2005 % 2006 % total %
Loader 12 35 14 56 14 45 11 44 12 55 63 47
Timberman 14 41 6 24 11 35 6 24 0 0 37 27
Dresser 1 3 1 4 0 0 2 8 0 0 4 3
Driller 2 6 1 4 0 0 0 0 1 5 4 3
Trammer 1 3 0 0 0 0 0 0 1 5 2 1
Shotfirer /Ex-plosive carrier 0 0 1 4 2 6 2 8 1 5 6 4
Sub. Supervi-sory staff 2 6 1 4 2 6 1 4 4 18 10 7
Others 2 6 1 4 2 6 3 12 3 14 11 8
Total 34 100 25 100 31 100 25 100 22 100 137 100

DGMS Annual Report,2006
29
14. Distribution of persons killed in roof fall accidents by age
age
Number of persons killed
2002 % 2003 % 2004 % 2005 % 2006 % total %
18 – 20 0 0 0 0 0 0 0 0 0 0 0 0
21 – 25 0 0 0 0 0 0 0 0 0 0 0 0
26 – 30 1 3 1 4 2 6 1 4 0 0 5 4
31 – 35 2 6 3 12 3 10 2 8 4 18 14 10
36 – 40 1 3 0 0 2 6 5 20 5 23 13 9
41 – 45 17 50 7 28 9 29 6 24 2 9 41 31
46 – 50 7 21 7 28 7 23 7 28 4 18 32 23
51 – 55 5 15 5 20 6 19 3 12 0 0 19 14
56 – 60 1 3 2 8 2 6 1 4 7 32 13 9
Total 34 100 25 100 31 100 25 100 22 100 137 100
15. Distribution of fatal roof fall accidents by shift during which accident occurred
Shift Number of accidents
2002 % 2003 % 2004 % 2005 % 2006 % total %
1st (7/8 AM to 3/4 PM)
7 32 8 50 12 46 11 61 10 77 48 41
2nd 3/4 PM to 11/12 M
11
50
4
25
8 31 3 17 2 15 28 29
3rd
11/12M to 7/8 AM
4
18
4
25
6
23
4 22 1 8 19 20
Total 22 100 16 100 26 100 18 100 13 100 95 100

DGMS Annual Report,2006
30
16. Distribution of fatal roof fall accidents by hours spent at work prior to the accident
Hours at Work Number of accidents
2002 % 2003 % 2004 % 2005 % 2006 % total %
0.00- 1.00 1 5 0 0 0 0 0 0 0 0 1 1
1.01- 2.00 3 14 2 13 1 4 3 17 0 0 9 9
2.01- 3.00 5 23 1 6 3 12 3 17 1 8 13 14
3.01- 4.00 4 18 5 31 6 23 3 17 6 46 24 26
4.01- 5.00 3 14 4 25 8 31 6 33 4 31 25 27
5.01- 6.00 3 14 2 13 1 4 2 11 1 8 9 9
6.01- 7.00 3 14 0 0 5 19 0 0 1 8 9 9
7.01- 8.00 0 0 1 6 0 0 1 6 0 0 2 2
8.01 & above 0 0 1 6 1 4 0 0 0 0 2 2
not available 0 0 0 0 1 4 0 0 0 0 1 1
Total 22 100 16 100 26 100 18 100 13 100 95 100
17. Distribution of fatal roof fall accidents by responsibility
Responsibility Number of persons
2002 % 2003 % 2004 % 2005 % 2006 % total %
Misadventure 3 14 2 13 4 15 1 6 1 8 11 12
Management 2 9 1 6 1 4 2 11 2 15 8 8
Mgt & SSS 4 18 2 13 7 27 11 61 4 31 28 29
Mgt, Deceased 0 0 0 0 0 0 0 0 1 8 1 1
Mgt & Others 1 5 0 0 4 15 0 0 0 0 5 5
SSS 9 41 8 50 8 31 3 17 3 23 31 34
SSS & Others 2 9 3 19 1 4 1 6 1 8 8 8
Shotfirer 1 5 0 0 0 0 0 0 0 0 1 1
Co-worker 0 0 0 0 0 0 0 0 0 0 0 0
Deceased 0 0 0 0 1 4 0 0 1 8 2 2
Total 22 100 16 100 26 100 18 100 13 100 95 100

DGMS Annual Report,2006
31
18. Distribution of fatal roof fall accidents by company
Company
Number of accidents
2002 % 2003 % 2004 % 2005 % 2006 % total %
BCCL 1 5 1 6 3 12 7 39 2 15 14 15
CCL 1 5 1 6 2 8 1 6 0 0 5 5
ECL 4 18 3 19 5 19 2 11 3 23 17 18
MCL 1 5 0 0 2 8 2 11 1 8 6 6
SECL 6 27 5 31 3 12 4 22 2 15 20 21
NEC 0 0 0 0 0 0 0 0 0 0 0 0
WCL 2 9 1 6 4 15 1 6 1 8 9 9
CIL: total 15 68 11 69 19 73 17 94 9 69 71 75
IISCO 0 0 0 0 0 0 0 0 0 0 0 0
SCCL 6 27 5 31 6 23 1 6 3 23 21 23
TISCO 1 5 0 0 1 4 0 0 1 8 3 3
All-India 22 100 16 100 26 100 18 100 13 100 95 101
DGMS Annual Report,2006
32
2.2.3B.3 Side fall and over hangs
There were 4 (5.06%) fatal accidents involving as many casualties due to fall of sides and
overhangs out of which three accidents took place in belowground workings and one in an
opencast workings. Out of three belowground accidents, in two cases side fall occurred in the
development area while in the other cases fall of over hang took place took place in developed
area.
In an opencast working a dozer operator was crushed to death in a case of side fall.
All the above accidents in belowground mines could have been avoided had the sides and
overhangs been properly dressed, supported and secured before engaging the persons and
had the supervisors been careful on their jobs.
Accident due to fall of sides and overhang accounted for 5.06% of all fatal accidents in
coal mines and 9.09% of all accidents in belowground workings.
2.2.3B.3 Air blast
There was no accident due to this cause during the year 2006.
2.2.3C Transportation machinery (Winding)
There were only 3 fatal accidents involving three fatalities at winding installation during the
year 2006 while ascending by cage in 2 cases person fell down to pit bottom and in one case
on-setter was found pressed by the cage.
2.2.3D Transportation machinery (Other than winding)
There were 24 fatal accidents (30.38% of total accidents) due to transportation machinery
other than winding reported during the year 2006. A detailed break–up of fatalities under this
category are given in the table below:-
TABLE - 23 FATAL ACCIDENTS DUE TO TRANSPORTATION
MACHINERY OTHER THAN WINDING IN SHAFTS IN COAL
MINES DURING 2006
Cause No. of fatal accidents Persons killed
1. Rope Haulage 8 8
2. Mechanical Conveyors 4 4
3. Dumpers 10 11
4. Truck & Tankers 1 1
5. Others - -
Total 24 25
It was seen that dumpers, rope haulages and belt conveyors were major contributing causes
under fatalities due to transportation machinery other than winding.

DGMS Annual Report,2006
33
2.2.3D.1 Rope Haulages
There were 8 fatalities (5.80% of all fatalities) caused due to rope haulages during the year
2006. Analysis of causes revealed that:-
One accident caused due to snapping of haulage rope and while escaping and hited on
a machine.
Four accidents occurred due to hit by moving tubs.
One accident occurred as while traveling sliped and hited by running tub
One accident occurred due to derailment of tubs & hited by a tub
One person was dragged by moving set of tubs and died.
2.2.3D.2 Mechanical / Belt Conveyors:
Five accidents resulting in five fatalities were caused by belt conveyors during 2006.
All the five accidents causing death of five persons occurred due to entangle with
moving tail end drum.
2.2.3D.3 Dumpers and tippers:
There were 10 fatalities (7.25% of all fatalities) caused due to dumpers during the year 2006.
The analysis of above accident revealed that:
5 accidents occurred killing 5 persons due to collision of dumpers.
4 accidents occurred due to runover by speeding dumper killing four persons.
2 fatalities occurred while a dumper hit 2 persons.
2.2.3D4 Truck & Tankers:
One accident occurred causing one fatality due to truck and tankers contributing 1.27% of
total accident.
One fatality due to collision of truck and motor cycle.
2.2.3E Machinery other than transportation machinery:
There were 9 accidents reported during the year 2006, which were caused due to machinery
other than transportation machinery. The analysis of the causes revealed that:-
Table – 24 FATAL ACCIDENTS IN COAL MINES DUE TO MACHINERY OTHER THAN
TRANSPORTATION MACHINERY DURING 2006
S.No. Cause Number of accidents Persons killed
1. Drilling m/c 1 1
2. Loading m/c SDL 1 1
3. Haulage engine 1 1
4. Shovels/Draglines 1 1
5. Crushing & Screening Plant 2 2
6. Other HEMM 2 2
7. Other non-transportation machinery
1 1
Total : 9 9
DGMS Annual Report,2006
34
Further analysis of the causes revealed that:-
One accident occurred as cable man was crushed underneath the crawler chain of a
drilling machine.
One accident occurred while inflating tyre of a loader, the tyre lock ring slipped & hit
the person who died.
One accident occurred killing haulage operator who got entangled between rotating
drum and rope.
One General Mazdoor got entangled with unguarded rotating coupling of a EKG
Shovel during trial run and died.
One accident occurred killing one person while mechanical fitter was pressed
between filler arm and vertical post of hopper structure.
One contractor worker present near crusher roller of feeder braker in Coal handling
plant got entangled with crusher roller.
One person was run over by a dozer.
A mobile crane hit and run over a person.
2.2.3F Explosives
There was 1 (1.27% of the total) fatal accidents involving one person however, there was no
serious accident due to explosives during the year 2006.
2.2.3G Electricity
There were 3 (3.80% of the total) fatal accidents and 5 (0.63% of the total) serious accidents
due to electricity during the year 2006.
2.2.3H Accidents due to Dust, Gas & Fire.
During the year 2006, there was 4 (5.06 of the total) fatal accident involving 53 (38.4%)
fatalities which includes a disaster due to explosion killing 50 persons.
2.2.3I Falls other than falls of ground
Falls other than fall of ground caused 11 (13.92% of the total) fatal accidents involving same
number of lives (8% of total fatalities).
2.2.3J Other causes
Six cases of fatal accident were reported due to miscellaneous causes during the year 2006.

DGMS Annual Report,2006
35
2.2.4 Responsibility Analysis of accidents as per the persons held responsible for the various causes of accidents
during the year 2006 has been indicated in table:25.
TABLE:25 RESPONSIBILITY FOR FATAL ACCIDENTS IN COAL MINES
DURING THE YEAR 2006
SL. NO. Responsibility No. of accidents
1. Misadventure 7
2. Management 7
3. Management & Subordinate Supervisory Staff (SSS) 11
4. Management, SSS, co-worker 6
5. Management, SSS & deceased 1
6. Management, SSS, co-worker & deceased 1
7. Management & co-worker 4
8. Management, co-worker & deceased 0
9. Management & deceased 4
10. Subordinate Supervisory Staff (SSS) 6
11. SSS & co-worker 3
12. SSS & deceased 2
13. Shotfirer 3
14. Co-worker 0
15. Co-worker & deceased 8
16. Deceased 3
17. Others 10
TOTAL 3
79
It can be seen that in 11(14%) cases management along with other subordinate staff were
responsible. In 6 (7.6%) of the cases subordinate supervisory staff alone were found
responsible. In 8(10.13%) cases coworker along with deceased and in 10(12.66%) cases the
deceased alone were responsible. These revelations draw the attention towards better
planning and implementation of safety status by the management, strict and disciplined
supervision by the subordinate supervisory staff and knowledge based effective training for
the workers.

DGMS Annual Report,2006
36
2.3 Dangerous occurrences
During the year 2006, 29 (twenty-nine) dangerous occurrences were reported under the Coal
Mines Regulations, 1957. Details of dangerous occurrences are given in table: 26.
TABLE:26 DANGEROUS OCCURRENCES IN COAL MINES DURING 2006
Sl.No. Cause No. of cases
1. Spontaneous heating belowground 11
2. Spontaneous heating in opencast working 0
3. Spontaneous heating at surface 01
4. Outbreak of fire underground from spontaneous heating 0
5. Outbreak of fire underground from causes other than spontaneous heating
2
6. Outbreak of fire in quarries from causes other than spontaneous heating
0
7. Outbreak of fire in surface from causes other than spontaneous heating
0
8. Premature collapse of workings or failure of pillars/ benches/major roof fall
01
9. Influx of noxious gases 01
10. Ignition or occurrence of inflammable gas 01
11. Over winding of cages etc. 0
12. Breakage of winding rope 02
13. Breakdown of winding engine, crank shaft, bearing etc. 02
14. Breakage, fracture etc of essential parts of machinery or apparatus whereby safety of persons was endangered
01
15. Irruption of water 02
16. Subsidence/potholing 0
17. Explosives 01
18. Breakage, fracture etc. of essential parts of machinery or apparatus whereby safety of persons was endangered
01
19. Transportation machinery, wheeled trackless 01
20. Fall of machinery from heights in opencast workings 01
21. Others 01
TOTAL 29
A. Spontaneous Heating
12 cases of spontaneous heating were reported, 13 in belowground workings and
one on surface. Of the belowground heating three were in caved and sealed off
goaf, four cases were of spontaneous heating in fallen coal, two were in stowing
panels, one was in caving panel just before sealing and one was due to sluggish
ventilation in old workings.
Contributory factors for spontaneous heating:
The prime contributory factors which lead to spontaneous heating and thereby fires:
Not workings the mines in panel system.
Not sectionalizing the old workings.
Not cleaning the old galleries and return airways off fallen coal and not treating
thoroughly with stone dust.

DGMS Annual Report,2006
37
Sluggish ventilation in old workings and depillaring areas.
Poor and improper stowing. In some cases it was even observed that stowing
borehole was located directly in the panel, thereby the workings outbye of it
cannot be stowed effectively and safely.
Working the depillaring panel beyond the incubation period.
Not filling up the surface cracks formed due to subsidence and causing leakage
of air into the sealed off areas.
Not making and maintaining the isolation stoppings as prescribed.
Non provision of latest carbon monoxide gas detecting devises.
Most of the laboratories were not provided with Graham Lawrence apparatus to
analyze carbon monoxide gas in the earlier stages.
The prime contributory factors which lead to fires in opencast equipment were:
Not maintaining the electrical circuits of HEMM in proper working order.
Not providing and maintaining the automatic fire fighting systems in HEMM,
specially in dumpers.
Not framing and implementing code of practice to prevent fires in opencast mines.
Not maintaining the general fire fighting systems or improper training in fire
fighting systems.
B. Other fires:
There was one case of a fire which broke out in an opencast drill (HEMM) due to
electrical short circuiting.
Proper code of practice for prevention of fires in HEMM should be framed and enforced.
C. Premature collapse of workings or failure of pillars/benches
There were two cases of premature collapse of overburden benches.
In one case failure of bench occurred due to rains along an already existing weak
plane. In another case the coal rib left against slice had failed.
D. Influx of noxious gases
There was one case where carbon monoxide gas made influx into working area.
Again, this was due to spontaneous heating.
E. Ignition or occurrence of inflammable gas
There was one case of ignition or occurrence of inflammable gas.
F. Irruption of water
There was no case of irruption of water.

DGMS Annual Report,2006
38
H. Subsidence/Potholing
There were two cases of potholing due to low cover and in both cases water also
gushed in thereafter.
I. Explosives
One case was due to blasting in opencast workings where a drill was buried and
damaged. Machinery should be shifted to safe distances before blasting.
J. Other causes in opencast workings.
One case was due to head on collision of two tippers in opencast workings.
In one case boom of electric operated EKG shovel failed.
K. Other causes in belowground workings.
Two cases of over winding of cages.
One case of breakdown of winding engine, crank shaft, bearing etc.
One case of failure of pillars.
Proper code of practices for different operations including maintenance should be framed
and followed.
2.4 Technical Developments
During the year 2006, 14.93% of the total production came from underground
workings and 85.07% of the total production came from opencast mines. As far as
average daily employment was concerned 51% were employed belowground, 17.75%
were employed in opencast workings and the remaining 31.25% were employed for
other surface operations.
In opencast workings during 2006, there is increase in use of HEMM in comparison to
2005. Table 27 presents the trend in use of HEMM in opencast coalmines.
During the 2006, 1039 Excavators, 4560 dumpers capacity varying from 35T to 120T,
925 drills of 50 mm to 250 mm, 60 draglines and 30 surface miners were used in
opencast mines. As a result of improved mechanization 27 road headers, 927 SDLs,
281 LHDs, 3 continuous miners and 2 coal hauler were used in belowground coal
mines.

DGMS Annual Report,2006
39
TABLE:27 TREND IN USE OF HEAVY EARTH MOVING MACHINERY
IN OPENCAST COAL MINES
Year Shovels Draglines Drills Dumpers Others HP of the machinery
1990 787 41 703 3663 1885 2,711,279
1991 864 41 703 3846 1746 2,972,990
1992 892 47 829 4223 2112 3,227,528
1993 910 44 802 4385 1952 3,409,140
1994 946 43 822 4437 1946 3,448,234
1995 956 42 871 4291 2116 3,639,816
1996 961 59 864 4038 1856 3,436,437
1997 1017 42 913 4399 2177 3,703,276
1998 1106 41 918 4520 2279 3,826,094
1999 1216 49 962 4776 2372 4,058,489
2000 1143 43 969 4602 2333 3,938,986
2001 1172 42 977 4666 2304 3,965,541
2002 1159 41 972 4721 2136 3,864,244
2003 1136 39 1003 4576 2163 4,095,742
2004 1135 45 978 4516 2367 3,995,550
2005 1073 34 922 4553 2085 4,035,171
2006* 1070 36 925 4560 2150 4,040,000 * Provisional
(a) Number of machines used in underground coal mines of different coal companies
are as follows:
Table-28 Number of machines used in underground coal mines during 2006
Name of
Company
Road header/
Dint header
SDL LHD Continuous
Miners
Coal
haulers
Other
BCCL 9 124 7 0 0 0
ECL 3 111 26 0 0 2
CCL 0 20 13 0 0 0
SECL 3 382 52 1 0 0
WCL 0 142 109 1 2 1
NCL 0 0 0 0 0 0
MCL 0 19 38 0 0 0
NECL 0 0 0 0 0 0
GMDC 0 0 0 0 0 0
NLC 0 0 0 0 0 0
TATA 1 29 0 0 0 0
SCCL 11 100 36 1 0 0
GIPCL 0 0 0 0 0 0
JSMDC 0 0 0 0 0 0
RSMM 0 0 0 0 0 0
TOTAL 27 927 281 3 2 3

DGMS Annual Report,2006
40
(b) Number of machines used in opencast coal mines of different coal companies are
as follows: TABLE-29 Number of machines used in opencast mines during 2006
Name
of co.
Bu
cket
wh
eel
Excavato
r
Dra
gli
ne
Su
rface M
ine
rs
Oth
ers
Dumpers Excavators Drills
170
T
120
T
85
T
50
T
35
T
>20
cu
m
19-
10
cu
m
9-5
cu
m
< 5
cu
m
>
250
m
m
249-
150
mm
<
150
m
m
BCCL 0 2 0 0 0 0 54 2 539 0 8 66 82 0 97 45
ECL 0 1 0 0 15 26 35 19 171 5 12 18 46 15 35 15
CCL 0 0 5 0 0 0 125 73 391 1 14 46 49 50 73 18
SECL 0 9 2 0 0 83 29 81 174 0 20 28 28 52 67 5
WCL 0 4 0 170 0 0 0 207 493 0 0 40 119 21 91 0
NCL 0 19 0 372 24 153 367 0 0 3 69 9 30 97 35 3
MCL 0 6 21 254 0 0 33 282 13 0 4 23 50 31 49 8
NECL 0 0 0 0 0 0 0 0 173 0 0 0 22 0 0 12
GMDC 2 0 0 0 0 0 0 8 88 0 0 3 66 0 0 1
NLC 22 0 0 539 0 0 0 3 17 0 0 2 68 10 13 14
TATA 0 0 0 0 0 0 41 47 0 0 5 12 0 0 19 0
SCCL 0 2 1 0 0 0 143 0 217 0 22 0 48 22 24 0
GIPCL 1 17 1 7 0 0 0 26 74 0 0 2 0 0 0 0
JSMDC 0 0 0 0 0 0 0 0 19 0 0 0 5 0 0 2
RSMM 0 0 0 0 0 0 0 2 58 0 0 0 14 0 0 0
TOTAL 25 60 30 1342 39 262 827 750 2427 9 154 249 627 298 503 123

DGMS Annual Report,2006
41
2.5 Occupational Health
Medical Examination by Appellate Medical Board
Initial and periodical medical examination under Rule 29B of the Mines Rules, 1955 are
conducted by management and medical re-examination by Appellate Medical Board
constituted by Central Government under Rule 29K.
(a) Progress of Medical Examination in Coal Mines:
TABLE: 30 PROGRESS OF INITIAL & PERIODICAL MEDICAL
EXAMINATION DURING 2006 IN COAL MINES
Name of Company Initial Medical Examination Periodical Medical Exam.
Required Provided Required Provided
BCCL 1421 1421 15611 20219
MCL 482 482 3755 4206
WCL 471 471 13761 13855
CCL 39 39 8783 7803
NECL - - 524 524
ECL 1824 1824 21434 19944
SECL 663 663 17210 17207
NCL 65 65 3246 3084
SCCL - - 12168 13475
TATA 30 65 1217 1178
GIPCL 168 168 - -
NLC 135 135 1492 669
GMDC 367 360 300 246
JSMDC 5 5 20 25
RSMM 15 15 13 -
(b) Cases of Notified Diseases in Coal Mines:
TABLE: 31 CASES OF NOTIFIED DISEASES IN COAL MINES DURING
THE YEAR 2006
Mining Companies Name of Disease Number of cases
Nil Nil Nil

DGMS Annual Report,2006
42
2.6 Vocational Training Recognizing the need for safety education to enable the mineworkers to prepare them to
face the challenges of mining, the Mines Vocational Training Rules were framed in 1966.
These rules provide the provision for construction of mine vocational training centers, initial,
refresher and special training to mine workers, appointment of training officers, instructors,
proper training aids and equipments. It also provides for payment to trainees during the
training period. Progress of vocational training in coalmines during the year 2006 was reported
to be as follows.
TABLE: 32 PROGRESS OF VOCATIONAL TRAINING IN COAL MINES
DURING THE YEAR 2006 Name of the Company.
No. of VT Centers
Basic Training Refresher Training Special Training Provided Required Provided Required Provided
BCCL 13 - 468 10230 8308 2043
MCL 5 482 482 2689 2674 1256
WCL 11 428 428 8661 8578 1315
CCL 14 227 227 6720 5115 622
NECL 3 - 194 568 692 362
ECL 21 1685 1685 15821 1147 4515
SECL 26 530 530 8450 9372 2034
NCL 8 65 65 2210 2194 2769
TATA 2 75 1458 1912 2699 2237
GIPCL 1 85 85 10 10 0
NLC 1 4924 6453 1256 1243 1000
SCCL 8 939 939 14560 14560 4921
GMDC 2 645 1030 240 183 30
JSMDC 1 5 5 20 25 5
RSMM 1 113 113 12 12 10

DGMS Annual Report,2006
43
2.7 Workmen’s Inspector, Safety Committee & Welfare Officers
Much greater strides in safety can be achieved by participation of workmen in safety
programme, the twin institutions of 'Safety Committee & ‘Workmen’s Inspector’ have been
conceived and given the statutory backing. DGMS is also associated with training of
Workmen’s Inspectors to make them effective in discharge of their duties. In coal mines
almost all the eligible mines had Workmen’s Inspector and Safety Committee. The table below
shows the status of appointment of Welfare Officer, Workmen’s Inspector and formation of
Safety Committees during the year 2006.
TABLE: 33 NUMBER OF WORKMEN’S INSPECTOR IN POSITION, SAFETY
COMMITTEE, WELFARE OFFICERS IN COAL MINES DURING 2006
Name of
Company
Welfare Officers Workmen Inspectors Safety Committee
Required Provided Required Provided Required Provided
BCCL 217 217 71 71 73 73
MCL 20 22 60 65 20 20
WCL 81 81 230 230 81 81
CCL 61 61 183 183 61 61
NECL 5 4 15 15 5 5
ECL 107 90 315 315 105 105
SECL 91 91 273 273 86 86
NCL 8 8 29 29 8 8
TATA 5 6 42 55 8 9
GIPCL 4 4 1 1 1 1
NLC 4 4 20 23 7 7
SCCL 55 55 165 165 62 62
GMDC 2 3 9 10 4 4
JSMDC - - 2 2 1 1
RSMM - - - 2 1 1

DGMS Annual Report,2006
44
2.8 Owner-wise consolidated fatal accident statistics for last 8(Eight)
years in coal mines
Owner Year Fatal Accidents Death Rate
per 1000 persons
Belowground Opencast Aboveground Total BG OC AG Total
Acc Killed Acc Killed Acc Killed Acc Killed
BCCL 1999 20 22 3 3 3 3 26 28 0.52 0.27 0.11 0.35
2000 12 16 2 2 1 1 15 19 0.41 0.18 0.04 0.25
2001 9 37 3 3 2 2 14 42 0.99 0.28 0.09 0.60
2002 4 5 3 3 3 3 10 11 0.14 0.25 0.14 0.16
2003 7 8 2 2 3 3 12 13 0.24 0.20 0.15 0.21
2004 7 8 3 3 1 1 11 12 0.25 0.31 0.05 0.20
2005 10 15 1 1 4 4 15 20 0.50 0.10 0.23 0.35
2006 7 56 5 5 0 0 12 61 1.85 0.52 0.00 1.07
CCL 1999 2 2 3 3 1 1 6 6 0.11 0.18 0.05 0.11
2000 1 2 8 11 3 3 12 16 0.12 0.7 0.17 0.32
2001 2 2 3 3 0 0 5 5 0.13 0.19 0.00 0.1
2002 3 3 7 7 1 1 11 11 0.21 0.5 0.06 0.24
2003 3 3 2 2 1 1 6 6 0.21 0.14 0.06 0.14
2004 5 5 5 5 0 0 10 10 0.37 0.41 0.00 0.24
2005 3 16 4 5 0 0 7 21 1.21 0.43 0.00 0.52
2006 2 2 1 1 2 2 5 5 0.15 0.09 0.13 0.12
ECL 1999 13 17 3 3 5 5 21 25 0.29 0.56 0.15 0.25
2000 10 11 2 2 3 3 15 16 0.2 0.39 0.09 0.17
2001 16 17 2 2 0 0 18 19 0.32 0.39 0.00 0.21
2002 5 5 3 3 1 4 9 12 0.1 0.74 0.14 0.14
2003 10 10 3 3 0 0 13 13 0.21 0.66 0.00 0.16
2004 10 11 5 5 1 1 16 17 0.24 1.09 0.04 0.22
2005 9 10 3 3 4 4 16 17 0.22 0.62 0.15 0.22
2006 7 12 1 1 0 0 8 13 0.27 0.21 0.00 0.17
MCL 1999 1 1 3 3 3 3 7 7 0.18 0.56 0.43 0.39
2000 0 0 1 1 1 1 2 2 0.00 0.19 0.14 0.11
2001 1 1 2 2 1 1 4 4 0.2 0.44 0.16 0.25
2002 1 1 2 2 0 0 3 3 0.21 0.41 0.00 0.18
2003 0 0 6 6 1 1 7 7 0.00 0.92 0.13 0.38
2004 2 2 2 2 0 0 4 4 0.39 0.39 0.00 0.23
2005 3 3 4 4 3 3 10 10 0.67 0.60 0.50 0.58
2006 1 1 1 1 0 0 2 2 0.22 0.15 0.00 0.12
NCL 1999 0 0 3 3 0 0 3 3 0.00 0.43 0.00 0.23
2000 0 0 5 5 1 1 6 6 0.00 0.74 0.16 0.46
2001 0 0 3 3 1 1 4 4 0.00 0.46 0.17 0.32
2002 0 0 1 1 0 0 1 1 0.00 0.16 0.00 0.08
2003 0 0 1 1 1 1 2 2 0.00 0.16 0.15 0.15
2004 0 0 3 4 0 0 3 4 0.00 0.59 0.00 0.31
2005 0 0 1 1 2 2 3 3 0.00 0.15 0.31 0.22
2006 0 0 3 4 1 1 4 5 0.00 0.59 0.15 0.37
NEC 1999 0 0 1 1 0 0 1 1 0.00 2.34 0.00 0.33
2000 1 1 0 0 0 0 1 1 0.64 0.00 0.00 0.33

DGMS Annual Report,2006
45
Owner Year Fatal Accidents Death Rate
per 1000 persons
Belowground Opencast Aboveground Total BG OC AG Total
Acc Killed Acc Killed Acc Killed Acc Killed
2001 0 0 0 0 0 0 0 0 0.00 0.00 0.00 0.00
2002 0 0 0 0 0 0 0 0 0.00 0.00 0.00 0.00
2003 0 0 0 0 0 0 0 0 0.00 0.00 0.00 0.00
2004 1 1 1 1 0 0 2 2 0.86 1.39 0.00 0.74
2005 1 1 0 0 0 0 1 1 0.88 0.00 0.00 0.36
2006 0 0 0 0 0 0 0 0 0.00 0.00 0.00 0.00
SECL 1999 9 12 4 4 5 5 18 21 0.29 0.68 0.29 0.33
2000 10 11 3 3 2 2 15 16 0.27 0.5 0.12 0.25
2001 6 6 4 4 4 5 14 15 0.16 0.66 0.32 0.25
2002 8 11 2 2 3 3 13 16 0.3 0.30 0.19 0.27
2003 7 7 0 0 4 4 11 11 0.19 0.00 0.24 0.19
2004 5 6 1 1 1 1 7 8 0.17 0.15 0.06 0.14
2005 7 8 5 5 2 2 14 15 0.23 0.71 0.13 0.26
2006 3 3 3 3 1 1 7 7 0.09 0.43 0.06 0.12
WCL 1999 6 6 3 3 2 2 11 11 0.21 0.43 0.12 0.21
2000 8 9 5 14 1 1 14 24 0.31 2.02 0.06 0.45
2001 9 14 1 1 1 1 11 16 0.53 0.14 0.06 0.32
2002 11 11 2 2 2 2 15 15 0.45 0.28 0.12 0.32
2003 4 4 2 2 3 6 9 12 0.17 0.24 0.35 0.24
2004 6 6 5 5 2 2 13 13 0.26 0.60 0.13 0.27
2005 5 5 4 4 1 1 10 10 0.23 0.56 0.07 0.23
2006 7 7 1 1 6 6 14 14 0.32 0.14 0.41 0.32
CIL 1999 51 60 23 23 19 19 93 102 0.31 0.39 0.15 0.27
2000 42 50 26 38 12 12 80 100 0.27 0.66 0.10 0.27
2001 43 77 18 18 9 10 70 105 0.44 0.32 0.09 0.3
2002 32 36 20 20 10 13 62 69 0.22 0.36 0.11 0.21
2003 31 32 16 16 13 16 60 64 0.20 0.29 0.14 0.19
2004 36 39 25 26 5 5 66 70 0.25 0.48 0.05 0.22
2005 38 58 22 23 16 16 76 97 0.38 0.42 0.15 0.31
2006 27 81 15 16 10 10 52 107 0.54 0.29 0.10 0.35
DVC 1999 0 0 0 0 0 0 0 0 0.00 0.00 0.00 0.00
2000 0 0 0 0 0 0 0 0 0.00 0.00 0.00 0.00
2001 0 0 0 0 0 0 0 0 0.00 0.00 0.00 0.00
2002 0 0 0 0 0 0 0 0 0.00 0.00 0.00 0.00
2003 0 0 0 0 0 0 0 0 0.00 0.00 0.00 0.00
2004 0 0 0 0 0 0 0 0 0.00 0.00 0.00 0.00
2005 0 0 1 1 0 0 1 1 0.00 9.26 0.00 4.33
2006 0 0 0 0 0 0 0 0 0.00 0.00 0.00 0.00
GMDC 1999 0 0 0 0 0 0 0 0 0.00 0.00 0.00 0.00
2000 0 0 1 1 0 0 1 1 0.00 1.27 0.00 0.70
2001 0 0 1 1 0 0 1 1 0.00 1.09 0.00 0.66
2002 0 0 1 1 0 0 1 1 0.00 1.34 0.00 0.74
2003 0 0 0 0 0 0 0 0 0.00 0.00 0.00 0.00
2004 0 0 0 0 0 0 0 0 0.00 0.00 0.00 0.00
2005 0 0 1 1 0 0 1 1 0.00 1.36 0.00 0.69

DGMS Annual Report,2006
46
Owner Year Fatal Accidents Death Rate
per 1000 persons
Belowground Opencast Aboveground Total BG OC AG Total
Acc Killed Acc Killed Acc Killed Acc Killed
2006 0 0 0 0 0 0 0 0 0.00 0.00 0.00 0.00
JSMDC 1999 0 0 0 0 0 0 0 0 0.00 0.00 0.00 0.00
2000 0 0 0 0 0 0 0 0 0.00 0.00 0.00 0.00
2001 0 0 0 0 0 0 0 0 0.00 0.00 0.00 0.00
2002 0 0 0 0 0 0 0 0 0.00 0.00 0.00 0.00
2003 0 0 0 0 0 0 0 0 0.00 0.00 0.00 0.00
2004 0 0 0 0 0 0 0 0 0.00 0.00 0.00 0.00
2005 0 0 0 0 0 0 0 0 0.00 0.00 0.00 0.00
2006 0 0 1 1 0 0 1 1 0.00 16.95 0.00 7.41
IISCO 1999 1 1 0 0 0 0 1 1 0.52 0.00 0.00 0.28
2001 2 2 0 0 0 0 2 2 0.96 0.00 0.00 0.56
2004 0 0 2 2 0 0 2 2 0.00 4.46 0.00 0.63
2005 1 1 0 0 0 0 1 1 0.59 0.00 0.00 0.32
2006 2 2 0 0 0 0 2 2 1.18 0.00 0.00 0.64
J&K 1999 1 1 0 0 0 0 1 1 1.90 0.00 0.00 1.56
2000 0 0 0 0 0 0 0 0 0.00 0.00 0.00 0.00
2001 0 0 0 0 0 0 0 0 0.00 0.00 0.00 0.00
2002 0 0 0 0 0 0 0 0 0.00 0.00 0.00 0.00
2003 0 0 0 0 0 0 0 0 0.00 0.00 0.00 0.00
2004 0 0 0 0 0 0 0 0 0.00 0.00 0.00 0.00
2005 0 0 0 0 0 0 0 0 0.00 0.00 0.00 0.00
2006 0 0 0 0 0 0 0 0 0.00 0.00 0.00 0.00
NLC 1999 0 0 1 1 1 1 2 2 0.00 0.31 0.24 0.27
2000 0 0 2 2 1 1 3 3 0.00 0.67 0.24 0.42
2001 0 0 4 4 1 1 5 5 0.00 1.05 0.28 0.68
2002 0 0 1 1 0 0 1 1 0.00 0.26 0.00 0.14
2003 0 0 1 2 0 0 1 2 0.00 0.47 0.00 0.22
2004 0 0 2 2 1 1 3 3 0.00 0.32 0.28 0.31
2005 0 0 1 1 0 0 1 1 0.00 0.20 0.00 0.08
2006 0 0 5 5 0 0 5 5 0.00 0.99 0.00 0.41
SCCL 1999 17 18 5 6 3 3 25 27 0.33 1.12 0.33 0.39
2000 18 23 8 9 1 2 27 34 0.43 1.59 0.25 0.51
2001 21 21 2 2 2 2 25 25 0.40 0.37 0.29 0.38
2002 13 22 0 0 1 1 14 23 0.45 0.00 0.14 0.37
2003 12 37 6 6 1 1 19 44 0.80 1.04 0.12 0.73
2004 10 13 1 1 0 0 11 14 0.28 0.17 0.00 0.23
2005 8 8 2 2 1 1 11 11 0.17 0.37 0.14 0.19
2006 13 16 3 3 0 0 16 19 0.35 0.55 0.00 0.32
TISCO 1999 4 4 1 1 0 0 5 5 0.68 0.91 0.00 0.56
2000 2 2 0 0 2 2 4 4 0.38 0.00 1.08 0.49
2001 1 2 0 0 0 0 1 2 0.37 0.00 0.00 0.24
2002 3 3 0 0 0 0 3 3 0.57 0.00 0.00 0.37
2003 3 3 0 0 0 0 3 3 0.58 0.00 0.00 0.33
2004 3 5 0 0 0 0 3 5 1.01 0.00 0.00 0.63
2005 2 2 0 0 0 0 2 2 0.38 0.00 0.00 0.24

DGMS Annual Report,2006
47
Owner Year Fatal Accidents Death Rate
per 1000 persons
Belowground Opencast Aboveground Total BG OC AG Total
Acc Killed Acc Killed Acc Killed Acc Killed
2006 2 3 0 0 1 1 3 4 0.57 0.00 0.50 0.47
GIPCL 1999 0 0 0 0 0 0 0 0 0.00 0.00 0.00 0.00
2000 0 0 0 0 0 0 0 0 0.00 0.00 0.00 0.00
2001 0 0 1 1 0 0 1 1 0.00 4.52 0.00 3.31
2002 0 0 0 0 0 0 0 0 0.00 0.00 0.00 0.00
2003 0 0 0 0 0 0 0 0 0.00 0.00 0.00 0.00
2004 0 0 0 0 0 0 0 0 0.00 0.00 0.00 0.00
2005 0 0 0 0 0 0 0 0 0.00 0.00 0.00 0.00
2006 0 0 0 0 0 0 0 0 0.00 0.00 0.00 0.00
JINDAL 1999 0 0 0 0 0 0 0 0 0.00 0.00 0.00 0.00
2000 0 0 0 0 1 1 1 1 0.00 0 14.08 3.82
2001 0 0 0 0 0 0 0 0 0.00 0.00 0.00 0.00
2002 0 0 0 0 0 0 0 0 0.00 0.00 0.00 0.00
2003 0 0 0 0 0 0 0 0 0.00 0.00 0.00 0.00
2004 0 0 0 0 0 0 0 0 0.00 0.00 0.00 0.00
2005 0 0 0 0 0 0 0 0 0.00 0.00 0.00 0.00
2006 0 0 0 0 0 0 0 0 0.00 0.00 0.00 0.00
BECML 1999 0 0 0 0 0 0 0 0 0.00 0.00 0.00 0.00
2000 0 0 1 1 0 0 1 1 0.00 3.32 0.00 2.91
2001 0 0 0 0 0 0 0 0 0.00 0.00 0.00 0.00
2002 0 0 0 0 0 0 0 0 0.00 0.00 0.00 0.00
2003 0 0 0 0 0 0 0 0 0.00 0.00 0.00 0.00
2004 0 0 1 1 0 0 1 1 0.00 2.92 0.00 2.26
2005 0 0 0 0 0 0 0 0 0.00 0.00 0.00 0.00
2006 0 0 0 0 0 0 0 0 0.00 0.00 0.00 0.00
BLAI 1999 0 0 0 0 0 0 0 0 0.00 0.00 0.00 0.00
2000 0 0 0 0 0 0 0 0 0.00 0.00 0.00 0.00
2001 0 0 0 0 0 0 0 0 0.00 0.00 0.00 0.00
2002 0 0 0 0 0 0 0 0 0.00 0.00 0.00 0.00
2003 0 0 0 0 0 0 0 0 0.00 0.00 0.00 0.00
2004 0 0 1 1 0 0 1 1 0.00 10.87 0.00 5.71
2005 0 0 0 0 0 0 0 0 0.00 0.00 0.00 0.00
2006 0 0 0 0 0 0 0 0 0.00 0.00 0.00 0.00
ICML 1999 0 0 0 0 0 0 0 0 0.00 0.00 0.00 0.00
2000 0 0 0 0 0 0 0 0 0.00 0.00 0.00 0.00
2001 0 0 0 0 0 0 0 0 0.00 0.00 0.00 0.00
2002 0 0 0 0 0 0 0 0 0.00 0.00 0.00 0.00
2003 0 0 0 0 0 0 0 0 0.00 0.00 0.00 0.00
2004 0 0 0 0 0 0 0 0 0.00 0.00 0.00 0.00
2005 0 0 1 1 0 0 1 1 0.00 1.59 0.00 1.12
2006 0 0 0 0 0 0 0 0 0.00 0.00 0.00 0.00
MIL 1999 0 0 0 0 0 0 0 0 0.00 0.00 0.00 0.00
2000 0 0 0 0 0 0 0 0 0.00 0.00 0.00 0.00
2001 0 0 0 0 0 0 0 0 0.00 0.00 0.00 0.00
2002 0 0 0 0 0 0 0 0 0.00 0.00 0.00 0.00
DGMS Annual Report,2006
48
Owner Year Fatal Accidents Death Rate
per 1000 persons
Belowground Opencast Aboveground Total BG OC AG Total
Acc Killed Acc Killed Acc Killed Acc Killed
2003 0 0 0 0 0 0 0 0 0.00 0.00 0.00 0.00
2004 0 0 0 0 0 0 0 0 0.00 0.00 0.00 0.00
2005 0 0 0 0 2 2 2 2 0.00 0.00 33.90 6.62
2006 0 0 0 0 0 0 0 0 0.00 0.00 0.00 0.00
ALL
INDIA
1999 74 84 30 31 23 23 127 138 0.33 0.43 0.16 0.29
2000 62 75 38 51 17 18 117 144 0.3 0.74 0.13 0.31
2001 67 102 26 26 12 13 105 141 0.43 0.38 0.1 0.32
2002 48 61 22 22 11 14 81 97 0.27 0.32 0.11 0.23
2003 46 72 23 24 14 17 83 113 0.33 0.35 0.13 0.27
2004 49 57 32 33 6 6 87 96 0.27 0.47 0.05 0.24
2005 49 69 28 29 19 19 96 117 0.34 0.42 0.15 0.29
2006 44 102 24 25 11 11 79 138 0.50 0.36 0.09 0.35
Note: Figures for the year 2006 are provisional.

DGMS Annual Report,2006
49
2.9 Owner-wise consolidated serious accident statistics for last 8
(eight) years in coal mines
Owner Year
Serious Accidents Serious Injury Rate per
1000 persons
Belowground Opencast Aboveground Total BG OC AG Total
Acc S/Inj Acc S/Inj Acc S/Inj Acc S/Inj
BCCL 1999 46 51 14 16 11 13 71 80 1.22 1.41 0.48 1.00
2000 53 58 12 12 17 17 82 87 1.48 1.06 0.70 1.16
2001 49 54 8 8 11 11 68 73 1.45 0.74 0.50 1.04
2002 44 56 16 17 8 8 68 81 1.6 1.44 0.37 1.18
2003 39 42 9 9 12 12 60 63 1.27 0.91 0.61 1.00
2004 58 60 8 8 11 11 77 79 1.89 0.84 0.60 1.32
2005 20 31 11 11 10 12 41 54 1.03 1.15 0.69 0.95
2006 19 20 10 12 3 3 32 35 0.66 1.26 0.17 0.61
CCL 1999 22 23 7 10 7 7 36 40 1.31 0.59 0.36 0.75
2000 12 14 16 22 7 8 35 44 0.84 1.41 0.44 0.87
2001 7 8 2 2 8 16 17 26 0.51 0.13 0.96 0.54
2002 9 9 9 11 8 8 26 28 0.62 0.78 0.47 0.61
2003 11 11 7 9 9 9 27 29 0.79 0.64 0.58 0.67
2004 15 18 7 9 5 5 27 32 1.34 0.75 0.32 0.78
2005 7 7 11 11 7 7 25 25 0.53 0.95 0.44 0.62
2006 5 5 5 5 2 2 12 12 0.38 0.43 0.13 0.30
ECL 1999 173 182 9 9 35 36 217 227 3.08 1.67 1.05 2.3
2000 155 164 12 12 30 30 197 206 2.98 2.36 0.92 2.22
2001 164 174 5 7 30 30 199 211 3.23 1.35 0.98 2.35
2002 161 162 6 6 24 24 191 192 3.26 1.47 0.81 2.30
2003 141 147 9 11 21 21 171 179 3.06 2.41 0.72 2.19
2004 148 151 14 15 24 24 186 190 3.25 3.28 0.86 2.41
2005 54 56 7 7 14 14 75 77 1.24 1.44 0.51 1.00
2006 60 63 2 2 9 9 71 74 1.40 0.41 0.33 0.96
MCL 1999 9 10 2 2 5 5 16 17 1.85 0.37 0.72 0.96
2000 9 9 7 7 1 2 17 18 1.69 1.36 0.28 1.02
2001 6 6 3 3 2 2 11 11 1.19 0.66 0.32 0.69
2002 9 9 6 6 2 2 17 17 1.86 1.24 0.30 1.04
2003 5 5 4 4 3 3 12 12 1.11 0.61 0.40 0.65
2004 5 5 7 7 5 5 17 17 0.96 1.36 0.68 0.96
2005 6 6 5 5 3 3 14 14 1.34 0.75 0.50 0.81
2006 6 6 3 11 3 3 12 20 1.34 1.65 0.50 1.16
NCL 1999 0 0 11 12 8 9 19 21 0.00 1.71 1.46 1.59
2000 0 0 9 10 1 1 10 11 0.00 1.47 0.16 0.85
2001 0 0 9 9 7 7 16 16 0.00 1.38 1.19 1.29
2002 0 0 5 5 4 4 9 9 0.00 0.80 0.59 0.69
2003 0 0 11 11 7 7 18 18 0.00 1.76 1.05 1.39
2004 0 0 5 5 4 5 9 10 0.00 0.74 0.81 0.77
2005 0 0 10 11 3 3 13 14 0.00 1.61 0.46 1.05
2006 0 0 4 4 5 5 9 9 0.00 0.59 0.77 0.67
NEC 1999 2 2 0 0 0 0 2 2 1.23 0.00 0.00 0.65
2000 1 1 0 0 0 0 1 1 0.64 0.00 0.00 0.33
2001 0 0 0 0 0 0 0 0 0.00 0.00 0.00 0.00

DGMS Annual Report,2006
50
Owner Year
Serious Accidents Serious Injury Rate per
1000 persons
Belowground Opencast Aboveground Total BG OC AG Total
Acc S/Inj Acc S/Inj Acc S/Inj Acc S/Inj
2002 0 0 0 0 0 0 0 0 0.00 0.00 0.00 0.00
2003 0 0 0 0 0 0 0 0 0.00 0.00 0.00 0.00
2004 1 1 0 0 0 0 1 1 0.86 0.00 0.00 0.37
2005 1 1 0 0 0 0 1 1 0.88 0.00 0.00 0.36
2006 0 0 0 0 0 0 0 0 0.00 0.00 0.00 0.00
SECL 1999 29 33 6 7 18 21 53 61 0.81 1.19 1.23 0.96
2000 70 78 15 15 22 22 107 115 1.93 2.52 1.33 1.83
2001 80 80 12 12 26 26 118 118 2.1 1.98 1.66 1.97
2002 78 84 16 18 17 17 111 119 2.26 2.71 1.06 1.99
2003 64 67 12 13 16 16 92 96 1.83 2.49 0.95 1.64
2004 73 74 13 13 22 22 108 109 2.05 2.00 1.35 1.85
2005 68 72 9 9 18 19 95 100 2.06 1.28 1.20 1.73
2006 39 42 6 6 5 5 50 53 1.20 0.86 0.31 0.92
WCL 1999 36 37 9 9 8 8 53 54 1.29 1.29 0.47 1.02
2000 65 66 20 20 13 15 98 101 2.27 2.88 0.85 1.88
2001 61 70 14 14 25 25 100 109 2.64 1.97 1.51 2.17
2002 36 38 11 12 13 13 60 63 1.56 1.69 0.81 1.32
2003 41 43 13 13 13 14 67 70 1.83 1.56 0.81 1.42
2004 38 41 11 12 17 17 66 70 1.79 1.43 1.06 1.48
2005 30 31 6 7 5 5 41 43 1.40 0.98 0.34 0.98
2006 29 32 7 8 10 10 46 50 1.45 1.11 0.68 1.14
CIL 1999 317 338 58 65 92 99 467 502 1.73 1.09 0.77 1.31
2000 365 390 91 98 91 95 547 583 2.08 1.71 0.77 1.58
2001 367 392 53 55 109 117 529 564 2.22 0.99 1.03 1.63
2002 337 358 69 75 76 76 482 509 2.16 1.37 0.67 1.52
2003 301 315 65 70 81 82 447 467 1.96 1.26 0.72 1.42
2004 338 350 65 69 88 89 491 508 2.23 1.28 0.82 1.59
2005 185 204 59 61 60 63 304 328 1.35 1.12 0.60 1.06
2006 158 168 37 48 37 37 232 253 1.11 0.88 0.35 0.82
DVC 1999 0 0 0 0 0 0 0 0 0.00 0.00 0.00 0.00
2000 0 0 0 0 0 0 0 0 0.00 0.00 0.00 0.00
2001 0 0 0 0 0 0 0 0 0.00 0.00 0.00 0.00
2002 0 0 0 0 0 0 0 0 0.00 0.00 0.00 0.00
2003 0 0 0 0 0 0 0 0 0.00 0.00 0.00 0.00
2004 0 0 0 0 0 0 0 0 0.00 0.00 0.00 0.00
2005 0 0 1 1 0 0 1 1 0.00 9.26 0.00 4.33
2006 0 0 0 0 0 0 0 0 0.00 0.00 0.00 0.00
GMDC 1999 0 0 1 1 2 2 3 3 0.00 0.93 2.31 1.55
2000 0 0 2 2 2 2 4 4 0.00 2.54 3.13 2.8
2001 0 0 4 4 2 2 6 6 0.00 4.36 3.31 3.94
2002 0 0 1 1 1 1 2 2 0.00 1.34 1.66 1.48
2003 0 0 3 3 0 0 3 3 0.00 4.18 0.00 2.16
2004 0 0 0 0 2 2 2 2 0.00 0.00 3.34 1.60
2005 0 0 1 1 0 0 1 1 0.00 1.36 0.00 0.69
2006 0 0 0 0 0 0 0 0 0.00 0.00 0.00 0.00
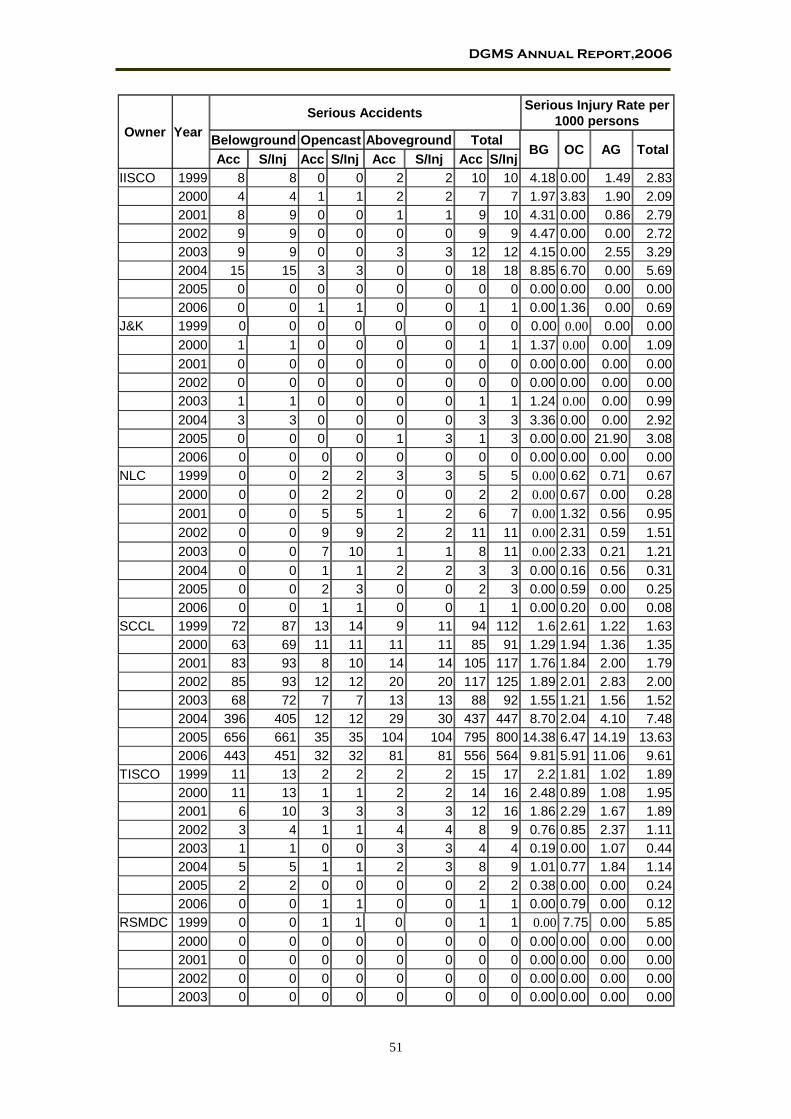
DGMS Annual Report,2006
51
Owner Year
Serious Accidents Serious Injury Rate per
1000 persons
Belowground Opencast Aboveground Total BG OC AG Total
Acc S/Inj Acc S/Inj Acc S/Inj Acc S/Inj
IISCO 1999 8 8 0 0 2 2 10 10 4.18 0.00 1.49 2.83
2000 4 4 1 1 2 2 7 7 1.97 3.83 1.90 2.09
2001 8 9 0 0 1 1 9 10 4.31 0.00 0.86 2.79
2002 9 9 0 0 0 0 9 9 4.47 0.00 0.00 2.72
2003 9 9 0 0 3 3 12 12 4.15 0.00 2.55 3.29
2004 15 15 3 3 0 0 18 18 8.85 6.70 0.00 5.69
2005 0 0 0 0 0 0 0 0 0.00 0.00 0.00 0.00
2006 0 0 1 1 0 0 1 1 0.00 1.36 0.00 0.69
J&K 1999 0 0 0 0 0 0 0 0 0.00 0.00 0.00 0.00
2000 1 1 0 0 0 0 1 1 1.37 0.00 0.00 1.09
2001 0 0 0 0 0 0 0 0 0.00 0.00 0.00 0.00
2002 0 0 0 0 0 0 0 0 0.00 0.00 0.00 0.00
2003 1 1 0 0 0 0 1 1 1.24 0.00 0.00 0.99
2004 3 3 0 0 0 0 3 3 3.36 0.00 0.00 2.92
2005 0 0 0 0 1 3 1 3 0.00 0.00 21.90 3.08
2006 0 0 0 0 0 0 0 0 0.00 0.00 0.00 0.00
NLC 1999 0 0 2 2 3 3 5 5 0.00 0.62 0.71 0.67
2000 0 0 2 2 0 0 2 2 0.00 0.67 0.00 0.28
2001 0 0 5 5 1 2 6 7 0.00 1.32 0.56 0.95
2002 0 0 9 9 2 2 11 11 0.00 2.31 0.59 1.51
2003 0 0 7 10 1 1 8 11 0.00 2.33 0.21 1.21
2004 0 0 1 1 2 2 3 3 0.00 0.16 0.56 0.31
2005 0 0 2 3 0 0 2 3 0.00 0.59 0.00 0.25
2006 0 0 1 1 0 0 1 1 0.00 0.20 0.00 0.08
SCCL 1999 72 87 13 14 9 11 94 112 1.6 2.61 1.22 1.63
2000 63 69 11 11 11 11 85 91 1.29 1.94 1.36 1.35
2001 83 93 8 10 14 14 105 117 1.76 1.84 2.00 1.79
2002 85 93 12 12 20 20 117 125 1.89 2.01 2.83 2.00
2003 68 72 7 7 13 13 88 92 1.55 1.21 1.56 1.52
2004 396 405 12 12 29 30 437 447 8.70 2.04 4.10 7.48
2005 656 661 35 35 104 104 795 800 14.38 6.47 14.19 13.63
2006 443 451 32 32 81 81 556 564 9.81 5.91 11.06 9.61
TISCO 1999 11 13 2 2 2 2 15 17 2.2 1.81 1.02 1.89
2000 11 13 1 1 2 2 14 16 2.48 0.89 1.08 1.95
2001 6 10 3 3 3 3 12 16 1.86 2.29 1.67 1.89
2002 3 4 1 1 4 4 8 9 0.76 0.85 2.37 1.11
2003 1 1 0 0 3 3 4 4 0.19 0.00 1.07 0.44
2004 5 5 1 1 2 3 8 9 1.01 0.77 1.84 1.14
2005 2 2 0 0 0 0 2 2 0.38 0.00 0.00 0.24
2006 0 0 1 1 0 0 1 1 0.00 0.79 0.00 0.12
RSMDC 1999 0 0 1 1 0 0 1 1 0.00 7.75 0.00 5.85
2000 0 0 0 0 0 0 0 0 0.00 0.00 0.00 0.00
2001 0 0 0 0 0 0 0 0 0.00 0.00 0.00 0.00
2002 0 0 0 0 0 0 0 0 0.00 0.00 0.00 0.00
2003 0 0 0 0 0 0 0 0 0.00 0.00 0.00 0.00

DGMS Annual Report,2006
52
Owner Year
Serious Accidents Serious Injury Rate per
1000 persons
Belowground Opencast Aboveground Total BG OC AG Total
Acc S/Inj Acc S/Inj Acc S/Inj Acc S/Inj
2004 0 0 0 0 0 0 0 0 0.00 0.00 0.00 0.00
2005 0 0 0 0 0 0 0 0 0.00 0.00 0.00 0.00
2006 0 0 0 0 0 0 0 0 0.00 0.00 0.00 0.00
GIPCL 1999 0 0 0 0 0 0 0 0 0.00 0.00 0.00 0.00
2000 0 0 0 0 1 1 1 1 0.00 0.00 1.50 1.45
2001 0 0 0 0 0 0 0 0 0.00 0.00 0.00 0.00
2002 0 0 0 0 0 0 0 0 0.00 0.00 0.00 0.00
2003 0 0 0 0 0 0 0 0 0.00 0.00 0.00 0.00
2004 0 0 0 0 0 0 0 0 0.00 0.00 0.00 0.00
2005 0 0 0 0 0 0 0 0 0.00 0.00 0.00 0.00
2006 0 0 0 0 0 0 0 0 0.00 0.00 0.00 0.00
JINDAL 1999 0 0 0 0 0 0 0 0 0.00 0.00 0.00 0.00
2000 0 0 0 0 0 2 0 2 0.00 0.00 28.17 7.63
2001 0 0 0 0 0 0 0 0 0.00 0.00 0.00 0.00
2002 0 0 0 0 0 0 0 0 0.00 0.00 0.00 0.00
2003 0 0 0 0 0 0 0 0 0.00 0.00 0.00 0.00
2004 0 0 0 0 0 0 0 0 0.00 0.00 0.00 0.00
2005 0 0 0 0 0 0 0 0 0.00 0.00 0.00 0.00
2006 0 0 0 0 0 0 0 0 0.00 0.00 0.00 0.00
BECM 1999 0 0 0 0 0 0 0 0 0.00 0.00 0.00 0.00
2000 0 0 0 0 0 0 0 0 0.00 0.00 0.00 0.00
2001 0 0 0 0 0 0 0 0 0.00 0.00 0.00 0.00
2002 0 0 0 0 0 0 0 0 0.00 0.00 0.00 0.00
2003 0 0 0 0 0 0 0 0 0.00 0.00 0.00 0.00
2004 0 0 0 1 0 0 0 1 0.00 2.92 0.00 2.26
2005 0 0 0 0 0 0 0 0 0.00 0.00 0.00 0.00
2006 0 0 0 0 0 0 0 0 0.00 0.00 0.00 0.00
1999 0 0 0 0 0 0 0 0 0.00 0.00 0.00 0.00
2000 0 0 0 0 0 0 0 0 0.00 0.00 0.00 0.00
2001 0 0 0 0 0 0 0 0 0.00 0.00 0.00 0.00
2002 0 0 0 0 0 0 0 0 0.00 0.00 0.00 0.00
2003 0 0 0 0 0 0 0 0 0.00 0.00 0.00 0.00
2004 0 0 0 0 0 0 0 0 0.00 0.00 0.00 0.00
2005 0 0 0 0 0 0 0 0 0.00 0.00 0.00 0.00
MIL 1999 0 0 0 0 0 0 0 0 0.00 0.00 0.00 0.00
2000 0 0 0 0 0 0 0 0 0.00 0.00 0.00 0.00
2001 0 0 0 0 0 0 0 0 0.00 0.00 0.00 0.00
2002 0 0 0 0 0 0 0 0 0.00 0.00 0.00 0.00
2003 0 0 0 0 0 0 0 0 0.00 0.00 0.00 0.00
2004 0 0 0 0 0 0 0 0 0.00 0.00 0.00 0.00
2005 0 0 0 0 0 0 0 0 0.00 0.00 0.00 0.00
2006 0 0 0 0 1 1 1 1 0.00 0.00 16.95 3.31

DGMS Annual Report,2006
53
Owner Year
Serious Accidents Serious Injury Rate per
1000 persons
Belowground Opencast Aboveground Total BG OC AG Total
Acc S/Inj Acc S/Inj Acc S/Inj Acc S/Inj
ALL
INDIA
1999 408 446 77 85 110 119 595 650 1.73 1.19 0.81 1.37
2000 444 477 108 115 109 115 661 707 1.92 1.67 0.82 1.54
2001 464 504 73 77 130 139 667 720 2.1 1.12 1.07 1.64
2002 434 464 92 98 103 103 629 665 2.07 1.43 0.8 1.57
2003 380 398 82 90 101 102 563 590 1.85 1.30 0.77 1.42
2004 757 778 82 87 123 126 962 991 3.69 1.24 1.02 2.45
2005 843 867 98 101 165 170 1106 1138 4.23 1.45 1.37 2.85
2006 602 621 72 83 119 119 793 823 3.03 1.19 0.96 2.13
Note: Figures for the year 2006 are provisional

DGMS Annual Report,2006
54
3.0 Non-Coal Mines
3.1 General Information presented in the following paragraphs relates to non-coal mines coming under the
purview of the Mines Act, 1952.
Estimated number of notified working non-coal mines are over about 6000 out of which 1940
non-coal mines including 45 oil mines submitted returns at the end of the year.
Average daily employment in non-coal mines during the year 2006 was 153,305 as compared
to 156,582 in 2005. Average daily employment in workings belowground, opencast and
aboveground during the year 2006 was 7,665; 84,318 & 61,322 as compared to 9,874; 83,811
& 62,897 respectively during the year 2005. The average daily employment in various minerals
is depicted in the table below:
TABLE: 34 Average daily employment and output in non-coal mines during 2006
Mineral No. of
mine
Average daily employment Output
(‘000
tonnes) U / G O/C Surface Total
Bauxite 80 - 4330 650 4980 10,060
Copper 4 980 320 630 1930 2545
Gold 4 1560 - 1660 3220 650
Granites 165 - 5090 1540 6630 850
Lime Stone 450 - 17700 6330 24030 203411
Iron-ore 250 - 20300 12211 32511 15911
Manganese 115 2650 7305 3945 13900 2550
Marble 15 - 1100 450 1550 2009
Stone 215 - 4240 2165 6405 19980
Galena & sphalarite
11 1100 700 1400 3200 4310
Others 631 1375 23233 10191 34799 -
Oil
45 - - 20150 20150 17500
Natural Gas - - - - - 6570 ($)
Total
Non-Coal
1985 7665 84318 61322 153305 286346
Note: Figures are provisional $ Production of Natural Gas (Expressed in ‘000 Cu Meter)

DGMS Annual Report,2006
55
3.2 Accidents
There were two major accidents involving ten persons in non-coal mines during the year.
(1) Name of Mine: Surya Granite Opencast Mine, Owner: M/s.Surya Granite
Date of accident: 03.11.2006, Time: 1730 hours, Persons killed: 4
While five mazdoors were at work on the slope of a hillock having numerous loose boulders,
there was a sudden roll down of boulders through a height of about 7.34 m along the slope
due to which four of them received fatal injuries.
(2) Name of Mine: Tollem Group I/Ore Mine, Owner: Smt. Kunda R. Gharse
Date of accident: 09.12.2006, Time: 1255 hours, Persons killed: 6
While ten persons were engaged at the floor of 3rd clay bench (67 MRL) to reduce the width of
the bench with Heavy Earth Moving Machinery, a portion of overlying three clay benches
alongwith a part of the dump situated on low lying weak ground near the top edge of the
quarry, measuring about 160 m (L) x 25m – 30m (W) x 46 m (H) slid and collapsed burying
the machinery and six of them persons deployed, asphyxiating them to death.
3.2.1 Accident scenario
Contrary to the down fall in fatal accidents in the year 2005 as compared to 2004, there had
been rise in fatal accidents in the year 2006 wherein there had been 62 fatal accidents
involving 62 fatalities and 78 serious accidents during the year 2006 as compared to 48 fatal
accidents involving 52 fatalities and 108 serious accidents during 2005. Table: 35 & 36 given
below shows trend in fatal accidents death rates, serious accident & injury rate in non-coal
mines.
* Provisional
TABLE: 35 TREND IN FATAL ACCIDENTS & DEATH RATES IN NON-COAL MINES
Year Number of accidents Death rate per 1000 persons employed
Fatal Persons killed
Persons ser. injured
Below ground
Open-cast
Above ground
Overall
1991 84 102 27 0.42 0.45 0.41 0.43
1992 68 78 24 0.52 0.39 0.20 0.33
1993 58 73 9 0.44 0.37 0.22 0.31
1994 61 86 17 1.46 0.32 0.21 0.38
1995 66 74 5 0.35 0.39 0.26 0.33
1996 72 83 14 0.42 0.54 0.23 0.40
1997 70 77 13 0.42 0.47 0.28 0.38
1998 56 65 15 0.33 0.43 0.23 0.33
1999 61 72 13 0.49 0.55 0.19 0.39
2000 51 55 2 0.49 0.37 0.19 0.30
2001 71 81 8 0.52 0.72 0.38 0.54
2002 52 64 3 0.49 0.54 0.21 0.40
2003 52 62 16 0.39 0.46 0.31 0.40
2004 57 64 9 0.62 0.47 0.26 0.39
2005 48 52 4 0.38 0.43 0.17 0.32
2006* 62 75 9 0.38 0.66 0.34 0.48

DGMS Annual Report,2006
56
Table: 36 indicate trend in serious accidents and serious injury rates in non-coal mines.
TABLE:36 TREND IN SERIOUS ACCIDENTS AND SERIOUS INJURY RATES
IN NON-COAL MINES
YEAR Number of Serious injury rate per 1000 persons employed
Serious accidents
Persons seriously injured
Below ground
Open cast
Above ground
Overall
1991 291 295 5.71 0.40 1.46 1.37
1992 282 285 4.98 0.49 1.40 1.29
1993 315 321 6.06 0.49 1.45 1.42
1994 246 249 5.46 0.39 1.16 1.18
1995 268 274 3.93 0.60 1.45 1.25
1996 263 269 4.78 0.59 1.48 1.35
1997 265 272 5.57 0.42 1.60 1.42
1998 254 258 5.07 0.60 1.52 1.40
1999 230 238 6.16 0.45 1.42 1.37
2000 187 192 4.65 0.46 1.14 1.08
2001 199 200 6.28 0.61 1.57 1.42
2002 205 206 5.06 0.53 1.72 1.31
2003 168 169 7.36 0.43 1.43 1.18
2004 188 194 6.70 0.52 1.57 1.25
2005 108 109 3.41 0.37 0.83 0.71
2006* 75 76 3.03 0.31 0.54 0.54 * Provisional

DGMS Annual Report,2006
57
Table: 37 depicts trend in accidents due to different cause group for the years 2002-2006.
TABLE:37 TREND IN FATAL ACCIDENTS DUE TO DIFFERENT
CAUSES IN NON-COAL MINES
Cause 2002 2003 2004 2005 2006
Ground movement 11 (19) 8 (13) 14 (17) 6 (7) 10 (19)
Winding in shafts Nil Nil Nil Nil Nil
Transportation machinery (other than winding)
13 (13) 15 (16) 21 (22) 13 (14) 21 (22)
Machinery other than transportation machinery
6 (7) 6 (7) 5 (6) 10 (11) 4 (4)
Explosive 8 (11) 5 (6) 3 (4) 4 (5) 3 (3)
Electricity 1 (1) 3 (3) 2 (3) Nil Nil
Gas, Dust etc. Nil 1 (2) Nil Nil Nil
Falls other than falls of ground 12 (12) 14 (15) 10 (10) 15 (15) 23 (26)
Other causes 1 (1) Nil 2 (2) Nil 1 (1)
TOTAL 52 (64) 52 (62) 57 (64) 48 (52) 62 (75)
Note: Figures in parentheses denote the number of persons killed.
Trend in Fatal Accidents due to different causes in Non-Coal mines
during 2006
Transportation m/c
(other than winding),
21, 34%
Ground Movement,
10, 16%
M/c other than
transportation m/c, 4,
6%
Explosive, 3, 5%
Others, 1, 2%
Falls other than fall of
ground, 23, 37%
TABLE:37A TREND IN FATAL ACCIDENTS IN DIFFERENT
PLACES OF NON-COAL MINES
Place 2002 2003 2004 2005 2006
Belowground 5 (5) 3 (4) 5 (5) 3 (3) 3 (3)
Opencast 33 (45) 31 (38) 36 (42) 38 (38) 44 (57)
Aboveground 14 (14) 18 (20) 16 (17) 11 (11) 15 (15)
Total 52 (64) 52 (62) 57 (64) 48 (52) 62 (75)
Note: Figures in parentheses denote the number of persons killed.

DGMS Annual Report,2006
58
TABLE: 38 TREND IN SERIOUS ACCIDENTS DUE TO DIFFERENT
CAUSES IN NON-COAL MINES
Cause 2002 2003 2004 2005 2006
Ground movement 2 (5) 2 (9) 5 (12) 2 (3) 1 (4)
Winding in shafts 1 (1) Nil Nil Nil 1 (2)
Transportation machinery (other than winding)
18 (19) 19 (22) 13 (18) 14 (16) 12 (16)
Machinery other than transportation machinery
23 (23) 25 (27) 22 (22) 15 (15) 9 (9)
Explosive 2 (2) 1 (4) Nil 1 (2) Nil
Electricity 4 (4) 1 (1) 0 (1) - 1 (1)
Gas, Dust etc. Nil Nil Nil 3 (4) Nil
Falls other than falls of ground
89 (89) 68 (69) 80 (81) 44 (44) 37 (39)
Other causes 66 (66) 52 (53) 68 (69) 29 (29) 14 (14)
TOTAL 205 (209) 168(185) 188 (203) 108 (113) 75 (85)
Note: Figures in parentheses denote the number of persons seriously injured. This also includes serious injury out of fatal accidents.
Trend in Serious Accidents due to different causes in Non-Coal
mines during 2006
Transportation m/c
(other than winding),
12, 16%
Ground Movement, 1,
1%Winding in shaft, 1,
1%
M/c other than
transportation m/c, 9,
12%
Fall other than fall of
ground, 37, 50%
Electricity, 1, 1%
other causes, 14,
19%
TABLE: 38A TREND IN SERIOUS ACCIDENTS IN DIFFERENT PLACES OF
NON-COAL MINES
Place 2002 2003 2004 2005 2006
Belowground 52 (52) 57 (57) 54 (54) 27 (27) 22 (24)
Opencast 40 (44) 25 (36) 34 (46) 28 (33) 19 (27)
Aboveground 113 (113) 86 (92) 100 (103) 53 (53) 34 (34)
Total 205 (209) 168 (185) 188 (203) 108 (113) 75 (85)
Note: Figures in parentheses denote the number of persons seriously injured.

DGMS Annual Report,2006
59
Table: 39 shows fatal and serious accidents mineral-wise for the year 2002-2006.
TABLE: 39 FATAL AND SERIOUS ACCIDENTS MINERAL-WISE
IN NON-COAL MINES DURING 2001-2005
Mineral Fatal accidents Serious accidents
2002 2003 2004 2005 2006 2002 2003 2004 2005 2006
Copper 1 - - - - 5 4 1 4 -
Gold - - - - 1 40 45 35 10 9
Galena & sphalerite
1 - 3 1 1 23 22 30 24 12
Manganese ore 4 1 3 - 2 14 11 9 5 5
Iron-ore 10 13 12 15 16 60 37 45 34 21
Lime stone 10 6 12 7 12 8 13 14 9 6
Granite 3 7 2 6 6 1 - - 1 -
Marble 1 6 6 3 4 - - - - -
Stone 7 6 8 8 4 1 - 2 - -
Oil 2 1 2 1 4 31 21 38 15 14
Others 13 12 9 7 12 22 15 14 6 8
TOTAL 52 52 57 48 62 205 168 188 108 75
Note: Data for 2006 are provisional.
3.2.2 Analysis of Accidents
The analysis of accidents presented below is based on the findings of enquiries into fatal
accidents conducted by officers of DGMS and information regarding serious accidents
received from the mine management.
3.2.2.1 Ground Movement
Number of accidents and fatalities due to ground movement shows a wavy trend in the last
five years 2002, 2004 & 2006 being the crest whereas 2003 & 2005 being the tough indicating
that it is the high time for the mine management to think and execute an effective plan to
reduce fatal accidents due this cause. Percentage wise there were 10 (16.13% of the total)
fatal accidents due to ground movement in the year 2006 as compared to 6 (12.50% of the
total) fatal accidents due to ground movement in the year 2005.
3.2.2.1A Roof fall Accidents
There was no accident due to this cause during the year 2006 in non-coal mines.
3.2.2.1B Side fall Accidents
There were 6 (9.68% of total accident) fatal accidents due to side fall during the year 2006
involving 13 persons when compared to 5 involving 6 persons during previous year indicating
abrupt increase due to occurrence of two major accidents in this category.
3.2.2.2 Transportation machinery (Winding)
There had not been any fatal accident due to winding machinery during last five the years i.e.
2002-2006. However, there had been only one serious accident in the year 2002 and again in
the year 2006.

DGMS Annual Report,2006
60
3.2.2.3 Transportation machinery (other than winding)
There were altogether 21 (33.87% of all fatal accidents) accidents involving 22 fatalities due to
transportation machinery (other than winding) during the year 2006.
The cause-wise details may be seen from the following table:-
TABLE-40 FATAL & SERIOUS ACCIDENTS DUE TO TRANSPORTATION MACHINERY IN
NON COAL MINES IN YEAR 2006
Sl. No. Causes No. of fatal accidents Persons killed
1. Rope Haulages - -
2. Conveyors - -
3. Dumpers 12 13
4. Truck & Tankers 7 7
5. Other 2 2
Total 21 22
The analysis of causes revealed the following:
Dumper/Tipper
Three fatalities occurred in 3 different accidents due to falling of dumper from height.
Four fatalities occurred in 4 different accidents due to runover by Tipper.
In one case a dumper runover light motor vehicle (Jeep) with two occupant and both the
occupant died.
One fatality occurred due to rolling back of a tipper which hit a mine foreman who died.
One person died due to hit by a reversing tipper’s.
Two persons died in two different cases due to rolling back of dumper.
Truck & Tanker
One accident occurred killing a person by over turning of a truck.
One person died due to sliding of loaded truck backward and Loader operator standing
behind was crushed.
Two persons died due in two accidents due to runover by a running truck.
A dozer operator was hit by a moving truck.
One person died due to falling of tractor.
Other (Wagon)
One accident occurred killing open person due to runover by a moving wagon.
One person killed while working with a crowbar slipped entrapping between the
locomotive and wagon.
3.2.2.5 Accidents due to machinery other than transportation machinery.
TABLE-41 BREAK UP OF SERIOUS & FATAL ACCIDENTS DUE TO
MACHINERY OTHER THAN TRANSPORTATION
MACHINERY IN NON COAL MINES DURING 2006
FATAL SERIOUS
Causes Surface Underground Surface Underground
1. Drills 1 - 2 1
2. Shovel etc. 1 - - -
3. Crane - - - -
4. Crushing Plant - - 2 1
5. Tractors - - - -
6. Wiresaw cutting machine - - - -
7. Others 2 1 2 1
Total 4 1 6 3

DGMS Annual Report,2006
61
Drill machine
One person died due to disconnection of pressurized Hose Pipe from coupling.
Shovel Dragline
A Pay Loader Operator died due to squeezing by the movement of bucket arm and
chasis.
Other machinery
One person died as swivel nut of compressed air hose pipe came off and foreman
working there lost balance and collided against the wall receiving head injury.
One person died when he fell down on an unguarded coupling of a running generator
while checking for oil level.
Table: 42 - Detail break-up of serious accidents due to this cause during 2006.
TABLE : 42 BREAK-UP OF SERIOUS ACCIDENTS DUE TO MACHINERY OTHER THAN
TRANSPORTATION MACHINERY IN NON-COAL MINES DURING 2006
Cause Number of serious accidents
Belowground Opencast Aboveground Total
Drills 1 2 - 3
Shovels, draglines, excavators etc.
- - - -
Crushing & screening plants
1 - 2 3
Others 1 - 2 3
TOTAL 3 2 4 9
3.2.2.5 Explosives
There were 3 (4.84% of the total) fatal accidents involving 3 persons and nil serious accident
in 2006 as compared to 4 fatal accidents and one serious accident in 2005.
3.2.2.6 Electricity
There is no fatal accident and no serious accident due to electricity during the year 2006.
3.2.2.7 Dust, Gas & other combustible material There was no fatal and serious accident due to this cause during the year 2006.
3.2.2.8 Falls other than falls of ground
23 (37.10%) fatal accidents and 37 serious accidents occurred due to this cause during the
year 2006, while 15 fatal accidents and 44 serious accidents during the year 2005.
3.2.2.9 Other causes
There was one fatal accident and 14 serious accidents occurred due to miscellaneous causes
during the year 2006.

DGMS Annual Report,2006
62
3.3 Responsibility
The responsibilities fixed as a result of fatal accident enquiry conducted by officers of DGMS
in the year 2006 is indicated in the table below:
TABLE:43 RESPONSIBILITY FOR FATAL ACCIDENTS IN NON-COAL MINES
DURING THE YEAR 2006
SL. NO. Responsibility No. of accidents
1. Misadventure 5
2. Management 13
3. Management & Subordinate Supervisory Staff (SSS) 9
4. Management, SSS & Co-worker Nil
5. Management & Co-worker 3
6. Management, Co-worker & Deceased 1
7. Management & Deceased 1
8. Subordinate Supervisory Staff (SSS) 5
9. SSS & Co-worker 1
10. SSS, Co-worker & Deceased 1
11. SSS & deceased 2
12. Shot-firer Nil
13. Co-worker 5
14. Co-worker & Deceased 1
15. Deceased 11
16. Others 4
TOTAL 62
3.4 Dangerous Occurrence The table indicated below gives dangerous occurrences reported during the year 2006 under
various causes:
TABLE:44 DANGEROUS OCCURRENCES IN NON-COAL MINES DURING 2006
Sl.No. Cause No. of cases
1. Overwinding of cages etc. Nil
2. Outbreak of fire belowground Nil
3. Outbreak of fire at surface Nil
4. Premature collapse of workings or failure of pillars Nil
5. Breakage of winding rope Nil
6. Breakdown of winding engine, crank shaft, bearing etc. Nil
7. Ignition or occurrence of inflammable gas 3
8. Breakage, fracture etc of essential parts of machinery or apparatus whereby safety of persons was endangered
2
9. Irruption of water Nil
10. Rock burst 1
11. Bursting of equipment under high pressure Nil
12. Oil well blowout without fire 1
13. Fire in pipeline/well heads 1
14. Others Nil
TOTAL 8

DGMS Annual Report,2006
63
3.5 Technical Developments
Total numbers of mines working by deploying HEMM is 640. Total number of machines and
capacity of shovels and dumpers used is mines have been increased. The following table
shows the different types of machines deployed in mines since 1990.
TABLE: 45 TREND IN USE OF HEMM IN NON-COAL OPENCAST MINES
Year No. of mines
Shovels Dumper Others Machinery
Elec. Diesel Total Total No. Total HP
1990 300 80 474 554 2263 1253 4070 833780
1991 368 92 553 645 2744 1357 4746 979076
1992 397 99 566 665 3067 1457 5189 1060897
1993 438 92 697 789 3221 1505 5515 1111029
1994 479 103 720 823 3416 1597 5836 1185407
1995 448 97 753 850 2814 1354 5018 1034650
1996 457 68 841 909 3409 1261 5579 1197829
1997 470 60 851 911 3704 1442 6057 1142679
1998 534 44 939 983 4286 1433 6702 1215549
1999 539 63 965 1028 3662 1513 6203 1232870
2000 589 76 1055 1131 4038 1585 6754 1413520
2001 542 86 1026 1112 3696 1763 6571 1337737
2002 577 95 1107 1202 3928 1741 6871 1351329
2003 560 90 1020 1010 3945 1630 6485 1310221
2004 561 91 1025 1116 3960 1670 6746 1313450
2005 653 52 1452 1504 5509 1819 8832 1784635
2006* 640 53 1330 1383 4960 1760 8103 1644000 *Provisional
Following table shows the various types and quality of explosives used in non-coal and quality
in mines since 1990.
TABLE:46 TREND IN USE OF EXPLOSIVES IN NON-COAL MINES
YEAR Consumption of explosives in tonnes
NG Based
ANFO LOX Slurry large dia
Slurry small dia
Booster
Gun powder
Total
1990 4650 7912 1786 15703 1554 44 71 31720
1991 5793 10272 1148 20690 2262 44 63 40272
1992 4293 11868 648 23831 3309 51 59 44059
1993 3765 14087 244 22264 3601 37 60 44058
1994 3065 13448 260 22400 4015 29 68 43285
1995 3766 13767 171 23781 4546 42 105 46178
1996 3429 14520 124 23993 5053 30 93 47243
1997 1020 17964 39 15182 7256 42 113 43356
1998 1713 18719 154 17199 9126 52 111 47074
1999 1826 22151 153 18353 7159 30 86 49760
2000 1227 21071 148 24611 9632 94 116 56899
2001 1021 21476 140 24303 7879 81 92 55809
2002 1092 21111 368 26186 6640 128 88 55613
2003 1085 20189 345 25176 6310 119 80 53304
2004 1090 20190 347 25310 6350 120 81 53389
2005 1384 28087 168 40538 9892 501 130 80700
2006* 1390 28101 170 40600 9900 510 132 80803 *Provisional
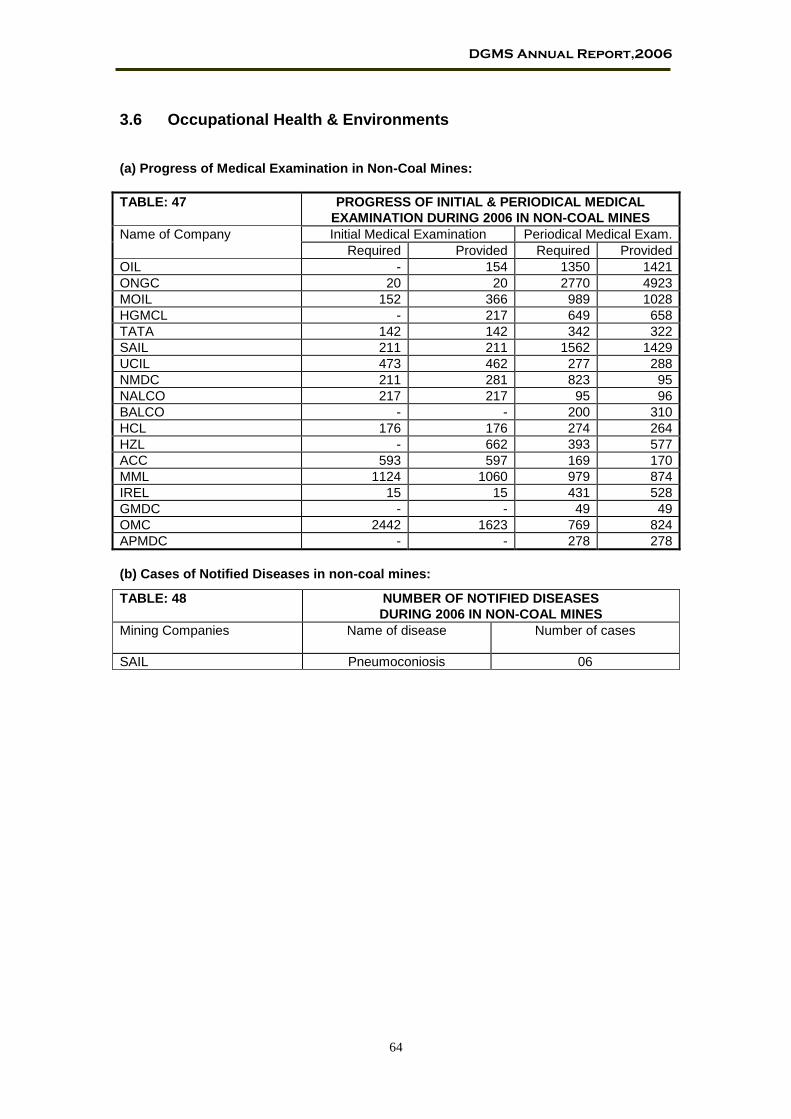
DGMS Annual Report,2006
64
3.6 Occupational Health & Environments
(a) Progress of Medical Examination in Non-Coal Mines:
TABLE: 47 PROGRESS OF INITIAL & PERIODICAL MEDICAL
EXAMINATION DURING 2006 IN NON-COAL MINES
Name of Company Initial Medical Examination Periodical Medical Exam.
Required Provided Required Provided
OIL - 154 1350 1421
ONGC 20 20 2770 4923
MOIL 152 366 989 1028
HGMCL - 217 649 658
TATA 142 142 342 322
SAIL 211 211 1562 1429
UCIL 473 462 277 288
NMDC 211 281 823 95
NALCO 217 217 95 96
BALCO - - 200 310
HCL 176 176 274 264
HZL - 662 393 577
ACC 593 597 169 170
MML 1124 1060 979 874
IREL 15 15 431 528
GMDC - - 49 49
OMC 2442 1623 769 824
APMDC - - 278 278
(b) Cases of Notified Diseases in non-coal mines:
TABLE: 48 NUMBER OF NOTIFIED DISEASES
DURING 2006 IN NON-COAL MINES
Mining Companies
Name of disease Number of cases
SAIL Pneumoconiosis 06
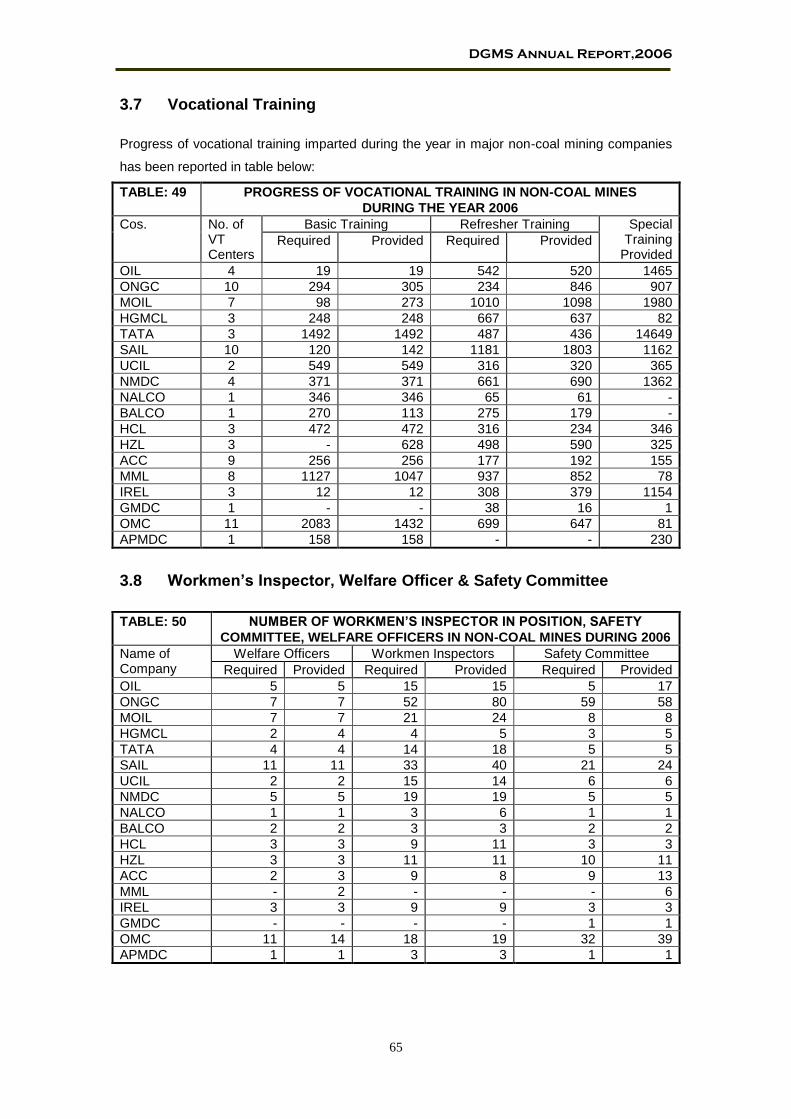
DGMS Annual Report,2006
65
3.7 Vocational Training
Progress of vocational training imparted during the year in major non-coal mining companies
has been reported in table below:
TABLE: 49 PROGRESS OF VOCATIONAL TRAINING IN NON-COAL MINES
DURING THE YEAR 2006
Cos. No. of VT Centers
Basic Training Refresher Training Special Training
Provided Required Provided Required Provided
OIL 4 19 19 542 520 1465
ONGC 10 294 305 234 846 907
MOIL 7 98 273 1010 1098 1980
HGMCL 3 248 248 667 637 82
TATA 3 1492 1492 487 436 14649
SAIL 10 120 142 1181 1803 1162
UCIL 2 549 549 316 320 365
NMDC 4 371 371 661 690 1362
NALCO 1 346 346 65 61 -
BALCO 1 270 113 275 179 -
HCL 3 472 472 316 234 346
HZL 3 - 628 498 590 325
ACC 9 256 256 177 192 155
MML 8 1127 1047 937 852 78
IREL 3 12 12 308 379 1154
GMDC 1 - - 38 16 1
OMC 11 2083 1432 699 647 81
APMDC 1 158 158 - - 230
3.8 Workmen’s Inspector, Welfare Officer & Safety Committee
TABLE: 50 NUMBER OF WORKMEN’S INSPECTOR IN POSITION, SAFETY
COMMITTEE, WELFARE OFFICERS IN NON-COAL MINES DURING 2006
Name of Company
Welfare Officers Workmen Inspectors Safety Committee
Required Provided Required Provided Required Provided
OIL 5 5 15 15 5 17
ONGC 7 7 52 80 59 58
MOIL 7 7 21 24 8 8
HGMCL 2 4 4 5 3 5
TATA 4 4 14 18 5 5
SAIL 11 11 33 40 21 24
UCIL 2 2 15 14 6 6
NMDC 5 5 19 19 5 5
NALCO 1 1 3 6 1 1
BALCO 2 2 3 3 2 2
HCL 3 3 9 11 3 3
HZL 3 3 11 11 10 11
ACC 2 3 9 8 9 13
MML - 2 - - - 6
IREL 3 3 9 9 3 3
GMDC - - - - 1 1
OMC 11 14 18 19 32 39
APMDC 1 1 3 3 1 1
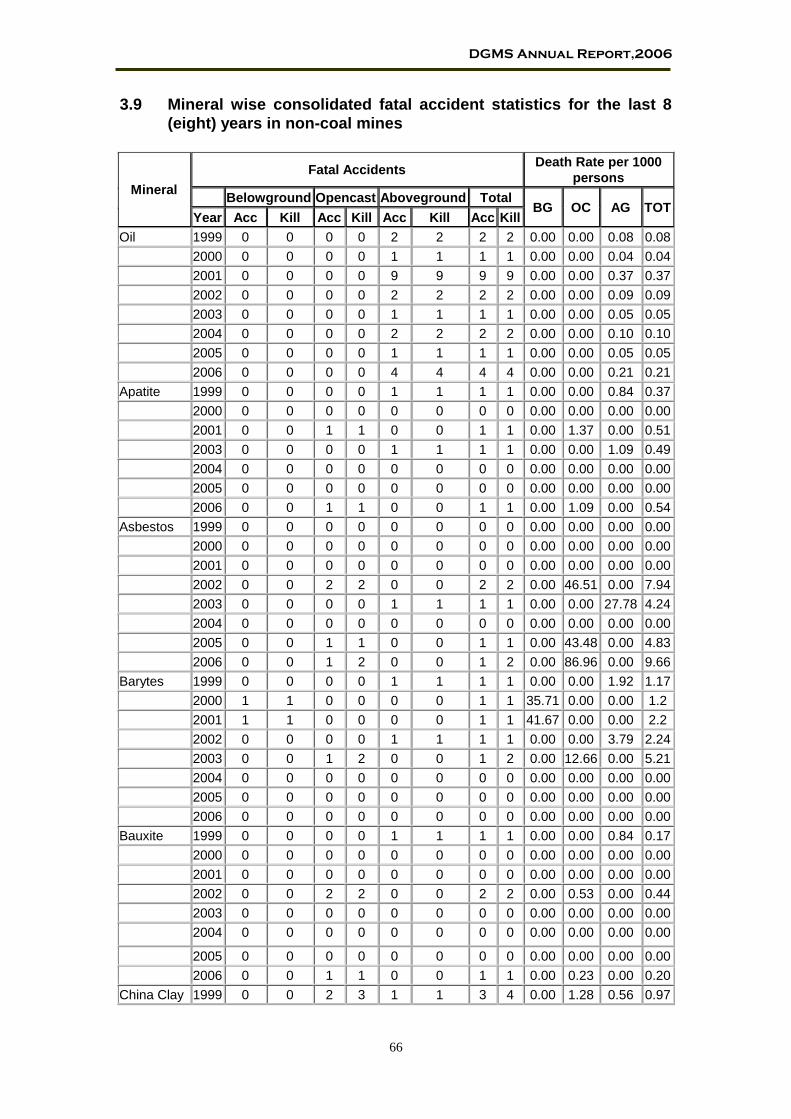
DGMS Annual Report,2006
66
3.9 Mineral wise consolidated fatal accident statistics for the last 8
(eight) years in non-coal mines
Mineral
Fatal Accidents Death Rate per 1000
persons
Belowground Opencast Aboveground Total BG OC AG TOT
Year Acc Kill Acc Kill Acc Kill Acc Kill
Oil 1999 0 0 0 0 2 2 2 2 0.00 0.00 0.08 0.08
2000 0 0 0 0 1 1 1 1 0.00 0.00 0.04 0.04
2001 0 0 0 0 9 9 9 9 0.00 0.00 0.37 0.37
2002 0 0 0 0 2 2 2 2 0.00 0.00 0.09 0.09
2003 0 0 0 0 1 1 1 1 0.00 0.00 0.05 0.05
2004 0 0 0 0 2 2 2 2 0.00 0.00 0.10 0.10
2005 0 0 0 0 1 1 1 1 0.00 0.00 0.05 0.05
2006 0 0 0 0 4 4 4 4 0.00 0.00 0.21 0.21
Apatite 1999 0 0 0 0 1 1 1 1 0.00 0.00 0.84 0.37
2000 0 0 0 0 0 0 0 0 0.00 0.00 0.00 0.00
2001 0 0 1 1 0 0 1 1 0.00 1.37 0.00 0.51
2003 0 0 0 0 1 1 1 1 0.00 0.00 1.09 0.49
2004 0 0 0 0 0 0 0 0 0.00 0.00 0.00 0.00
2005 0 0 0 0 0 0 0 0 0.00 0.00 0.00 0.00
2006 0 0 1 1 0 0 1 1 0.00 1.09 0.00 0.54
Asbestos 1999 0 0 0 0 0 0 0 0 0.00 0.00 0.00 0.00
2000 0 0 0 0 0 0 0 0 0.00 0.00 0.00 0.00
2001 0 0 0 0 0 0 0 0 0.00 0.00 0.00 0.00
2002 0 0 2 2 0 0 2 2 0.00 46.51 0.00 7.94
2003 0 0 0 0 1 1 1 1 0.00 0.00 27.78 4.24
2004 0 0 0 0 0 0 0 0 0.00 0.00 0.00 0.00
2005 0 0 1 1 0 0 1 1 0.00 43.48 0.00 4.83
2006 0 0 1 2 0 0 1 2 0.00 86.96 0.00 9.66
Barytes 1999 0 0 0 0 1 1 1 1 0.00 0.00 1.92 1.17
2000 1 1 0 0 0 0 1 1 35.71 0.00 0.00 1.2
2001 1 1 0 0 0 0 1 1 41.67 0.00 0.00 2.2
2002 0 0 0 0 1 1 1 1 0.00 0.00 3.79 2.24
2003 0 0 1 2 0 0 1 2 0.00 12.66 0.00 5.21
2004 0 0 0 0 0 0 0 0 0.00 0.00 0.00 0.00
2005 0 0 0 0 0 0 0 0 0.00 0.00 0.00 0.00
2006 0 0 0 0 0 0 0 0 0.00 0.00 0.00 0.00
Bauxite 1999 0 0 0 0 1 1 1 1 0.00 0.00 0.84 0.17
2000 0 0 0 0 0 0 0 0 0.00 0.00 0.00 0.00
2001 0 0 0 0 0 0 0 0 0.00 0.00 0.00 0.00
2002 0 0 2 2 0 0 2 2 0.00 0.53 0.00 0.44
2003 0 0 0 0 0 0 0 0 0.00 0.00 0.00 0.00
2004 0 0 0 0 0 0 0 0 0.00 0.00 0.00 0.00
2005 0 0 0 0 0 0 0 0 0.00 0.00 0.00 0.00
2006 0 0 1 1 0 0 1 1 0.00 0.23 0.00 0.20
China Clay 1999 0 0 2 3 1 1 3 4 0.00 1.28 0.56 0.97

DGMS Annual Report,2006
67
Mineral
Fatal Accidents Death Rate per 1000
persons
Belowground Opencast Aboveground Total BG OC AG TOT
Year Acc Kill Acc Kill Acc Kill Acc Kill
2000 0 0 0 0 0 0 0 0 0.00 0.00 0.00 0.00
2001 0 0 0 0 0 0 0 0 0.00 0.00 0.00 0.00
2002 0 0 1 2 0 0 1 2 0.00 0.96 0.00 0.57
2003 0 0 0 0 0 0 0 0 0.00 0.00 0.00 0.00
2004 0 0 0 0 0 0 0 0 0.00 0.00 0.00 0.00
2005 0 0 0 0 0 0 0 0 0.00 0.00 0.00 0.00
2006 0 0 0 0 0 0 0 0 0.00 0.00 0.00 0.00
Chromite 1999 1 1 0 0 0 0 1 1 1.18 0.00 0.00 0.12
2000 1 1 0 0 1 1 2 2 3.02 0.00 0.44 0.29
2001 0 0 1 1 1 1 2 2 0.00 0.25 0.49 0.31
2002 0 0 0 0 0 0 0 0 0.00 0.00 0.00 0.00
2003 0 0 0 0 0 0 0 0 0.00 0.00 0.00 0.00
2004 1 1 0 0 0 0 1 1 1.73 0.00 0.00 0.13
2005 0 0 0 0 0 0 0 0 0.00 0.00 0.00 0.00
2006 1 1 0 0 0 0 1 1 1.53 0.00 0.00 0.14
Copper 1999 0 0 0 0 0 0 0 0 0.00 0.00 0.00 0.00
2000 1 1 0 0 0 0 1 1 0.24 0.00 0.00 0.15
2001 1 1 0 0 0 0 1 1 0.38 0.00 0.00 0.25
2002 1 1 0 0 0 0 1 1 0.46 0.00 0.00 0.3
2003 0 0 0 0 0 0 0 0 0.00 0.00 0.00 0.00
2004 0 0 0 0 0 0 0 0 0.00 0.00 0.00 0.00
2005 0 0 0 0 0 0 0 0 0.00 0.00 0.00 0.00
2006 0 0 0 0 0 0 0 0 0.00 0.00 0.00 0.00
Diamond 1999 0 0 1 2 0 0 1 2 0.00 22.73 0.00 5.15
2000 0 0 0 0 0 0 0 0 0.00 0.00 0.00 0.00
2001 0 0 0 0 0 0 0 0 0.00 0.00 0.00 0.00
2002 0 0 0 0 0 0 0 0 0.00 0.00 0.00 0.00
2003 0 0 0 0 0 0 0 0 0.00 0.00 0.00 0.00
2004 0 0 0 0 0 0 0 0 0.00 0.00 0.00 0.00
2005 0 0 0 0 0 0 0 0 0.00 0.00 0.00 0.00
2006 0 0 0 0 0 0 0 0 0.00 0.00 0.00 0.00
Dolomite 1999 0 0 2 2 0 0 2 2 0.00 0.86 0.00 0.66
2000 0 0 1 1 0 0 1 1 0.00 0.47 0.00 0.36
2001 0 0 0 0 0 0 0 0 0.00 0.00 0.00 0.00
2002 0 0 0 0 0 0 0 0 0.00 0.00 0.00 0.00
2003 0 0 0 0 1 1 1 1 0.00 0.00 1.43 0.41
2004 0 0 1 1 0 0 1 1 0.00 0.56 0.00 0.44
2005 0 0 0 0 0 0 0 0 0.00 0.00 0.00 0.00
2006 0 0 0 0 0 0 0 0 0.00 0.00 0.00 0.00
Felspar 1999 0 0 0 0 0 0 0 0 0.00 0.00 0.00 0.00
2000 0 0 0 0 0 0 0 0 0.00 0.00 0.00 0.00
2001 0 0 0 0 0 0 0 0 0.00 0.00 0.00 0.00
2002 0 0 0 0 0 0 0 0 0.00 0.00 0.00 0.00
2003 0 0 0 0 0 0 0 0 0.00 0.00 0.00 0.00

DGMS Annual Report,2006
68
Mineral
Fatal Accidents Death Rate per 1000
persons
Belowground Opencast Aboveground Total BG OC AG TOT
Year Acc Kill Acc Kill Acc Kill Acc Kill
2004 0 0 1 1 0 0 1 1 0.00 7.19 0.00 5.85
2005 0 0 0 0 0 0 0 0 0.00 0.00 0.00 0.00
2006 0 0 0 0 0 0 0 0 0.00 0.00 0.00 0.00
Fluorite 1999 0 0 0 0 0 0 0 0 0.00 0.00 0.00 0.00
2000 0 0 0 0 0 0 0 0 0.00 0.00 0.00 0.00
2001 0 0 0 0 0 0 0 0 0.00 0.00 0.00 0.00
2002 0 0 0 0 0 0 0 0 0.00 0.00 0.00 0.00
2003 0 0 0 0 0 0 0 0 0.00 0.00 0.00 0.00
2004 0 0 0 0 0 0 0 0 0.00 0.00 0.00 0.00
2005 0 0 0 0 0 0 0 0 0.00 0.00 0.00 0.00
2006 0 0 0 0 0 0 0 0 0.00 0.00 0.00 0.00
Galena & Sphalarite
1999 0 0 0 0 1 1 1 1 0.00 0.00 0.36 0.18
2000 0 0 0 0 0 0 0 0 0.00 0.00 0.00 0.00
2001 0 0 0 0 0 0 0 0 0.00 0.00 0.00 0.00
2002 1 1 0 0 0 0 1 1 0.50 0.00 0.00 0.22
2003 0 0 0 0 0 0 0 0 0.00 0.00 0.00 0.00
2004 2 2 0 0 1 1 3 3 1.80 0.00 0.49 0.79
2005 0 0 0 0 1 1 1 1 0.00 0.00 0.68 0.31
2006 1 1 0 0 0 0 1 1 0.96 0.00 0.00 0.31
Garnet 1999 0 0 0 0 0 0 0 0 0.00 0.00 0.00 0.00
2000 0 0 0 0 0 0 0 0 0.00 0.00 0.00 0.00
2001 0 0 0 0 0 0 0 0 0.00 0.00 0.00 0.00
2002 0 0 0 0 0 0 0 0 0.00 0.00 0.00 0.00
2003 0 0 0 0 0 0 0 0 0.00 0.00 0.00 0.00
2004 0 0 0 0 0 0 0 0 0.00 0.00 0.00 0.00
2005 0 0 0 0 0 0 0 0 0.00 0.00 0.00 0.00
2006 0 0 0 0 0 0 0 0 0.00 0.00 0.00 0.00
Gold 1999 1 3 0 0 1 1 2 4 0.84 0.00 0.45 0.68
2000 0 0 0 0 0 0 0 0 0.00 0.00 0.00 0.00
2001 1 1 0 0 0 0 1 1 0.54 0.00 0.00 0.28
2002 0 0 0 0 0 0 0 0 0.00 0.00 0.00 0.00
2003 0 0 0 0 0 0 0 0 0.00 0.00 0.00 0.00
2004 0 0 0 0 0 0 0 0 0.00 0.00 0.00 0.00
2005 0 0 0 0 0 0 0 0 0.00 0.00 0.00 0.00
2006 1 1 0 0 0 0 1 1 0.65 0.00 0.00 0.32
Granite 1999 0 0 3 3 0 0 3 3 0.00 0.82 0.00 0.68
2000 0 0 5 5 2 2 7 7 0.00 1.13 2.33 1.32
2001 0 0 7 7 2 2 9 9 0.00 1.70 1.05 1.50
2002 0 0 2 2 1 1 3 3 0.00 0.44 0.69 0.50
2003 0 0 5 6 2 2 7 8 0.00 1.03 1.46 1.29
2004 0 0 1 1 1 1 2 2 0.00 0.20 0.61 0.30
2005 0 0 6 7 0 0 6 7 0.00 1.28 0.00 0.98
2006 0 0 6 9 0 0 6 9 0.00 1.65 0.00 1.25
Graphite 1999 0 0 0 0 0 0 0 0 0.00 0.00 0.00 0.00

DGMS Annual Report,2006
69
Mineral
Fatal Accidents Death Rate per 1000
persons
Belowground Opencast Aboveground Total BG OC AG TOT
Year Acc Kill Acc Kill Acc Kill Acc Kill
2000 0 0 0 0 0 0 0 0 0.00 0.00 0.00 0.00
2001 0 0 0 0 0 0 0 0 0.00 0.00 0.00 0.00
2002 0 0 0 0 0 0 0 0 0.00 0.00 0.00 0.00
2003 0 0 0 0 0 0 0 0 0.00 0.00 0.00 0.00
2004 0 0 0 0 0 0 0 0 0.00 0.00 0.00 0.00
2005 0 0 0 0 0 0 0 0 0.00 0.00 0.00 0.00
2006 0 0 1 1 0 0 1 1 0.00 2.54 0.00 2.30
Gypsum 1999 0 0 0 0 0 0 0 0 0.00 0.00 0.00 0.00
2000 0 0 0 0 0 0 0 0 0.00 0.00 0.00 0.00
2001 0 0 0 0 0 0 0 0 0.00 0.00 0.00 0.00
2002 0 0 0 0 0 0 0 0 0.00 0.00 0.00 0.00
2003 0 0 0 0 0 0 0 0 0.00 0.00 0.00 0.00
2004 0 0 0 0 0 0 0 0 0.00 0.00 0.00 0.00
2005 0 0 0 0 0 0 0 0 0.00 0.00 0.00 0.00
2006 0 0 1 1 0 0 1 1 0.00 3.86 0.00 2.84
Iron 1999 0 0 4 4 4 4 8 8 0.00 0.18 0.28 0.22
2000 0 0 6 7 3 3 9 10 0.00 0.34 0.21 0.28
2001 0 0 7 7 4 5 11 12 0.00 0.38 0.36 0.37
2002 0 0 5 5 5 5 10 10 0.00 0.24 0.38 0.30
2003 1 1 6 6 7 8 14 15 0.00 0.25 0.57 0.39
2004 0 0 5 5 7 8 12 13 0.00 0.22 0.50 0.34
2005 0 0 7 8 8 8 15 16 0.00 0.36 0.53 0.43
2006 0 0 11 17 5 5 16 22 0.00 0.76 0.33 0.59
Limestone 1999 0 0 12 13 0 0 12 13 0.00 0.60 0.00 0.44
2000 0 0 5 5 4 4 9 9 0.00 0.22 0.47 0.29
2001 0 0 8 8 3 3 11 11 0.00 0.44 0.5 0.45
2002 0 0 8 11 2 2 10 13 0.00 0.58 0.32 0.52
2003 0 0 6 8 0 0 6 8 0.00 0.43 0.00 0.33
2004 0 0 11 12 1 1 12 13 0.00 0.63 0.17 0.52
2005 0 0 6 6 1 1 7 7 0.00 0.30 0.17 0.28
2006 0 0 10 13 2 2 12 15 0.00 0.65 0.34 0.58
Magnesite 1999 0 0 0 0 0 0 0 0 0.00 0.00 0.00 0.00
2000 0 0 0 0 0 0 0 0 0.00 0.00 0.00 0.00
2001 0 0 0 0 0 0 0 0 0.00 0.00 0.00 0.00
2002 0 0 0 0 0 0 0 0 0.00 0.00 0.00 0.00
2003 0 0 0 0 0 0 0 0 0.00 0.00 0.00 0.00
2004 0 0 0 0 0 0 0 0 0.00 0.00 0.00 0.00
2005 0 0 0 0 0 0 0 0 0.00 0.00 0.00 0.00
2006 0 0 0 0 3 3 3 3 0.00 0.00 15.79 1.65
Manganese 1999 3 3 0 0 1 1 4 4 1.09 0.00 0.20 0.24
2000 2 2 3 3 0 0 5 5 0.76 0.33 0.00 0.31
2001 1 1 0 0 0 0 1 1 0.4 0.00 0.00 0.07
2002 1 1 1 1 2 2 4 4 0.39 0.13 0.54 0.29
2003 1 1 0 0 0 0 1 1 0.41 0.00 0.00 0.08

DGMS Annual Report,2006
70
Mineral
Fatal Accidents Death Rate per 1000
persons
Belowground Opencast Aboveground Total BG OC AG TOT
Year Acc Kill Acc Kill Acc Kill Acc Kill
2004 1 1 1 1 1 1 3 3 0.33 0.13 0.29 0.21
2005 0 0 0 0 0 0 0 0 0.00 0.00 0.00 0.00
2006 0 0 2 2 0 0 2 2 0.00 0.26 0.00 0.14
Marble 1999 0 0 3 4 0 0 3 4 0.00 3.93 0.00 3.05
2000 0 0 2 4 0 0 2 4 0.00 3.66 0.00 2.75
2001 0 0 7 11 0 0 7 11 0.00 9.07 0.00 6.54
2002 0 0 2 3 0 0 2 3 0.00 2.58 0.00 1.95
2003 1 2 5 5 0 0 6 7 N.A. 4.46 0.00 4.64
2004 0 0 6 9 1 1 7 10 0.00 7.85 2.60 6.53
2005 0 0 3 3 0 0 3 3 0.00 2.51 0.00 1.85
2006 0 0 4 4 0 0 4 4 0.00 3.35 0.00 2.47
Mica 1999 0 0 0 0 0 0 0 0 0.00 0.00 0.00 0.00
2000 1 1 0 0 0 0 1 1 1.50 0.00 0.00 1.02
2001 0 0 0 0 0 0 0 0 0.00 0.00 0.00 0.00
2002 1 1 0 0 0 0 1 1 2.31 0.00 0.00 1.60
2003 0 0 0 0 0 0 0 0 0.00 0.00 0.00 0.00
2004 1 1 0 0 0 0 1 1 2.39 0.00 0.00 1.58
2005 0 0 0 0 0 0 0 0 0.00 0.00 0.00 0.00
2006 0 0 0 0 0 0 0 0 0.00 0.00 0.00 0.00
Pyrite 1999 1 1 0 0 0 0 1 1 2.56 0.00 0.00 2.22
2000 0 0 0 0 0 0 0 0 0.00 0.00 0.00 0.00
2001 0 0 0 0 0 0 0 0 0.00 0.00 0.00 0.00
2002 0 0 0 0 0 0 0 0 0.00 0.00 0.00 0.00
2003 0 0 0 0 0 0 0 0 0.00 0.00 0.00 0.00
2004 0 0 0 0 0 0 0 0 0.00 0.00 0.00 0.00
2005 0 0 0 0 0 0 0 0 0.00 0.00 0.00 0.00
2006 0 0 0 0 0 0 0 0 0.00 0.00 0.00 0.00
Quartz 1999 0 0 0 0 0 0 0 0 0.00 0.00 0.00 0.00
2000 0 0 0 0 0 0 0 0 0.00 0.00 0.00 0.00
2001 0 0 0 0 0 0 0 0 0.00 0.00 0.00 0.00
2002 0 0 0 0 0 0 0 0 0.00 0.00 0.00 0.00
2003 0 0 0 0 1 1 1 1 0.00 0.00 17.86 1.29
2004 0 0 0 0 0 0 0 0 0.00 0.00 0.00 0.00
2005 0 0 1 2 0 0 1 2 0.00 2.62 0.00 2.39
2006 0 0 0 0 0 0 0 0 0.00 0.00 0.00 0.00
Sandstone 1999 0 0 0 0 0 0 0 0 0.00 0.00 0.00 0.00
2000 0 0 0 0 0 0 0 0 0.00 0.00 0.00 0.00
2001 0 0 0 0 0 0 0 0 0.00 0.00 0.00 0.00
2002 0 0 0 0 0 0 0 0 0.00 0.00 0.00 0.00
2003 0 0 0 0 0 0 0 0 0.00 0.00 0.00 0.00
2004 0 0 0 0 0 0 0 0 0.00 0.00 0.00 0.00
2005 0 0 0 0 0 0 0 0 0.00 0.00 0.00 0.00
2006 0 0 0 0 0 0 0 0 0.00 0.00 0.00 0.00
Silica 1999 0 0 4 4 2 2 6 6 0.00 1.64 3.83 2.03

DGMS Annual Report,2006
71
Mineral
Fatal Accidents Death Rate per 1000
persons
Belowground Opencast Aboveground Total BG OC AG TOT
Year Acc Kill Acc Kill Acc Kill Acc Kill
2001 0 0 0 0 1 1 1 1 0.00 0.00 1.68 0.39
2002 0 0 2 2 0 0 2 2 0.00 0.93 0.00 0.71
2003 0 0 1 1 1 1 2 2 0.00 0.47 1.46 0.71
2004 0 0 1 2 1 1 2 3 0.00 0.90 1.22 0.98
2005 0 0 0 0 0 0 0 0 0.00 0.00 0.00 0.00
2006 0 0 0 0 0 0 0 0 0.00 0.00 0.00 0.00
Sillimanite 1999 0 0 0 0 0 0 0 0 0.00 0.00 0.00 0.00
2000 0 0 0 0 0 0 0 0 0.00 0.00 0.00 0.00
2001 0 0 0 0 0 0 0 0 0.00 0.00 0.00 0.00
2002 0 0 0 0 0 0 0 0 0.00 0.00 0.00 0.00
2003 0 0 0 0 0 0 0 0 0.00 0.00 0.00 0.00
2004 0 0 0 0 1 1 1 1 0.00 0.00 0.55 0.33
2005 0 0 0 0 0 0 0 0 0.00 0.00 0.00 0.00
2006 0 0 0 0 0 0 0 0 0.00 0.00 0.00 0.00
Slate 1999 0 0 0 0 0 0 0 0 0.00 0.00 0.00 0.00
2000 0 0 0 0 0 0 0 0 0.00 0.00 0.00 0.00
2001 0 0 1 1 0 0 1 1 0.00 4.42 0.00 3.77
2002 0 0 0 0 0 0 0 0 0.00 0.00 0.00 0.00
2003 0 0 0 0 0 0 0 0 0.00 0.00 0.00 0.00
2004 0 0 0 0 0 0 0 0 0.00 0.00 0.00 0.00
2005 0 0 0 0 0 0 0 0 0.00 0.00 0.00 0.00
2006 0 0 0 0 0 0 0 0 0.00 0.00 0.00 0.00
Steatite 1999 0 0 3 8 0 0 3 8 0.00 3.19 0.00 2.44
2000 1 1 2 2 0 0 3 3 5.21 0.60 0.00 0.70
2001 1 1 3 5 0 0 4 6 3.27 1.50 0.00 1.39
2002 0 0 2 2 0 0 2 2 0.00 0.62 0.00 0.48
2003 0 0 2 3 3 3 5 6 0.00 0.99 4.46 1.54
2004 0 0 2 2 0 0 2 2 0.00 0.31 0.00 0.25
2005 0 0 2 2 0 0 2 2 0.00 0.63 0.00 0.49
2006 0 0 2 2 1 1 3 3 0.00 0.63 1.43 0.73
Stone 1999 0 0 6 6 0 0 6 6 0.00 1.87 0.00 1.16
2000 0 0 6 7 3 3 9 10 0.00 1.65 1.38 1.56
2001 0 0 9 9 1 4 10 13 0.00 2.14 1.93 2.07
2002 0 0 6 13 1 1 7 14 0.00 2.70 0.34 1.79
2003 0 0 6 9 0 0 6 9 0.00 1.82 0.00 1.13
2004 0 0 8 9 0 0 8 9 0.00 1.78 0.00 1.13
2005 0 0 8 9 0 0 8 9 0.00 1.83 0.00 1.28
2006 0 0 4 4 0 0 4 4 0.00 1.11 0.00 0.83
Atomic 1999 0 0 0 0 0 0 0 0 N.A. N.A. N.A. N.A.
Mineral 2000 0 0 0 0 0 0 0 0 N.A. N.A. N.A. N.A.
2001 0 0 1 1 0 0 1 1 N.A. N.A. N.A. N.A.
2002 1 1 0 0 0 0 1 1 N.A. N.A. N.A. N.A.
2003 0 0 0 0 0 0 0 0 N.A. N.A. N.A. N.A.

DGMS Annual Report,2006
72
Mineral
Fatal Accidents Death Rate per 1000
persons
Belowground Opencast Aboveground Total BG OC AG TOT
Year Acc Kill Acc Kill Acc Kill Acc Kill
2004 0 0 0 0 0 0 0 0 N.A. N.A. N.A. N.A.
2005 3 3 0 0 0 0 3 3 N.A. N.A. N.A. N.A.
2006 0 0 0 0 0 0 0 0 N.A. N.A. N.A. N.A.
Total 1999 6 8 40 49 15 15 61 72 0.49 0.55 0.19 0.39
2000 7 7 30 34 14 14 51 55 0.49 0.37 0.19 0.30
2001 5 5 45 51 21 25 71 81 0.52 0.72 0.38 0.54
2002 5 5 33 45 14 14 52 64 0.49 0.54 0.21 0.40
2003 3 4 31 38 18 20 52 62 0.39 0.46 0.31 0.40
2004 5 5 36 42 16 17 57 64 0.62 0.47 0.26 0.39
2005 3 3 38 38 11 11 48 52 0.37 0.43 0.16 0.32
2006 3 3 44 57 15 15 62 75 0.38 0.66 0.24 0.48
Note : Figures for the year 2006 are provisional. N.A. = Employment Figures not Available.

DGMS Annual Report,2006
73
3.10 Mineral wise consolidated serious accident statistics for the last 8
(eight) years in non-coal mines
Mineral Year
Serious Accident Death Rate per 1000
persons Belowground Opencast Aboveground Total
Acc S/Inj Acc S/Inj Acc S/Inj Acc S/Inj BG OC AG TOT
Oil 1999 0 0 0 0 23 23 23 23 0.00 0.00 0.90 0.90
2000 0 0 0 0 27 28 27 28 0.00 0.00 1.19 1.19
2001 0 0 0 0 21 22 21 22 0.00 0.00 0.90 0.90
2002 0 0 0 0 31 31 31 31 0.00 0.00 1.39 1.39
2003 0 0 0 0 21 22 21 22 0.00 0.00 1.13 1.13
2004 0 0 0 0 38 40 38 40 0.00 0.00 2.09 2.09
2005 0 0 0 0 15 15 15 15 0.00 0.00 0.78 0.78
2006 0 0 0 0 14 14 14 14 0.00 0.00 0.73 0.73
Apatite 1999 0 0 1 1 0 2 1 3 0.00 0.84 1.69 1.11
2000 0 0 2 2 1 1 3 3 0.00 1.95 0.93 1.25
2001 0 0 0 0 1 1 1 1 0.00 0.00 1.06 0.51
2002 0 0 0 0 0 0 0 0 0.00 0.00 0.00 0.00
2003 0 0 0 0 0 0 0 0 0.00 0.00 0.00 0.00
2004 0 0 0 0 0 0 0 0 0.00 0.00 0.00 0.00
2005 0 0 0 0 0 0 0 0 0.00 0.00 0.00 0.00
2006 0 0 0 0 0 0 0 0 0.00 0.00 0.00 0.00
Asbestos 1999 0 0 0 0 0 0 0 0 0.00 0.00 0.00 0.00
2000 0 0 0 0 0 0 0 0 0.00 0.00 0.00 0.00
2001 0 0 0 0 0 0 0 0 0.00 0.00 0.00 0.00
2002 0 0 0 0 0 0 0 0 0.00 0.00 0.00 0.00
2003 0 0 0 0 0 0 0 0 0.00 0.00 0.00 0.00
2004 0 0 0 0 0 0 0 0 0.00 0.00 0.00 0.00
2005 0 0 0 0 0 0 0 0 0.00 0.00 0.00 0.00
2006 0 0 0 0 0 0 0 0 0.00 0.00 0.00 0.00
Barytes 1999 0 0 0 0 0 0 0 0 0.00 0.00 0.00 0.00
2000 0 0 0 0 0 0 0 0 0.00 0.00 0.00 0.00
2001 0 0 0 0 0 0 0 0 0.00 0.00 0.00 0.00
2002 0 0 0 0 1 1 1 1 0.00 0.00 3.79 2.24
2003 0 0 0 0 0 0 0 0 0.00 0.00 0.00 0.00
2004 0 0 0 0 0 0 0 0 0.00 0.00 0.00 0.00
2005 0 0 0 0 0 0 0 0 0.00 0.00 0.00 0.00
2006 0 0 0 0 0 0 0 0 0.00 0.00 0.00 0.00
Bauxite 1999 0 0 0 0 0 0 0 0 0.00 0.00 0.00 0.00
2000 0 0 0 0 0 0 0 0 0.00 0.00 0.00 0.00
2001 0 0 0 0 0 0 0 0 0.00 0.00 0.00 0.00
2002 0 0 0 0 0 0 0 0 0.00 0.00 0.00 0.00
2003 0 0 0 0 2 2 2 2 0.00 0.00 2.80 0.41
2004 0 0 0 0 1 1 1 1 0.00 0.00 1.58 0.17
2005 0 0 0 0 0 0 0 0 0.00 0.00 0.00 0.00
2006 0 0 0 0 1 1 1 1 0.00 0.00 1.56 0.20
China Clay 1999 0 0 0 0 0 1 0 1 0.00 0.00 0.56 0.24
2000 0 0 0 0 1 2 1 2 0.00 0.00 1.15 0.49
2001 0 0 0 0 0 0 0 0 0.00 0.00 0.00 0.00
2002 0 0 0 1 0 0 0 1 0.00 0.48 0.00 0.28

DGMS Annual Report,2006
74
Mineral Year
Serious Accident Death Rate per 1000
persons Belowground Opencast Aboveground Total
Acc S/Inj Acc S/Inj Acc S/Inj Acc S/Inj BG OC AG TOT
2003 0 0 0 0 0 0 0 0 0.00 0.00 0.00 0.00
2004 0 0 0 0 0 0 0 0 0.00 0.00 0.00 0.00
2005 0 0 1 1 0 0 1 1 0.00 0.54 0.00 0.31
2006 0 0 0 0 0 0 0 0 0.00 0.00 0.00 0.00
Chromite 1999 1 1 1 1 3 3 5 5 1.18 0.22 1.12 0.62
2000 0 0 0 0 0 0 0 0 0.00 0.00 0.00 0.00
2001 0 0 0 0 0 0 0 0 0.00 0.00 0.00 0.00
2002 0 0 0 0 1 1 1 1 0.00 0.00 0.41 0.14
2003 0 0 1 1 0 0 1 1 0.00 0.28 0.00 0.15
2004 1 1 0 0 0 0 1 1 1.73 0.00 0.00 0.13
2005 0 0 0 0 1 1 1 1 0.00 0.00 0.33 0.14
2006 0 0 0 0 1 1 1 1 0.00 0.00 0.33 0.14
Copper 1999 1 1 0 0 0 0 1 1 0.22 0.00 0.00 0.13
2000 1 1 3 3 3 3 7 7 0.24 7.65 1.25 1.02
2001 1 3 2 2 5 5 8 10 1.15 7.63 4.45 2.50
2002 2 2 2 3 1 1 5 6 0.92 11.90 1.09 1.79
2003 0 0 2 2 2 2 4 4 0.00 8.40 1.77 1.58
2004 0 0 0 0 1 1 1 1 0.00 0.00 1.50 0.49
2005 0 0 4 4 0 0 4 4 0.00 12.90 0.00 2.07
2006 0 0 0 0 0 0 0 0 0.00 0.00 0.00 0.00
Diamond 1999 0 0 0 0 3 3 3 3 0.00 0.00 11.10 7.73
2000 0 0 1 1 1 1 2 2 0.00 12.50 3.97 5.52
2001 0 0 0 0 4 4 4 4 0.00 0.00 19.10 15.63
2002 0 0 2 2 0 0 2 2 0.00 40.00 0.00 9.71
2003 0 0 0 0 1 1 1 1 0.00 0.00 5.65 4.41
2004 0 0 1 1 0 0 1 1 0.00 20.00 0.00 4.76
2005 0 0 0 0 1 1 1 1 0.00 0.00 6.76 5.13
2006 0 0 0 0 0 0 0 0 0.00 0.00 0.00 0.00
Dolomite 1999 0 0 0 0 3 3 3 3 0.00 0.00 4.13 0.98
2000 0 0 1 1 2 2 3 3 0.00 0.47 2.85 1.07
2001 0 0 0 0 0 0 0 0 0.00 0.00 0.00 0.00
2002 0 0 0 0 1 1 1 1 0.00 0.00 1.35 0.45
2003 0 0 0 0 0 0 0 0 0.00 0.00 0.00 0.00
2004 0 0 1 1 1 1 2 2 0.00 0.56 2.20 0.89
2005 0 0 0 0 0 0 0 0 0.00 0.00 0.00 0.00
2006 0 0 0 0 0 0 0 0 0.00 0.00 0.00 0.00
Felspar 1999 0 0 0 0 0 0 0 0 0.00 0.00 0.00 0.00
2000 0 0 0 0 0 0 0 0 0.00 0.00 0.00 0.00
2001 0 0 0 0 0 0 0 0 0.00 0.00 0.00 0.00
2002 0 0 0 0 0 0 0 0 0.00 0.00 0.00 0.00
2003 0 0 0 0 0 0 0 0 0.00 0.00 0.00 0.00
2004 0 0 0 0 0 0 0 0 0.00 0.00 0.00 0.00
2005 0 0 0 0 0 0 0 0 0.00 0.00 0.00 0.00
2006 0 0 0 0 0 0 0 0 0.00 0.00 0.00 0.00
Fluorite 1999 0 0 0 0 0 0 0 0 0.00 0.00 0.00 0.00
2000 0 0 0 0 0 0 0 0 0.00 0.00 0.00 0.00
2001 0 0 0 0 0 0 0 0 0.00 0.00 0.00 0.00

DGMS Annual Report,2006
75
Mineral Year
Serious Accident Death Rate per 1000
persons Belowground Opencast Aboveground Total
Acc S/Inj Acc S/Inj Acc S/Inj Acc S/Inj BG OC AG TOT
2002 0 0 1 1 0 0 1 1 0.00 7.69 0.00 6.71
2003 0 0 0 0 0 0 0 0 0.00 0.00 0.00 0.00
2004 0 0 0 0 0 0 0 0 0.00 0.00 0.00 0.00
2005 0 0 0 0 0 0 0 0 0.00 0.00 0.00 0.00
2006 0 0 0 0 0 0 0 0 0.00 0.00 0.00 0.00
Galena & Sphalarite
1999 41 41 0 0 9 9 50 50 14.80 0.00 3.28 9.07
2000 23 24 0 0 11 11 34 35 9.17 0.00 4.16 6.65
2001 26 26 1 1 17 17 44 44 11.60 3.24 6.41 8.44
2002 9 9 2 2 12 12 23 23 4.46 7.07 5.46 5.12
2003 11 11 1 1 10 10 22 22 8.16 1.66 6.34 6.24
2004 21 21 2 2 7 7 30 30 18.90 3.26 3.42 7.94
2005 14 14 0 0 10 10 24 24 13.46 0.00 6.75 7.43
2006 7 7 3 3 2 2 12 12 6.73 4.23 1.35 3.72
Garnet 1999 0 0 0 0 0 0 0 0 0.00 0.00 0.00 0.00
2000 0 0 0 0 0 0 0 0 0.00 0.00 0.00 0.00
2001 0 0 0 0 1 1 1 1 0.00 0.00 2.04 0.39
2002 0 0 0 0 0 0 0 0 0.00 0.00 0.00 0.00
2003 0 0 0 0 0 0 0 0 0.00 0.00 0.00 0.00
2004 0 0 0 0 0 0 0 0 0.00 0.00 0.00 0.00
2005 0 0 0 0 0 0 0 0 0.00 0.00 0.00 0.00
2006 0 0 0 0 0 0 0 0 0.00 0.00 0.00 0.00
Gold 1999 44 48 0 0 19 19 63 67 13.40 0.00 8.62 11.38
2000 31 31 0 0 8 8 39 39 9.92 0.00 3.79 7.31
2001 25 25 0 0 7 7 32 32 13.60 0.00 4.16 8.84
2002 27 27 0 0 13 13 40 40 15.60 0.00 8.52 11.97
2003 46 46 0 0 15 15 61 61 26.70 0.00 7.79 16.38
2004 22 22 0 0 13 13 35 35 16.70 0.00 9.57 12.83
2005 9 9 0 0 1 1 10 10 5.83 0.00 0.64 3.21
2006 7 7 0 0 2 3 9 10 4.53 0.00 1.92 3.21
Granite 1999 0 0 5 8 0 0 5 8 0.00 2.20 0.00 1.82
2000 0 0 2 2 0 0 2 2 0.00 0.45 0.00 0.38
2001 0 0 0 0 0 0 0 0 0.00 0.00 0.00 0.00
2002 0 0 0 0 1 1 1 1 0.00 0.00 0.69 0.17
2003 0 0 0 1 0 1 0 2 0.00 0.21 0.73 0.32
2004 0 0 0 0 0 0 0 0 0.00 0.00 0.00 0.00
2005 0 0 1 2 0 0 1 2 0.00 0.37 0.00 0.28
2006 0 0 0 0 0 0 0 0 0.00 0.00 0.00 0.00
Iron 1999 0 0 12 13 24 26 36 39 0.00 0.60 1.80 1.08
2000 0 0 19 19 15 15 34 34 0.00 0.92 1.03 0.96
2001 0 0 27 28 27 27 54 55 0.00 1.51 1.96 1.70
2002 0 0 24 24 36 36 60 60 0.00 1.17 2.73 1.78
2003 0 0 16 19 22 24 38 43 0.00 0.84 1.59 1.17
2004 0 0 21 23 24 24 45 47 0.00 1.09 1.53 1.28
2005 0 0 10 12 24 24 34 36 0.00 0.54 1.58 0.96
2006 0 0 10 10 11 12 21 22 0.00 0.45 0.79 0.59
Limestone 1999 0 0 6 9 12 12 18 21 0.00 0.41 1.50 0.71
2000 0 0 8 8 9 9 17 17 0.00 0.35 1.07 0.55

DGMS Annual Report,2006
76
Mineral Year
Serious Accident Death Rate per 1000
persons Belowground Opencast Aboveground Total
Acc S/Inj Acc S/Inj Acc S/Inj Acc S/Inj BG OC AG TOT
2001 0 0 6 6 8 8 14 14 0.00 0.33 1.34 0.58
2002 0 0 4 4 4 4 8 8 0.00 0.21 0.64 0.32
2003 0 0 5 5 8 8 13 13 0.00 0.27 1.38 0.54
2004 0 0 6 6 8 8 14 14 0.00 0.37 1.38 0.61
2005 0 0 5 5 4 4 9 9 0.00 0.25 0.69 0.35
2006 0 0 2 2 4 5 6 7 0.00 0.10 0.86 0.27
Magnesite 1999 0 0 0 0 1 1 1 1 0.00 0.00 3.69 0.37
2000 0 0 2 4 1 1 3 5 0.00 1.48 2.42 1.61
2001 0 0 1 1 0 0 1 1 0.00 0.40 0.00 0.35
2002 0 0 2 2 2 2 4 4 0.00 1.04 5.97 1.78
2003 0 0 1 1 0 0 1 1 0.00 0.59 0.00 0.47
2004 0 0 0 0 1 1 1 1 0.00 0.00 3.70 0.58
2005 0 0 0 0 0 0 0 0 0.00 0.00 0.00 0.00
2006 0 0 0 0 0 0 0 0 0.00 0.00 0.00 0.00
Manganese 1999 4 6 3 3 1 1 8 10 2.19 0.35 0.20 0.61
2000 6 6 0 0 1 1 7 7 2.29 0.00 0.23 0.43
2001 2 2 0 0 4 4 6 6 0.80 0.00 1.00 0.44
2002 5 5 2 2 7 7 14 14 1.96 0.27 1.88 1.02
2003 4 4 1 1 6 6 11 11 1.63 0.14 1.75 0.83
2004 6 6 0 0 3 3 9 9 1.99 0.00 0.77 0.62
2005 2 2 1 1 2 2 5 5 0.71 0.13 0.50 0.34
2006 5 6 0 0 0 0 5 6 2.13 0.00 0.00 0.61
Marble 1999 0 0 0 0 0 0 0 0 0.00 0.00 0.00 0.00
2000 0 0 0 1 0 0 0 1 0.00 0.91 0.00 0.69
2001 0 0 0 1 0 0 0 1 0.00 0.82 0.00 0.59
2002 0 0 0 0 0 0 0 0 0.00 0.00 0.00 0.00
2003 0 0 0 0 0 0 0 0 0.00 0.00 0.00 0.00
2004 0 0 0 0 0 0 0 0 0.00 0.00 0.00 0.00
2005 0 0 0 0 0 0 0 0 0.00 0.00 0.00 0.00
2006 0 0 0 0 0 0 0 0 0.00 0.00 0.00 0.00
Mica 1999 0 0 0 0 0 0 0 0 0.00 0.00 0.00 0.00
2000 1 1 0 0 0 0 1 1 1.50 0.00 0.00 1.02
2001 0 0 0 0 0 0 0 0 0.00 0.00 0.00 0.00
2002 0 0 0 0 0 0 0 0 0.00 0.00 0.00 0.00
2003 0 0 0 0 0 0 0 0 0.00 0.00 0.00 0.00
2004 0 0 0 0 0 0 0 0 0.00 0.00 0.00 0.00
2005 0 0 0 0 0 0 0 0 0.00 0.00 0.00 0.00
2006 0 0 0 0 0 0 0 0 0.00 0.00 0.00 0.00
Pyrite 1999 0 0 0 0 0 0 0 0 0.00 0.00 0.00 0.00
2000 0 0 0 0 0 0 0 0 0.00 0.00 0.00 0.00
2001 0 0 0 0 0 0 0 0 0.00 0.00 0.00 0.00
2002 0 0 0 0 0 0 0 0 0.00 0.00 0.00 0.00
2003 0 0 0 0 0 0 0 0 0.00 0.00 0.00 0.00
2004 0 0 0 0 0 0 0 0 0.00 0.00 0.00 0.00
2005 0 0 0 0 0 0 0 0 0.00 0.00 0.00 0.00
2006 0 0 0 0 0 0 0 0 0.00 0.00 0.00 0.00
Quartz 1999 0 0 0 0 0 0 0 0 0.00 0.00 0.00 0.00

DGMS Annual Report,2006
77
Mineral Year
Serious Accident Death Rate per 1000
persons Belowground Opencast Aboveground Total
Acc S/Inj Acc S/Inj Acc S/Inj Acc S/Inj BG OC AG TOT
2000 0 0 0 0 0 0 0 0 0.00 0.00 0.00 0.00
2001 0 0 0 0 0 0 0 0 0.00 0.00 0.00 0.00
2002 0 0 0 0 0 0 0 0 0.00 0.00 0.00 0.00
2003 0 0 0 0 0 0 0 0 0.00 0.00 0.00 0.00
2004 0 0 0 0 0 0 0 0 0.00 0.00 0.00 0.00
2005 0 0 0 0 0 0 0 0 0.00 0.00 0.00 0.00
2006 0 0 0 0 0 0 0 0 0.00 0.00 0.00 0.00
Silica 1999 0 0 0 0 0 0 0 0 0.00 0.00 0.00 0.00
2000 0 0 0 0 0 0 0 0 0.00 0.00 0.00 0.00
2001 0 0 0 0 0 0 0 0 0.00 0.00 0.00 0.00
2002 0 0 0 0 0 0 0 0 0.00 0.00 0.00 0.00
2003 0 0 0 2 0 2 0 4 0.00 0.94 2.92 1.42
2004 0 0 0 0 0 0 0 0 0.00 0.00 0.00 0.00
2005 0 0 0 0 0 0 0 0 0.00 0.00 0.00 0.00
2006 0 0 0 0 0 0 0 0 0.00 0.00 0.00 0.00
Sillimanite 1999 0 0 0 0 2 2 2 2 0.00 0.00 1.81 1.59
2000 0 0 0 0 1 1 1 1 0.00 0.00 0.95 0.83
2001 0 0 0 0 2 2 2 2 0.00 0.00 1.46 1.21
2002 0 0 0 0 1 1 1 1 0.00 0.00 0.79 0.65
2003 0 0 0 0 1 1 1 1 0.00 0.00 0.54 0.29
2004 0 0 0 0 2 2 2 2 0.00 0.00 1.10 0.66
2005 0 0 0 0 0 0 0 0 0.00 0.00 0.00 0.00
2006 0 0 0 0 2 2 2 2 0.00 0.00 1.12 0.70
Slate 1999 0 0 0 0 0 0 0 0 0.00 0.00 0.00 0.00
2000 0 0 0 0 0 0 0 0 0.00 0.00 0.00 0.00
2001 0 0 0 0 0 0 0 0 0.00 0.00 0.00 0.00
2004 0 0 0 0 0 0 0 0 0.00 0.00 0.00 0.00
2005 0 0 0 0 0 0 0 0 0.00 0.00 0.00 0.00
2006 0 0 0 0 0 0 0 0 0.00 0.00 0.00 0.00
Steatite 1999 0 0 1 3 0 0 1 3 0.00 1.20 0.00 0.91
2000 0 0 0 0 0 0 0 0 0.00 0.00 0.00 0.00
2001 0 0 0 2 0 0 0 2 0.00 0.60 0.00 0.46
2002 0 0 0 0 0 0 0 0 0.00 0.00 0.00 0.00
2003 0 0 0 0 0 0 0 0 0.00 0.00 0.00 0.00
2004 0 0 1 1 0 0 1 1 0.00 0.31 0.00 0.25
2005 0 0 0 0 0 0 0 0 0.00 0.00 0.00 0.00
2006 0 0 0 0 0 0 0 0 0.00 0.00 0.00 0.00
Stone 1999 0 0 1 2 0 0 1 2 0.00 0.62 0.00 0.39
2000 0 0 0 1 0 0 0 1 0.00 0.24 0.00 0.16
2001 0 0 0 2 0 0 0 2 0.00 0.48 0.00 0.32
2002 0 0 1 3 0 0 1 3 0.00 0.62 0.00 0.38
2003 0 0 0 5 0 0 0 5 0.00 1.01 0.00 0.63
2004 0 0 2 5 0 0 2 5 0.00 1.98 0.00 1.26
2005 0 0 0 0 0 0 0 0 0.00 0.00 0.00 0.00
2006 0 0 0 0 0 0 0 0 0.00 0.00 0.00 0.00
Atomic 1999 4 4 0 0 5 5 9 9 N.A. N.A. N.A. N.A.
Minerals 2000 4 4 0 0 2 2 6 6 N.A. N.A. N.A. N.A.

DGMS Annual Report,2006
78
Mineral Year
Serious Accident Death Rate per 1000
persons Belowground Opencast Aboveground Total
Acc S/Inj Acc S/Inj Acc S/Inj Acc S/Inj BG OC AG TOT
2001 5 5 0 0 6 6 11 11 N.A. N.A. N.A. N.A.
2002 9 9 0 0 2 2 11 11 N.A. N.A. N.A. N.A.
2003 8 8 0 0 1 1 9 9 N.A. N.A. N.A. N.A.
2004 4 4 0 0 1 1 5 5 N.A. N.A. N.A. N.A.
2005 2 2 0 0 1 1 3 3 N.A. N.A. N.A. N.A.
2006 4 4 0 0 0 0 4 4 N.A. N.A. N.A. N.A.
Total 1999 96 102 29 39 105 110 230 251 6.20 0.50 1.42 1.37
2000 66 67 38 42 83 85 187 194 4.70 0.50 1.14 1.08
2001 59 61 37 43 103 104 199 208 6.30 0.60 1.57 1.42
2002 52 52 40 44 113 113 205 209 5.10 0.50 1.72 1.31
2003 57 57 25 36 86 92 168 185 7.40 0.40 1.43 1.18
2004 54 54 34 39 100 103 188 203 6.70 0.50 1.57 1.25
2005 27 27 22 23 59 59 108 109 3.35 0.30 0.90 0.69
2006 23 24 15 15 37 40 75 79 3.03 0.31 0.54 0.54
Note : Figures for the year 2006 are provisional. N.A. = Employment Figures not available.

DGMS Annual Report,2006
79
4.0 Approval of Equipment, Appliances, Material and
Machinery
Several equipments, appliances, materials and machineries meant for use in mines are
required to be approved by DGMS; a list of such equipments is given at Appendix: V.
Table below shows particulars of items approved during the year 2006.
Equipment, appliances, materials and machinery approved during the year 2006
Sl. No.
Equipment/appliances/materials/ machinery No. of approvals granted/renewed/ extended during the year
1. Self Rescuer 2
2. Methanometer 1
3. Helmet 6
4. Cap Lamp 6
5. Footwear 23
6. Gas Detector/Monitor 6
7. Cap Lamp Bulb 3
8. Dust Respirator 2
9. Breathing Apparatus 1
10. Fire-resistant plastic sheeting 0
11. Fire-resistant brattice cloth 0
12. Ventilation ducting 1
13. Personal dust sampler 1
14. Co detector tubes/aspirator 0
15. Environmental monitoring system 2
16. Hydraulic props 0
17. Powered support & its components 10
18. Friction props 2
19. Linc bar 1
20. STDA Legs 4
21. Explosives 25
22. Exploders 2
23. Detonators 12
24. Flame proof equipment - motor, switches, circuit breakers etc
55
25. Intrinsically safe apparatus 16
26. Equipment for use in hazardous area 34
27. Cables 18
28. Cage suspension gears 24
29. Fire resistant conveyor belting 9
30. Automatic contrivance 4
31. Man riding system 9
32. Fire resistant hydraulic fluid 12
33. High pressure hose 7
34. Accreditation of Test House 4
35. Power brake and emergency stop valve 3
36. Chair lift system 2
37. Head rope attachment 0
38. Tail rope attachment 2
39. Winding Rope 0
40. Automatic recording speed indicator 1
TOTAL 310

DGMS Annual Report,2006
80
5.0 Coal & Metalliferous Mining Examinations during 2006
(i) Board of Mining Examinations under the CMR, 1957
Shri B.Bhattacharjee Chairman, Board of Mining Examination, (upto 27.10.2006)
Shri MM Sharma Chairman, Board of Mining Examination (from 28.10.2006)
Shri Sashi Kumar CMD, CIL (Retd.)
Shri V.K.Singh CMD, NCL
Shri M.K.Thapar CMD,SECL (Retd.)
Shri P. Vasudeva Rao Director(Tech), SCC Ltd.
Prof. A. Bhattacharjee Department of Mining Engineering, IIT, Kharagpur
(ii) Board of Mining Examinations under the MMR, 1961
Shri B.Bhattacharjee Chairman, Board of Mining Examination, (upto 27.10.2006)
Shri MM Sharma Chairman, Board of Mining Examination (from 28.10.2006)
Shri R.Gupta CMD,UCIL,
Prof.S.B.Srivastava Department of Mining Engineering, ISM, Dhanbad
Shri P.M.Reddy CMD., MOI Ltd. (Retd.)
Shri B.Ramesh Kumar CMD,NMDC
Shri K.S.Chowdary Ex.Director, H.Z.Ltd.,
Examiners for Certificates of Competency.
Coal Mining Examinations
(a) Following were the Examiners for Manager’s Certificates of Competency Examinations held in 2006
Subject Ist. Class Manager’s Certificate
IInd Class Manager’s Certificate
Mine Management, Legislation & General Safety
Shri SJ Sibal Shri JP Kashyap
Winning & Working Shri J.V.Duttatreyulu Shri CH Diwakar
Mine Ventilation Shri SN Katiyar Shri JS Prasad
Mining Machinery Shri AK Pal Shri N. Das
Mine Surveying Shri Anup Biswas Shri SP Singh
(b) Following were the Examiners for Surveyor’s Certificates of Competency Examination held in 2006.
Surveying Paper-I Shri BP Ahuja
Surveying Paper-II Shri SP Chand
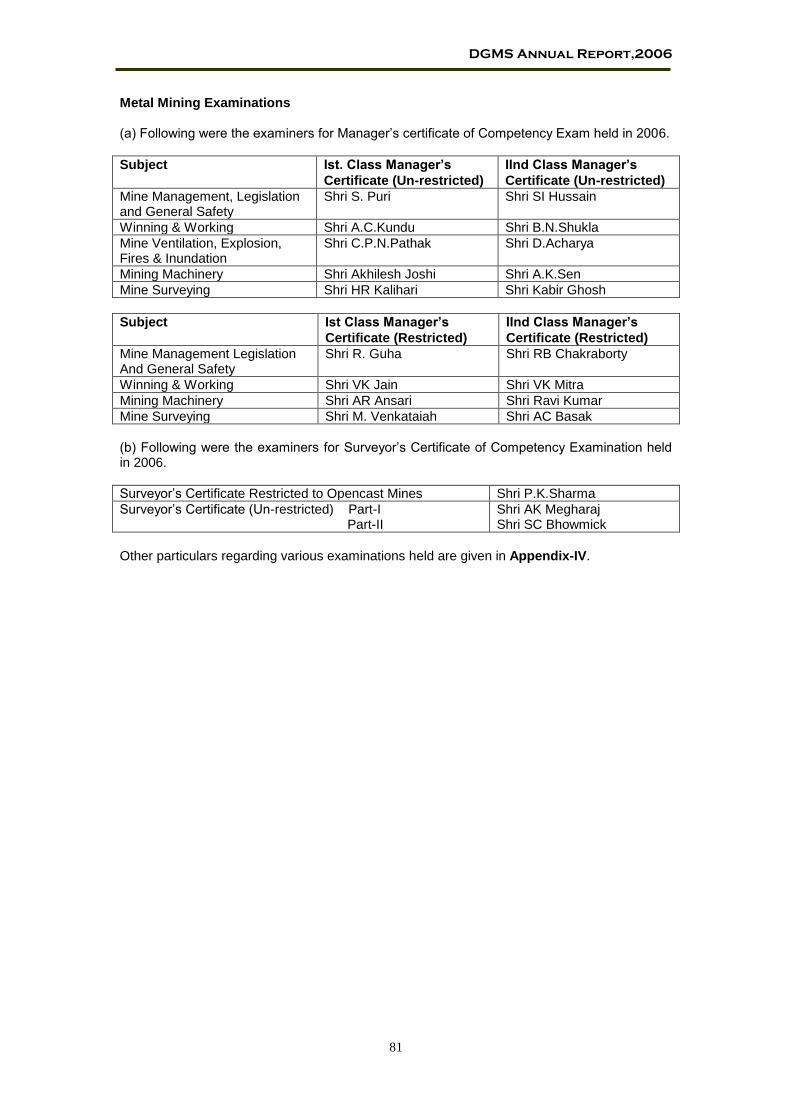
DGMS Annual Report,2006
81
Metal Mining Examinations
(a) Following were the examiners for Manager’s certificate of Competency Exam held in 2006.
Subject Ist. Class Manager’s
Certificate (Un-restricted)
IInd Class Manager’s
Certificate (Un-restricted)
Mine Management, Legislation and General Safety
Shri S. Puri Shri SI Hussain
Winning & Working Shri A.C.Kundu Shri B.N.Shukla
Mine Ventilation, Explosion, Fires & Inundation
Shri C.P.N.Pathak Shri D.Acharya
Mining Machinery Shri Akhilesh Joshi Shri A.K.Sen
Mine Surveying Shri HR Kalihari Shri Kabir Ghosh
Subject Ist Class Manager’s
Certificate (Restricted)
IInd Class Manager’s
Certificate (Restricted)
Mine Management Legislation And General Safety
Shri R. Guha Shri RB Chakraborty
Winning & Working Shri VK Jain Shri VK Mitra
Mining Machinery Shri AR Ansari Shri Ravi Kumar
Mine Surveying Shri M. Venkataiah Shri AC Basak
(b) Following were the examiners for Surveyor’s Certificate of Competency Examination held in 2006.
Surveyor’s Certificate Restricted to Opencast Mines Shri P.K.Sharma
Surveyor’s Certificate (Un-restricted) Part-I Part-II
Shri AK Megharaj Shri SC Bhowmick
Other particulars regarding various examinations held are given in Appendix-IV.

DGMS Annual Report,2006
82
6.0 National Safety Awards (Mines)
6.1 Introduction
During the post-independence era, the mineral industry in India has achieved tremendous
growth and also imbibed the latest mining technologies. Along with this growth, there has been
corresponding awareness of the need to protect the health and lives of workers. The
Constitution of India casts an obligation on all of us to ensure just and humane conditions of
work. To give due recognition to outstanding safety performance at the national level, the
Ministry of Labour, Government of India, instituted the National Safety Awards (Mines) in 1983
for the contest year 1982.
6.2 Scope
The scheme is applicable to all mines, which come under the purview of the Mines Act, 1952.
Such mines have been classified into 7 groups as given below:
i. Coal mines - Below ground with difficult mining conditions
ii. Coal mines - Belowground (others)
iii. Coal mines - Opencast
iv. Metal mines - Mechanized opencast
v. Metal mines - Manual opencast
vi. Metal mines - Belowground
vii. Oil mines
6.3 Schemes
Among different indices available, the following two have been accepted as indicator of safety
performance:
1. Longest accident free period (LAFP) in terms of manshifts worked during three
consecutive years ending with the contest year.
2. Lowest injury frequency rate (LIFR) during three consecutive years ending with the
contest year.
It is expected that every mine shall endeavour to improve its safety performance. A bad mine
has a high injury frequency rate. After obtaining a breakthrough, its next attempt should be to
achieve longest accident-free period in terms of manshifts worked.
6.4 Awards Committee
The awards committee is constituted by the Ministry of Labour & Employment with Director-
General of Mines Safety as its Chairman, eight representatives of mine managements, eight
representatives of trade unions and an officer of DGMS as its Member-Secretary.

DGMS Annual Report,2006
83
6.5 Mode of operation
An advertisement is released through DAVP in English, Hindi and other regional languages
inviting applications in prescribed proforma for National Safety Awards (Mines). An entry fee of
Rs.100/- per application is charged through a crossed IPO drawn in favour of the
Administrative Officer/DDO, DGMS and payable at Dhanbad Post Office. The prescribed
application form is jointly signed by the mine management and a workers’ representative.
7.0 Conference on Safety in Mines
The Conference on Safety in Mines is a tripartite forum at the national level in which the
employers’ representatives, the trade unions’ representatives, the Government represented by
Ministry of Labour & Employment, DGMS, various administrative ministries/departments and
State Governments and associated institutions, professional bodies, service associations, etc.
take part. They review status of the safety in mining industry and the adequacy of existing
measures in a spirit of mutual cooperation. The conference also suggests measures for further
improvement in safety, welfare and health of mine workers. The first such Conference was held
in the year 1958 followed by the 2nd in July, 1966, the 3rd in 1973, the 4th in 1978, the 5th in 1980,
the 6th in 1986, the 7th in 1988, the 8th in 1993 and the 9th Conference was held on 2nd & 3rd
February, 2000 in New Delhi.

DGMS Annual Report,2006
84
8.0 Plan Schemes
DGMS is implementing four Plan Schemes to provide in-house technical support, namely:
(i) Study of Mine Accidents and Development of Mines Safety
Information System (SOMA)
The scheme has been formulated by merging two on-going plan schemes of DGMS, namely
“Development of Mine Safety Information System (DMSIS,1976)” and “Study of Mine
Accidents to Plan Preventive Measures (SOMA, 1976)”. In 2001-2002, i.e. the terminal year of
the 9th plan, keeping the objective of integration in view, these schemes were merged into one
scheme “Study of Mine Accidents and Development of Mines Safety Information System
(SOMA)”.
(A) Accident Prone Mines:
A modified approach for identification of accident-prone mines was adopted; data from all the
mines of eleven coal companies were collected. In-depth analysis of all fatal and serious
accidents that occurred in all 517 coal mines and 9 lignite mines of the country during the
periods 2002- 2006 were made and based on the outcome of the study, the accident-prone
mines were identified. This was done with a view to identify hazard potential of such mines and
draw up action programmes for formulation of mitigating measures through collective efforts of
Mine Management, Trade Unions and the Government.
The following table shows the number of accident-prone mines identified in different coal
companies in last five years.
Name of company Number of mines identified as accident prone
2002 2003 2004 2005 2006
ECL 11 12 11 9 8
BCCL 6 7 10 8 6
SECL 7 8 10 8 6
MCL 2 2 4 3 1
WCL 7 9 9 9 8
CCL 6 5 6 7 4
NCL 1 2 2 1 1
NECL 0 0 1 0 0
SCCL 5 8 9 10 5
TISCO 1 1 2 2 1
IISCO 0 0 0 0 1
Total 46 54 64 57 41
LIGNITE 3 3 3 - 1
The respective companies were advised to take suitable steps from technical and
management point of view to identify the potential risk of the respective mines and to device
suitable corrective measures and implement the same in a time bound period so that the
accidents are reduced.
Reports of enquiry into all fatal accidents were scrutinized. Finalized causes and circumstances
leading to these accidents were compiled for inclusion in DGMS Annual Report.

DGMS Annual Report,2006
85
(B) In the year 2006, work of collection, compilation and analysis on a PC platform in respect of
accident due to roof fall, side fall, wheeled trackless transportation machinery and haulage in
coal mine was conducted in order to identify critical causation factors of such types of accidents
and to find out probable corrective measures for their prevention.
Progress:
Scrutiny of enquiry reports and extraction of data for entry into EDP – 196
Visit to mines in connection with safety campaigns.
Compilation and publication of Annual Report, 2005.
Compilation and publication of Standard Note on DGMS as on 1.1.2006
Identification of accident-prone mines in respect of coal mines.
Information bulletin and technical circular issued.
Compilation of statistics and preparation of manuscript for –
o Statistics of Mines in India, Vol.I (Coal), 2005
o Statistics of Mines in India, Vol.II(Non-Coal), 2005
o Monthly Review of Accidents
Processing of applications and preparing a list of winner for National Safety Awards (Mines)

DGMS Annual Report,2006
86
(ii) Augmentation of S&T Capabilities, Mines Rescue Services and Human
Resource Development (S&T)
Origin: This scheme has been formulated by merging the objectives of ongoing schemes
namely “Augmentation of Science & Technological support capabilities in DGMS (S&T)(1981)”,
“Development of Mines Rescue Services (DMRS)(1981)” and “Human Resource Development
for improving health and safety standards in mines (HRD)(1990)”
Scientific and Technological Support (S&T)
This scheme aims at providing in-house scientific support to the officers of DGMS in
discharge of their enforcemental, regulatory and promotional role. It also provides scientific
support to mine operators, workers organization and other institutions concerned with
occupational health and safety matters. The activities of the S&T plan scheme covers a wide
cross-section of facets of occupational safety and health including occupational
hygiene/health, strata control, mine ventilation, mine gases, fires and explosion, mining
techniques, mine mechanization, oil and opencast mines safety, standard setting and policy
planning.
The support activities are broadly divided into three categories:
(i) Planned support: This plan support is provided to field offices on:
A current issue which has emerged into an enforcemental problem;
An enforcemental strategy calling for development of monitoring equipments or
techniques; and
Monitoring of quality assurance of external organization in sampling, pre-approval
testing and other similar activities.
These activities are selected on merit, including improvement of efficiency and safety
and future needs.
(ii) Reactive Support: Reactive Support is provided in response to demands from field
offices in areas where:
In-house assessment and analysis of a problem leads to better understanding of
enforcemental problem and helps in determining enforcemental strategy;
Support is required on a technical problem without referring to external agency.
(iii) Testing Services: This service is provided to the field offices as a sample check on
quality control standards and in emergency response situation.
Major Programmes: The major programmes of the S&T plan scheme includes

DGMS Annual Report,2006
87
(1) Occupational Safety:
(a) Monitoring of implementation of the Technical Standards on Support system in
Bord and Pillar workings.
(b) Review of standards on stability of multi-seam workings.
(c) Review of standards on detection, control, dealing with and protective measures
against fire and revision of standards/guidelines.
(d) Assessment of hazards associated with mine mechanization and standardization
of monitoring techniques and control measures.
(i) Standardization of prototype test(s) houses for testing powered
supports and hydraulic/friction props.
(ii) Standardization of Ultrasonic Testing Techniques and formulation of
Acceptance & Rejection Norms.
(iii) Testing of fire resistant hydraulic oils.
(2) Occupational Hygiene and Health
(a) Standardization of techniques for monitoring and control of occupational
hazards from noise, air borne dust, mine gases and poor illumination.
(b) Review of standards for medical examinations.
(c) Review and standardization of procedures for surveillance of occupational
disease already established.
(B) Development of Mines Rescue Services: This plan scheme aims at promoting proper rescue services in mining industry. The scheme
envisages critical appraisal of design characteristics of rescue apparatus and self rescuers,
evaluation of field performance of the same, inquiry into accidents in use of rescue apparatus,
inspection of rescue stations/rescue rooms organizing rescue competitions, monitoring
formulation of emergency plan by the management of all underground mines and to deal with
applications for grant of permissions/approval/relaxation under the Mines Rescue Rules,
1985.
Major Programme:
Installation of testing facility for SCSR & Resuscitator
Creation of Rescue Data bases (i) CMR/OMR/MMR/ dBase (ii) RRAE databases
Design of rescue systems (i) Inundation RRS (ii) Fire RRS (iii) Explosion RRS
Development of disaster control systems
Testing of SCSR
Conduct of Rescue Competition
Standard setting, review of emergency plans
Issue of Technical circular’s to the mining industry
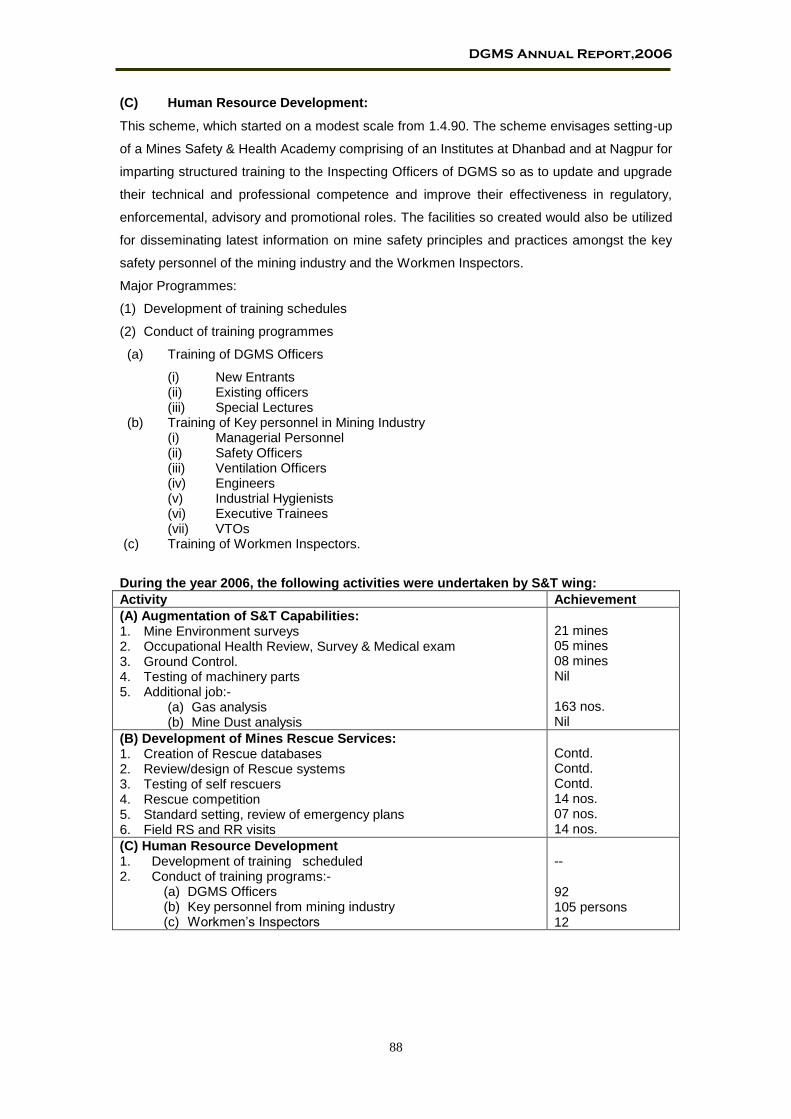
DGMS Annual Report,2006
88
(C) Human Resource Development:
This scheme, which started on a modest scale from 1.4.90. The scheme envisages setting-up
of a Mines Safety & Health Academy comprising of an Institutes at Dhanbad and at Nagpur for
imparting structured training to the Inspecting Officers of DGMS so as to update and upgrade
their technical and professional competence and improve their effectiveness in regulatory,
enforcemental, advisory and promotional roles. The facilities so created would also be utilized
for disseminating latest information on mine safety principles and practices amongst the key
safety personnel of the mining industry and the Workmen Inspectors.
Major Programmes:
(1) Development of training schedules
(2) Conduct of training programmes
(a) Training of DGMS Officers
(i) New Entrants (ii) Existing officers (iii) Special Lectures
(b) Training of Key personnel in Mining Industry (i) Managerial Personnel (ii) Safety Officers (iii) Ventilation Officers (iv) Engineers (v) Industrial Hygienists (vi) Executive Trainees (vii) VTOs
(c) Training of Workmen Inspectors.
During the year 2006, the following activities were undertaken by S&T wing:
Activity Achievement
(A) Augmentation of S&T Capabilities: 1. Mine Environment surveys 2. Occupational Health Review, Survey & Medical exam 3. Ground Control. 4. Testing of machinery parts 5. Additional job:-
(a) Gas analysis (b) Mine Dust analysis
21 mines 05 mines 08 mines Nil 163 nos. Nil
(B) Development of Mines Rescue Services: 1. Creation of Rescue databases 2. Review/design of Rescue systems 3. Testing of self rescuers 4. Rescue competition 5. Standard setting, review of emergency plans 6. Field RS and RR visits
Contd. Contd. Contd. 14 nos. 07 nos. 14 nos.
(C) Human Resource Development 1. Development of training scheduled 2. Conduct of training programs:-
(a) DGMS Officers (b) Key personnel from mining industry (c) Workmen’s Inspectors
--
92 105 persons 12
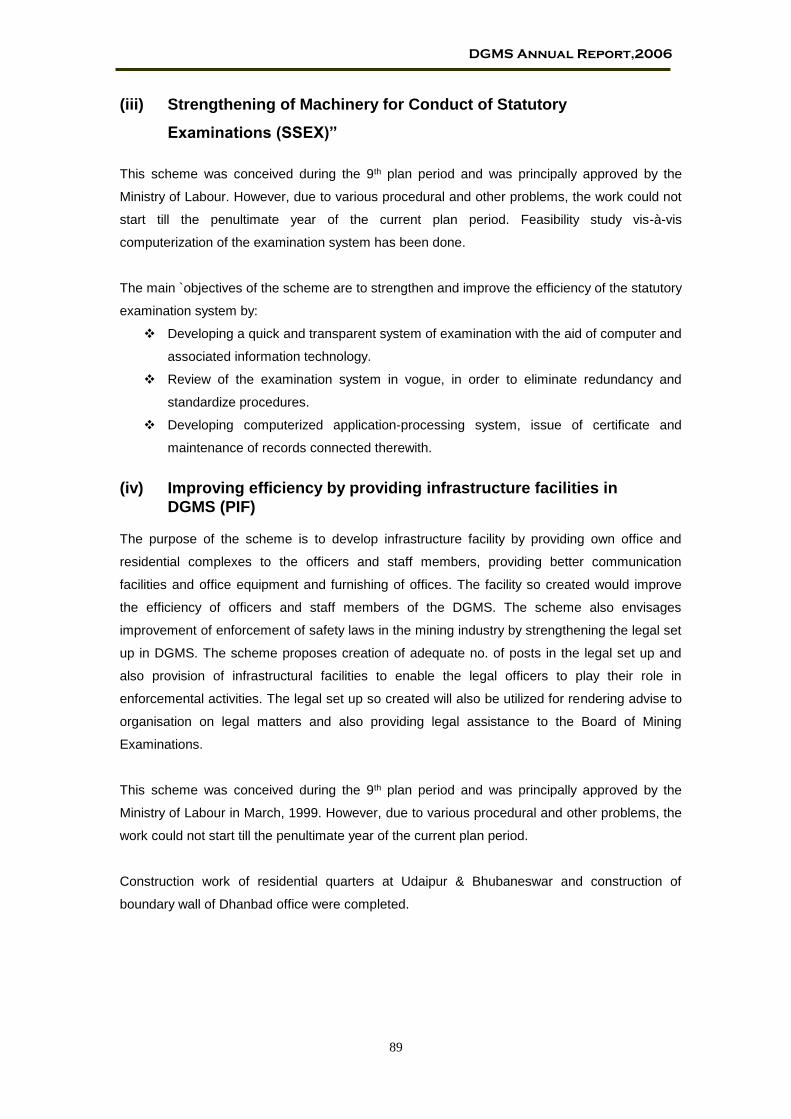
DGMS Annual Report,2006
89
(iii) Strengthening of Machinery for Conduct of Statutory
Examinations (SSEX)”
This scheme was conceived during the 9th plan period and was principally approved by the
Ministry of Labour. However, due to various procedural and other problems, the work could not
start till the penultimate year of the current plan period. Feasibility study vis-à-vis
computerization of the examination system has been done.
The main `objectives of the scheme are to strengthen and improve the efficiency of the statutory
examination system by:
Developing a quick and transparent system of examination with the aid of computer and
associated information technology.
Review of the examination system in vogue, in order to eliminate redundancy and
standardize procedures.
Developing computerized application-processing system, issue of certificate and
maintenance of records connected therewith.
(iv) Improving efficiency by providing infrastructure facilities in
DGMS (PIF) The purpose of the scheme is to develop infrastructure facility by providing own office and
residential complexes to the officers and staff members, providing better communication
facilities and office equipment and furnishing of offices. The facility so created would improve
the efficiency of officers and staff members of the DGMS. The scheme also envisages
improvement of enforcement of safety laws in the mining industry by strengthening the legal set
up in DGMS. The scheme proposes creation of adequate no. of posts in the legal set up and
also provision of infrastructural facilities to enable the legal officers to play their role in
enforcemental activities. The legal set up so created will also be utilized for rendering advise to
organisation on legal matters and also providing legal assistance to the Board of Mining
Examinations.
This scheme was conceived during the 9th plan period and was principally approved by the
Ministry of Labour in March, 1999. However, due to various procedural and other problems, the
work could not start till the penultimate year of the current plan period.
Construction work of residential quarters at Udaipur & Bhubaneswar and construction of
boundary wall of Dhanbad office were completed.

DGMS Annual Report,2006
90
(v) Modernization of Information Database Relating to Mine
Management (MID) (Merged)
The purpose of the scheme is to reach beyond current efforts to reinvent DGMS by identifying
breakthrough strategies that rethink the core value of key services, improve service delivery,
reduce cost and redefine administrative processes. The application of e-Governance to the
processes of functioning of DGMS will bring about simple, moral, accountable, responsive and
transparent governance. It will help the organization in managing its operations at various
phases of governance making the entire process user friendly.
The objective of the scheme would be:
(i) Identification of need for mine safety information system and to identify the
boundaries of an e-governance system;
(ii) develop a core group within the organization to formulate and use computer
based ‘MIS’ vis-à-vis mines safety;
(iii) develop modules of need-based software with the help of experts;
(iv) create infrastructure to implement computer based systems including
establishment of LAN/WAN, establish electronic communication channels;
(v) establish a comprehensive protocol for use of such system;
(vi) establishment and operation of modern survey system and electronic storage
of mine plans; and
(vii) establish a comprehensive training system for officers of DGMS in use of
such new systems.
<><><><><><>