Embed Size (px)
Citation preview
70 Measurement of Dust Control Efficiency of Wind Screens by Using 3-D Scanning Lidar
Measurement of Dust Control Efficiency of Wind Screens by
Using 3-D Scanning Lidar
CHIH-WEI CHIANG*, JIANN-SHEN LEE**, HONG-WEI HIANG*, HUANN-MING CHOU*, SHU-HUANG SUN* and LIANG-SHIUAN SU***
*Department of Mechanical Engineering, Kun Shan University **New Materials Research & Development Department, China Steel Corporation
***EI-LIDAR Corporation Limited
Wind erosion frequently occurs in the open storage yards of steel-making and power generation companies, which leads to a loss of raw materials and a cause of air-pollution, as well as environmental and health prob-lems. In order to solve these issues, wind screens are a popular option to reduce wind-blown particle emis-sions in to the environment. However, only a few empirical and numerical simulations are available to assess their effectiveness in reducing particle emissions. In this study a scanning Lidar (Light Detection and Ranging) was used to validate the effectiveness of wind screens for abating wind erosion of dust in the open storage yards of the steel-making company. In addition, the information on the sources of wind-blown particle are quickly integrated by cloud computing techniques combined with the Lidar system and GIS (Geographic Information System) to strengthen the capabilities of the environmental monitoring and prevent the deterio-ration of air quality.
Keywords: Lidar, Wind screens, Dust control
1. INTRODUCTION
The wind-blown dust emissions from the open storage yards of steel-making companies and the sub-sequent dust dispersion have brought not only a loss of raw materials but also many environmental and health problems(1-3). A considerable number of studies have been devoted to the processes of wind erosion which depends strongly on the local wind flow characteris-tics(4,5) and to assess the shelter effect of wind screen for reducing the pressure fluctuations and shear stress(6-8) by using empirical and numerical simulations. However, no reference is made to validate the in-situ effects of wind screens for reducing wind erosion of particles in an open storage yard.
The main objective of this study is to validate the effectiveness of wind screens for abating wind erosion of dust and lead to eventual measures to control the fugitive dust emissions in the open storage yards of the steel-making company by the indigenous developed 3-D scanning Lidar (Light Detection And Ranging) system(9-11).
The paper is organized as follows. In section 2, the lidar system and auxiliary equipment are described. Section 3 presents the data analysis techniques and definition. In section 4, the results and discussion are
given. Finally, section 5 provides a brief summary.
2. SYSTEM DESCRIPTION
2.1 Lidar system description and capabilities
Optical remote sensing instruments like the Lidar, which is based on the principle of laser spectroscopy has been proven to have a great potential to probe the earth’s atmosphere due to their sensitivity, selectivity and range resolved data of meteorological variables and atmospheric constituents(12-14).
The indigenous developed 3-D scanning Lidars were installed on the roof of W1 offices (N:22° 32' 37.9'' ; E:120° 20' 43.5'') as well as the south tower (N: 22° 31'49. 22"; E: 120° 21'12. 19") of China Steel (CSC) at around 20 m above the ground (shown as Fig.1) to validate the effectiveness of wind screens for abating wind erosion of dust.
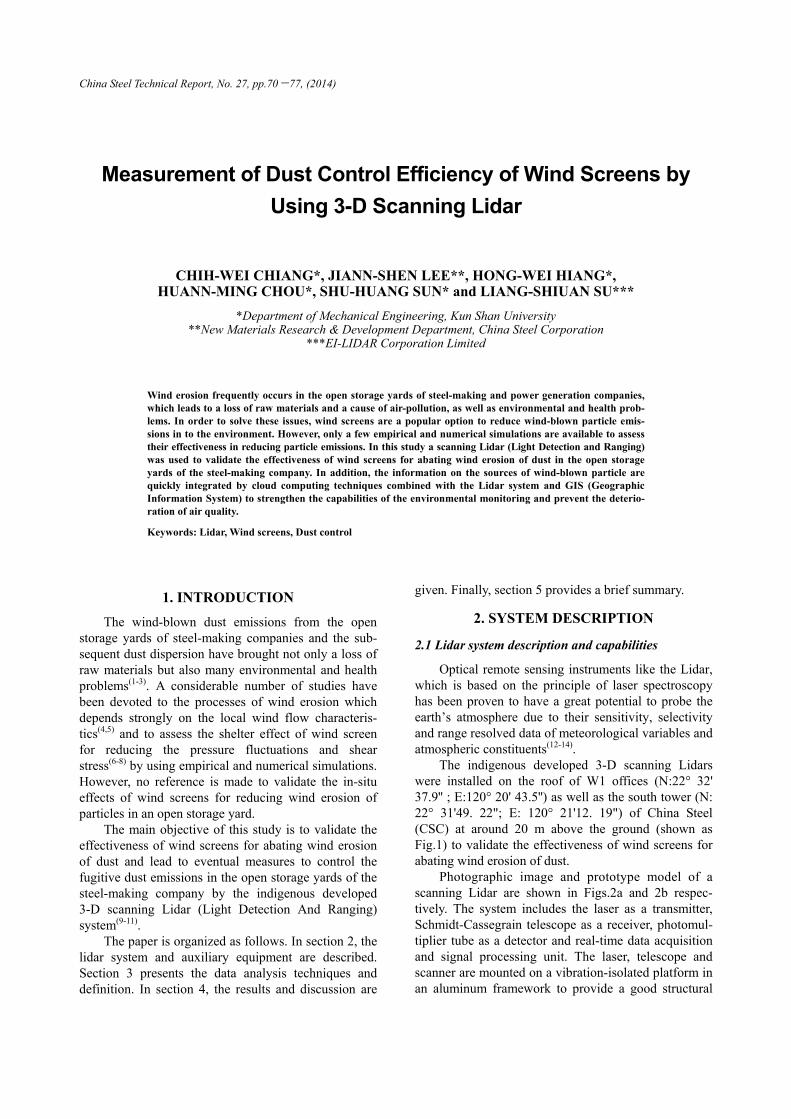
Photographic image and prototype model of a scanning Lidar are shown in Figs.2a and 2b respec-tively. The system includes the laser as a transmitter, Schmidt-Cassegrain telescope as a receiver, photomul-tiplier tube as a detector and real-time data acquisition and signal processing unit. The laser, telescope and scanner are mounted on a vibration-isolated platform in an aluminum framework to provide a good structural
China Steel Technical Report, No. 27, pp.70-77, (2014)
71 Chih-Wei Chiang, Jiann-Shen Lee, Hong-Wei Hiang, Huann-Ming Chou, Shu-Huang Sun and Liang-Shiuan Su
Fig.1. Panoramic photography of the open storage yards and lidar workstations installation.
Fig.2. (a) Photographic image, (b) Prototype model of 3-D scanning lidar. In Fig.(b), inserted box shows the detector section of the system.
stability. Technical specifications of the lidar system are given in Table 1. A Nd:YAG (Neodymium:Yttrium- Aluminum-Garnet) pulsed solid state laser is used as a laser source. The laser pulse width is to10 ns and repe-tition rate is 20 Hz. The laser operation is based on the second harmonic frequency generation at 532 nm. The divergence of the laser beam is about 0.5 m/rad. The laser is mounted on an optical bench having the facility
of height adjustment. The mirrors have the provision of precise adjustment of azimuth and tilting of the laser beam. In case of breakdown of the laser transmitter, a safety interlock is provided to shut down the laser unit.
At the rear end of the telescope there is a collimating lens (Fig.2b), which focuses the entire Field Of View (FOV) of the telescope on to the Photomultiplier Tube head (PMT, which is used as a detector). The back-ground noise level is suppressed by using the narrow band interference filter. Behind the collimating lens, a rotating interference filter wheel (Fig.2b) is used. The rotating wheel has 6 filters, which enables the different wavelength selection. The signals from the PMT are fed directly on to a multi-channel transient recorder combines A/D converter (12 Bit at 20 MHz) with 250 MHz fast photon counting system in the acquisition, which allows a high dynamic range signal.
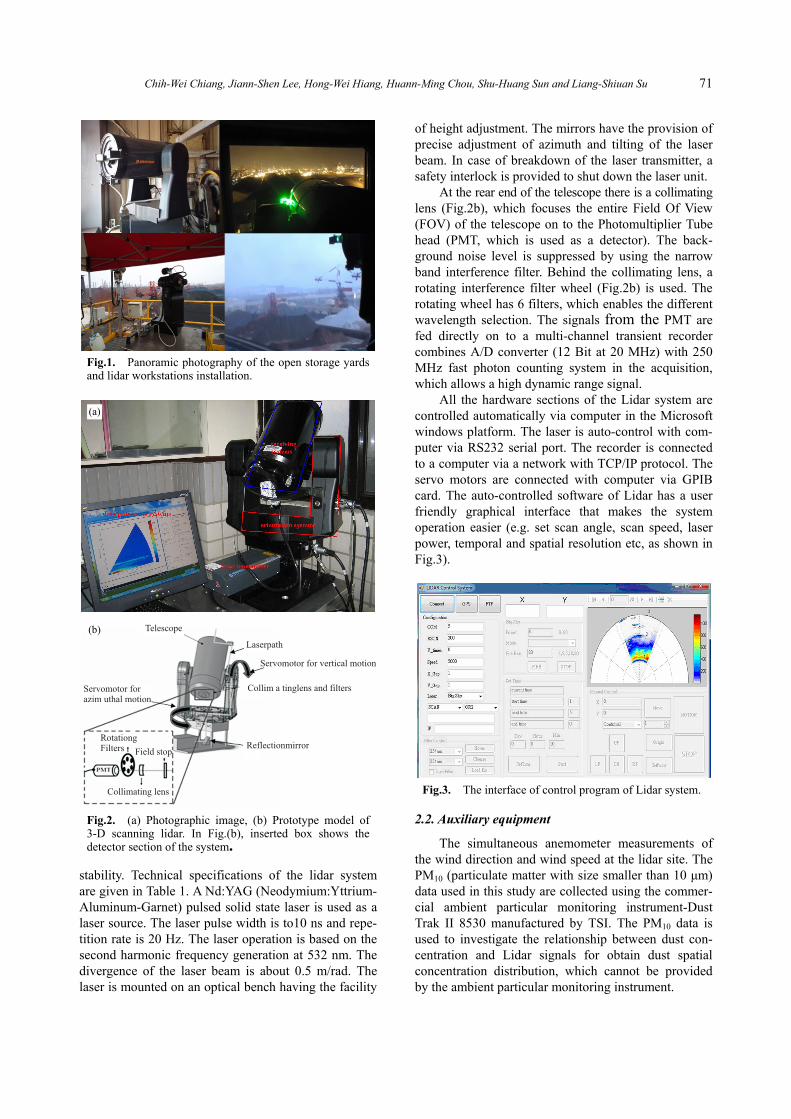
All the hardware sections of the Lidar system are controlled automatically via computer in the Microsoft windows platform. The laser is auto-control with com-puter via RS232 serial port. The recorder is connected to a computer via a network with TCP/IP protocol. The servo motors are connected with computer via GPIB card. The auto-controlled software of Lidar has a user friendly graphical interface that makes the system operation easier (e.g. set scan angle, scan speed, laser power, temporal and spatial resolution etc, as shown in Fig.3).
Fig.3. The interface of control program of Lidar system.
2.2. Auxiliary equipment
The simultaneous anemometer measurements of the wind direction and wind speed at the lidar site. The PM10 (particulate matter with size smaller than 10 μm) data used in this study are collected using the commer-cial ambient particular monitoring instrument-Dust Trak II 8530 manufactured by TSI. The PM10 data is used to investigate the relationship between dust con-centration and Lidar signals for obtain dust spatial concentration distribution, which cannot be provided by the ambient particular monitoring instrument.
(a)
(b)
72 Measurement of Dust Control Efficiency of Wind Screens by Using 3-D Scanning Lidar
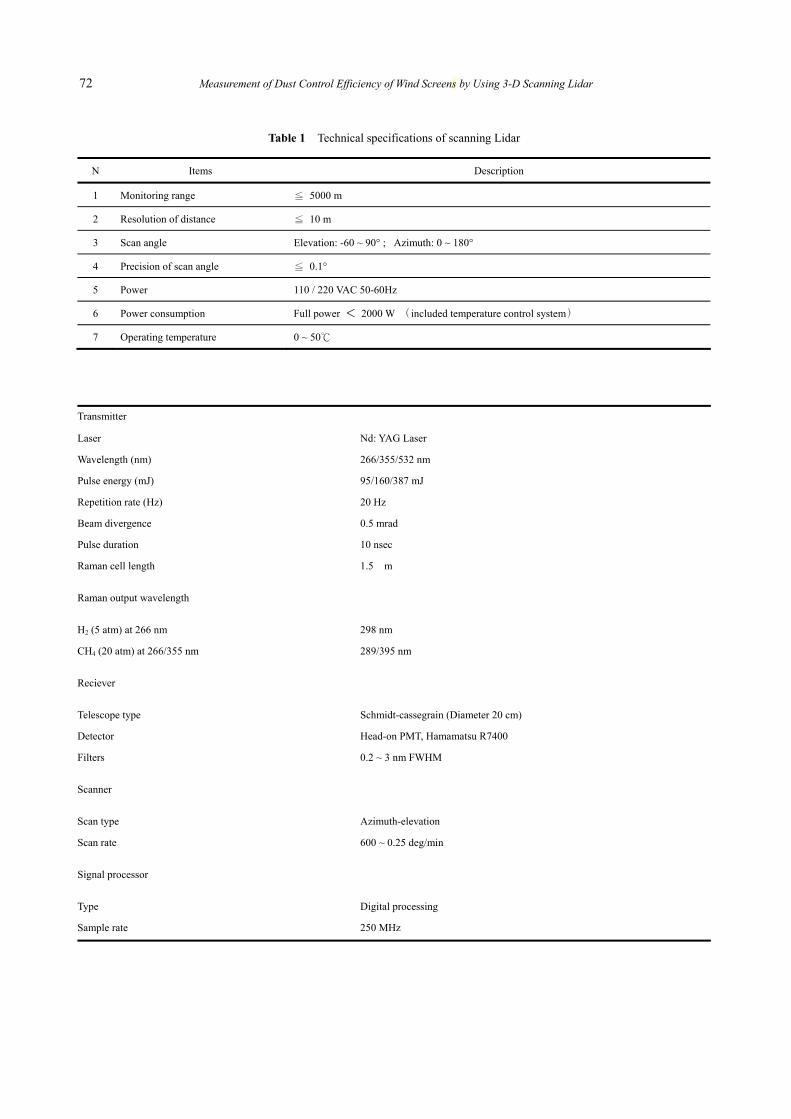
Table 1 Technical specifications of scanning Lidar
N Items Description
1 Monitoring range ≦ 5000 m
2 Resolution of distance ≦ 10 m
3 Scan angle Elevation: -60 ~ 90° ; Azimuth: 0 ~ 180°
4 Precision of scan angle ≦ 0.1°
5 Power 110 / 220 VAC 50-60Hz
6 Power consumption Full power < 2000 W (included temperature control system)
7 Operating temperature 0 ~ 50℃
Transmitter
Laser Nd: YAG Laser
Wavelength (nm) 266/355/532 nm
Pulse energy (mJ) 95/160/387 mJ
Repetition rate (Hz) 20 Hz
Beam divergence 0.5 mrad
Pulse duration 10 nsec
Raman cell length 1.5 m
Raman output wavelength
H2 (5 atm) at 266 nm 298 nm
CH4 (20 atm) at 266/355 nm 289/395 nm
Reciever
Telescope type Schmidt-cassegrain (Diameter 20 cm)
Detector Head-on PMT, Hamamatsu R7400
Filters 0.2 ~ 3 nm FWHM
Scanner
Scan type Azimuth-elevation
Scan rate 600 ~ 0.25 deg/min
Signal processor
Type Digital processing
Sample rate 250 MHz
73 Chih-Wei Chiang, Jiann-Shen Lee, Hong-Wei Hiang, Huann-Ming Chou, Shu-Huang Sun and Liang-Shiuan Su
In this study, the useful database of wind and PM10 are linearly interpolated in range to make it consistent with the range of Lidar data.
3. DATA ANALYSIS
3.1 Lidar data
The optical power measured with a Lidar is pro-portional to the signal by the backscattered atmospheric particles and molecules. The detected Lidar signal can be expressed as Eq.1.
dz)z(atm
TLM e*)Z(*
Z
A*)z(O*P)Z(P 0
22
························································· (1)
Where, PM and PL are the power received from distance z and laser output energy, respectively; O(z) is the overlap function; AT is a constant which accounts for system optical efficiency, the telescope receiver area, and the PMT spectral efficiency; βatm(z) and α(z) are the backscatter and extinction coefficient of atmos-phere respectively. The integral is to be taken in between heights 0 and z to derive the atmospheric transmission. The backscattering and extinction coeffi-cients, βatm(z) andα(z) are contributed both from aero-sols and air molecules.
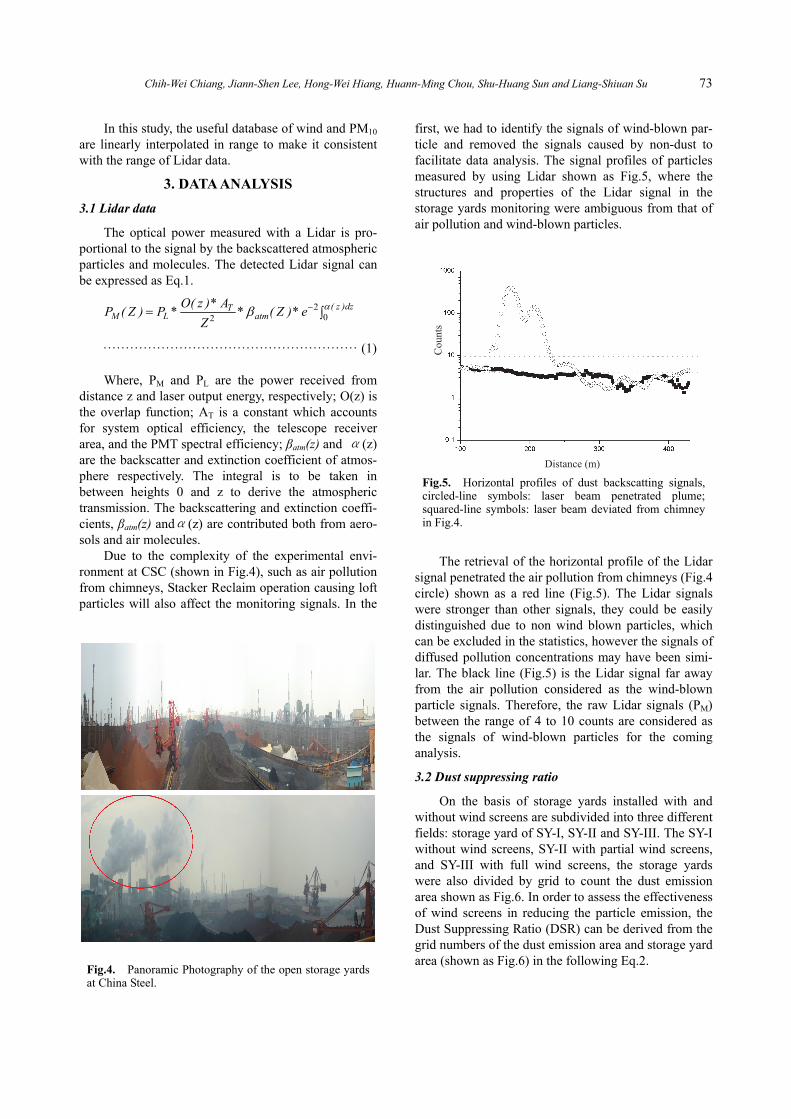
Due to the complexity of the experimental envi-ronment at CSC (shown in Fig.4), such as air pollution from chimneys, Stacker Reclaim operation causing loft particles will also affect the monitoring signals. In the
Fig.4. Panoramic Photography of the open storage yards at China Steel.
first, we had to identify the signals of wind-blown par-ticle and removed the signals caused by non-dust to facilitate data analysis. The signal profiles of particles measured by using Lidar shown as Fig.5, where the structures and properties of the Lidar signal in the storage yards monitoring were ambiguous from that of air pollution and wind-blown particles.
Fig.5. Horizontal profiles of dust backscatting signals, circled-line symbols: laser beam penetrated plume; squared-line symbols: laser beam deviated from chimney in Fig.4.
The retrieval of the horizontal profile of the Lidar signal penetrated the air pollution from chimneys (Fig.4 circle) shown as a red line (Fig.5). The Lidar signals were stronger than other signals, they could be easily distinguished due to non wind blown particles, which can be excluded in the statistics, however the signals of diffused pollution concentrations may have been simi-lar. The black line (Fig.5) is the Lidar signal far away from the air pollution considered as the wind-blown particle signals. Therefore, the raw Lidar signals (PM) between the range of 4 to 10 counts are considered as the signals of wind-blown particles for the coming analysis.
3.2 Dust suppressing ratio
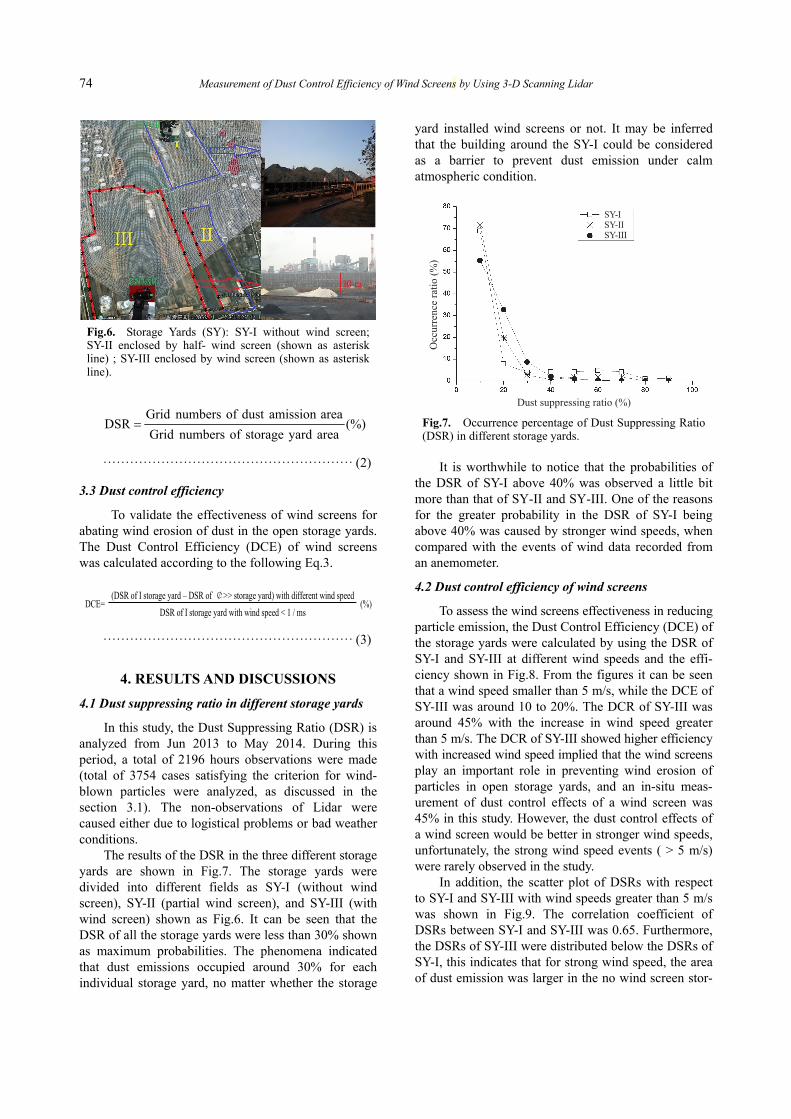
On the basis of storage yards installed with and without wind screens are subdivided into three different fields: storage yard of SY-I, SY-II and SY-III. The SY-I without wind screens, SY-II with partial wind screens, and SY-III with full wind screens, the storage yards were also divided by grid to count the dust emission area shown as Fig.6. In order to assess the effectiveness of wind screens in reducing the particle emission, the Dust Suppressing Ratio (DSR) can be derived from the grid numbers of the dust emission area and storage yard area (shown as Fig.6) in the following Eq.2.
74 Measurement of Dust Control Efficiency of Wind Screens by Using 3-D Scanning Lidar
Fig.6. Storage Yards (SY): SY-I without wind screen; SY-II enclosed by half- wind screen (shown as asterisk line) ; SY-III enclosed by wind screen (shown as asterisk line).
(%)areayardstorageofnumbersGrid
areaamissiondustofnumbersGridDSR
························································ (2)
3.3 Dust control efficiency
To validate the effectiveness of wind screens for abating wind erosion of dust in the open storage yards. The Dust Control Efficiency (DCE) of wind screens was calculated according to the following Eq.3.
(DSR of I storage yard – DSR of ¢>> storage yard) with different wind speed
DCE= DSR of I storage yard with wind speed < 1 / ms
(%)
························································ (3)
4. RESULTS AND DISCUSSIONS
4.1 Dust suppressing ratio in different storage yards
In this study, the Dust Suppressing Ratio (DSR) is analyzed from Jun 2013 to May 2014. During this period, a total of 2196 hours observations were made (total of 3754 cases satisfying the criterion for wind- blown particles were analyzed, as discussed in the section 3.1). The non-observations of Lidar were caused either due to logistical problems or bad weather conditions.
The results of the DSR in the three different storage yards are shown in Fig.7. The storage yards were divided into different fields as SY-I (without wind screen), SY-II (partial wind screen), and SY-III (with wind screen) shown as Fig.6. It can be seen that the DSR of all the storage yards were less than 30% shown as maximum probabilities. The phenomena indicated that dust emissions occupied around 30% for each individual storage yard, no matter whether the storage
yard installed wind screens or not. It may be inferred that the building around the SY-I could be considered as a barrier to prevent dust emission under calm atmospheric condition.
Fig.7. Occurrence percentage of Dust Suppressing Ratio (DSR) in different storage yards.
It is worthwhile to notice that the probabilities of
the DSR of SY-I above 40% was observed a little bit more than that of SY-II and SY-III. One of the reasons for the greater probability in the DSR of SY-I being above 40% was caused by stronger wind speeds, when compared with the events of wind data recorded from an anemometer.
4.2 Dust control efficiency of wind screens
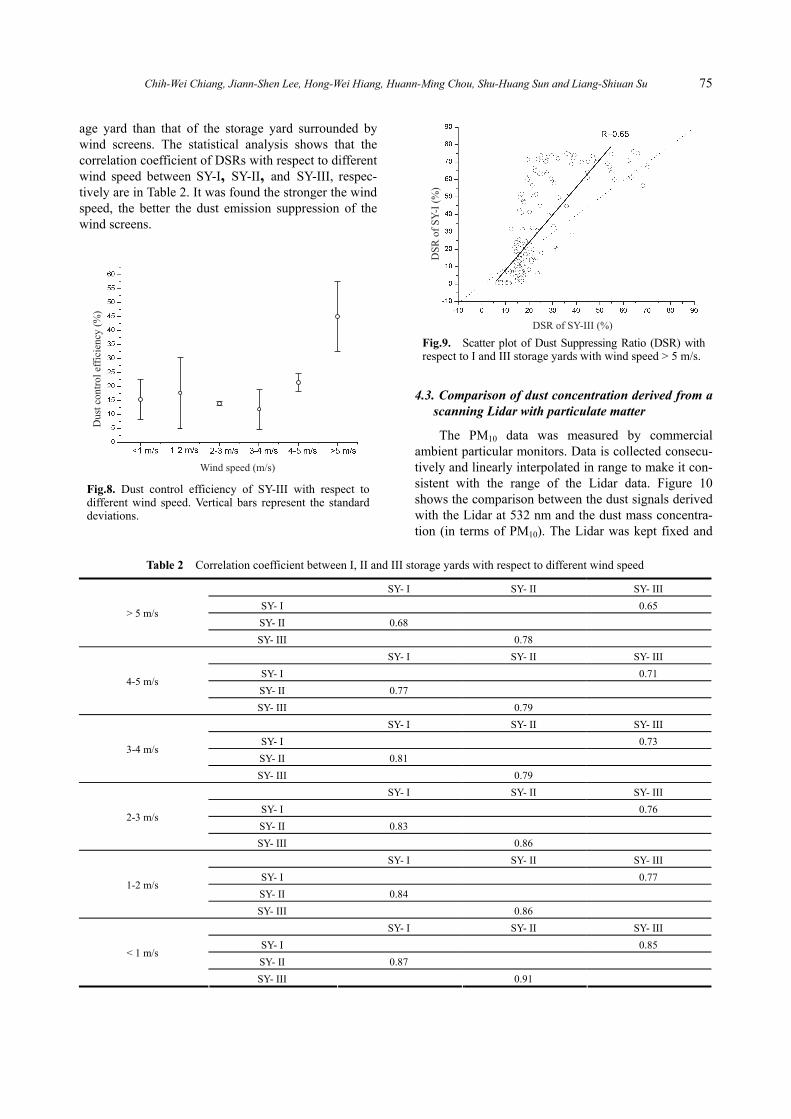
To assess the wind screens effectiveness in reducing particle emission, the Dust Control Efficiency (DCE) of the storage yards were calculated by using the DSR of SY-I and SY-III at different wind speeds and the effi-ciency shown in Fig.8. From the figures it can be seen that a wind speed smaller than 5 m/s, while the DCE of SY-III was around 10 to 20%. The DCR of SY-III was around 45% with the increase in wind speed greater than 5 m/s. The DCR of SY-III showed higher efficiency with increased wind speed implied that the wind screens play an important role in preventing wind erosion of particles in open storage yards, and an in-situ meas-urement of dust control effects of a wind screen was 45% in this study. However, the dust control effects of a wind screen would be better in stronger wind speeds, unfortunately, the strong wind speed events ( > 5 m/s) were rarely observed in the study.
In addition, the scatter plot of DSRs with respect to SY-I and SY-III with wind speeds greater than 5 m/s was shown in Fig.9. The correlation coefficient of DSRs between SY-I and SY-III was 0.65. Furthermore, the DSRs of SY-III were distributed below the DSRs of SY-I, this indicates that for strong wind speed, the area of dust emission was larger in the no wind screen stor-
75 Chih-Wei Chiang, Jiann-Shen Lee, Hong-Wei Hiang, Huann-Ming Chou, Shu-Huang Sun and Liang-Shiuan Su
age yard than that of the storage yard surrounded by wind screens. The statistical analysis shows that the correlation coefficient of DSRs with respect to different wind speed between SY-I, SY-II, and SY-III, respec-tively are in Table 2. It was found the stronger the wind speed, the better the dust emission suppression of the wind screens.
Fig.8. Dust control efficiency of SY-III with respect to different wind speed. Vertical bars represent the standard deviations.
Fig.9. Scatter plot of Dust Suppressing Ratio (DSR) with respect to I and III storage yards with wind speed > 5 m/s.
4.3. Comparison of dust concentration derived from a scanning Lidar with particulate matter
The PM10 data was measured by commercial ambient particular monitors. Data is collected consecu-tively and linearly interpolated in range to make it con-sistent with the range of the Lidar data. Figure 10 shows the comparison between the dust signals derived with the Lidar at 532 nm and the dust mass concentra-tion (in terms of PM10). The Lidar was kept fixed and
Table 2 Correlation coefficient between I, II and III storage yards with respect to different wind speed
SY- I SY- II SY- III
SY- I 0.65
SY- II 0.68 > 5 m/s
SY- III 0.78
SY- I SY- II SY- III
SY- I 0.71
SY- II 0.77 4-5 m/s
SY- III 0.79
SY- I SY- II SY- III
SY- I 0.73
SY- II 0.81 3-4 m/s
SY- III 0.79
SY- I SY- II SY- III
SY- I 0.76
SY- II 0.83 2-3 m/s
SY- III 0.86
SY- I SY- II SY- III
SY- I 0.77
SY- II 0.84 1-2 m/s
SY- III 0.86
SY- I SY- II SY- III
SY- I 0.85
SY- II 0.87 < 1 m/s
SY- III 0.91
76 Measurement of Dust Control Efficiency of Wind Screens by Using 3-D Scanning Lidar
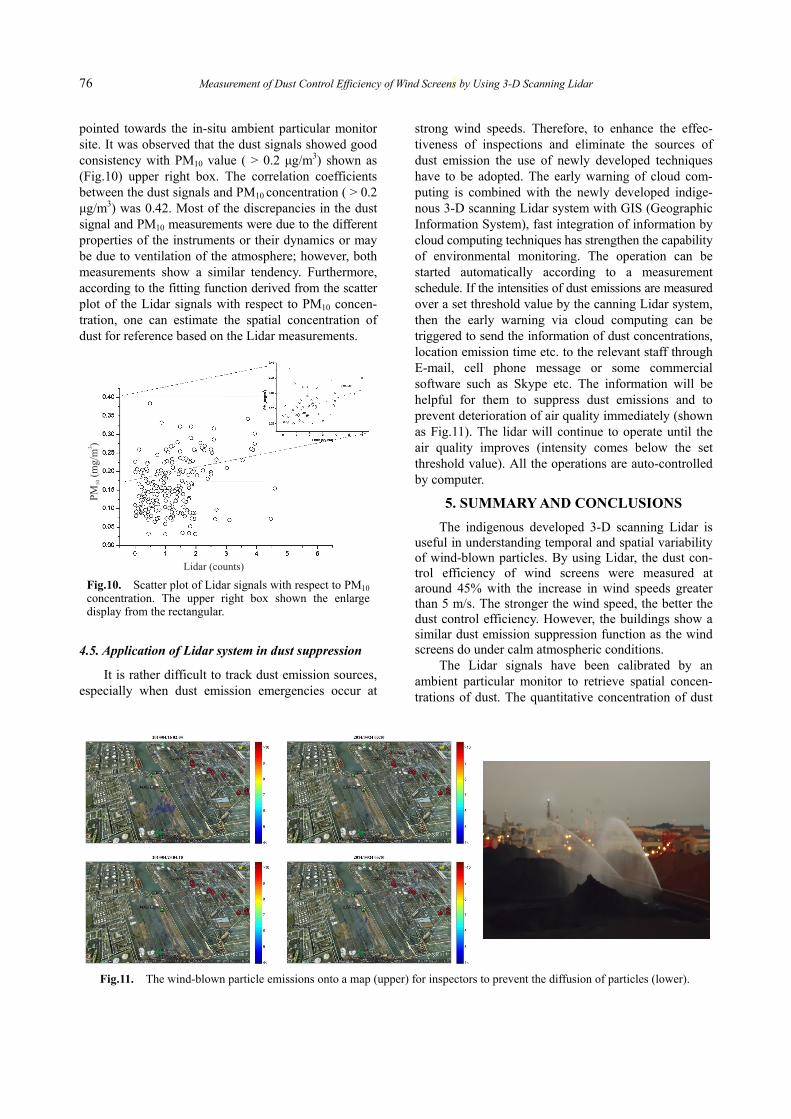
pointed towards the in-situ ambient particular monitor site. It was observed that the dust signals showed good consistency with PM10 value ( > 0.2 μg/m3) shown as (Fig.10) upper right box. The correlation coefficients between the dust signals and PM10 concentration ( > 0.2 μg/m3) was 0.42. Most of the discrepancies in the dust signal and PM10 measurements were due to the different properties of the instruments or their dynamics or may be due to ventilation of the atmosphere; however, both measurements show a similar tendency. Furthermore, according to the fitting function derived from the scatter plot of the Lidar signals with respect to PM10 concen-tration, one can estimate the spatial concentration of dust for reference based on the Lidar measurements.
Fig.10. Scatter plot of Lidar signals with respect to PM10 concentration. The upper right box shown the enlarge display from the rectangular.
4.5. Application of Lidar system in dust suppression
It is rather difficult to track dust emission sources, especially when dust emission emergencies occur at
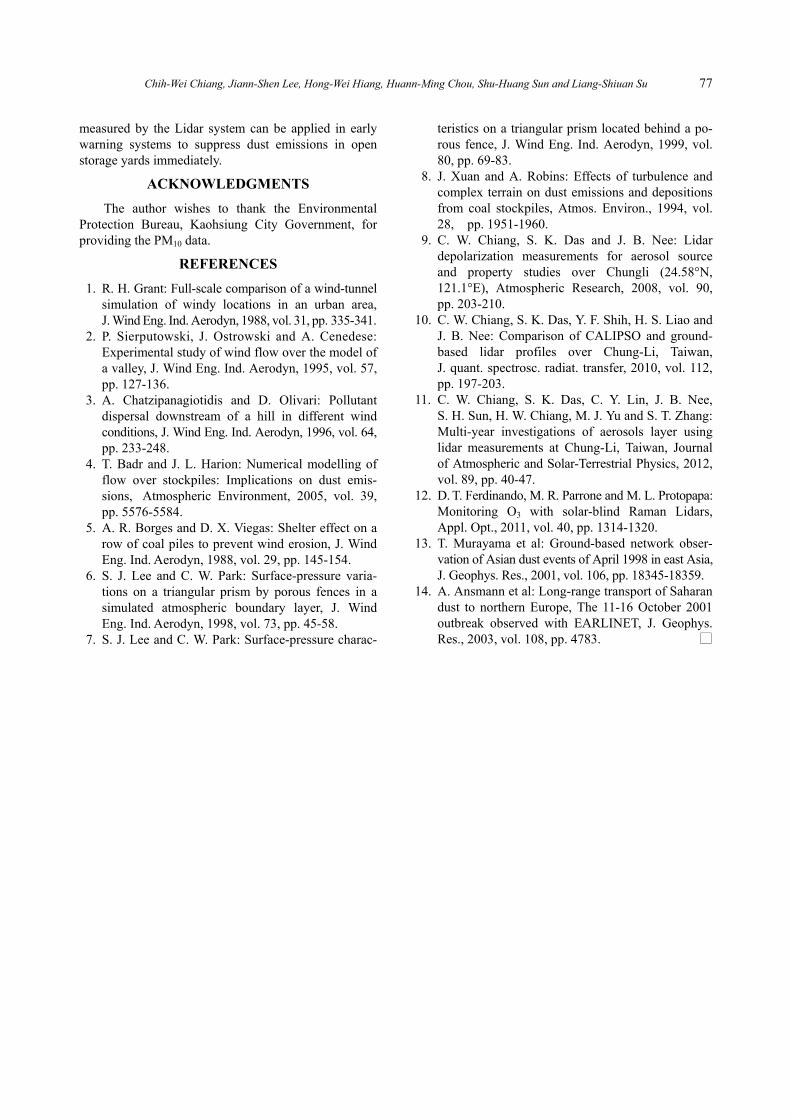
strong wind speeds. Therefore, to enhance the effec-tiveness of inspections and eliminate the sources of dust emission the use of newly developed techniques have to be adopted. The early warning of cloud com-puting is combined with the newly developed indige-nous 3-D scanning Lidar system with GIS (Geographic Information System), fast integration of information by cloud computing techniques has strengthen the capability of environmental monitoring. The operation can be started automatically according to a measurement schedule. If the intensities of dust emissions are measured over a set threshold value by the canning Lidar system, then the early warning via cloud computing can be triggered to send the information of dust concentrations, location emission time etc. to the relevant staff through E-mail, cell phone message or some commercial software such as Skype etc. The information will be helpful for them to suppress dust emissions and to prevent deterioration of air quality immediately (shown as Fig.11). The lidar will continue to operate until the air quality improves (intensity comes below the set threshold value). All the operations are auto-controlled by computer.
5. SUMMARY AND CONCLUSIONS
The indigenous developed 3-D scanning Lidar is useful in understanding temporal and spatial variability of wind-blown particles. By using Lidar, the dust con-trol efficiency of wind screens were measured at around 45% with the increase in wind speeds greater than 5 m/s. The stronger the wind speed, the better the dust control efficiency. However, the buildings show a similar dust emission suppression function as the wind screens do under calm atmospheric conditions.
The Lidar signals have been calibrated by an ambient particular monitor to retrieve spatial concen-trations of dust. The quantitative concentration of dust
Fig.11. The wind-blown particle emissions onto a map (upper) for inspectors to prevent the diffusion of particles (lower).
77 Chih-Wei Chiang, Jiann-Shen Lee, Hong-Wei Hiang, Huann-Ming Chou, Shu-Huang Sun and Liang-Shiuan Su
measured by the Lidar system can be applied in early warning systems to suppress dust emissions in open storage yards immediately.
ACKNOWLEDGMENTS
The author wishes to thank the Environmental Protection Bureau, Kaohsiung City Government, for providing the PM10 data.
REFERENCES
1. R. H. Grant: Full-scale comparison of a wind-tunnel simulation of windy locations in an urban area, J. Wind Eng. Ind. Aerodyn, 1988, vol. 31, pp. 335-341.
2. P. Sierputowski, J. Ostrowski and A. Cenedese: Experimental study of wind flow over the model of a valley, J. Wind Eng. Ind. Aerodyn, 1995, vol. 57, pp. 127-136.
3. A. Chatzipanagiotidis and D. Olivari: Pollutant dispersal downstream of a hill in different wind conditions, J. Wind Eng. Ind. Aerodyn, 1996, vol. 64, pp. 233-248.
4. T. Badr and J. L. Harion: Numerical modelling of flow over stockpiles: Implications on dust emis-sions, Atmospheric Environment, 2005, vol. 39,
pp. 5576-5584. 5. A. R. Borges and D. X. Viegas: Shelter effect on a
row of coal piles to prevent wind erosion, J. Wind Eng. Ind. Aerodyn, 1988, vol. 29, pp. 145-154.
6. S. J. Lee and C. W. Park: Surface-pressure varia-tions on a triangular prism by porous fences in a simulated atmospheric boundary layer, J. Wind Eng. Ind. Aerodyn, 1998, vol. 73, pp. 45-58.
7. S. J. Lee and C. W. Park: Surface-pressure charac-
teristics on a triangular prism located behind a po-rous fence, J. Wind Eng. Ind. Aerodyn, 1999, vol. 80, pp. 69-83.
8. J. Xuan and A. Robins: Effects of turbulence and complex terrain on dust emissions and depositions from coal stockpiles, Atmos. Environ., 1994, vol. 28, pp. 1951-1960.
9. C. W. Chiang, S. K. Das and J. B. Nee: Lidar depolarization measurements for aerosol source and property studies over Chungli (24.58°N, 121.1°E), Atmospheric Research, 2008, vol. 90, pp. 203-210.
10. C. W. Chiang, S. K. Das, Y. F. Shih, H. S. Liao and J. B. Nee: Comparison of CALIPSO and ground- based lidar profiles over Chung-Li, Taiwan, J. quant. spectrosc. radiat. transfer, 2010, vol. 112, pp. 197-203.
11. C. W. Chiang, S. K. Das, C. Y. Lin, J. B. Nee, S. H. Sun, H. W. Chiang, M. J. Yu and S. T. Zhang: Multi-year investigations of aerosols layer using lidar measurements at Chung-Li, Taiwan, Journal of Atmospheric and Solar-Terrestrial Physics, 2012, vol. 89, pp. 40-47.
12. D. T. Ferdinando, M. R. Parrone and M. L. Protopapa: Monitoring O3 with solar-blind Raman Lidars, Appl. Opt., 2011, vol. 40, pp. 1314-1320.
13. T. Murayama et al: Ground-based network obser-vation of Asian dust events of April 1998 in east Asia, J. Geophys. Res., 2001, vol. 106, pp. 18345-18359.
14. A. Ansmann et al: Long-range transport of Saharan dust to northern Europe, The 11-16 October 2001 outbreak observed with EARLINET, J. Geophys. Res., 2003, vol. 108, pp. 4783. □