Embed Size (px)
Citation preview
10 MW DEMONSTRATION
OF
GAS SUSPENSION ABSORPTION
FINAL PROJECT PERFORMANCE
AND
ECONOMICS REPORT
AirPol,, Inc. 32 Henry Street
Tete&om, New Jersey 07608
CLEAN COAL TECHNOLOGY III
10 MW DEMONSTRATION OF GAS SUSPENSION ABSORPTION
FINAL PROJECT PERFORMANCE AND ECONOMICS REPORT
PARTICIPANT
AirPol Inc.
Tetetbom, New Jersey
Fmnk E. Hsu Pmject M,mnger
June 1995
P~epmed for the United States Depndment of Energy Under Cooperative Agnxment No. DE-FZt-90PC90542
Clemd by Office of Patent Counsel Chicago Opemtions Office U.S. Depmtment of Energy

LEGAL NOTICE
This report was prepared by AirPol, Inc. pursuant to a Cooperative Agreement funded partially by the U.S. Department of Energy, and neither AirPol, Inc. nor any of its subcontractors, nor the U.S. Department of Energy, nor any person acting on behalf of either:
(4 Makes any warranty of representation, expressed or implied, with respect to the accuracy, completeness, or usefulness of the information contained in this report, or that the use of any information, apparatus, method, or process disclosed in this report may not infringe on privately-owned rights; or
Assumes any liabilities with respect to the use of, or for damages resulting from the use of, any information, apparatus, method or process disclosed in this report,
Reference herein to any specific commercial product, process, or service by trade name, trademark, manufacturer, or otherwise, does not necessarily constitute or imply its endorsement, recommendation, or favoring by the U.S. Department of Energy. The views and opinions of authors expressed herein do not necessarily state or reflect those of the U.S. Department of Energy.
i __
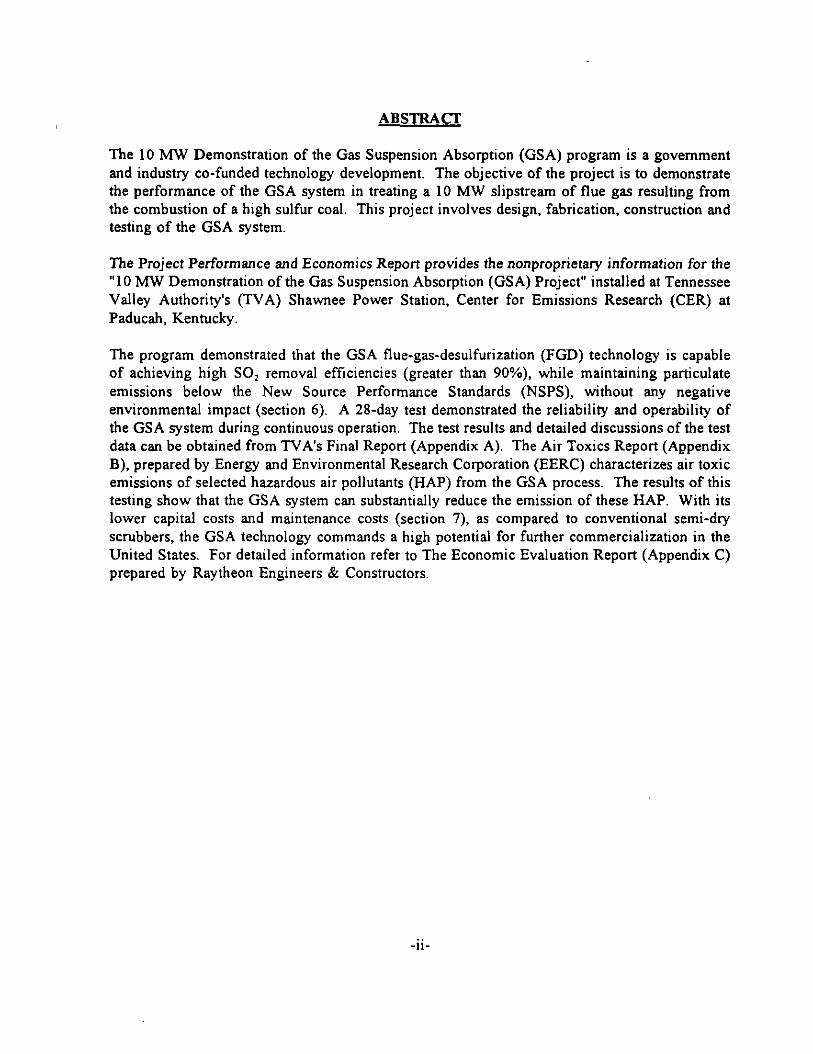
ABSTRAm
The 10 MW Demonstration of the Gas Suspension Absorption (GSA) program is a government and industry co-funded technology development. The objective of the project is to demonstrate the performance of the GSA system in treating a 10 MW slipstream of flue gas resulting from the combustion of a high sulfur coal. This project involves design, fabrication, construction and testing of the GSA system.
The Project Performance and Economics Report provides the nonproprietary information for the “10 MW Demonstration of the Gas Suspension Absorption (GSA) Project” installed at Tennessee Valley Authority’s (TVA) Shawnee Power Station, Center for Emissions Research (CER) at Paducah, Kentucky.
The program demonstrated that the GSA flue-gas-desulfurization (FGD) technology is capable of achieving high SO, removal efficiencies (greater than 90%), while maintaining particulate emissions below the New Source Performance Standards (NSPS), without any negative environmental impact (section 6). A 28-day test demonstrated the reliability and operability of the GSA system during continuous operation. The test results and detailed discussions of the test data can be obtained from TVA’s Final Report (Appendix A). The Air Toxics Report (Appendix B), prepared by Energy and Environmental Research Corporation (EERC) characterizes air toxic emissions of selected hazardous air pollutants (HAP) from the GSA process. The results of this testing show that the GSA system can substantially reduce the emission of these HAP. With its lower capital costs and maintenance costs (section 7), as compared to conventional semi-dry scrubbers, the GSA technology commands a high potential for further commercialization in the United States. For detailed information refer to The Economic Evaluation Report (Appendix C) prepared by Raytheon Engineers & Constructors.
-ii-
POINT OF CONTACT
Frank E. Hsu Project Manager
AirPol Inc. 32 Henry Street
Teterboro, New Jersey 07608 Tel. (201)-288-7070
Sharon K. Marchant Project Manager
Pittsburgh Energy Technology Center United States Department of Energy
Pittsburgh, Pennsylvania 15236 Tel. (412)-892-6008
Thomas A. Burnett Project Specialist
Tennessee Valley Authority Chattanooga, Tennessee 37402
Tel. (615)-751-3938
-,,I-
TABLE OF CONTENT
LEGAL NOTICE .................................................................................................................................. i ABSTRACT.. ........................................................................................................................................ ii POINT OF CONTACT ..................................................................................................................... iii TABLE OF CONTENT.. .................................................................................................................. iv LIST OF TABLES ............................................................................................................................ vi LIST OF FIGURES ......................................................................................................................... vii LIST OF ABBREVIATIONS ......................................................................................................... viii EXECUTIVE SUMMARY ................................................................................................................. ix
1.0
1.1
1.2
1.3 1.4 1.5
2.0 2.1
2.2 2.3 2.4 2.5 2.6
3.0
INTRODUCITON ..................................................................................................................... 1
PURPOSE OF THE PROIECT PERFORMANCE AND ECONOMIC REPORT ................................................................................................. I OVERVIEW OF THE PROIECT.. ...................................................................................... 2 1.2.1 Background and History ofProject.. ........................................................................... .2 1.2.2 Project Organization ..................................................................................................... 3 1.2.3 Project Description.. .................................................................................................... .5 1.2.4 Site ................................................................................................................................. 7 1.2.5 Project Schedule.. ......................................................................................................... 7 OBJECTIVES OF THE PROIECT .................................................................................... 11 SIGNIFICANCE OF THE PROTECT ................................................................................ 12 DOE’S ROLE IN THE PROJECT .................................................................................... 13 1.5.1 Innovative Clean Coal Technology Program ............................................................. 13 1.5.2 Management Plan and Organization Chart.. ........................................................ .13
TECHNOLOGY DESCRB’TION.. ...................................................................................... 16 DESCRIPTION OF THE DEMONSTRATED TECHNOLOGY.. ................................. .16 2.1.1 SO, Removal.. ............................................................................................................ 16 2.1.2 Dust Collection ............................................................................................................ 19 2. I .3 Reagent Preparation ................................................................................................... 20 2.1.4 By-ProductHandling.. ................................................................................................ 20 DESCRIPTION OF THE DEMONSTRATED FACILITIES.. ....................................... .22 PROPRIETARY INFORMATION ...................................................................................... 23 SIMPLIFIED PROCESS FLOW DIAGRAM.. .................................................................. 24 STREAM DATA.. .................................................................................................................. 26 PROCESS AND INSTRUMENTATION DIAGRAMS .................................................... 3 I
UPDATE OF THE PUBLIC DESIGN REPORT ........................................................... 33
-iv-
4.0 4.1
5.0 5.1
5.2
5.3
5.4
6.0 6.1
6.2 6.3
7.0
8.0 8.1
DEMONSTRATION PROGRAM.. .................................................................................... 34 OPERATING PROCEDURES.. ............................................................................................ 34 4.1.1 Instrumentation and Data Acquisition ....................................................................... 40 4.1.2 Test Methods .............................................................................................................. 45
TECHNICAL PERFORMANCE.. ...................................................................................... 51 SO, REMOVAL PERFORMANCE.. .................................................................................. .5 1 5.1.1 Factorial Tests.. ......................................................................................................... .51 5.1.2 Effect of Lime Stoichiometry and Approach Temperature.. ............................. 57 5.1.3 Effect of Flue Gas Flow Rate.. ........................................................................... .60 5.1.4 Effect of Chloride Spiking.. ................................................................................... .67 5.1.5 Effect of Other Operational Variables .................................................................. 67 5.1.6 Lime Utilization.. ...................................................................................................... .67 5.1.7 Comparison with IO-MW Spray Dryer ................................................................. 73 5.1.8 28-Day Demonstration Run.. ................................................................................... ,75 5.1.9 14-Day Pulse-jet Baghouse Demonstration Run.. .................... I. ........................... 79 ESP PARTICULATE CONTROL PERFORMANCE ....................................................... 87 5.2.1 Factorial Tests.. ..................................................... . .................................................... 87 5.2.2 Comparison with lo-MW Spray Dryer.. ............................................................... 94 5.2.3 28-Day Demonstration Run.. .................................................................................... 97 5.2.4 14-Day Pulse-jet Baghouse Demonstration Run. ................................................ I01 ESP OPERATION ............................................................................................................... I08 5.3.1 Factorial Tests.. ........................................................................................................ 108 5.3.2 28-Day Demonstration Run.. ................................................................................. .l I3 5.3.3 14-Day Pulse-jet Baghouse Demonstration Run.. ............................................... 118 CORRELATION OF RESULTS.. ...................................................................................... 122
ENVIRONMENTAL PERFORMANCE .......................................................................... 124 IMPACT ON THE ENVIRONMENT .............................................................................. 124 6.1.1 Land Impacts.. ......................................................................................................... ,124 6.1.2 Air, Water Quality and Solid Waste Impacts.. ........................................................ ,124 6.1.3 Ecological Impacts.. ................................................................................................ ,124 6.1.4 Health and Safety Impacts .................................................................................... 126 6.1.5 Impact Summary.. ................................................................................................... ,126 WASTE STREAMS AND THEIR DISPOSAL.. ........................................................... 127 POTENTIAL ENVIRONMENTAL CONCERNS ............................................................ 128
ECONOMICS ........................................................................................................................ 129
COMMERCIALIZATION POTENTIAL AND PLANS.. ............................................... 13 1 MARKETANALY SIS.. ........................................................................................................ 13 1 8.1.1 Applicability of the Technology.. ........................................................................ .131 8.1.2 Market Size. ............................................................................................................. 131 8.1.3 Market Barriers.. ..................................................................................................... ,132
-V-

8.2 8.1.4 Economic Comparison with Competing Technologies ....................................... 132 COMMERCIALIZATION PLANS. ................................................................................... 135
9.0 CONCLUSIONS AND RECOMMENDATIONS.. .......................................................... ,137
10.0 REFERENCES ...................................................................................................................... 139
11.0 APPENDIXES ....................................................................................................................... 140
-vi-
LIST OF TABLES
Table 1.2.5-l
Table 1.2.5-2
PROJECT WORK BREAKDOWN STRUCTURE .._._....._....................... 9
TEST SCHEDULE 10 MW DEMONSTRATION OF GSA . . . . . . . . . . . . . . . . 10
Table 2.5-l SUMMARY TABLE FOR GSA PROCESS DATA.. .................................. 27
Table 2.5-2 PROCESS DATA FOR DESIGN CASE.. ..................................................... .28
Table 4.1-l SIMPLIFIED OPERATING PROCEDURES .._................................. 36
Table 4.1-2
Table 4.1. I
OPERATORS CHECKLIST .._.................................................................... 37
INSTRUMENT SPECIFICATIONS FOR CONTINUOUS MONITORS .._......._............................,,,..,.,...........,...,.,,,, 41
Table 4.1.2-l GASEOUS STREAM MONITORING SUMMARY.. ..................................... 46
Table 4.1.2-2 AQUEOUS STREAM MONITORING SUMMARY.. .................................... 49
Table 4.1.2-3 SOLID STREAM MONITORING SUMMARY.. ........................................... 50
Table 5.1.1-l FINALIZED BASIC AND REPLICATE TESTS .......................................... 52
Table 5.1.1-Z GSA/ESP SO, REMOVAL RESULTS SUMMARY 2-AP SERIES -BASELINE TESTS . . . . . . . . . . . . . . 53
Table 5.1.1-3 GSA/ESP SO, REMOVAL RESULTS SUMMARY 3-AP SERIES - BASELINE TESTS ..__.._..................................,,,,,,,,,,.,,..., 54
Table 5.1.1-4 GSAESP SO, REMOVAL RESULTS SUMMARY 2-AP SERIES - CHLORIDE SPIKING TESTS ..t................................... 55
Table 5.1.1-5 GSAESP SOI REMOVAL RESULTS SUMMARY 3-AP SERIES - CHLORIDE SPIKING TESTS 56
Table 5.1.8 GSA/ESP SO, REMOVAL RESULTS SUMMARY DR SERIES - 28 DAY DEMONSTRATION RUN .._..................,............ 77
Table 5.1.9-l GSA/ESP SO, REMOVAL RESULTS SUMMARY PJ SERIES - 14 DAY DEMONSTRATION RUN ,.........,....,,.,,.,.,,,,,,,,.......... 81
-vii-
Table 5.1.9-2
Table 5.2.1-1
Table 5.2.1-2
Table 5.2.1-3
Table 5.2.1-4
Table 5.2.3
Table 5.2.4-l
Table 5.2.4-2
Table 5.3.1-l
Table 5.3.1-2
Table 5.3.1-3
Table 5.3.1-4
GSA/PJBH SO, REMOVAL RBSULTS SUMMARY PJ SERIES - 14 DAY DEMONSTRATION RUN _......_......_._..............,.,,,..., 84
GSA/ESP PARTICULATE CONTROL PERFORMANCE RESULTS SUMMARY 2-AP SERIES - BASELINE TESTS . . . . . . . . . . . . . . . . . . . . . . . . . . . 88
GSA/ESP PARTICULATE CONTROL PERFORMANCE RBSULTS SUMMARY 3-AP SERIES - BASELINE TESTS . . ..___........__...........................,,,,,.............. 89
GSAlESP PARTICULATE CONTROL PERFORMANCE RESULTS SUMMARY 2-AP SERIES - CHLORIDE SPIKING TESTS . . . . . . . .._.......................... 90
GSA/BSP PARTICULATE CONTROL PERFORMANCE RESULTS SUMMARY 3-AP SERIES - CHLORIDE SPIKING TESTS 91
GSA/ESP PARTICULATE CONTROL PERFORMANCE RESULTS SUMMARY DR SERIES - 28 DAY DEMONSTRATION RUN 98
GSA/ESP PARTICULATE CONTROL PERFORMANCE RBSULTS SUMMARY PJ SERIES - 14 DAY DEMONSTRATION RUN .._....................... 102
GSA/PJBH PARTICULATE CONTROL PERFORMANCE RESULTS SUMMARY PJ SERIES - 14 DAY DEMONSTRATION RUN ..__...........................,..... 105
AVERAGE ESP SECONDARY CURRENTS AND VOLTAGES 2-AP SERIES - BASELINE TESTS 109
AVERAGE ESP SECONDARY CURRENTS AND VOLTAGES 3-AP SERIES - BASELINE TESTS .._.............................................. 110
AVERAGE ESP SECONDARY CURRENTS AND VOLTAGES Z-AP SERIES - CHLORIDE SPIKING TESTS 111
AVERAGE ESP SECONDARY CURRENTS AND VOLTAGES 3-AP SERIES - CHLORIDE SPIKING TESTS .._........................ 112
-“II,-
Table 5.3.2 AVERAGE ESP SECONDARY CURRENTS AND VOLTAGES 1-DRSERIES . . . . . . . . . . . . . . . . . . . . . . . . . . . . . . . . . . . . 114
Table 5.3.3 AVERAGE ESP SECONDARY CURRENTS AND VOLTAGES I-PJ SERIES . . . . . . .._............................................................................................. 119
Table 5.4
Table 6.1.2
MAJOR VARIABLES AND LEVELS FOR FACTORIAL TEST . . . . . . . . . . . . . . . . . . . . . . . . . . . . . . . . . . . . . . . . . . . . . . . . . . . . . . . . . . . . . . . . . . . . . . . . . . . . . . 123
RESULTS OF LEACHATE TEST OF GSA DISPOSAL MATERIAL 10 MW DEMONSTRATION OF GSA . . . . . . . . . . 125
Table 7.0 SUMMARY OF PERFORMANCE AND COST DATA .___.._,..,.,...__...,,,,.. 130
Table 8.1.3-l TOTAL CAPITAL INVESTMENT COMPARISON .._.._........__................. 133
Table 8.1.3-2 LEVELIZED COSTS .._..._,.,..,,...__..,.,.............,,...............,...........,,,,.............,... 134
-ix-
Figure 1.2.2
Figure 1.2.3
Figure 1.5.2
Figure 2.1
Figure 2.4
Figure 2.5
Figure 2.6
Figure 4.1.1-1
Figure 4.1.1-2
Figure 4.1.1-3
Figure 5.1.2-1
Figure 5.1.2-2
Figure 5.1.3-1
Figure 5.1.3-2
LIST OF FIGURES
PROJECT ORGANIZATION 10 MW DEMONSTRATION OF GSA _..,.,,.._.............................,..,.,............... 4
PROCESS FLOW BLOCK DIAGRAM GAS SUSPENSION ABSORPTION SYSTEM 6
AIRPOL PROJECT ORGANIZATION 10 MW DEMONSTRATION OF GSA .._._................................................ 15
PROCESS FLOW DIAGRAM GAS SUSPENSION ABSORPTION SYSTEM 17
PROCESS FLOW DIAGRAM 10 MW DEMONSTRATION OF GSA . .._._................................................ 25
PROCESS CALCULATION DIAGRAM 10 MW DEMONSTRATION OF GSA . . . . . . . . . . . . . . 30
PROCESS CONTROL SCHEMATIC DIAGRAM GAS SUSPENSION ABSORPTION SYSTEM 32
BLOCK DIAGRAM FOR INTERRELATIONSHIPS OF GSA INSTRUMENTATION AND CONTROL --- I ___..____,..,,...___.......... 42
BLOCK DIAGRAM FOR INTERRELATIONSHIPS OF GSA INSTRUMENTATION AND CONTROL --- II ._.........,................ 43
BLOCK DIAGRAM FOR INTERRELATIONSHIPS OF GSA INSTRUMENTATION AND CONTROL --- III .._...... ..__._ 44
GSA SO, REMOVAL RESULTS 2-AP SERIES - BASELINE CHLORIDE TESTS .._.__._...__....................... 58
GSA SO, REMOVAL RESULTS 2-AP SERIES - BASELINE CHLORIDE TESTS .._.._....._....................... 59
GSA SO, REMOVAL RESULTS 2-AP SERIES - 8F APPROACH TESTS .._.._._................................................ 61
GSA SO, REMOVAL RESULTS 2-AP SERIES - 18F APPROACH TESTS .._..........___................................... 62
-x-
Figure 5.1.3-3
Figure 5.1.3-4
Figure 5.1.3-5
Figure 5.1.3-6
Figure 5.1.4-l
Figure 5.1.4-2
Figure 5.1.4-3
Figure 5.1.4-4
Figure 5.1.7
Figure 5.1.8
Figure 5.1.9-1
Figure 5.1.9-2
Figure 5.1.9-3
Figure 5.1.9-4
Figure 5.2.1-l
GSA SO, REMOVAL RESULTS 2-AP SERIES - 28F APPROACH TESTS ..__.__._.__.................................... 63
GSA SO, REMOVAL RESULTS 2-AP SERIES - 18F APPROACH / CHLORIDE SPIKING TESTS ._.......... 64
GSA SO, REMOVAL RESULTS 2-AP SERIES - 28F APPROACH / CHLORIDE SPIKING TESTS 65
GSA SO, REMOVAL RESULTS 3-AP SERIES - BASELINE CHLORIDE TESTS .._.......................... 66
GSA SO, REMOVAL RESULTS 2-AP SERIES - CHLORIDE SPIKING TESTS _.........._._................................ 69
GSA SO, REMOVAL RESULTS 2-AP SERIES - 18F APPROACH TESTS 70
GSA SO, REMOVAL RESULTS 2-AP SERIES - 28F APPROACH TESTS 71
GSA SO, REMOVAL RESULTS 3-AP SERIES - BASELINE / CHLORIDE SPIKING TESTS .,....,.....,..,,,,,... 72
COMPARISON OF SPRAY DRYER AND AIRPOL GSA SO, REMOVAL PERFORMANCE 74
28-DAY DEMONSTRATION RUN AVERAGE DAILY STOICHIOMETRY ..__...._...................,,,,.,,.,,.,,,,,,,.,.., 78
14-DAY PJBH DEMONSTRATION RUN AVERAGE DAILY STOICHIOMETRY 82
14-DAY PJBH DEMONSTRATION RUN TOTAL SYSTEM SO, REMOVAL 83
14-DAY PJBH DEMONSTRATION RUN TOTAL SYSTEM LIME UTILIZATION 85
COMPARISON OF CALCULATED AND MEASURED REACTOR LIME UTILIZATIONS - 1 -PJ SERIES TESTS ..___....._. .__.. 86
GSA/ESP PERFORMANCE RESULTS ESP PARTICULATE EMISSIONS VERSUS SCA 92
-xi-
Figure 5.2.1-2
Figure 5.2.2-1
Figure 5.2.2-2
Figure 5.2.3-1
Figure 5.2.3-2
Figure 5.2.4-l
Figure 5.2.4-2
Figure 5.2.4-3
Figure 5.2.4-4
Figure 5.3.2-l
Figure 5.3.2-2
Figure 5.3.2-3
Figure 5.3.3-l
Figure 5.3.3-2
GSA/JZSP PERFORMANCE RESULTS PARTICULATE COLLECTION EFFICIENCY VERSUS SCA 93
COMPARISON OF SPRAY DRYER AND AIRPOL GSA ESP PARTICULATE CONTROL PERFORMANCE 95
COMPARISON OF SPRAY DRYER AND AIRPOL GSA ESP PARTICULATE COLLECTION EFFICIENCY .._...................... 96
28-DAY DEMONSTRATION RUN ESP PERFORMANCE RESULTS ESP PARTICULATE REMOVAL . . . . . . . . . . . . . . . . . . . . . 99
28-DAY DEMONSTRATION RUN ESP PERFORMANCE RESULTS ESP PARTICULATE EMISSIONS .._.._._.._...._........................,,,,,,...,.,.,,,..,., 100
14-DAY PJF%H DEMONSTRATION RUN ESP PERFORMANCE RESULTS ESP PARTICULATE REMOVAL 103
14-DAY PmH DEMONSTRATION RUN ESP PERFORMANCE RESULTS ESP PARTICULATE EMISSIONS _....._....___....._...............,...,,..,.,,,,,.,,,,..,....... 104
14-DAY PJBH DEMONSTRATION RUN ESP AND PJBH PARTICULATE REMOVAL ..__............,.,.,.,,..,..,,,,.,......, 106
14-DAY PJBH DEMONSTRATION RUN ESP AND PIBH PARTICULATE EMISSIONS ..,.,.........._...,,,,,.,,,,,,,,,...,,,,, 107
28-DAY DEMONSTRATION RUN ESP PERFORMANCE AVERAGE SECONDARY CURRENTS 115
28-DAY DEMONSTRATION RUN ESP PERFORMANCE AVERAGE SECONDARY VOLTAGES .._._....................................... 116
28-DAY DEMONSTRATION RUN ESP PERFORMANCE AVERAGE DAILY SECONDARY CURRlZNTS .,.__.,..._.......,,.,,.,,,,,,,,..,,,.,,. 117
14-DAY PIBH DEMONSTRATION RUN ESP PERFORMANCE AVERAGE SECONDARY CURRENTS ..t_.................................... 120
14-DAY PJBH DEMONSTRATION RUN ESP PERFORMANCE AVERAGE DAILY SECONDARY CURRENTS .____........._......,................... 121
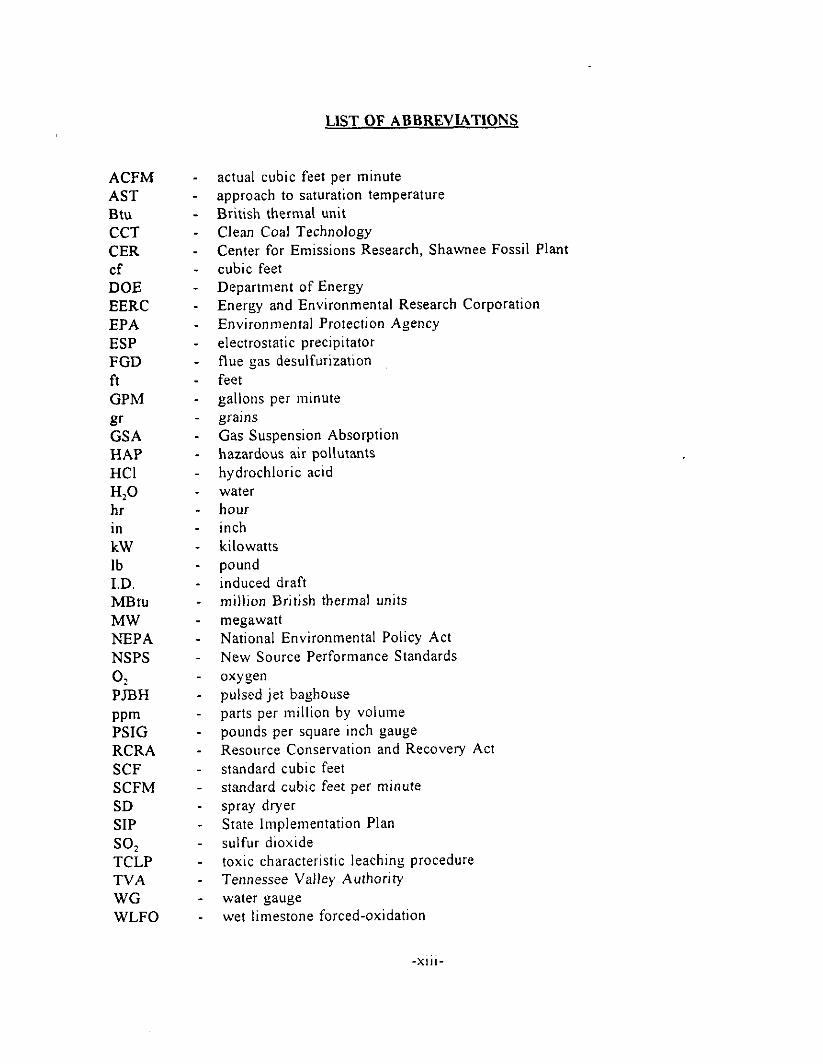
LIST OF ABBREVIATIONS
ACFM AST Btu CCT CER cf DOE EERC EPA ESP FGD ft GPM gr GSA HAP HCl HP hr in kW lb I.D. MBtu MW NEPA NSPS 02 PJBH mm PSIG RCRA SCF SCFM SD SIP so* TCLP TVA WG WLFO
- actual cubic feet per minute - approach to saturation temperature - British thermal unit - Clean Coal Technology - Center for Emissions Research, Shawnee Fossil Plant - cubic feet - Department of Energy - Energy and Environmental Research Corporation - Environmental Protecrlon Agency - electrostatic precipitator - flue gas desulfurization - feet - gallons per mmute - grains - Gas Suspension Absorption - hazardous air pollutants - hydrochloric acid - water - hour - inch - kilowatts - pound - induced draft - million British thermal units - megawatt - National Environmental Policy Act - New Source Performance Standards - oxygen - pulsed jet baghouse - parts per million by volume
pounds per square inch gauge Resource Conservation and Recovery Act standard cubic feet standard cubic feet per minute spray dryer State Implementation Plan sulfur dioxide toxic characteristic leaching procedure Tennessee Valley Authority water gauge wet limestone forced-oxidation
-XIII-
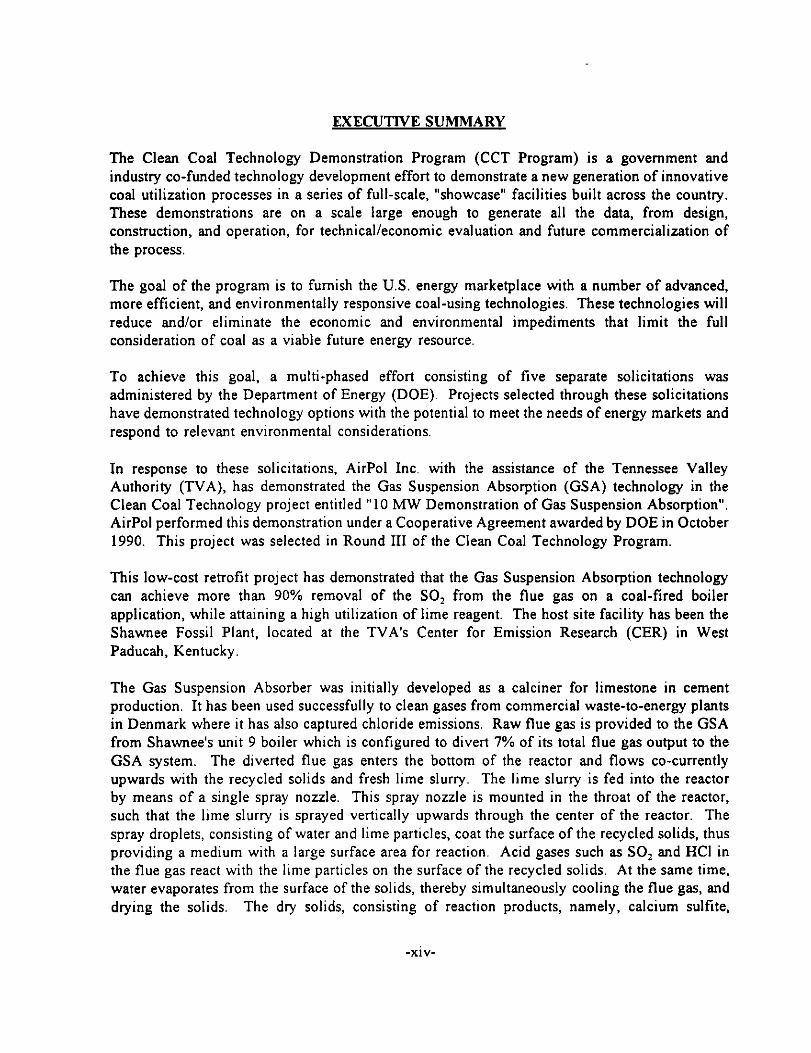
EXECUTIVE SUMMARY
The Clean Coal Technology Demonstration Program (CCT Program) is a government and industry co-funded technology development effort to demonstrate a new generation of innovative coal utilization processes in a series of full-scale, “showcase” facilities built across the country. These demonstrations are on a scale large enough to generate all the data, from design, construction, and operation, for technical/economic evaluation and future commercialization of the process.
The goal of the program is to furnish the U.S. energy marketplace with a number of advanced, more efficient, and environmentally responsive coal-using technologies. These technologies will reduce and/or eliminate the economic and environmental impediments that limit the full consideration of coal as a viable future energy resource.
To achieve this goal, a multi-phased effort consisting of five separate solicitations was administered by the Department of Energy (DOE). Projects selected through these solicitations have demonstrated technology options with the potential to meet the needs of energy markets and respond to relevant environmental considerations.
In response to these solicitations, AirPol Inc. with the assistance of the Tennessee Valley Authority (TVA), has demonstrated the Gas Suspension Absorption (GSA) technology in the Clean Coal Technology project entitled “10 MW Demonstration of Gas Suspension Absorption”. AirPol performed this demonstration under a Cooperative Agreement awarded by DOE in October 1990. This project was selected in Round III of the Clean Coal Technology Program.
This low-cost retrofit project has demonstrated that the Gas Suspension Absorption technology can achieve more than 90% removal of the SO, from the flue gas on a coal-fired boiler application, while attaining a high utilisation of lime reagent. The host site facility has been the Shawnee Fossil Plant, located at the TVA’s Center for Emission Research (CER) in West Paducah, Kentucky.
The Gas Suspension Absorber was initially developed as a calciner for limestone in cement production. It has been used successfully to clean gases from commercial waste-to-energy plants in Denmark where it has also captured chloride emissions. Raw flue gas is provided to the GSA from Shawnee’s unit 9 boiler which is configured to divert 7% of its total flue gas output to the GSA system. The diverted flue gas enters the bottom of the reactor and flows co-currently upwards with the recycled solids and fresh lime slurry. The lime slurry is fed into the reactor by means of a single spray nozzle. This spray nozzle is mounted in the throat of the reactor, such that the lime slurry is sprayed vertically upwards through the center of the reactor. The spray droplets, consisting of water and lime particles, coat the surface of the recycled solids, thus providing a medium with a large surface area for reaction. Acid gases such as SO, end HCI in the flue gas react with the lime particles on the surface of the recycled solids. At the same time, water evaporates from the surface of the solids, thereby simultaneously cooling the flue gas, and drying the solids. The dry solids, consisting of reaction products, namely, calcium sulfite,
-xiv-
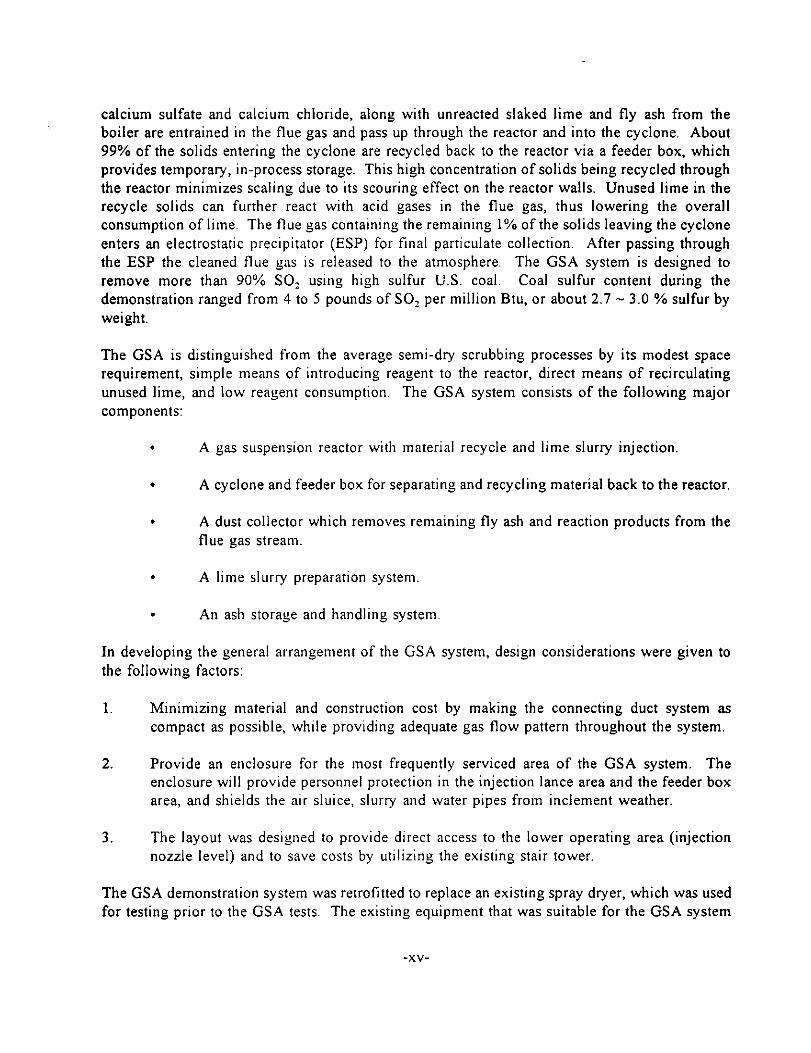
calcium sulfate and calcium chloride, along with unreacted slaked lime and fly ash from the boiler are entrained in the flue gas and pass up through the reactor and into the cyclone. About 99% of the solids entering the cyclone are recycled back to the reactor via a feeder box, which provides temporary, in-process storage. This high concentration of solids being recycled through the reactor minimizes scaling due to its scouring effect on the reactor walls. Unused lime in the recycle solids can further react with acid gases in the flue gas, thus lowering the overall consumption of lime. The flue gas containing the remaining 1% of the solids leaving the cyclone enters an electrostatic precipitator (ESP) for final particulate collection. After passing through the ESP the cleaned flue gas is released to the atmosphere. The GSA system is designed to remove more than 90% SOI using high sulfur U.S. coal. Coal sulfur content during the demonstration ranged from 4 to 5 pounds of SOI per million Btu, or about 2.7 - 3.0 % sulfur by weight.
The GSA is distinguished from the average semi-dry scrubbing processes by its modest space requirement, simple means of introducing reagent to the reactor, direct means of recirculating unused lime, and low reagent consumption. The GSA system consists of the following major components:
. A gas suspension reactor with material recycle and lime slurry injection
. A cyclone and feeder box for separating and recycling material back to the reactor.
. A dust collector which removes remaining fly ash and reaction products from the flue gas stream.
. A lime slurry preparation system
. An ash storage and handling system
In developing the general arrangement of the GSA system, design considerations were given to the following factors:
1. Minimizing material and construction cost by making the connecting duct system as compact as possible, while providing adequate gas flow pattern throughout the system.
2. Provide an enclosure for the most frequently serviced area of the GSA system. The enclosure will provide personnel protection in the injection lance area and the feeder box area, and shields the air sluice, slurry and water pipes from inclement weather.
3. The layout was designed to provide direct access to the lower operating area (injection nozzle level) and to save costs by utilizing the existing stair tower.
The GSA demonstration system was retrofitted to replace an existing spray dryer, which was used for testing prior to the GSA tests. The existing equipment that was suitable for the GSA system
-xv-
was reused to minimire interface work and save equipment cost. The equipment reused includes the following:
. Air compressor
. Lime preparation system
. Electrostatic precipitator (ESP)
. Ash storage and handling system
. Motor control panel, which was modified to add additional circuit breakers
. Foxboro computers and instrumentation
In view of the fact that the GSA outlet gas temperature is close to the saturation temperature of the flue gas, special design consideration was given in heating and insulation of the vessels and gas ducts to prevent condensation. Basically, all of the main equipment such as reactor. cyclone, feeder box and fabric filter as well as the ductwork were designed for external insulation with flat sheet aluminum lagging.
During normal operation, the GSA system is controlled by an automatic process control system which consists of three control loops: Recycled Solid Control Loop, Water Feed Rate Control Loop, and Lime Feed Rate Control Loop. The control system ensures that GSA works under maximum reagent utilization, proper reaction temperature, and minimum lime consumption,
The capital costs for the entire project were within the budget which was about $7,717,200. As part of the DOE CCT Program, an economic evaluation of the GSA process was conducted using the same design and economic premises that were used to evaluate about 30 to 35 other FGD processes. The results show that the total capital requirements for the GSA process are substantially lower than those for the conventional wet limestone forced-oxidation (WLFO) scrubbing system ($149/kw vs. 8216Ikw). The substantially lower capital requirements are primarily due to the lower costs of the SO, absorption technology. Also, the levelized annual revenue requirements for the GSA process are 20 percent lower than those for the WLFO system.
All three of the major objectives of this demonstration were successfully achieved. Firstly, the GSA system demonstrated greater than 90 percent sulfur dioxide (SO,) removal for a high-sulfur coal (i.e. greater than 4.5 lb SOJMBtu) application. Secondly, the emissions from the electrostatic precipitator (ESP) remained below the New Source Performance Standards for particulates (i.e. 0.03 Ib/MBtu). Thirdly, the GSA plant demonstrated the reliability and operability of this technology by achieving 91 percent SO, removal during a 28-day period of continuous operation. It is obvious that this demonstration run truly fultills the goal of the Clean Coal Technology Demonstration Program.
-xvi-
One of the objectives of this demonstration project is for AirPol to establish its capability in designing, fabricating, and constructing the GSA system so that the demonstrated technology can be effectively commercialized for the benefit of the U.S. electric utility and industrial markets. The progress of this demonstration project matches very well with the development of the utility FGD market. The GSA technology is now ready to be commercialized for the industry in order to meet the Phase II Clean Air Act Amendments compliance requirements.
-xvii-
1.0 INTRODUCITON
1.1 PURPOSE OF THE PROJECI- PERFORMANCE AND ECONOMICS REPORT
The purpose of the Project Performance and Economics Report for “IO MW Demonstration of Gas Suspension Absorption” is to provide a technical account of the total work performed under the Cooperative Agreement awarded by U.S. Department of Energy (DOE). This report is based on recorded information from the demonstration run and various other tests with the incorporation of the modifications made during the test period. The report contains a comprehensive description of the results achieved, technical readiness, and participant’s view and plan for commercialization of the technology demonstrated.
The scope of the report is limited to non-proprietary information. Its content is not sufficient to provide a complete tool in designing and constructing a replicate plant. This report, however, will serve as a reference for the design and application considerations involved in a commercial- scale facility. The vital importance of this report is to present a practical application for this unique technology, Gas Suspension Absorption (GSA), to the public and provide a basic foundation for the upcoming commercialization usage.
1.2 OVERVIEW OF THE PROJECT
1.2.1 Background and Historv of Proiect
This project is the first North American demonstration of the GSA system for flue gas desulfurization (FGD) for a coal-fired utility boiler. The purpose of the project was to demonstrate that the GSA system is able to remove more than 90% of the SO, from the flue gas, while achieving a high utilization of reagent lime.
The GSA process is a novel concept for FGD that was developed by AirPol’s parent company, F.L. Smidth miljo a/s in Copenhagen, Denmark. The process was initially developed as a cyclone preheater system for cement kiln raw meal (limestone and clay). This innovative system provided both capital and energy savings by reducing the required length of the rotary kiln and lowering fuel consumption. The GSA system also showed superior heat and mass transfer characteristics and was subsequently used for the calcination of limestone, alumina, and dolomite. The GSA system for FGD applications was developed later by injecting lime slurry and the recycled solids into the bottom of the reactor to function as an acid gas absorber.
In 1985, a GSA pilot plant was built in Denmark to establish design parameters for SO, and hydrogen chloride (HCI) absorption for waste incineration applications. At this installation SO, and HCI removal efficiency were tested and found to be equal to or better than what could be obtained by competing processes. Shortly before that time, successful experimental results were obtained for SO, and HCI absorption in large laboratory scale experiments corresponding to a 2 MW unit. The engineering data gained from the bench and pilot testing were statistically treated by multiple linear regression analysis resulting in a formula, or mathematical model, predicting the performance of the GSA equipment as a function of the relevant process parameters. The first commercial GSA unit was installed at the KARA Waste-to-Energy Plant at Roskilde, Denmark, in 1988. Currently, there are more than a dozen GSA installations in Europe; most of them are municipal solid waste incinerator applications. The design criteria used for the 10 MW demonstration project were based upon the above mentioned engineering experience and data which were tailored and optimized to suit this particular application.
The three major types of fuels used in commercial and industrial boilers are natural gas, oil and coal, with the greatest quantity of pollutants being generated by high sulfur coal-fired boilers. Having reviewed and calculated emission levels from commercial/industrial boilers, EPA estimated that the uncontrolled emissions from boilers are projected to double the current amount by the year 2000. Presently all boilers with heat input capacity greater than 250 MW are subject to the New Source Performance Standards (NSPS). All smaller boilers are subject to State Implementation Plans (SIPS). The increased emphasis on SO, emission reduction by utility and industrial plants is required by the Clean Air Act Amendments of 1990. Consequently, a simple and economic FGD process, such as GSA, can be utilized as a viable alternative by the small to mid-size plants where a wet FGD system may not be feasible. Recognizing the vast potential market, AirPol was committed to additional research and development expenditures in the demonstration project in order to further develop the GSA technology for coal-fired boiler
-2-
application that will bring a significant share of this market in the 1990’s
1.2.2 Project Oreanization
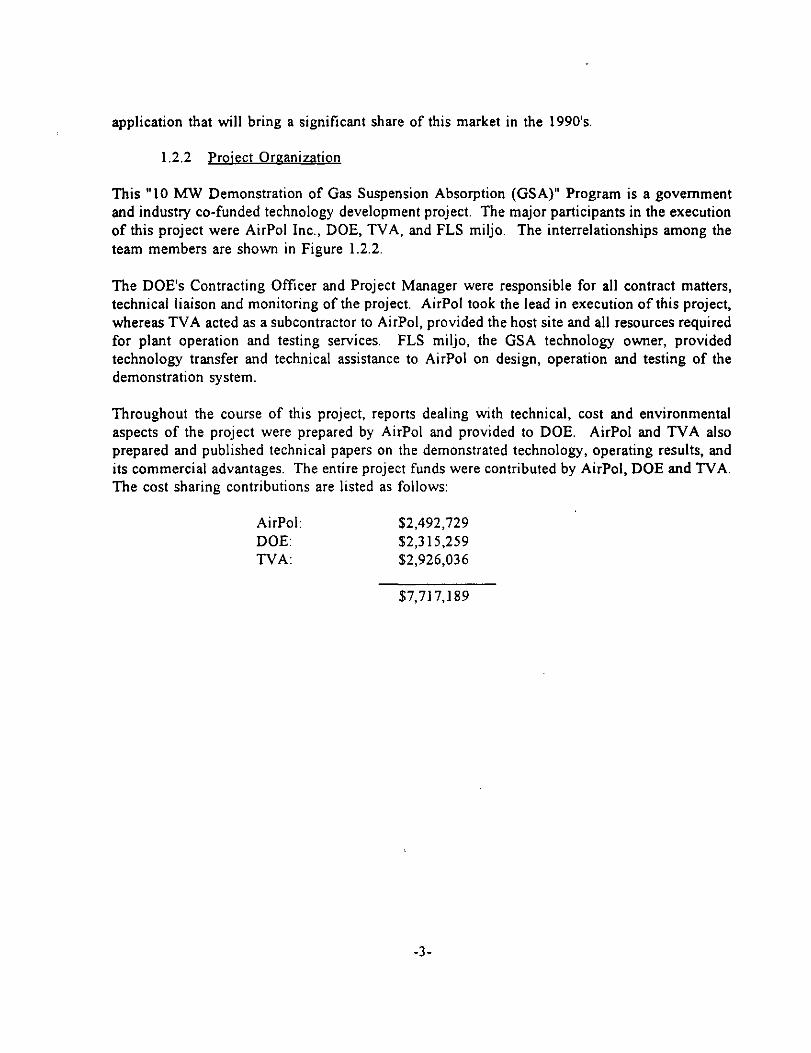
This “10 h4W Demonstration of Gas Suspension Absorption (GSA)” Program is a government and industry co-funded technology development project. The major participants in the execution of this project were AirPol Inc., DOE, TVA, and FLS miljo. The interrelationships among the team members are shown in Figure 1.2.2.
The DOE’s Contracting Officer and Project Manager were responsible for all contract matters, technical liaison and monitoring of the project. AirPol took the lead in execution of this project, whereas TVA acted as a subcontractor to AirPol, provided the host site and all resources required for plant operation and testing services. FLS miljo, the GSA technology owner, provided technology transfer and technical assistance to AirPol on design, operation and testing of the demonstration system.
Throughout the course of this project, reports dealing with technical, cost and environmental aspects of the project were prepared by AirPol and provided to DOE. AirPol and TVA also prepared and published technical papers on the demonstrated technology, operating results, and its commercial advantages. The entire project funds were contributed by AirPol, DOE and TVA. The cost sharing contributions are listed as follows:
AirPol: $2,492,729 DOE: $2,315,259 TVA: $2,926,036
$7.717.189
-3-
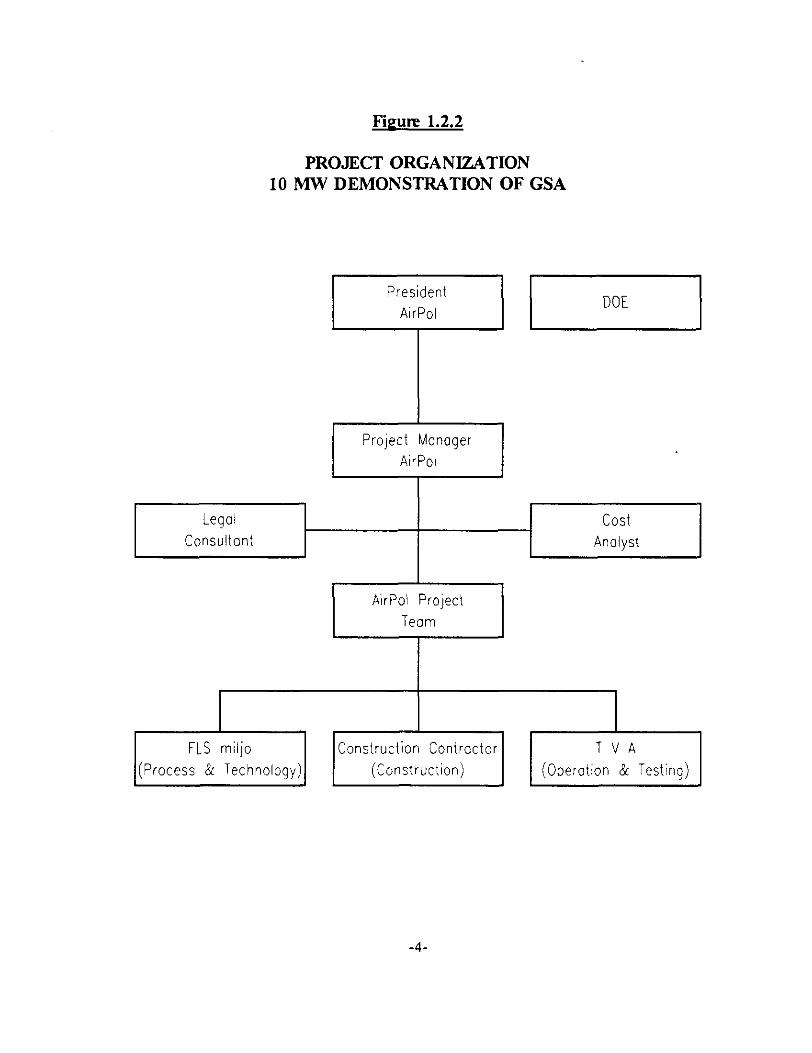
Figure 1.2.2
PROJECT ORGANIZATION 10 MW DEMONSTRATION OF GSA
Legal Consultant
J
cost Analyst
AirPol Project
Team
FLS miljo Construction Contractor TVA
(Process & Technology) (Construction) (Operotion & Testing)
-4-
1.2.3 Proiect Descriotion
The innovative GSA process technology was developed and patented by F.L. Smidth miljo a/s in Copenhagen, Denmark in the 1980’s for removing acid gases from the flue gases generated by many industrial processes. Presently, most of the GSA installations in Europe are municipal solid waste incinerator applications. The demonstration unit at TVA’s CER is the first application of the GSA technology for flue gas desulfurization for a coal-fired boiler in U.S. The entire project involves design, fabrication, construction and testing of the GSA system. AirPol took the lead in execution of the project including in charging of engineering design, supervision of fabrication and construction, initial system start-up, and assistance in operation and testing activities.
As AirPol’s subcontractor, TVA took charge of the plant operation and testing services. At the beginning of the operation/testing phase a number of preliminary tests were conducted to determine the operating limits of the GSA demonstration system, and to define the relative importance of the various operating parameters. After the preliminary tests, a statistically- designed factorial test program was followed. The purpose of this factorial tests was to determine the effect of the process variables on the operation and SO, removal efficiency in the reactor/cyclone and the ESP/baghouse so as to optimize the GSA performance. The air toxics tests, which followed the factorial tests, were conducted to determine the capability of the GSA system in removing HCI, particulates and trace metals. A long-term, 28-day GSA demonstration run program was successfully completed after the air toxics tests. The objective of this program was to demonstrate that the GSA system (reactorlcyclone/ESP) could operate reliably and continuously, 24 hours/day, seven days/week, for a four-week period, while simultaneously achieving more than 90 percent SO, removal and maintaining the ESP emissions below the NSPS for particulates. The testing phase concluded with a 14-day pulsed jet baghouse (PJBH) continuous demonstration run of the GSA system. This test program was designed to confirm that the GSA system with an alternative arrangement, i.e. reactor/cyclone/baghouse, could still achieve the required 90+ percent removal efficiency for SO?, and particulate emissions below NSPS.
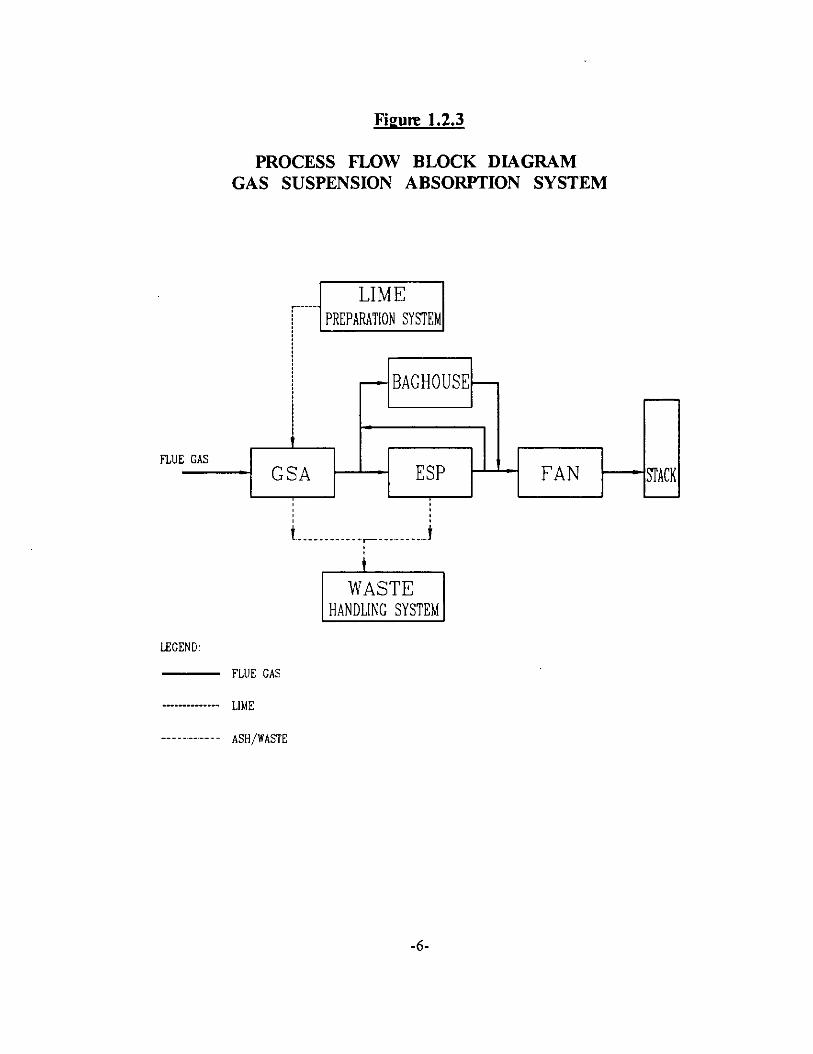
The GSA system brings coal combustion gases into contact with a suspended mixture of solid, containing sulfur-absorbing lime and a spray of fresh lime slurry. After the lime absorbs the sulfur, the solids are separated from the gases in a cyclone and recycled back into the system where they capture additional sulfur. The cleaned flue gases are sent through a dust collector before being released into the atmosphere. The process block diagram for the demonstration project is shown in Figure 1.2.3.
The reagent required for the process of the GSA system can be either hydrated lime or quicklime slaked before feeding into the reactor. The major constituents of the by-product from the GSA process were inert material and calcium sulfite. Other components included calcium sulfate, calcium carbonate, excess calcium hydroxide, small quantities of calcium chloride and very little moisture, i.e., less than 1% The average bulk density of the by-product was 66 lb/f?. The texture of the material can be described as being similar to hour-glass-sand. The material is grey in color.
Fieure 1.2.3
PROCESS FLOW BLOCK DIAGRAM GAS SUSPENSION ABSORPTION SYSTEM
t t FLUE GAS FLUE GAS
- GSA - GSA FAN FAN -STACK -STACK i i
i,. ._ _. . __ ._ _ .,_. _,.,.. . . ..i i,. ._ _. . __ ._ _ .,_. _,.,.. . . ..i
HANDLING SYSTEM HANDLING SYSTEM
LEGEND: LEGEND:
FLUE GAS FLUE GAS
-6-
1.2.4 Site
The project was conducted at the TVA’s Center for Emissions Research (CER) located at Shawnee Fossil Plant, approximately 10 miles northwest of Paducah, in McCracken County, Kentucky. The plant is located on the south bank of the Ohio River on several hundred acres of river floodplain and a low upland terrace developed in thick deposits of unconsolidated clays, silts, and gravel. The active plant area is situated on this terrace, which lies above the SOO-year floodplain. Over the past 15 years, the CER has served as a testground for FGD systems.
The Shawnee Fossil Plant currently operates 10 coal-fired boiler units with a total nameplate capacity of 1735 MW. Units l-8 are tired with low-sulfur coal while units 9 and 10 are able to utilize a high-sulfur coal. Unit 9 supplies 7 % of its total flue gas to the GSA demonstration system. Units 1 through 9 are identical wall-fired Babcock and Wilcox boilers, each having a nameplate generating capacity of 175 MW, while unit 10 is a 160-MW Atmospheric Fluidized Bed Combustion boiler that was retrofitted in the 1980s.
Since the demonstration system is retrofitted into the existing test facility, the space requirement is only for the installation of the GSA reactor and cyclone. A space of 20 feet by 12 feet was used for the installation. Existing facilities such as the lime preparation system, stair tower, ESP, I.D. fan, and associated ductwork were reused for the GSA installation.
1.2.5 Proiect Schedule
The entire demonstration project was divided into three phases and tasks. AirPol began the design work on this project in November 1990, shortly after award of the Cooperative Agreement by DOE in October 1990. At the outset of the project, site access at the CER was delayed for one year by TVA to allow the completion of another project. That caused a one-year delay in this Clean Coal Technology project. The design phase of the GSA project was completed in December 1991. The fabrication and construction of the GSA unit was completed ahead of schedule in early September 1992. The planned operation and testing of the demonstration unit began in November 1992 and was completed in mid-March 1994. The final project schedule is presented in Table 1.2.5-l. As shown in Table 1.2.5-2 the GSA test program consists of the following five parts. The estimated total number of hours for each of these tests are also shown in the Table 1.2.5-2.
. The preliminary or start-up tests were conducted in November and December 1992.
. The factorial tests were performed between January and August 1993
. The air toxics testing was finished between mid-September and mid-October 1993.
. The 28-day continuous GSA demonstration run was executed in late October and November 1993.
.I.
. The 14-day pulsed jet baghouse (PJBH) demonstration run was completed between late February and March 1994.
-8-
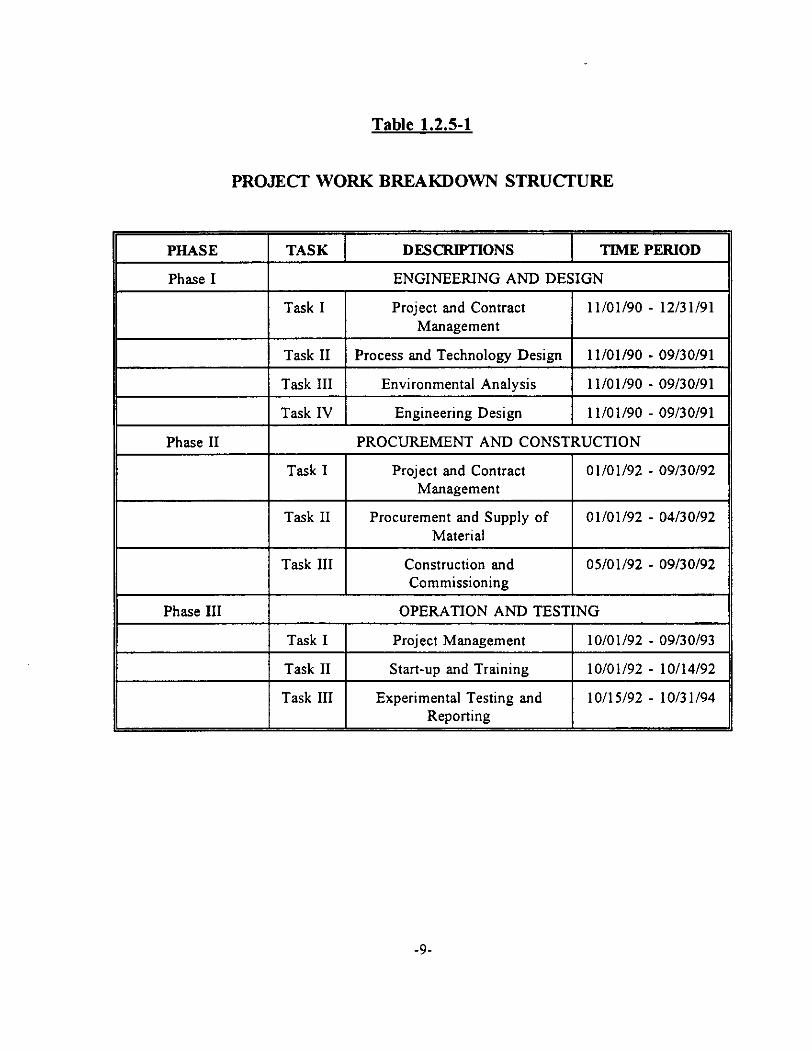
Table 1.2.5-l
PROJEC’I- WORK BREAKDOWN STRUCTURE
II PHASE 1 TASK 1 DEScXIFl’IONS I TEME PERIOD II II Phase I ENGINEERING AND DESIGN
I
I Task1 I Project and Contract 11/01/90 - 12/31/91 Management II
Task II Process and Technology Design 11/01/90 - 09/30/91
Task III Environmental Analysis 11/01/90 - 09/30/91
Phase II
Task IV Engineering Design 1 l/01/90 - 09/30/91
PROCUREMENT AND CONSTRUCTION
Task I
Task II
Project and Contract 01/01/92 - 09/30/92 Management
Procurement and Supply of 01/01/92 - 04/30/92 Material
Task III Construction and Commissioning
05/01/92 - 09/30/92
Phase III
Task I
OPERATION AND TESTING
Proiect Management 10/01/92 - 09/30/93
Task II
Task III
Start-up and Training
Experimental Testing and Reporting
10/01/92 - 10/14/92
10/15/92 - 10/31/94
-9-
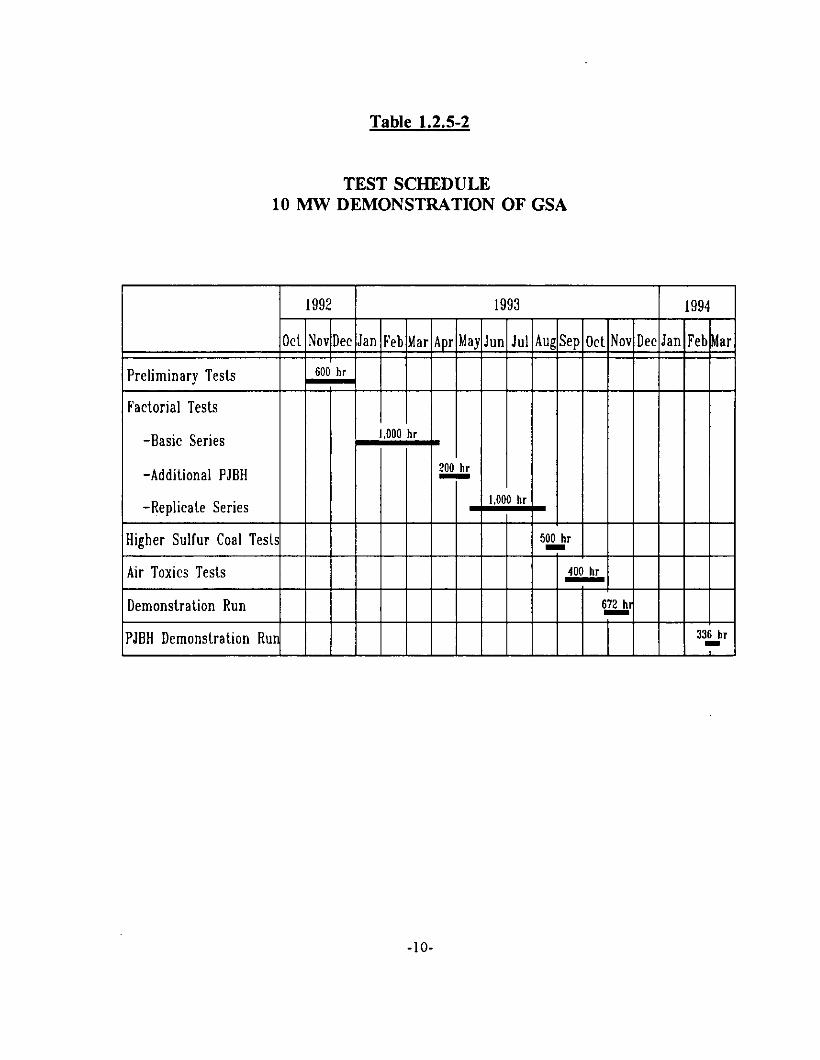
Table 1.2.5-2
TEST SCHEDULE 10 MW DEMONSTRATION OF GSA
1992 1993 1994
Ott Nov Dee Jan Feb Mar Apr May Jun Jul Aug Sep Ott Nov Dee Jan Feb 1
-Additional PJBH
Demonstration Run
PJBH Demonstration Run
672 hi
-lO-
1.3 OBJECIIVES OF THE PROJECT
The “10 MW GSA demonstration system” was installed and tested at the Tennessee Valley Authority the (TVA) Shawnee Fossil Plant at West Paducah, Kentucky, The new GSA system replaced the existing spray dryer that was installed previously as a test unit. The experience gained in designing, fabricating, and constructing the GSA equipment throughout the execution of this project will be used for future commercialization of the GSA system. Results of the operation and experimental testing will be used to further improve plant scale GSA design and operation.
Subsequent to optimization of the GSA system, air toxics testing was performed to determine the GSA’s capability in removing hazardous air pollutants.
Along with the operation and testing of GSA, a 1 MW pulsed jet baghouse was tested to evaluate its long-term reliability and pollutant (both SO, and air toxics) removal performance. The baghouse was connected to the ESP to allow testing of the GSA system in one of three alternative arrangements: GSA with ESP only, GSA with baghouse only, and GSA with ESP followed by baghouse.
The specific technical objectives of the GSA demonstration project were to:
. Effectively demonstrate SO, removal performance in excess of 90% using a high- sulfur U.S. coal.
. Optimize recycle and design parameters to increase efficiencies of lime reagent utilization and SO2 removal.
. Compare SO, removal efficiency and cost with existing Spray DryerIESP technology.
. To obtain data regarding the GSA’s ability to remove air toxics from the waste gas stream (I) with ESP, (2) with baghouse, and (3) with baghouse following ESP.
. To compare the air toxics removal between a GSA with ESP and a GSA with baghouse.
. To compare the SO, removal between a GSA with ESP and a GSA with baghouse.
. To evaluate the merits of a baghouse following an ESP as a polishing unit in both SO, and air toxics removal.
. To evaluate the performance and long-term reliability of the baghouse in GSA applications.
-lI-
1.4 SIGNIFICANCE OF THE PROJECT
The “10 MW Demonstration of Gas Suspension Absorption (GSA)” Project demonstrates the GSA’s ability to effectively remove sulfur dioxide (SO,) from coal-tired flue gas, while achieving a high utilization of reagent lime.
The GSA is distinguished from conventional semi-dry scrubbing processes by its modest space requirement, simple means of introducing reagent to the reactor, direct means of recirculating unused lime, and low reagent consumption.
The results from this demonstration project show that GSA is an effective, economic, and space efficient answer to the SO, removal performance needed by the U.S. utility industry. The importance and significance of this project is demonstrated by the following facts:
. The GSA system was retrofitted into an existing system with extremely tight available space which demonstrates the GSA’s ability of being retrofitted into existing boiler systems.
. The GSA technology was successfully demonstrated at a coal-fired boiler plant with operating conditions that are typical of the average U.S. utility plant, Upon commercialization, this technology will have wide application to the utility industry
. Commercialization of the GSA technology, as part of the objective of this project, will be carried out in time to meet the demand for FGD systems that meet the performance requirements required by the new Clean Air Act Amendments.
. The fact that a conventional spray dryer system has gone through similar tests on the very same boiler provides good comparison of the GSA with competing technologies.
. As part of the GSA demonstration program, a comparison between an electrostatic precipitator and baghouse was made. This comparison demonstrated GSA’s flexible operation in conjunction with different types of dust collectors, and provided valuable information on the GSA performance with either type of dust collector.
. A special test program was conducted to determine GSA’s ability in removing air toxics. This test program has indicated that the GSA system can address the air toxics problem faced by the U.S. utility industry
-12.
1.5 DOE’S ROLE W THE PROJECI’ I
1.5.1 Innovative Clean Coal Technolonv Proeram
The Clean Coal Technology Demonstration Program (CCT Program) is a government and industry co-funded technology development effort to demonstrate a new generation of innovative coal utilization processes in a series of full-scale “showcase” facilities built across the country. These demonstrations will be on a scale large enough to generate all the data required for design, construction, and operation, and for technical/economic evaluation and future commercialization of the process.
The goal of the program is to furnish the U.S. energy marketplace with a number of advanced, more efficient, and environmentally responsive coal-using technologies. These technologies will reduce and/or eliminate the economic and environmental impediments that limit the full consideration of coal as a viable future energy resource.
To achieve this goal, a multi-phased effort consisting of five separate solicitations is administered by the Department of Energy. Projects selected through these solicitations will demonstrate technology options with the potential to meet the needs of energy markets and respond to.relevant environmental considerations.
The third solicitation (CCT-III), issued in 1989, targeted those technologies capable of achieving significant reductions in the emission of SO2 and/or NO, from existing facilities to minimize environmental impacts, such as transboundary and interstate pollution, and/or provide for future energy needs in an environmentally acceptable manner.
In response to the third solicitation, AirPol Inc. submitted a proposal for the design, installation and testing of the GSA system at TVA’s Center for Emission Research (CER). AirPol’s proposal was selected as the result of DOE’s evaluation in terms of technical advantage, cost effectiveness, technical readiness, and business and management performance potential. On July 25, 1990, a Cooperative Agreement was signed for the project entitled “10 MW Demonstration of Gas Suspension Absorption”. The project was approved by Congress in October of 1990, and the Cooperative Agreement for the project was awarded by DOE on October 11, 1990.
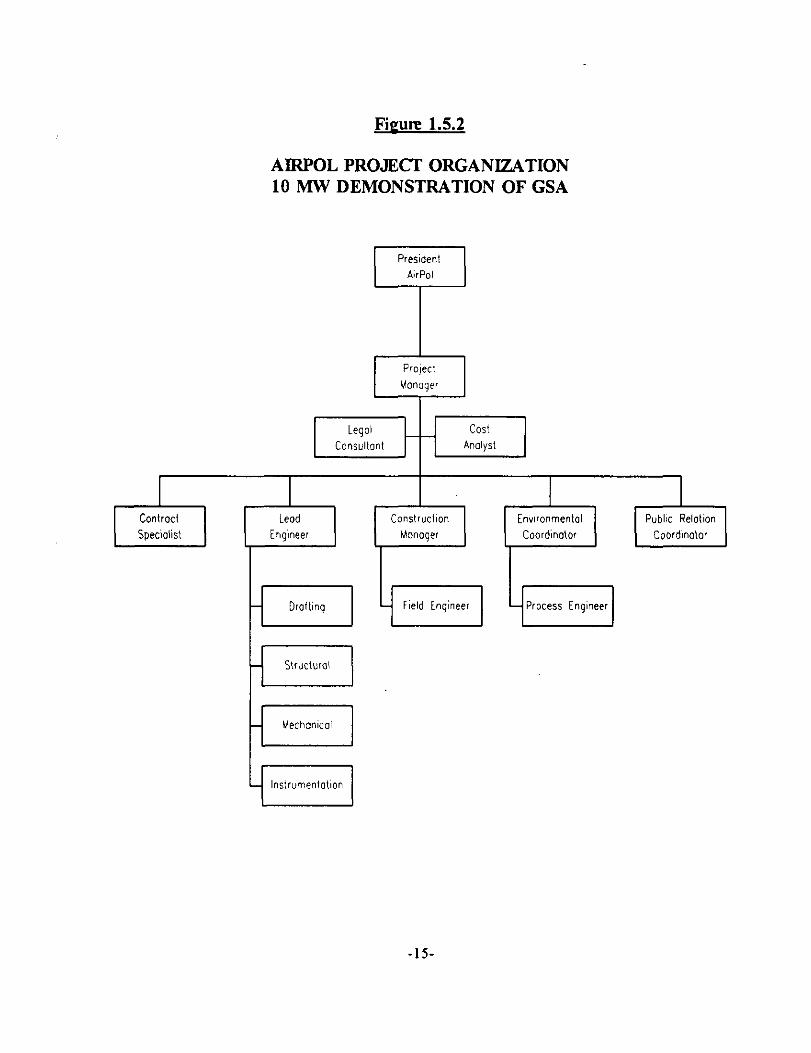
1.5.2 Management Plan and Oreanization Chart
The DOE entered into the Cooperative Agreement with AirPol to conduct this project. The DOE was responsible for monitoring the project and all matters relating to the Cooperative Agreement through the DOE Contracting Officer.
AirPol Inc. was the leader, the center of communication and the major coordinator to all the parties participating in this project. AirPol’s project execution team, as shown in Figure 1.52, consisted of the following members:
-13-
. President - Manager in charge of the overall project, and the prime decision maker in all phases of the project.
. Project Manager - Responsible for the timely completion of all tasks required for the project. Acting as the focal point in steering the progress of the project, and in coordinating with DOE and TVA. Maintaining overall cost and schedule control of the project. Providing supervision and guidance to the project execution team. Coordinating with Purchasing Manager on all procurement tasks. Interfacing with the Process Specialist on all technological and environmental matters.
. Legal Consultant - Providing legal advice to the Project Manager
. Contract Specialist - Responsible for all procurement tasks for the project. Compiling and disseminating project cost data to AirPol’s President and the Project Manager for their review and analysis.
. Environmental Coordinator - Responsible for the preparation of all environmental information required by DOE to fulfil1 its obligation under National Environmental Policy Act (NEPA).
. Construction Manager - Responsible for the management and coordination of all construction and start-up related activities.
-14-
Fieum 1.52
AIRPOL PROJECT ORGANIZATION 10 MW DEMONSTRATION OF GSA
COh3Ct Speciolisl
Lead Engineer
Construction
M0noger Public Motion
Coordlnalar
Inslrumentahn
-15-
2.0 TECHNOLOGY DESCRIPTION
2.1 DFSCRIPTION OF THE DEMONSTRAlED TECHNOMGY
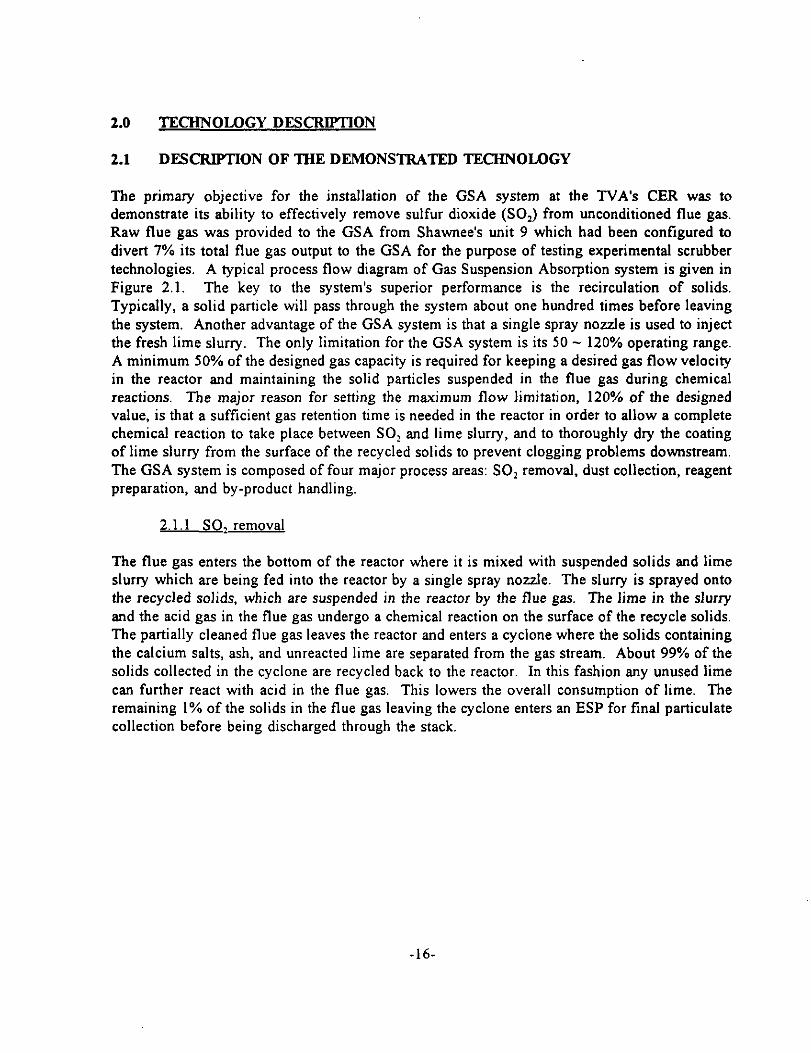
The primary objective for the installation of the GSA system at the TVA’s CER was to demonstrate its ability to effectively remove sulfur dioxide (SO,) from unconditioned flue gas. Raw flue gas was provided to the GSA from Shawnee’s unit 9 which had been configured to divert 7% its total flue gas output to the GSA for the purpose of testing experimental scrubber technologies. A typical process flow diagram of Gas Suspension Absorption system is given in Figure 2.1. The key to the system’s superior performance is the recirculation of solids. Typically, a solid particle will pass through the system about one hundred times before leaving the system. Another advantage of the GSA system is that a single spray nozzle is used to inject the fresh lime slurry. The only limitation for the GSA system is its 50 - 120% operating range. A minimum 50% of the designed gas capacity is required for keeping a desired gas flow velocity in the reactor and maintaining the solid particles suspended in the flue gas during chemical reactions. The major reason for setting the maximum flow limitation, 120% of the designed value, is that a sufficient gas retention time is needed in the reactor in order to allow a complete chemical reaction to take place between SO, and lime slurry, and to thoroughly dry the coating of lime slurry from the surface of the recycled solids to prevent clogging problems downstream. The GSA system is composed of four major process areas: SO, removal, dust collection, reagent preparation, and by-product handling.
2.1.1 SO, removal
The flue gas enters the bottom of the reactor where it is mixed with suspended solids and lime slurry which are being fed into the reactor by a single spray nozzle. The slurry is sprayed onto the recycled solids, which are suspended in the reactor by the flue gas. The lime in the slurry and the acid gas in the flue gas undergo a chemical reaction on the surface of the recycle solids. The partially cleaned flue gas leaves the reactor and enters a cyclone where the solids containing the calcium salts, ash, and unreacted lime are separated from the gas stream. About 99% of the solids collected in the cyclone are recycled back to the reactor. In this fashion any unused lime can further react with acid in the flue gas. This lowers the overall consumption of lime. The remaining 1% of the solids in the flue gas leaving the cyclone enters an ESP for final particulate collection before being discharged through the stack.
-16

Figure 2.1
PROCESS FLOW DIAGRAM GAS SUSPENSION ABSORPTION SYSTEM
Clean flue A
Reaclor
Recirculation
np Water
9 -iJ Proportioning
a w-n- Water nraccnr Dllrn,.
Lime slurry preparation
-17-
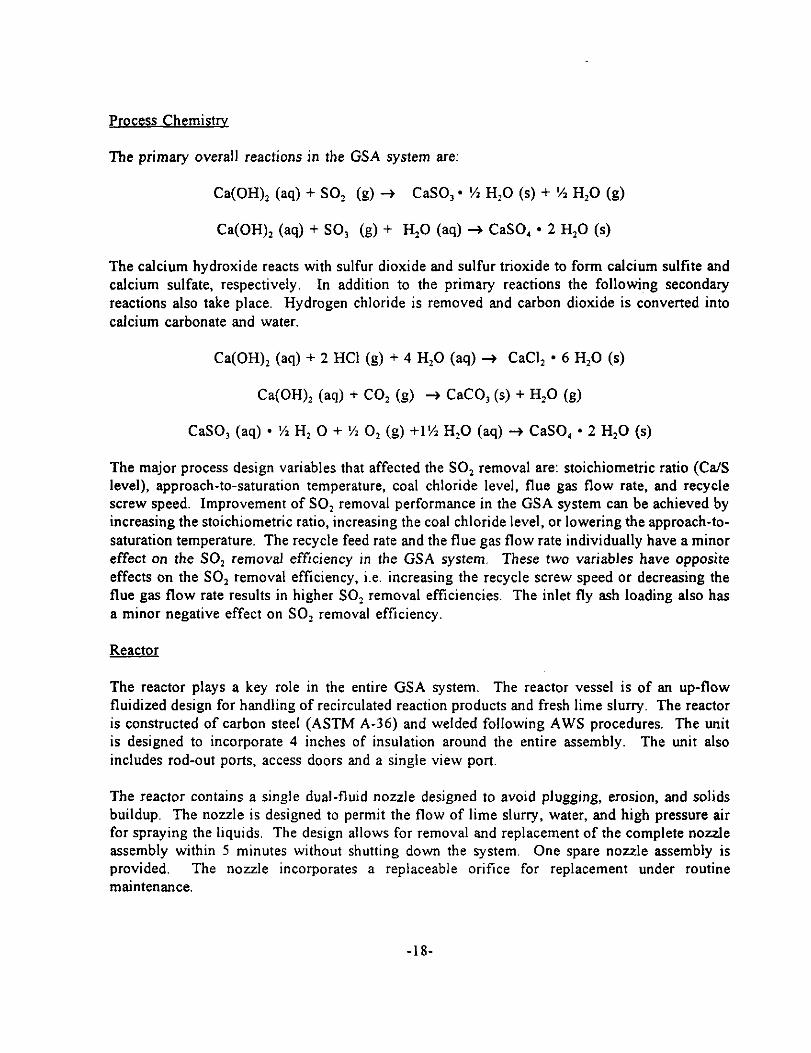
Process Chemistw
The primary overall reactions in the GSA system are:
Ca(OH), (aq) + SO, (g) + CaSO,* % H,O (s) + % H,O (g)
Ca(OH), (aq) + SO, (g) + H,O (aq) + CaSO, l 2 H,O (s)
The calcium hydroxide reacts with sulfur dioxide and sulfur trioxide to form calcium sultite and calcium sulfate, respectively. In addition to the primary reactions the following secondary reactions also take place. Hydrogen chloride is removed and carbon dioxide is converted into calcium carbonate and water.
Ca(OH), (aq) + 2 HCl (g) + 4 H,O (aq) + CaCI, * 6 H,O (s)
WOW2 (ad + CO, (g) -$ CaCO, (9 + H,O (g)
CaSO, (aq) * % H, 0 + % 0, (g) +l% H,O (aq) -B CaSO, l 2 H,O (s)
The major process design variables that affected the SO, removal are: stoichiometric ratio (Ca/S level), approach-to-saturation temperature, coal chloride level. flue gas flow rate, and recycle screw speed. Improvement of SO, removal performance in the GSA system can be achieved by increasing the stoichiometric ratio, increasing the coal chloride level, or lowering the approach-to- saturation temperature. The recycle feed rate and the flue gas flow rate individually have a minor effect on the SO, removal efficiency in the GSA system. These two variables have opposite effects on the SO, removal efficiency, i.e. increasing the recycle screw speed or decreasing the flue gas flow rate results in higher SO, removal efficiencies. The inlet fly ash loading also has a minor negative effect on SO, removal efficiency.
Reactor
The reactor plays a key role in the entire GSA system. The reactor vessel is of an up-flow fluidized design for handling of recirculated reaction products and fresh lime slurry. The reactor is constructed of carbon steel (ASTM A-36) and welded following AWS procedures. The unit is designed to incorporate 4 inches of insulation around the entire assembly. The unit also includes rod-out ports, access doors and a single view port.
The reactor contains a single dual-fluid nozzle designed to avoid plugging, erosion, and solids buildup. The nozzle is designed to permit the flow of lime slurry, water, and high pressure air for spraying the liquids. The design allows for removal and replacement of the complete nozzle assembly within 5 minutes without shutting down the system. One spare nozzle assembly is provided. The nozzle incorporates a replaceable orifice for replacement under routine maintenance.
-18-
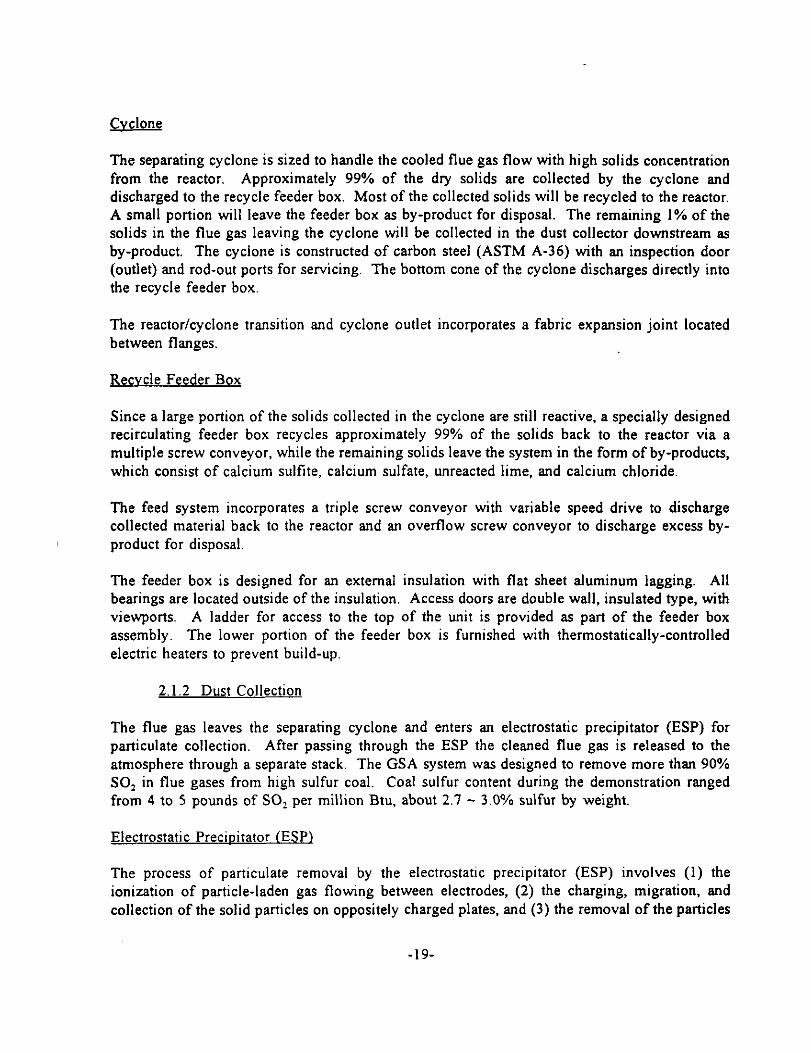
Cvclone
The separating cyclone is sized to handle the cooled flue gas flow with high solids concentration from the reactor. Approximately 99% of the dry solids are collected by the cyclone and discharged to the recycle feeder box. Most of the collected solids will be recycled to the reactor. A small portion will leave the feeder box as by-product for disposal. The remaining 1% of the solids in the flue gas leaving the cyclone will be collected in the dust collector downstream as by-product. The cyclone is constructed of carbon steel (ASTM A-36) with an inspection door (outlet) and rod-out ports for servicing. The bottom cone of the cyclone discharges directly into the recycle feeder box.
The reactor/cyclone transition and cyclone outlet incorporates a fabric expansion joint located between flanges.
Recvcle Feeder Box
Since a large portion of the solids collected in the cyclone are still reactive, a specially designed recirculating feeder box recycles approximately 99% of the solids back to the reactor via a multiple screw conveyor, while the remaining solids leave the system in the form of by-products, which consist of calcium sulfite, calcium sulfate, unreacted lime, and calcium chloride.
The feed system incorporates a triple screw conveyor with variable speed drive to discharge collected material back to the reactor and an overflow screw conveyor to discharge excess by- product for disposal.
The feeder box is designed for an external insulation with flat sheet aluminum lagging. All bearings are located outside of the insulation. Access doors are double wall, insulated type, with viewports. A ladder for access to the top of the unit is provided as part of the feeder box assembly. The lower portion of the feeder box is furnished with thermostatically-controlled electric heaters to prevent build-up.
2.1.2 Dust Collection
The flue gas leaves the separating cyclone and enters an electrostatic precipitator (ESP) for particulate collection. After passing through the ESP the cleaned flue gas is released to the atmosphere through a separate stack. The GSA system was designed to remove more than 90% SO, in flue gases from high sulfur coal. Coal sulfur content during the demonstration ranged from 4 to 5 pounds of SO, per million Btu, about 2.7 - 3.0% sulfur by weight.
Electrostatic Precioitator (ESP)
The process of particulate removal by the electrostatic precipitator (ESP) involves (1) the ionization of particle-laden gas flowing between electrodes, (2) the charging, migration, and collection of the solid particles on oppositely charged plates, and (3) the removal of the particles
-19-
from the plates.
The ESP installed at the CER is a relatively modem, four-field unit with 10 inch plate spacing and eight (8) parallel gas passages. The specific collection area of the ESP is about 440 ft*/kacfm under the cooled, humidified flue gas conditions. The aspect ratio is 1.6. Each field has a separate hopper and double-flap discharge valve for solids storage and removal. Both discharge and collector electrodes are rapped by tumbling hammers on a rotating shaft. A microprocessor-based system controls the voltage to the transformer-rectifier and sets the required rapping sequence.
Baehouse
A 1 MW pulsed jet type baghouse was incorporated to evaluate its long-term reliability and pollutant (SO,, air toxic, and particulates) removal performance. The baghouse was connected to the ESP to allow testing of the GSA system in one of three alternative arrangements: GSA with ESP only, GSA with baghouse only, and GSA with ESP followed by baghouse.
Dust-laden gas enters the inlet manifold of the baghouse where a poppet valve system directs the flow to hopper areas under the zones or compartments. The dust-laden gas travels upward uniformly around the filter bags suspended above the hoppers in the zone. As the gas is drawn through the cage-supported filter bags, dust particles collect on the outside of the bags. Clean filtered gas continues upward inside the bags to the clean gas plenum section. The cleaned gas then passes through a poppet valve into the outlet exhaust manifold.
This baghouse was designed for an air to cloth ratio of 4.0 to 1. The bag material is Dralon-T used over a steel cage.
2.1.3 Reaeent Preoaration
The lime is delivered by trucks in the form of pebble lime (CaO), and pneumatically unloaded to a lime storage silo. The silo has a capacity of 107 tons of pebble lime, and is complete with the necessary level indication, bin vent filter, volumetric feeder, till pipe, controls and instrumentation, caged access ladders, handrails and inspection doors for servicing. The lime is metered from the lime silo as needed to a detention type lime slaker. The lime and water rates to the slaker are proportioned to produce a smooth hydrated milk-of-lime slurry, of desired consistency. The lime slurry from the slaker is pumped to a storage tank. As needed in the process, the lime slurry is further pumped to the lime slurry feed tank. The slaked lime slurry, Ca(OH),, is then pumped to the dual-fluid nozzle at the base of the reactor.
2.1.4 Bv-Product Handling
By-products from the feeder box overflow and ESPPoaghouse hoppers are discharged into the bucket elevator by screw conveyors. The bucket elevator conveys the material to a by-product storage silo. The solids in the silo are fed to the recycle mix tank with a capacity of 5,200 gallon
-2o-
where the solids are mixed with water to form a 10% slurry. The resulting diluted slurry is pumped to the ash pond for ultimate disposal with the fly ash and bottom ash from the boilers,
-21.
2.2 DESCRIPTION OF THE DEMONSTFtATED FACILITDZS
Minimal ground space requirement is one of the salient features of the GSA system. As shown in Figure 2.1, the GSA system consists of:
. A fluidized reactor,
. A separating cyclone and feeder box for recycling material to the reactor.
. A dust collector removing particulates from the cleaned gas
. A lime slurry preparation system.
. An ash storage and handling system
Some existing equipment was reused to minimize interface work and save equipment cost. The equipment reused included the following:
. Air compressor
. Lime slurry preparation system,
. Electrostatic precipitator (ESP)
. Ash handling system
. Motor control panel modified to add additional circuit breakers.
. Instrumentation: Inlet and outlet gas flow indication; inlet and outlet flue gas SO, and 0, monitors; temperature indication at the GSA inlet, cyclone outlet and ESP outlet; pressure indication at GSA inlet, ESP inlet and ESP outlet; lime slurry flow indication.
The existing Foxboro Control was used for the GSA system process control and data acquisition, but the start-up and shut-down sequence was manually performed. This is consistent with the previous operation of the spray dryer system and prefers by TVA operating/testing unit. The Foxboro Control was re-programmed to perform the GSA process control and monitoring as well as alarm annunciations. For more detailed information about system facilities please refer to AirPol’s Public Design Report of section 3.5.
-22-
2.3 PROPRIETARY INFORMATION
The following is a list of the proprietary items:
. Dimensions of the fluidized reactor, cyclone, feeder box, ESP and baghouse
. Detailed inner structure/configuration of the equipment.
. Critical process and equipment design parameters.
. Critical operation control logic end set points.
. Piping and instrument diagrams.
. Mathematical formula and correlations for SO, and particulate removal.
-23-
2.4 SIMPLIFIED PROCESS FLOW DIAGRAM
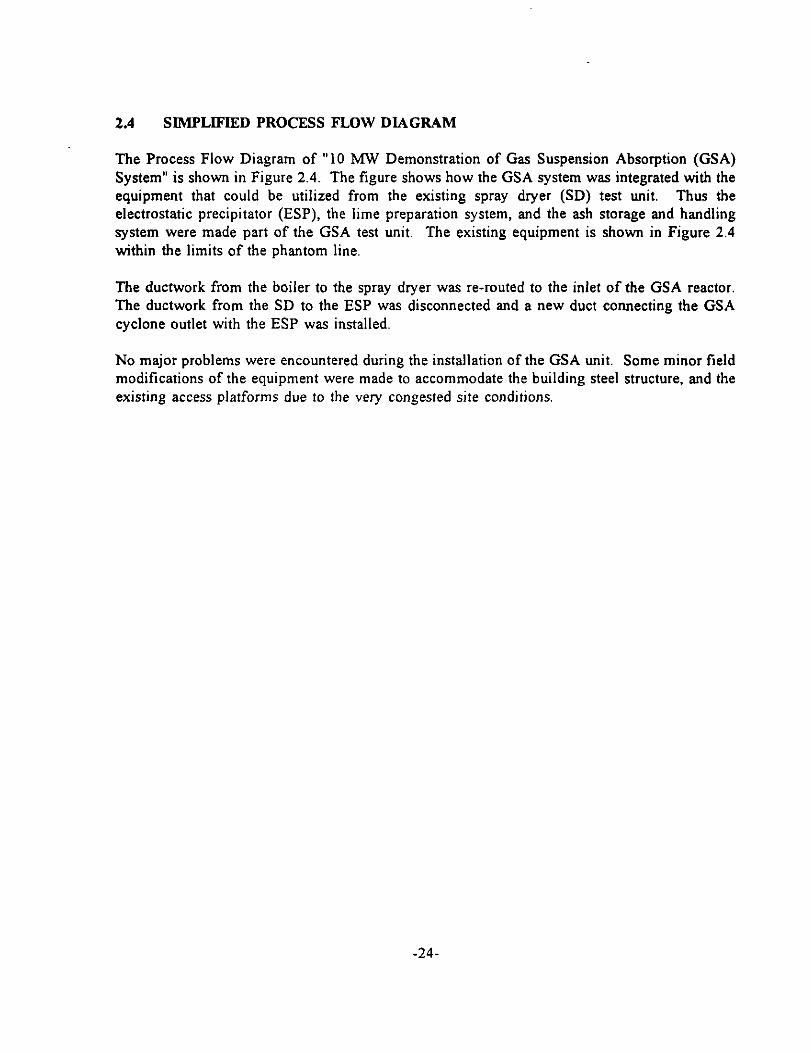
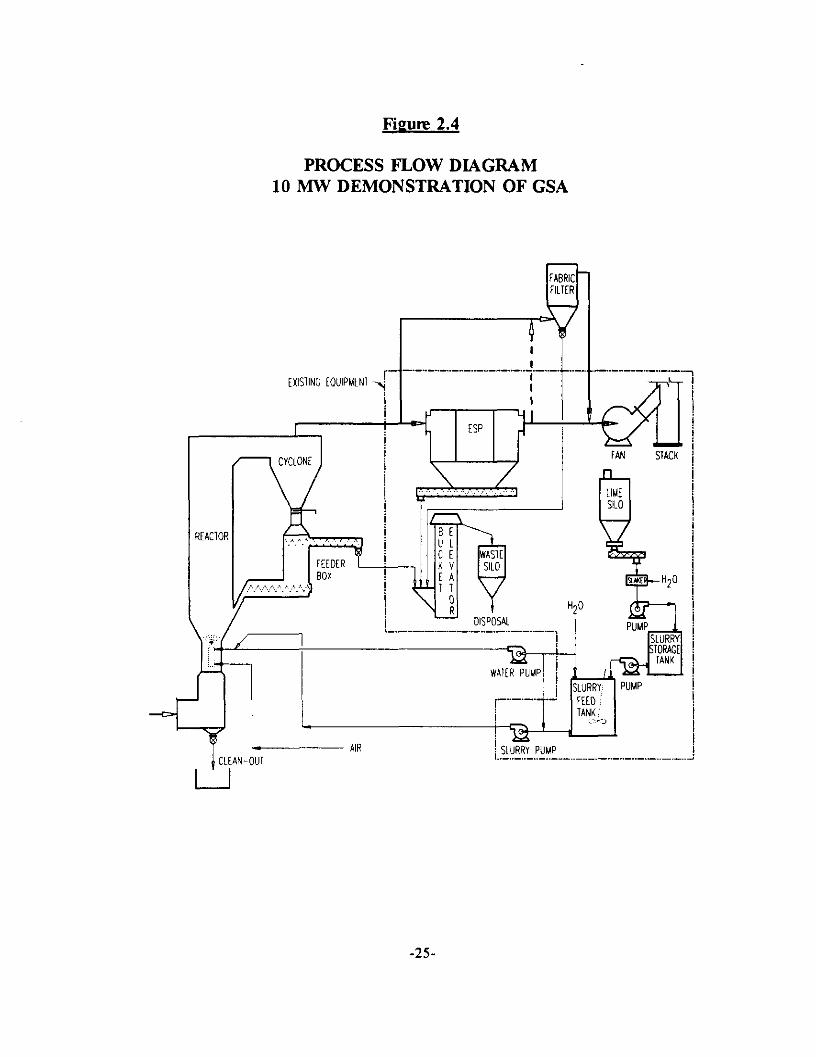
The Process Flow Diagram of “10 MW Demonstration of Gas Suspension Absorption (GSA) System” is shown in Figure 2.4. The figure shows how the GSA system was integrated with the equipment that could be utilized from the existing spray dryer (SD) test unit. Thus the electrostatic precipitator (ESP), the lime preparation system, and the ash storage and handling system were made part of the GSA test unit. The existing equipment is shown in Figure 2.4 within the limits of the phantom line.
The ductwork from the boiler to the spray dryer was re-routed to the inlet of the GSA reactor. The ductwork from the SD to the ESP was disconnected and a new duct connecting the GSA cyclone outlet with the ESP was installed.
No major problems were encountered during the installation of the GSA unit. Some minor field modifications of the equipment were made to accommodate the building steel structure, and the existing access platforms due to the very congested site conditions.
-24.
Fitam 2.4
PROCESS FLOW DIAGRAM 10 MW DEMONSTRATION OF GSA
tXlSllNG [OUIPMLNl 1
I
RLAClOR
r- ‘i 1
f I ! ! I I !
I I _ -.-..-..-.. -..-..-..- --..-..- + I I
-
II- I
,.-.. --..- ..--..-..-. -_ Jf2Ti
FAN SIACK
-25
2.5 STRF.AM DATA
Table 2.5-l shows data for three calculated design cases as well as the operating conditions for the 28-day continuous demonstration run. The GSA system was designed for an operating range from “Minimum Case” to “Maximum Case” with the actual operating condition expected to be as shown in the “Design Case” column. These operating parameters are close to the levels that can be expected for a GSA unit applied to a “normal” wall fired utility boiler burning pulverized high-sulfur coal and equipped with a Ljungstrom type air preheater.
The Operating Case proved to be very close to the Design Case with the exception of the Approach-to-Saturation-Temperature that was selected at 18 “F based upon preliminary test results. The removal efficiencies for both particulate and SO, exceeded the design data.
The lower portion of Table 2.5-l shows the design and operating data for the condition where the baghouse was connected in series with the ESP. The design removal efficiencies for both particulate and SO, were also exceeded with this arrangement.
Figure 2.5 and Table 2.5-2 together presents the actual stream data for the “Design Case” including lime slurry, cooling water, compressed air for slurry atomization, and amount of by- product generated. Please refer to the AirPol’s Public Design Report for detailed calculations of the design cases, and TVA’s final technical reports for performance and operating results.
-26-
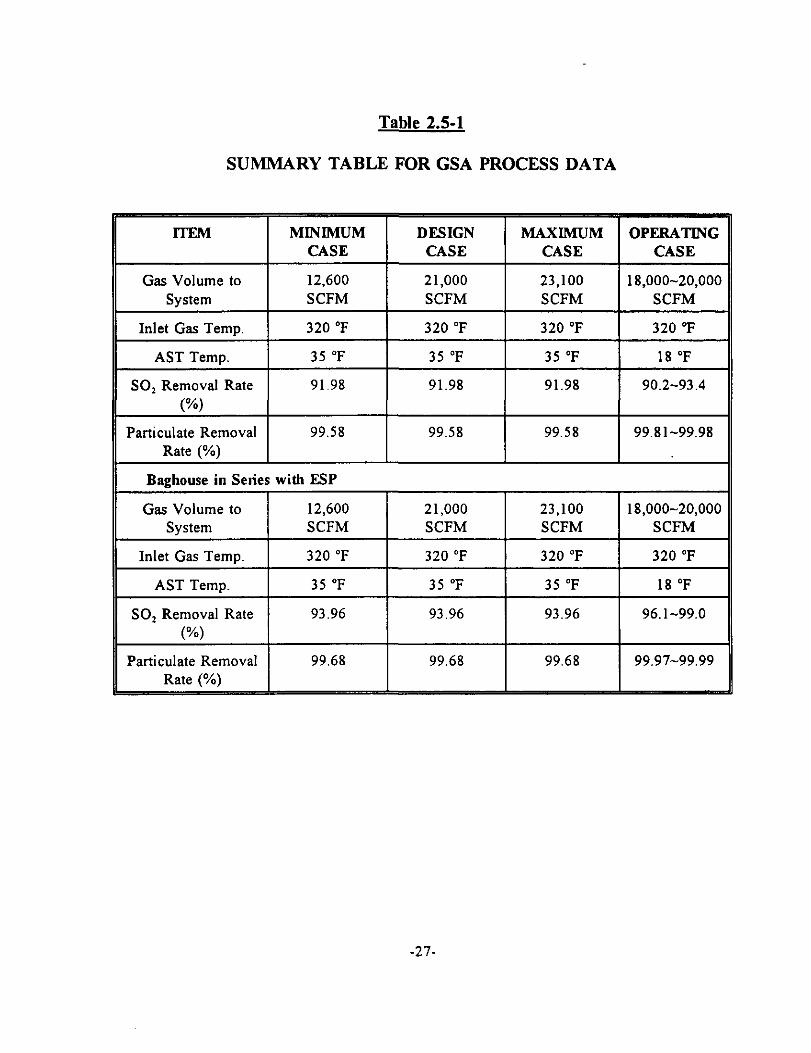
Table 2.5-l
SUMMARY TABLE FOR GSA PROCESS DATA
MINIMUM CASE
DESIGN CASE
MAXIMUM OPERATING CASE CASE
Gas Volume to System
Inlet Gas Temp.
12,600 21,000 23,100 18,000-20,000 SCFM SCFM SCFM SCFM
320 “F 320 “F 320 “F 320 “F
AST Temp.
SO, Removal Rate (“A)
Particulate Removal Rate (%)
35 “F 35 “F 35 “F 18 “F
91.98 91.98 91.98 90.2-93.4
99.58 99.58 99.58 99.81-99.98
Baghouse in Selies with ESP
Gas Volume to 12,600 System SCFM
21,000 23,100 18,000-20,000 SCFM SCFM SCFM
II Inlet Gas Temo. 320 “F I 320 “F I 320 “F I 320 “F
35 “F 35 “F 18 “F
II SO, Removal Rate 93.96 93.96 I
93.96 96.1-99.0
Particulate Removal 99.68 99.68 99.68 99.97-99.99 Rate (%)
t
-2l-
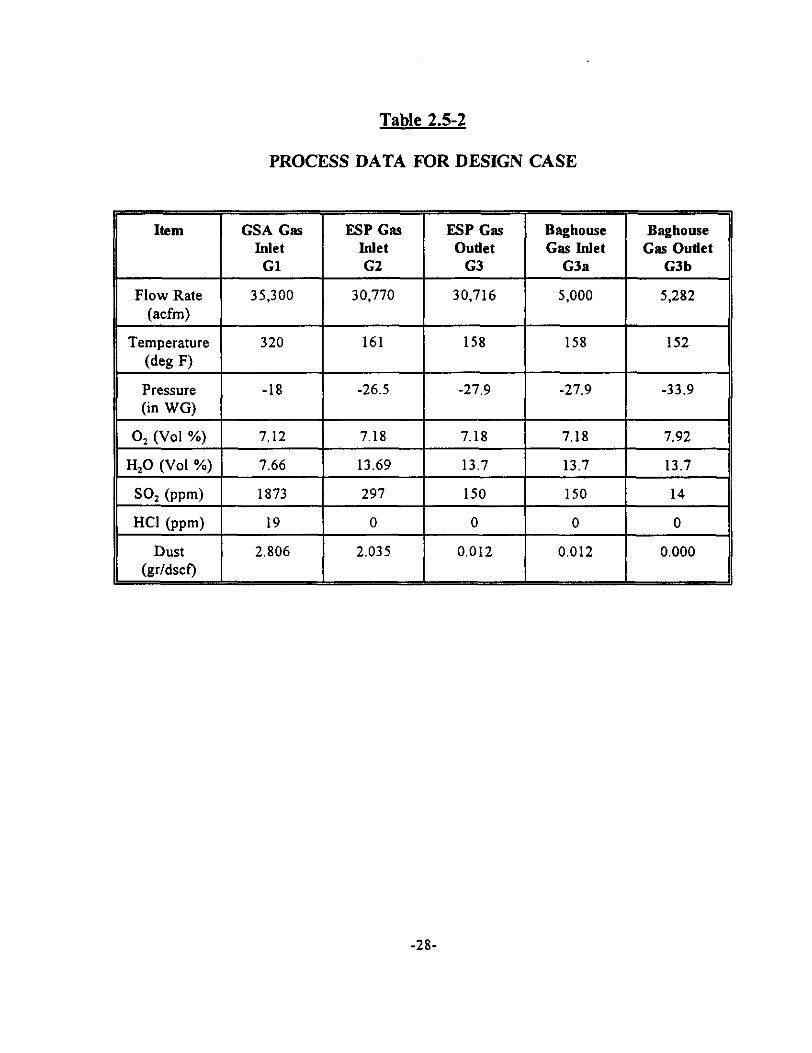
Table 2.5-2
PROCESS DATA FOR DESIGN CASE
Item
Flow Rate
GSA Gas ESP Gas Inlet Wet
Gl G2
35,300 30,770
ESP Gas Outlet
G3
30,716
Baghouse Gas Inlet
G3a
5.000
Baghouse Gas Outlet
G3b
5,282
Temperature 0% F)
320 161 158 158 152
I Pressure -18 -26.5 -27.9 -27.9 -33.9 (in WG)
0, (Vol %) 7.12 7.18 7.18 7.18 7.92
11 H-0 NoI %1 1 7.66 I 13.69 I 13.7 I 13.7 I 13.7 II
-28-
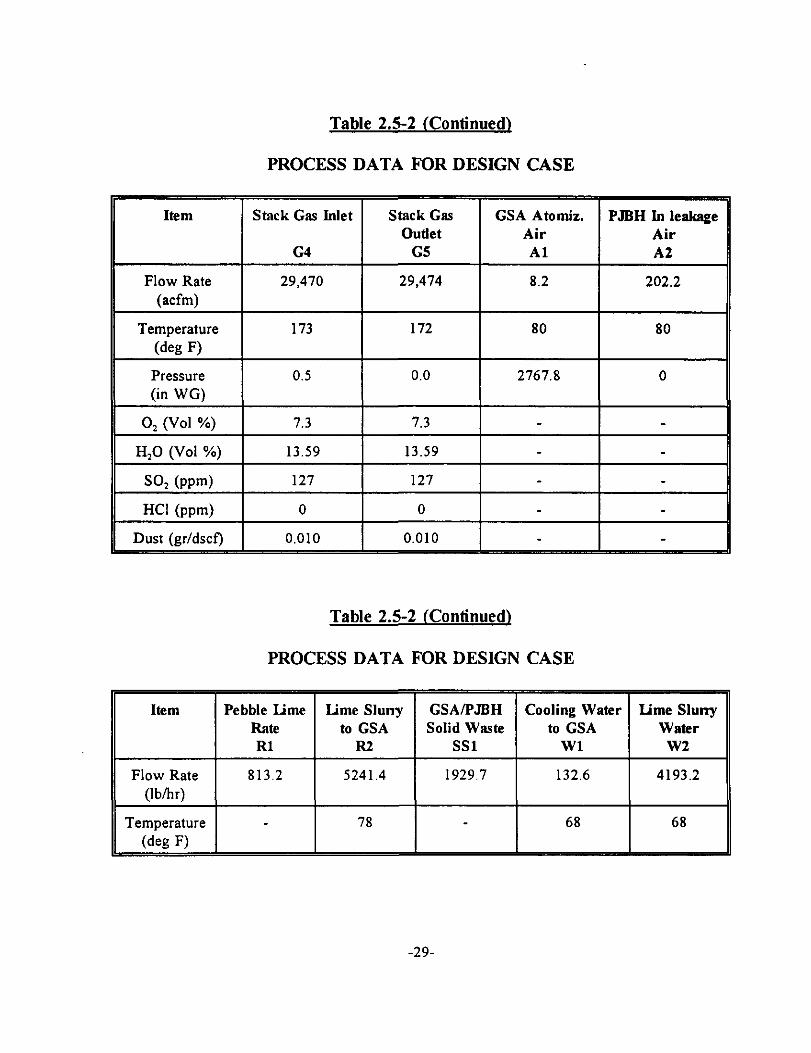
Table 2.5-2 (Continued)
PROCESS DATA FOR DESIGN CASE
Table 2.5-2 (Continued)
PROCESS DATA FOR DESIGN CASE
Item Pebble Lime Lime Sluny GSA/PJBH Cooling Water Lime Sluny Rate to GSA Solid Waste to GSA Water Rl R2 SSl Wl w2
Flow Rate (lbihr)
Temperature Wg F)
813.2 5241.4 1929.7 132.6 4193.2
- 78 68 68
-29-
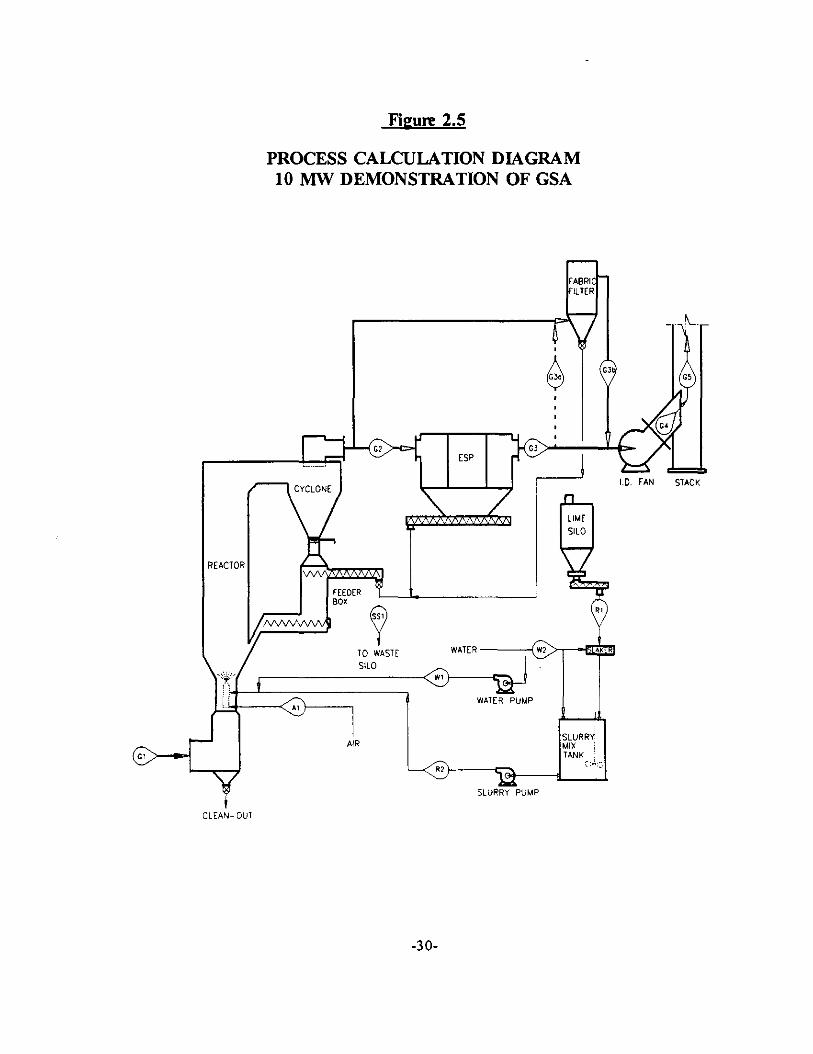
Fimm 2.5
PROCESS CALCULATION DIAGRAM 10 MW DEMONSTRATION OF GSA
I I
REACTOR
TO krc SILO
-7 7 AIR
a WATER PUMP
I.D. F.&N STACK LIME SlLO a_ ^ RI
t CLEAN-OUT
-3o-
2.6 PROCESS AND INSTRUMENTATION DIAGRAMS
There are three major control loops in this GSA control system as shown in the process control schematic diagram, Figure 2.6.
The first control loop, Recycled Solid Control, administers the flow of recycled solids to the reactor based on the amount of flue gas entering the system.
The second control loop, Feed Water Rate Control, adjusts the speed of the water pump and ensures that the flue gas is cooled sufficiently to optimize the chemical process. The amount of water added into the system is governed by the temperature of the flue gas exiting the cyclone.
The third control loop, Lime Feed Rate Control, governs lime addition. This is accomplished by continuously monitoring the acid gas content in the outlet flue gas and comparing it with the required emission level. This control loop enables direct proportioning of the lime feed according to monitored results and further contributes to maintaining a low level of lime consumption.
The control parameters are established during initial start-up and can be adjusted during normal operation according to changes in operating conditions.
Any failure of mechanical or process equipment, such as pumps, motors, air compressors, etc. during operation, will be annunciated in the control room.
-31-

Figure 2.6
PROCESS CONTROL SCHEMATIC DIAGRAM GAS SUSPENSION ABSORPTION SYSTEM
I lolumetric flow rate
I l
Water Requirement
Lime Requiremenl
-32-
3.0 UPDATE OF THE PUBLIC DESIGN REPORT
Since no changes have been made to the design after the issuance of the Public Design Report, there is no update to the Public Design Report.
-33-
4.0 DEMONSTRATION PROGRAM
4.1 OPERATING PROCEDURES
During start-up of the GSA system the equipment in the system is started up in a sequential order as follows:
1. Plant ash conveying system 2. GSA ash conveying system 3. GSA heating system 4. ESP 5. I.D. fan 6. Solid recirculation system 7. Air compressor 8. Water pump 9. Lime slurry pump
During initial start-up, the system is “primed” by adding sand or fly ash to the feeder box. In addition, the boiler flue gas is allowed to flow through the GSA to enable some of the fly-ash to be collected by the cyclone to help till the feeder box. Once the feeder box is 40% full, and a minimum flue gas flow rate has been achieved, the feeder box screw conveyor is started. At TVA, the solids recirculation rate was controlled by setting the speed on screw conveyor, although the option of using the first control loop also existed. With commercial applications the solids injection rate will be controlled by the first control loop as discussed in section 2.6. The air compressor, water pump and lime pump are started, in this sequence. The automatic control loops are now activated. The desired cyclone outlet temperature is maintained by controlling the speed on the water pump, and the SO, controls the lime slurry flow rate. At TVA, the third control loop, that controls the lime slurry flow to the GSA by adjusting the speed on the lime slurry pump, was set up with three options. The lime slurry flow could be adjusted according to the required:
1. SO, removal efficiency 2. Stoichiometric ratio 3. SO, emission at the stack. This option will be used on commercial GSAs
When shutting down the GSA system, the start-up sequence is reversed. The lime slurry pump is stopped first and the slurry pipe is flushed with water. The water pump is then stopped. By this time the nozzle will also be flushed out. The air compressor is stopped next. Recirculation of the solids continues for some time. This will ensure that the material is dry and warm. The slide gate under the cyclone is closed and the recirculated solids are allowed to collect in the cyclone hopper. The feeder box screw conveyor continues to run until the feeder box is empty. By collecting the solids in the cyclone during shut-down, the initial start-up procedure of accumulating the solids can be eliminated. The heating elements on the cyclone hopper will maintain a preset minimum temperature to prevent the material from caking. The heaters for the
-34-
solid storage and handling system shall also remain on, until the system is completely emptied. A summary table of the simplified operating procedures are shown in Table 4.1-1.
Table 4.1-2 is an operator checklist for the major equipment and instrumentation on the demonstration unit. Most of the major instruments. including indicators, controllers, and alarms can be monitored and controlled from the control room.
-35-
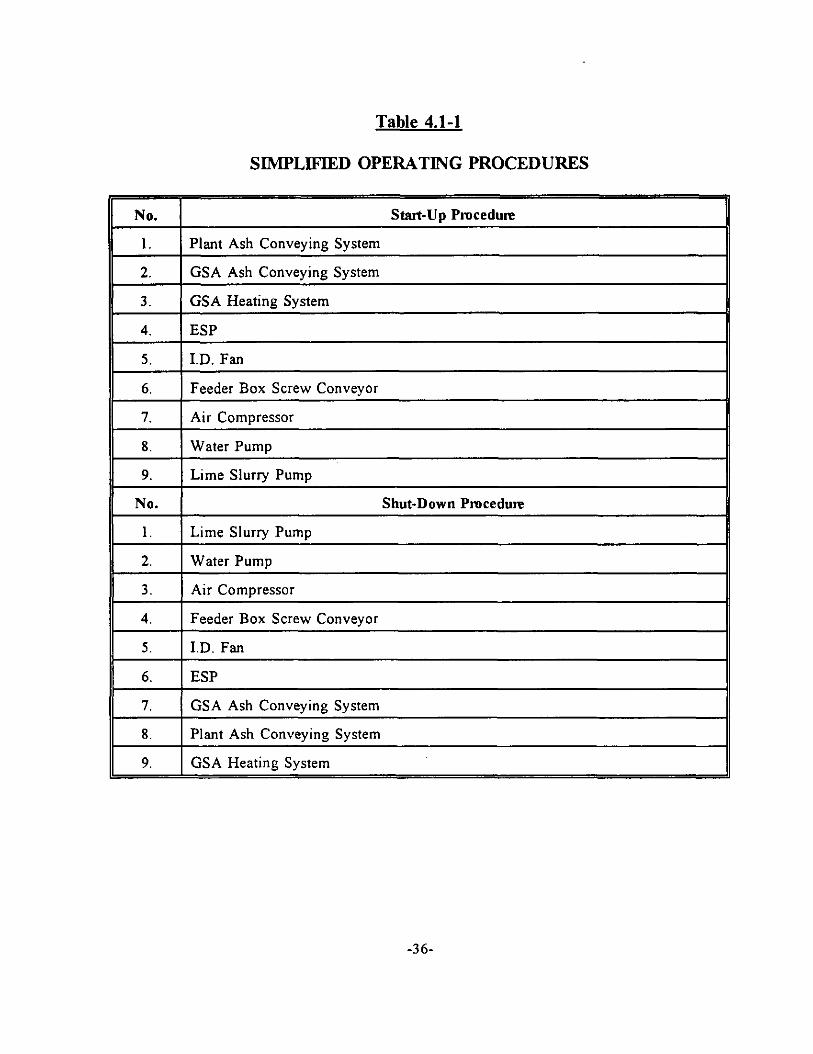
Table 4.1-1
SIMPLIFIED OPERATING PROCEDURES
Strut-Up Procedure -11 1. Plant Ash Conveying System
2. GSA Ash Conveying System
I 3. GSA Heating System
4. ESP
5. I.D. Fan
6. Feeder Box Screw Convevor
7. Air Compressor
8. Water Pumo
tt No. t Shut-Down Pmcedum
II 1. I Lime Slurry Pump
II 2. I Water Puma
I( 3. ) ATCompressor ~~~ ~~~ II 4. Feeder Box Screw Conveyor
5. I.D. Fan
6. ESP
7. GSA Ash Conveying System
8. Plant Ash Conveying System
9. GSA Heating System
-36-
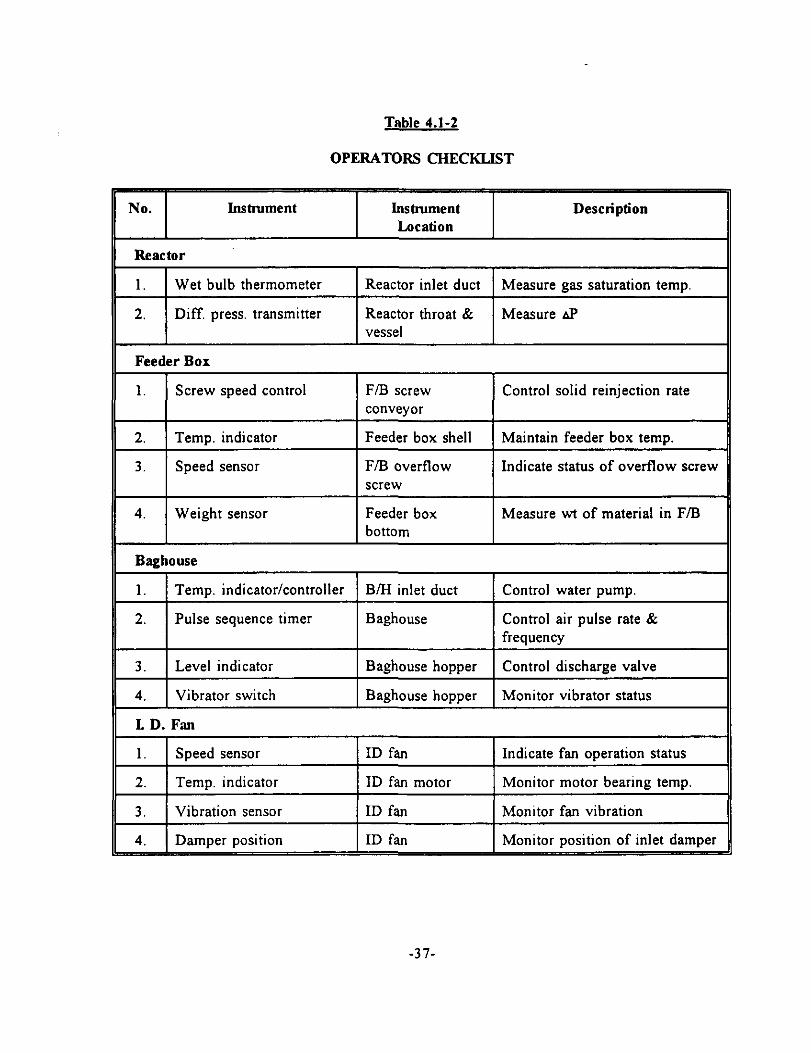
Table 4.1-2
OPERATORS CHECKLIST
Descliption
Reactor
1. Wet bulb thermometer Reactor inlet duct Measure gas saturation temp.
2. Diff. press. transmitter Reactor throat & Measure AP vessel
Feeder Box
1. Screw speed control F/B screw Control solid reinjection rate conveyor
2. Temp. indicator Feeder box shell Maintain feeder box temp.
3. Speed sensor F/B overflow Indicate status of overflow screw screw
4. Weight sensor Feeder box Measure wt of material in F/B bottom
Baghouse
1. Temp. indicator/controller B/H inlet duct Control water pump.
2. Pulse sequence timer Baghouse Control air pulse rate & frequency
3. Level indicator Baghouse hopper Control discharge valve
4. Vibrator switch Baghouse hopper Monitor vibrator status
LD.Fan
1. Speed sensor ID fan Indicate fan operation status
2. Temp. indicator ID fan motor Monitor motor bearing temp.
3. Vibration sensor ID fan Monitor fan vibration
-37-
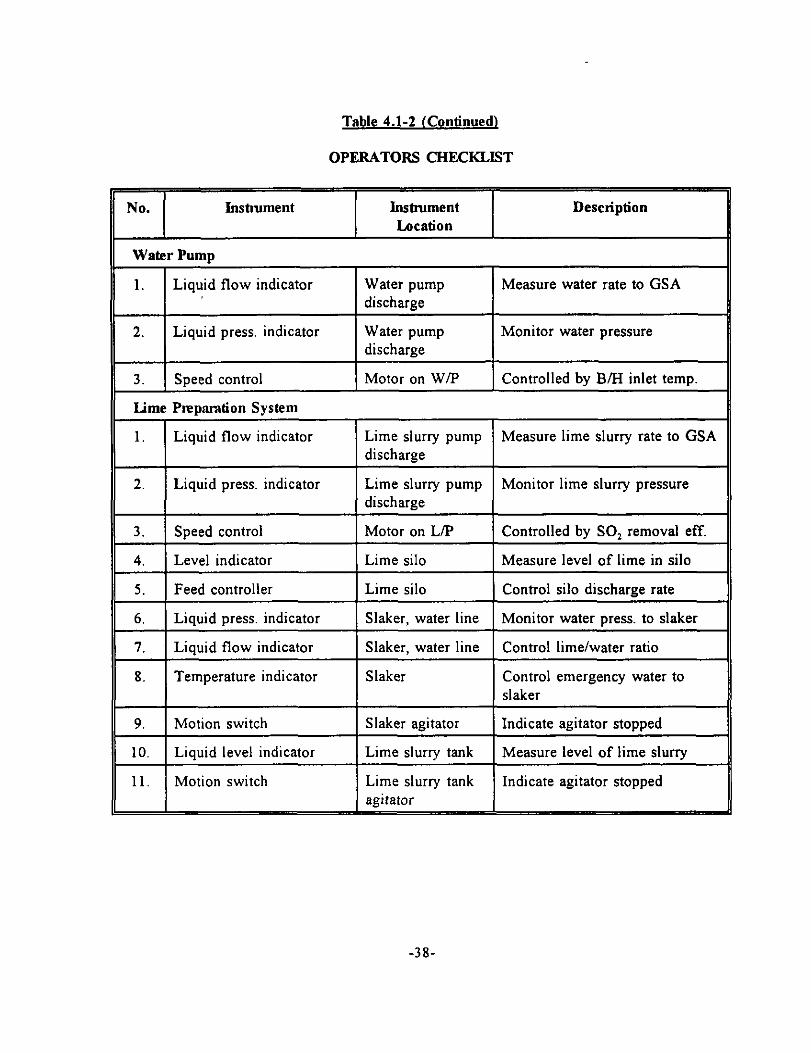
Table 4.1-2 (Continued)
OPERATORS CHECKLJST
No. Instrument Iushument Location
Description
Water Pumo
Water pump discharge
Water pump I discharge
3. I Soeed control Motor on W/P Controlled bv B/H inlet temo.
1. Liquid flow indicator
2. Liquid press. indicator
Measure water rate to GSA
Monitor water pressure
Lime Prep,amtion System
1. Liquid flow indicator Lime slurry pump Measure lime slurry rate to GSA discharge
2. Liquid press. indicator Lime slurry pump Monitor lime slurry pressure discharge
3. Speed control Motor on LA Controlled by SO, removal eff.
4. Level indicator Lime silo Measure level of lime in silo
5. Feed controller Lime silo Control silo discharge rate I
6. Liquid press. indicator
7. Liquid flow indicator
Slaker, water line Monitor water press. to slaker
Slaker. water line Control lime/water ratio
8. Temperature indicator Slaker Control emergency water to slaker
9. Motion switch Slaker agitator Indicate agitator stopped
10. Liquid level indicator Lime slurry tank Measure level of lime slurry
11. Motion switch Lime slurry tank Indicate agitator stopped aeitator
-38-
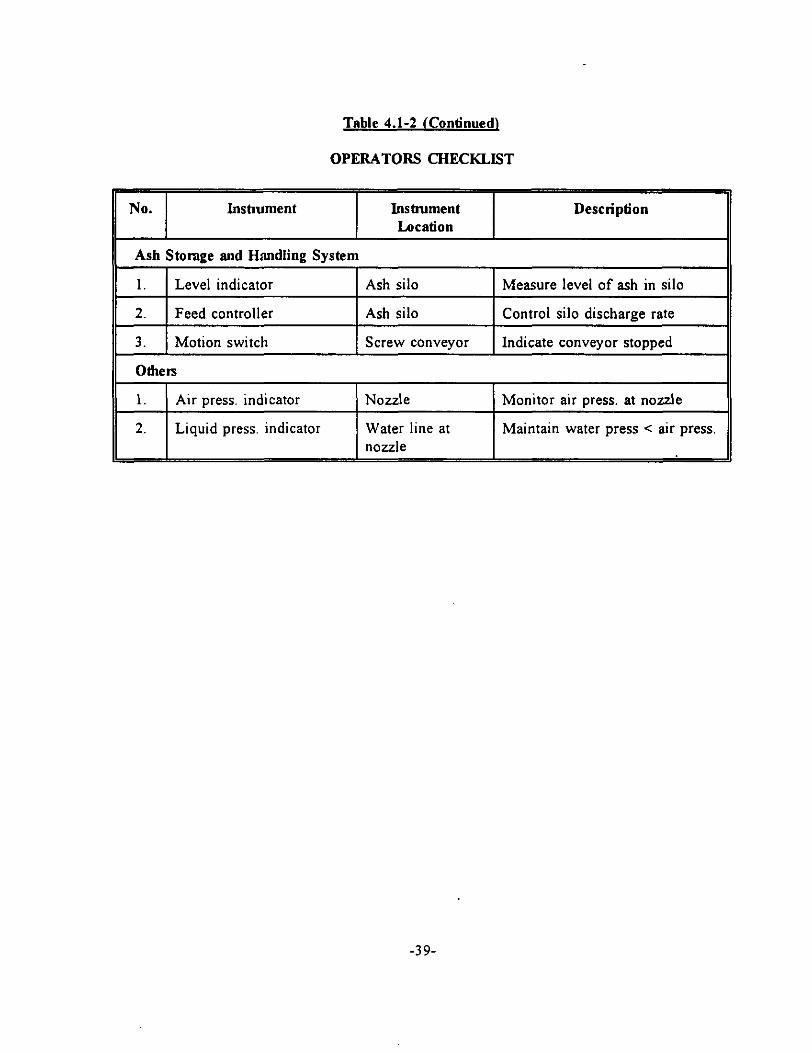
Trible 4.1-2 (Continued\
OPERATORS CHECKLIST
II I No. Inshument I
Insbument I
Description Location
Ash Storage and Handling System
1. Level indicator Ash silo Measure level of ash in silo
2. Feed controller
3. Motion switch
Ash silo
Screw convevor
Control silo discharge rate
Indicate convevor stoDoed
II Otherr. II 11 1. 1 Air mess. indicator 1 Nozzle. I Monitor air Dress. at nozzle II
2. Liquid press. indicator Water line at nozzle
Maintain water press < air press.
-39-
4.1.1 Instrumentation and Data Acauisition
Instrumentation that is critical to the proper operation and control of the GSA process is basically composed of three (3) loops. The control of solid material recycle rate is the first control loop. A differential pressure indicator mounted in the reactor venturi throat reflects the inlet flue gas flow rate. The rate of solid recirculation back to the reactor is controlled in direct proportion to this prevailing inlet gas flow rate by adjusting the speed of the metering screws in the feeder box (via the variable frequency drive motor). A low flue gas flow rate alarm is provided to alert the operator. Should the gas flow rate drop to below 50% of the design value, a low-low flow alarm will be actuated, and the feeder box screw conveyor will trip. The feeder box screw conveyor is interlocked with the lime slurry and water pumps. Tripping of the feeder box screw conveyor will automatically stop the lime slurry and water pumps. At TVA, however, the flue gas flow rate entering the GSA is almost constant, hence it was decided to control the solids recirculation rate by setting the speed on the feeder box screw conveyor.
The second control loop is the flue gas temperature in the reactor. A temperature Indicator/Controller, located downstream of the cyclone, controls the flue gas temperature by adjusting the variable frequency drive on the motor of the pump supplying cooling water to the nozzle in the reactor. This controller also directly reflects and controls the chemical reactions taking place in the reactor. A high temperature alarm is furnished to notice a potential emergency condition. Also a low temperature alarm is provided to notify the possible condensation of moisture from the flue gas, and resulting acid gas corrosion, within the downstream equipment.
Acid gas emission control is the third critical loop among the entire GSA system control. This is accomplished by an acid gas emission Monitor/Controller in the exhaust stack and sending signal to control the speed of the variable frequency drive on the motor of the pump supplying lime slurry to the nozzle of the reactor. This simple control system will automatically maintain the required level of acid gas emissions while keeping the lime consumption at an absolute minimum. At TVA this third control loop was set-up with the option of being able to control the lime slurry flow rate by either the required SO, removal efficiency, the desired stoichiometric ratio or the SO, emission at the stack.
Table 4.1.1 is a list of the major instrumentation used on the demonstration plant, specifying both the manufacturer and model number. Block diagrams showing the interrelationships between the instrument and the equipment being controlled are presented in Figure 4.1.1-1 to Figure 4.1.1-3.
No major problems for instrumentation and data acquisition were encountered in the entire demonstration run. The only minor incident for the data acquisition was the lime slurry flowmeter drifting away from calibration during the Z&day demonstration run period. This problem was solved by recalibrating the lime slurry flowmeter.
-4o-
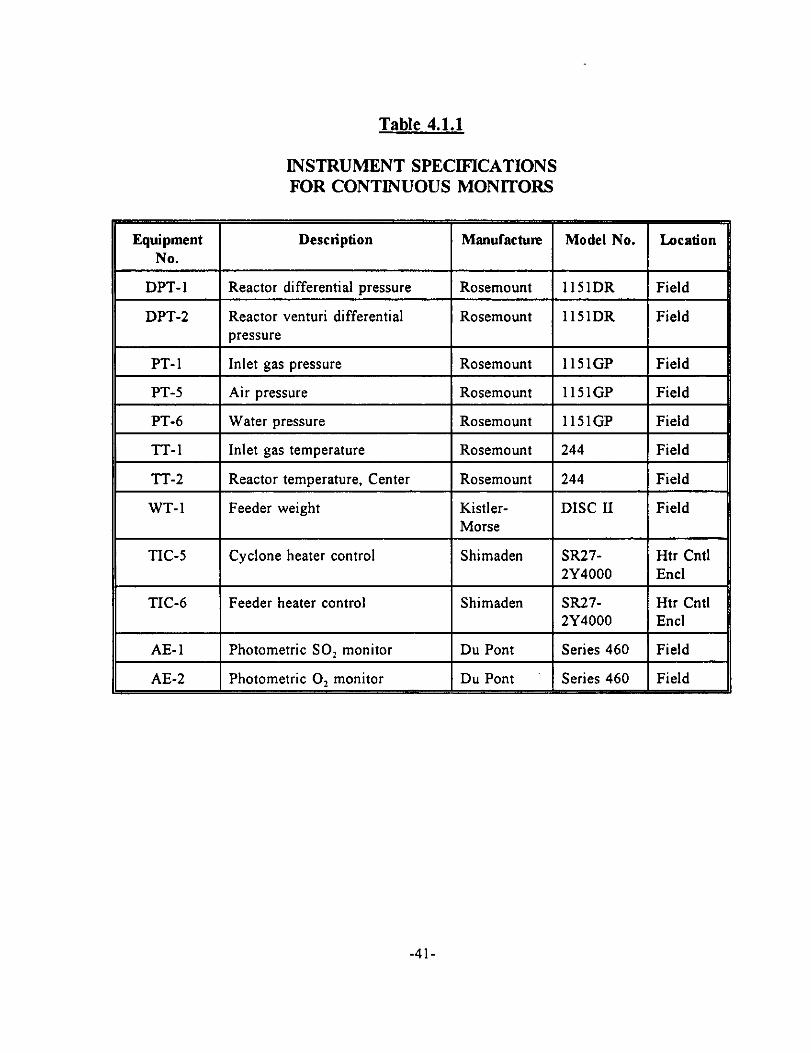
Table 4.1.1
II Equipment No.
INSTRUMENT SPECIFICATIONS FOR CONTINUOUS MONlTORS
Manufacture Model No. I
DPT-1
DPT-2
Reactor differential pressure
Reactor venturi differential pressure
Rosemount 115lDR Field
Rosemount 1151DR Field
PT-1
PT-5
Inlet gas pressure
Air pressure
Rosemount
Rosemount
1151GP
1151GP
Field
Field
II PT-6 Water nressure Rosemount I 1151GP I Field II TT-1 Inlet gas temperature Rosemount 244 Field
T-r-2 Reactor temperature, Center
WT-1 Feeder weight
Rosemount
Kistler- Morse
244
DISC II
Field
Field
TIC-5 Cyclone heater control Shimaden sR27- 2Y4000
Htr Cntl Encl
TIC-6 Feeder heater control Shimaden
AE-1
AE-2
Photometric SO, monitor
Photometric 0, monitor
Du Pont Series 460 Field
Du Pont Series 460 Field
-4l-
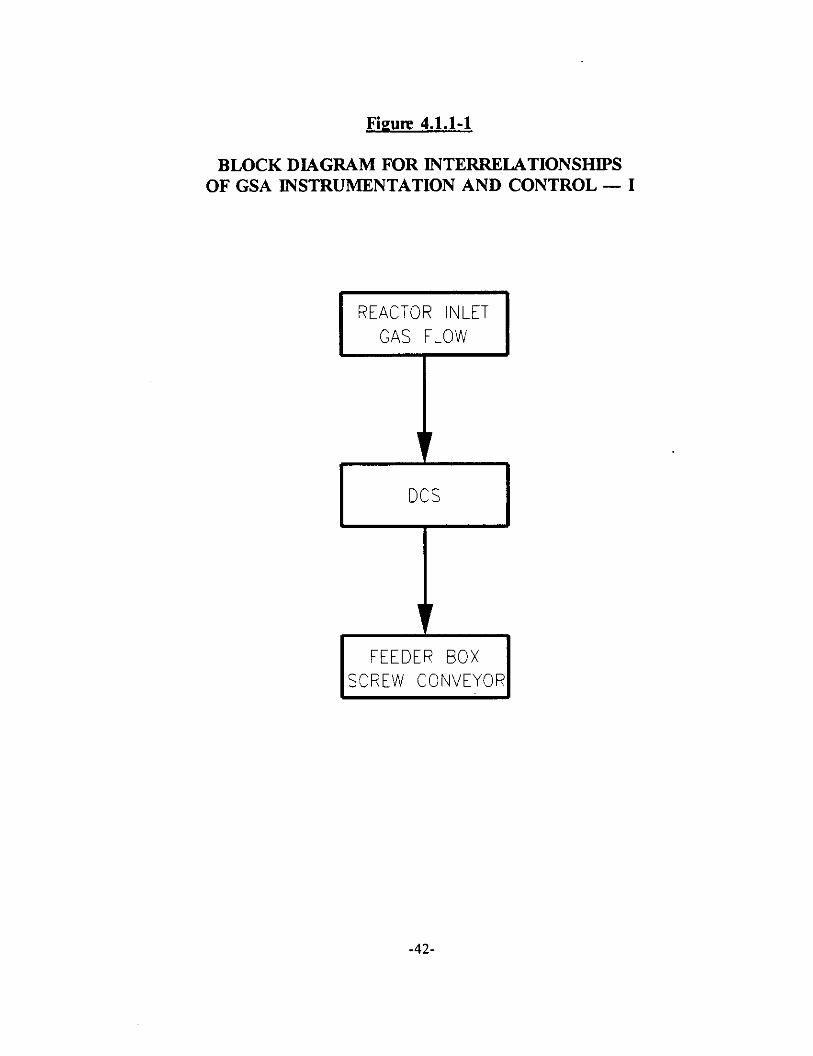
Figure 4.1.1-1
BLOCK DIAGRAM FOR INTERRELATIONSHIPS OF GSA INSTRUMENTATION AND CONTROL - I
REACTOR INLET
-42-
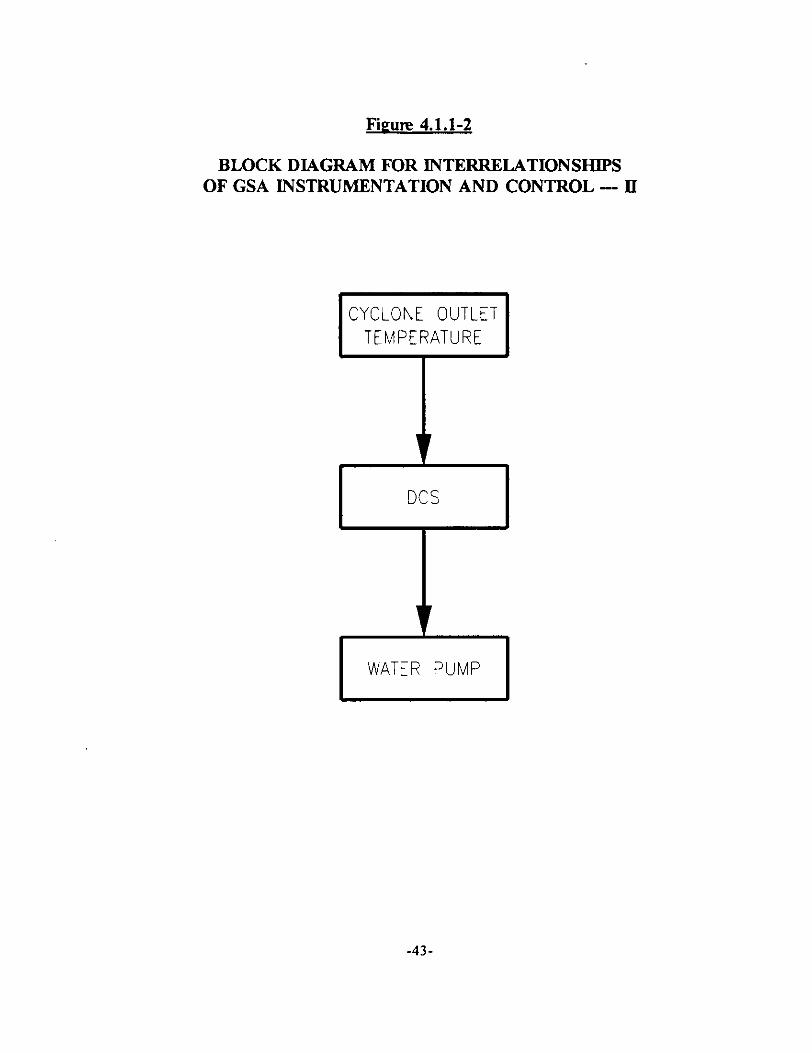
Fieure 4.1.1-2
BLOCK DIAGRAM FOR INTERRELATIONSHIPS OF GSA INSTRUMENTATION AND CONTROL - II
CYCLONE OUTLET TEMPERATURE
DCS
ri WATER PUMP
-43-
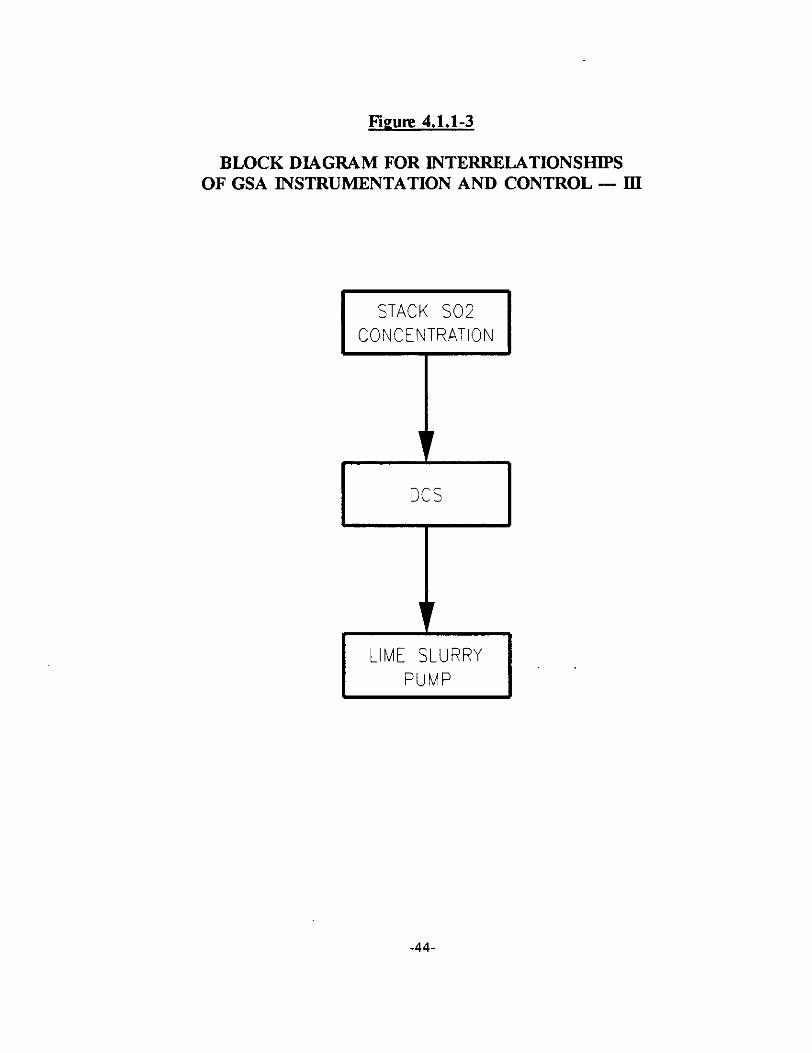
Figure 4.1.1-3
BLOCK DIAGRAM FOR INTERRELATIONSHIPS OF GSA INSTRUMENTATION AND CONTROL - III
STACK SO2 CONCENTRATION
DCS
LIME SLURRY PUMP
+I-
4.1.2 Test Methods
The overall test program for the GSA process consisted of five major phases: (1) the preliminary of start-up tests, (2) the factorial tests, (3) the air toxics tests, (4) the 28-day demonstration run and (5) the 14-day PJBH demonstration run. Among these test phases, gaseous streams, aqueous streams, and solid streams were monitored and analyzed by national standard methods, Table 4.1.2-1 shows gaseous stream monitoring summary including a detailed description of the test methods being used. A summary of the aqueous and solid stream monitoring is presented in Table 4.1.2-2 and 4.1.2-3, respectively.
For further information please refer to TVA’s final report entitled “10 MW Demonstration of the Gas Suspension Absorption Process at TVA’s Center for Emissions Research” in Appendix “B” of this report.
-4s.
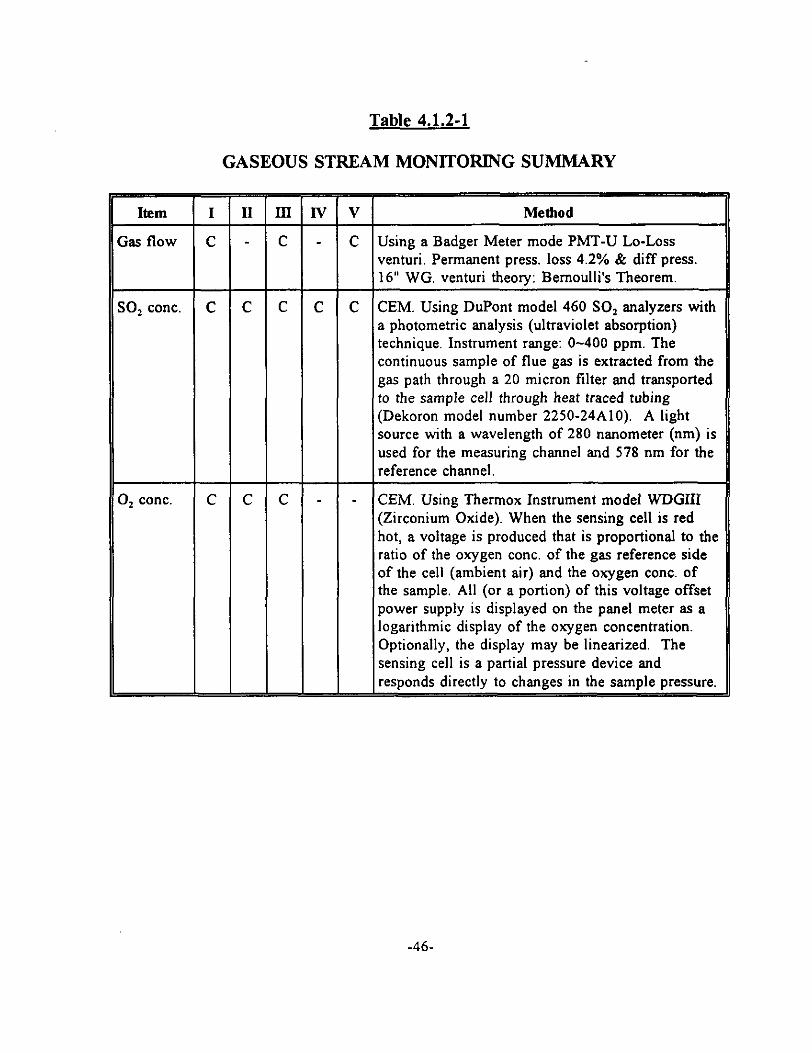
Table 4.1.2-1
GASEOUS STREAM MONITORING SUMMARY
technique. Instrument range: O-400 ppm. The continuous sample of flue gas is extracted from the gas path through a 20 micron filter and transported to the sample cell through heat traced tubing (Dekoron model number 2250-24AlO). A light source with a wavelength of 280 nanometer (nm) is used for the measuring channel and 578 nm for the
0, cont. C C C - - CEM. Using Thermox Instrument model WDGIII (Zirconium Oxide). When the sensing cell is red hot, a voltage is produced that is proportional to the ratio of the oxygen cont. of the gas reference side of the cell (ambient air) and the oxygen cont. of the sample. All (or a portion) of this voltage offset power supply is displayed on the panel meter as a logarithmic display of the oxygen concentration. Optionally, the display may be linearized. The sensing cell is a partial pressure device and responds directly to changes in the sample pressure.
-46-
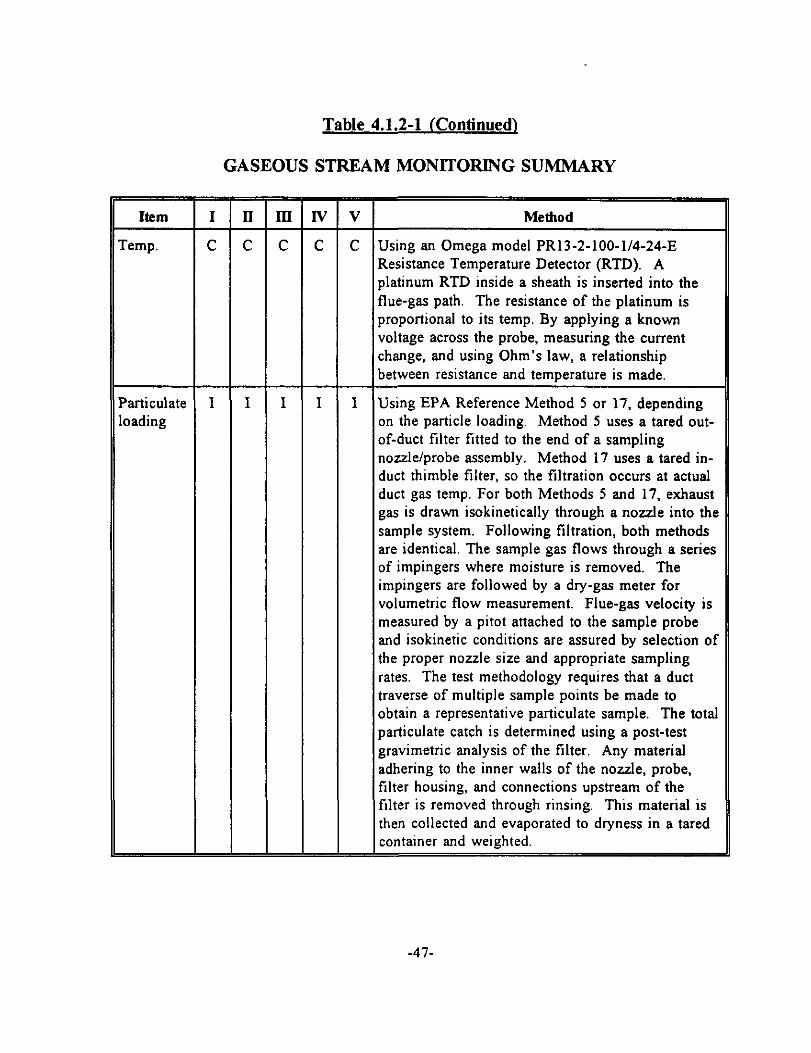
Table 4.1.2-1 (Continued)
GASEOUS STREAM MONITORING SUMMARY
Resistance Temperature Detector (RTD). A
flue-gas path. The resistance of the platinum is proportional to its temp. By applying a known
on the particle loading. Method 5 uses a tared out- of-duct filter fitted to the end of a sampling nozzle/probe assembly. Method 17 uses a tared in- duct thimble filter, so the filtration occurs at actual duct gas temp. For both Methods 5 and 17, exhaust gas is drawn isokinetically through a nozzle into the sample system. Following filtration, both methods are identical. The sample gas flows through a series of impingers where moisture is removed. The impingers are followed by a dry-gas meter for volumetric flow measurement. Flue-gas velocity is measured by a pitot attached to the sample probe and isokinetic conditions are assured by selection of the proper nozzle size and appropriate sampling rates. The test methodology requires that a duct traverse of multiple sample points be made to obtain a representative particulate sample. The total particulate catch is determined using a post-test gravimetric analysis of the filter. Any material adhering to the inner walls of the nozzle, probe, filter housing, and connections upstream of the filter is removed through rinsing. This material is then collected and evaporated to dryness in a tared container and weighted.
I
-47-
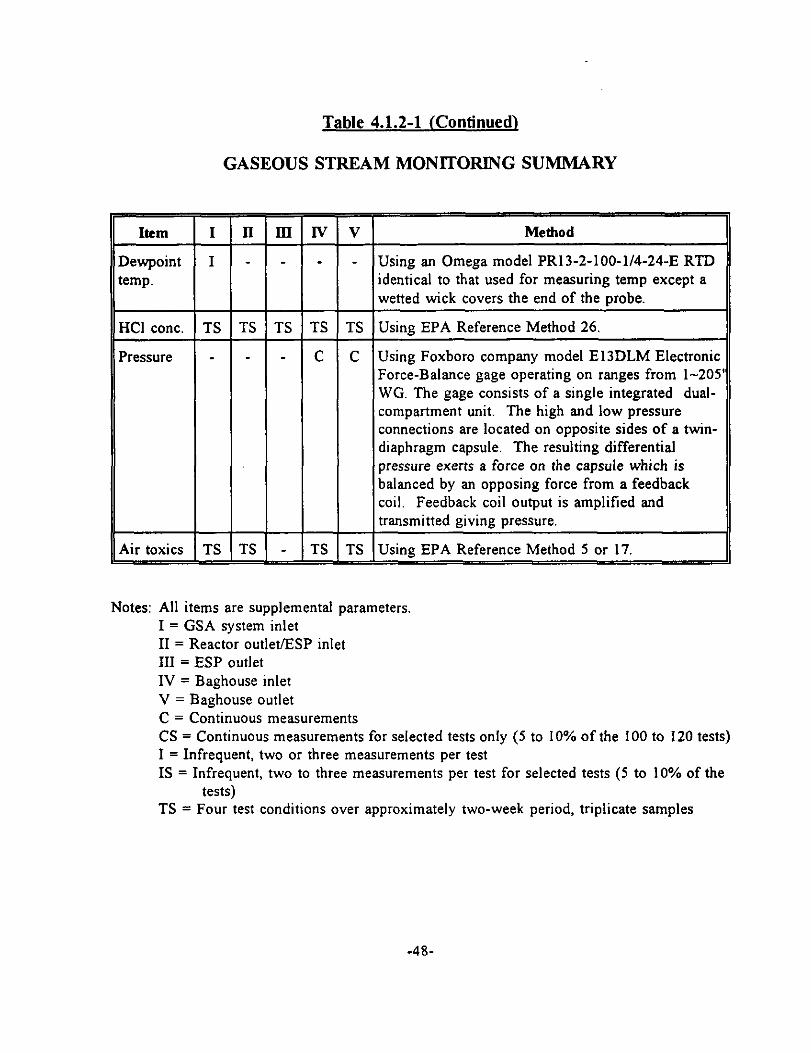
Item
Dewpoint temp.
HCI cont.
Pressure
Table 4.1.2-1 (Continued)
GASEOUS STREAM MONITORING SUMMARY
--- rs l-s rs --- _ - -
--- Air toxics TS TS -
= Iv -
- I-S - C
-
=
V -
- TS - C
-
Method
Using an Omega model PR13-2-100-1/4-24-E RTD identical to that used for measuring temp except a wetted wick covers the end of the probe.
Using EPA Reference Method 26.
Using Foxboro company model E13DLM Electronic Force-Balance gage operating on ranges from l-205 WG. The gage consists of a single integrated dual- compartment unit. The high and low pressure connections are located on opposite sides of a twin- diaphragm capsule. The resulting differential pressure exerts a force on the capsule which is balanced by an opposing force from a feedback coil. Feedback coil output is amplified and transmitted giving pressure.
Using EPA Reference Method 5 or 17.
Notes: All items are supplemental parameters. I = GSA system inlet II = Reactor outlet/ESP inlet III = ESP outlet IV = Baghouse inlet V = Baghouse outlet C = Continuous measurements CS = Continuous measurements for selected tests only (5 to 10% of the 100 to 120 tests) I = Infrequent, two or three measurements per test IS = Infrequent, two to three measurements per test for selected tests (5 to 10% of the
tests) TS = Four test conditions over approximately two-week period, triplicate samples
-48-
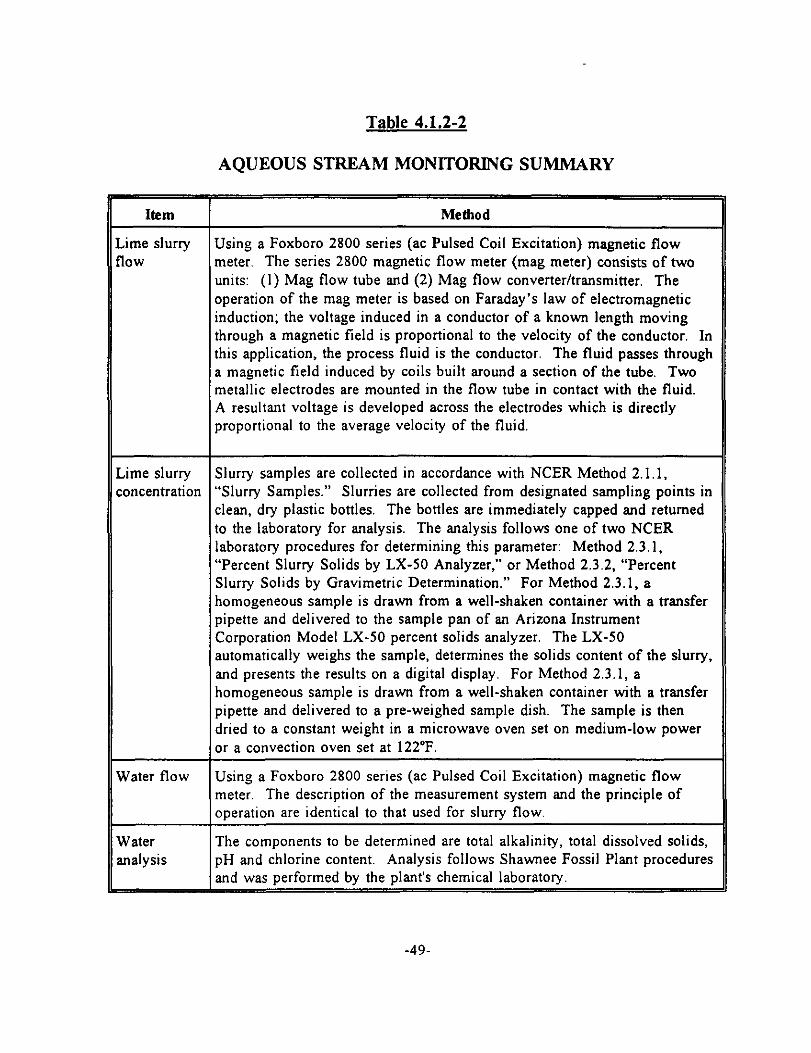
Table 4.1.2-2
AQUEOUS STREAM MONITORING SUMMARY
Using a Foxboro 2800 serie meter. The series 2800 mag
this application, the process fluid is the conductor. The fluid passes through a magnetic field induced by coils built around a section of the tube. Two metallic electrodes are mounted in the flow tube in contact with the fluid. A resultant voltage is developed across the electrodes which is directly proportional to the average velocity of the fluid.
Slurry samples are collected in accordance with NCER Method 2.1.1, Slurries are collected from designated sampling points in
clean, dry plastic bottles. The bottles are immediately capped and returned to the laboratory for analysis. The analysis follows one of two NCER laboratory procedures for determining this parameter: Method 2.3.1, “Percent Slurry Solids by LX-50 Analyzer,” or Method 2.3.2, “Percent Slurry Solids by Gravimetric Determination.” For Method 2.3.1, a homogeneous sample is drawn from a well-shaken container with a transfer pipette and delivered to the sample pan of an Arizona Instrument Corporation Model LX-SO percent solids analyzer. The LX-SO automatically weighs the sample, determines the solids content of the slurry, and presents the results on a digital display. For Method 2.3.1, a homogeneous sample is drawn from a well-shaken container with a transfer pipette and delivered to a pre-weighed sample dish. The sample is then dried to a constant weight in a microwave oven set on medium-low power
components to ossil Plant procedures
-49.
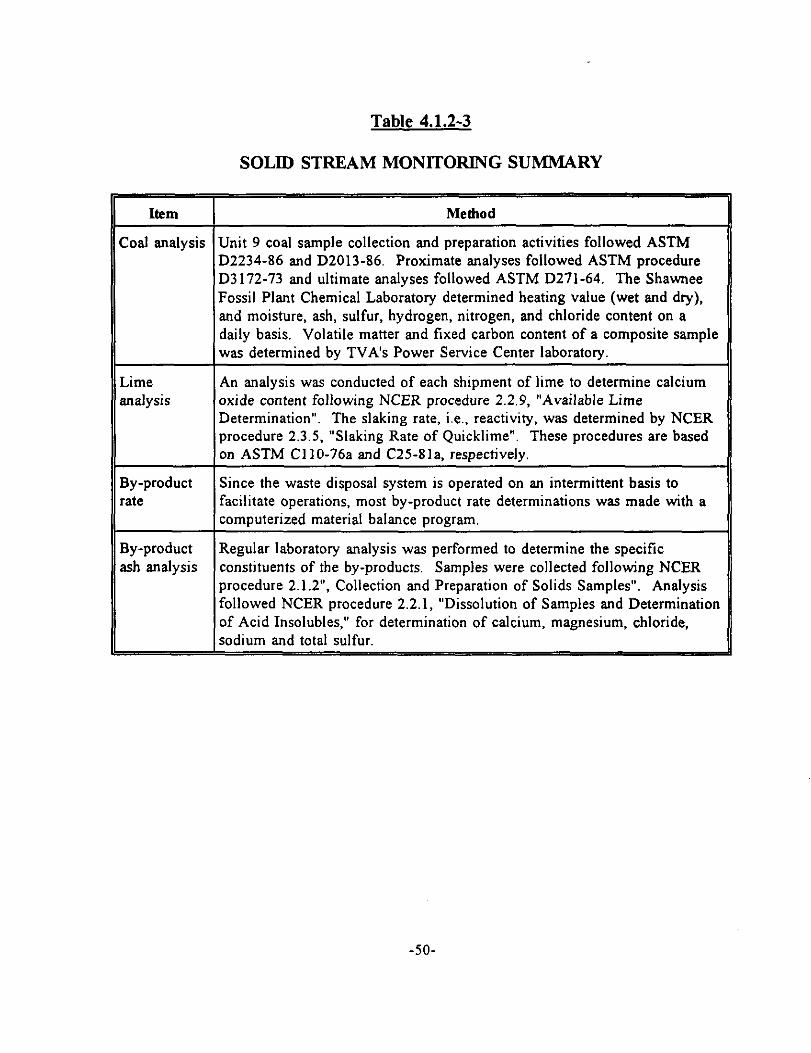
Table 4.1.2-3
SOLID STREAM MONITORING SUMMARY
II Item I Metbod II
Coal analysis Unit 9 coal sample collection and preparation activities followed ASTM D2234-86 and D2013-86. Proximate analyses followed ASTM procedure D3172-73 and ultimate analyses followed ASTM D271-64. The Shawnee Fossil Plant Chemical Laboratory determined heating value (wet and dry), and moisture, ash, sulfur. hydrogen, nitrogen, and chloride content on a daily basis. Volatile matter and fixed carbon content of a composite sample was determined by TVA’s Power Service Center laboratory.
Lime analysis
An analysis was conducted of each shipment of lime to determine calcium oxide content following NCER procedure 2.2.9, “Available Lime Determination”. The slaking rate, i.e., reactivity, was determined by NCER procedure 2.3.5, “Slaking Rate of Quicklime”. These procedures are based on ASTM Cl lo-76a and C25-81a, respectively.
By-product Since the waste disposal system is operated on an intermittent basis to rate facilitate operations, most by-product rate determinations was made with a
computerized material balance program.
Regular laboratory analysis was performed to determine the specific constituents of the by-products. Samples were collected following NCER procedure 2.1.2”. Collection and Preparation of Solids Samples”. Analysis followed NCER procedure 2.2.1, “Dissolution of Samples and Determination
r determination of calcium, magnesium, chloride,
-5O-
5.0 TECHNICAL PERFORMANCE
The SO, removal and ESP particulate control results from the lo-MW GSA Clean Coal III demonstration project are discussed in the following sections. These discussions are organized according to the specific test series. The four test series that will be discussed are the two factorial test series, the basic and replicate tests, the 28-day demonstration run, and the 14-day pulse-jet baghouse (PJE3H) demonstration run.
5.1 SO, REMOVAL PERFORMANCE
5.1.1 Factorial Tests
The tests from the statistically-designed factorial test plan were performed in two parts: the basic series of tests and the replicate series of tests. These factorial tests were designated as either the 2-AP or 3-AP series depending on the orientation and status of the I-MW pulse-jet baghouse, which was tested concurrently with the GSA/ESP system. The test designation 2-AP was used to denote when either the PJBH was not operating or was operated in a series with the ESP (withdrawing a slipstream of flue gas from downstream of the ESP). All of the replicate series of tests were designed to be completed with the PITH operating in series with the ESP. However, some of the basic tests were completed with the PJBH off-line and were designated as 2-AP series tests. The test designation 3-AP was used when the PJBH was operated in parallel with the ESP (withdrawing a slipstream of flue gas from upstream of the ESP). Most of the basic factorial tests were completed in this mode.
A total of 78 tests were performed during the factorial test phase. Not all of these tests, however, were part of the original factorial test plan. As an example, several tests were added during the factorial test phase to further evaluate the pulse-jet baghouse. Table 5.1.1-l lists the 2-AP and 3-AP series tests that were conducted at operating conditions specified in the factorial test plan. These tests typically consisted of 12 to 24 hours of operation to reach steady state, followed by 24 to 48 hours of testing from which the test averages were developed. The data from 10 test segments will not be reported due to problems encountered during these test (tests 2-AP-05,2-AP-10,2-AP-14 (tile 2), t-AP-15 (files 1 & 2). 2-AP-16,2-AP-93,3-AP-15,3-AP-60, and 3-AP-61). The problems include equipment operation which interfered with the GSA system achieving steady state conditions, calibration problems with process monitoring equipment, and/or an insufficient amount of data to develop representative test averages for specific operating conditions.
The SO, removal results for the tests conducted at baseline chloride levels (0.04 weight percent coal chloride) are presented in Table 5.1.1-2 for the 2-AP series tests and in Table 5.1.1-3 for the 3-AP series tests. Similarly, the SO, removal results are presented in Tables 5.1.1-4 and 5.1.1-S for the chloride spiking tests (0.12 weight percent coal chloride equivalent) for the 2-AP and 3- AP series, respectively. As shown in these tables, the majority of the SO, removal occurs in the GSA reactor/cyclone. The ESP contribution to the total system SO, removal ranged from 1 to 7 percent.
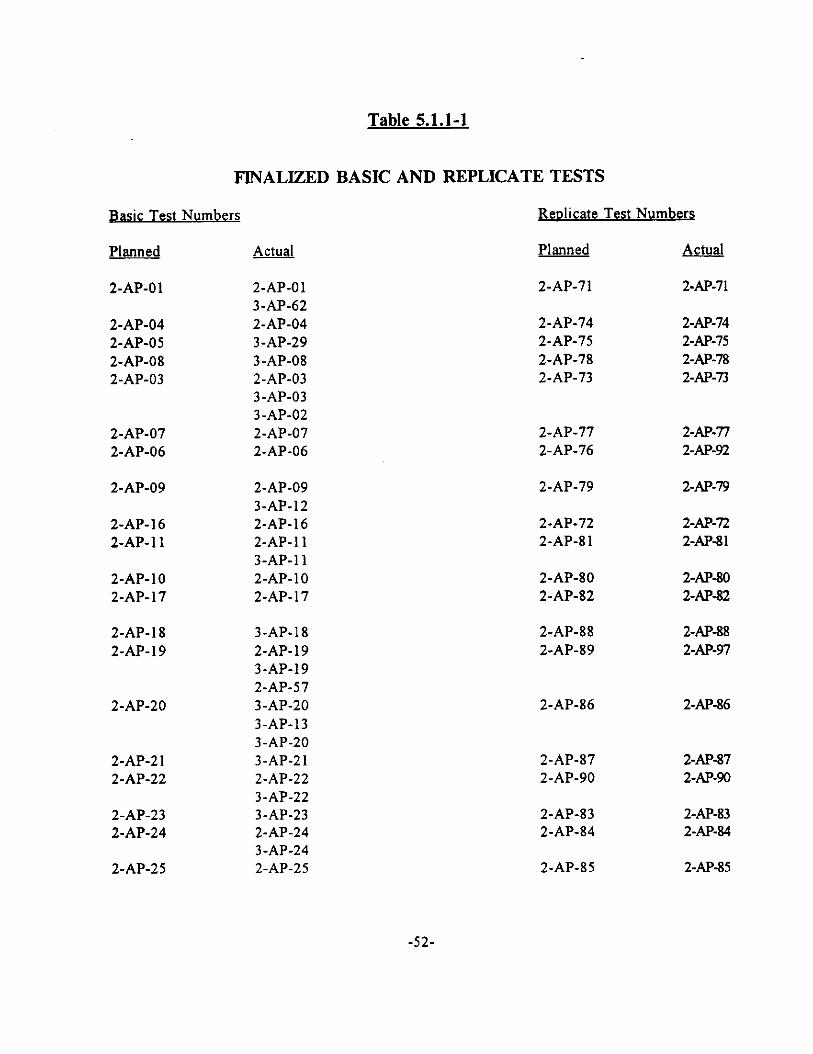
Table 5.1.1-1
FINALIZED BASIC AND REPLICATE TESTS
Basic Test Numbers Redicate Test Numbers
Planned &t@!
2-AP-01 2-AP-01 3-AP-62 2-AP-04 3-AP-29 3-AP-08 2-AP-03 3-AP-03 3-AP-02 2-AP-07 2-AP-06
2-AP-04 2-AP-05 2-AP-08 2-AP-03
2-AP-07 2-AP-06
Planned
2-AP-71
2-AP-74 2-AP-75 2-AP-78 2-AP-73
2-AP-77 2-AP-76
2X-71
2-AP-74 2-m-75 2-AP-78 2-AP-73
2-AP-77 2-AI-92
2-AP-09
2-AP-16 2-AP-11
2-AP-10 2-AP-17
2-AP-09 3-AP-12 2-AP-16 2-AP-11 3-AP-11 2-AP-10 2-AP-17
2-AP-79
2-AP-72 2-AP-81
2-AP-80 2-AP-82
2-m-79
2x-72 2-AP-81
2-AP-80 2-AP-82
2-AP- 18 2-AP-19
2-AP-20
2-AP-2 1 2-AP-22
2-AP-23 2-AP-24
2-AP-25
3-AP-18 2-AP-19 3-AP-19 2-AP-57 3-AP-20 3-AP-13 3-AP-20 3-AP-21 2-AP-22 3-AP-22 3-AP-23 2-AP-24 3-AP-24 2-AP-25
2-AP-88 2-AP-89
2-AP-86
2-AP-87 2-AP-90
2-AP-83 2-AP-84
2-AP-85
2-AP-88 2-m-97
2-AP-86
2-AM7 2-AP-90
2-AP-83 2-AM4
2-m-85
-52.
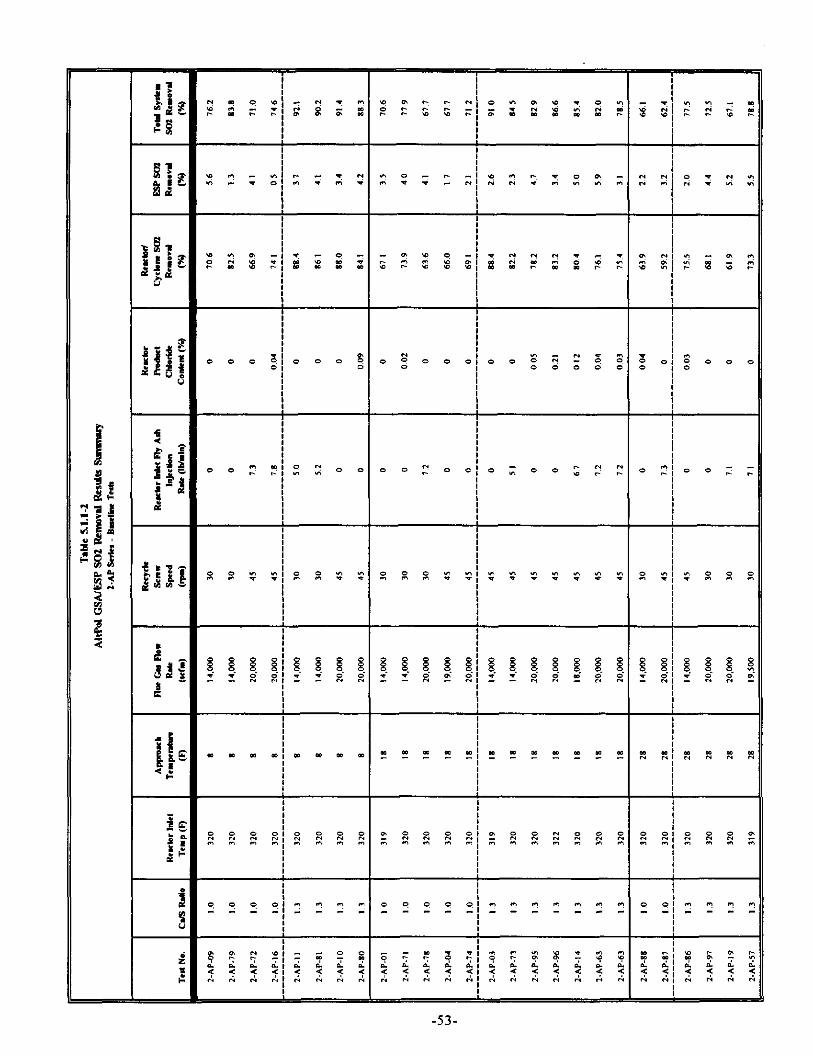
I I
I 0
L
f I I
0 , I I I ,
I I I
I , I
-I-
I
I
t I I
iI I I I
t I I
!I I I I
L I
/j I
I +
I
I
I I #
ji 0
, II ‘I
I
L I I I
L I I I
! I ;I
I ,
t I I
‘I I I t t
I I
I I
,
t I I I I I I I
f I I
;I 81
I I
L I
I f
II I
L
t I
jj I I
+
jj I
jI 4
i,
i
3 : r
a 0 0 0
-
R A R
0 ” E ,$
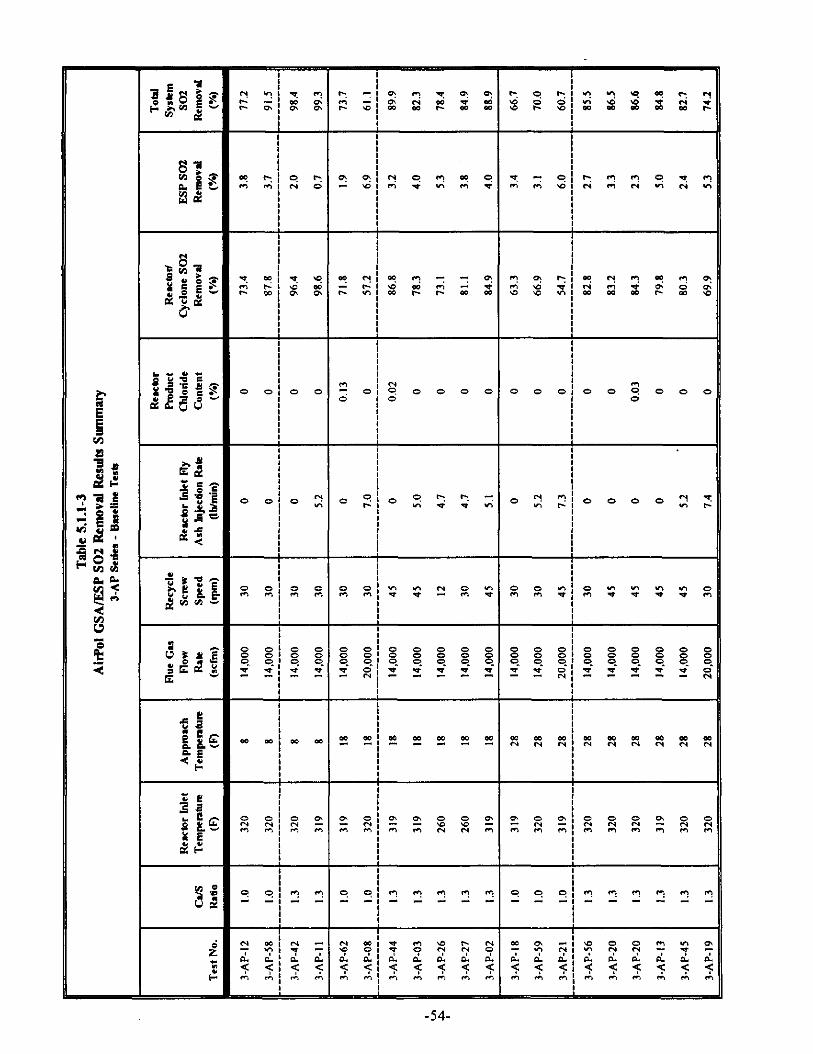
ee$eoc c1 e
e 0 0 e 0
f2: f: g= B z ‘C ; .%a tic= 22
e e e 0 2 : 2 $ - I 0 0
x e 4 c 2 J! 8 8 9 4 9 ::
1: %a- ce $5 I-
0‘ h g % z 0 0 N N c
* ,-323.
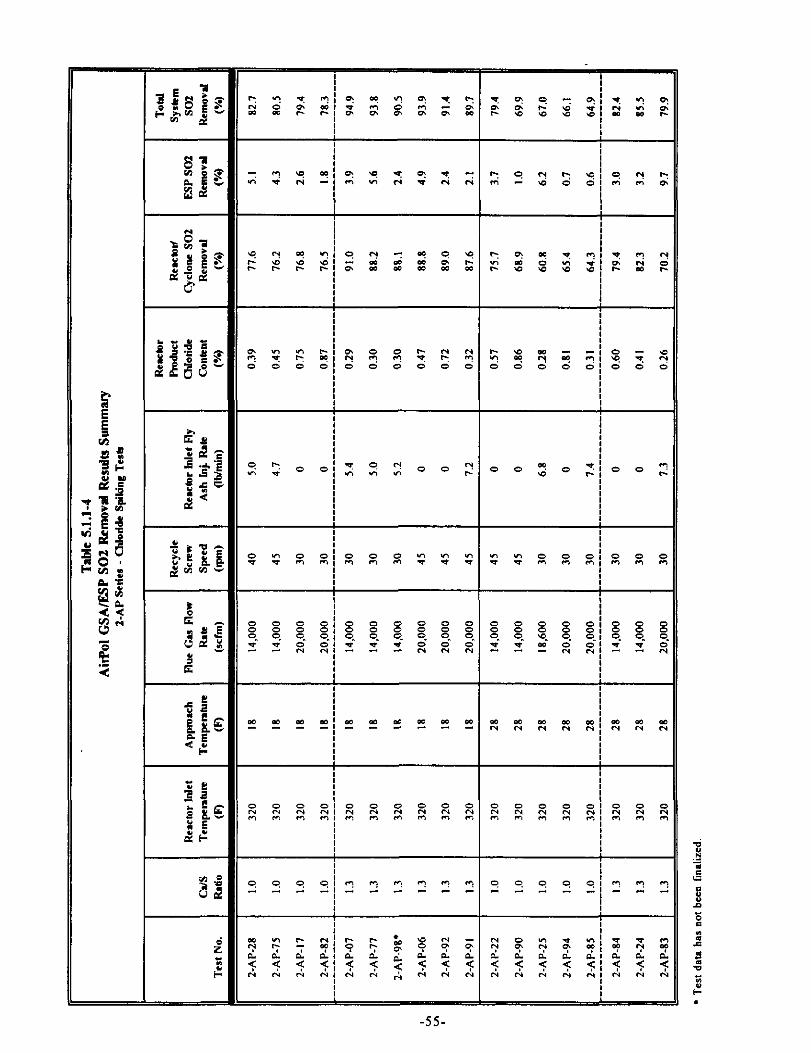
-55-
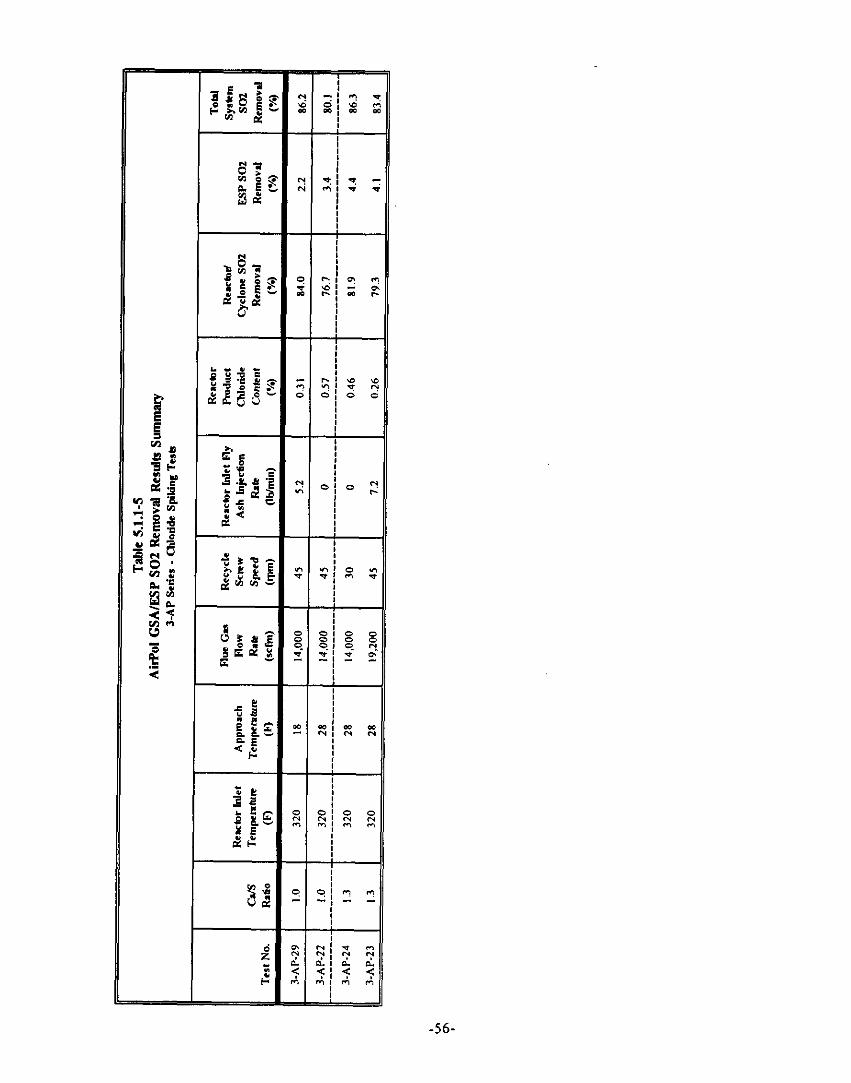
-56-
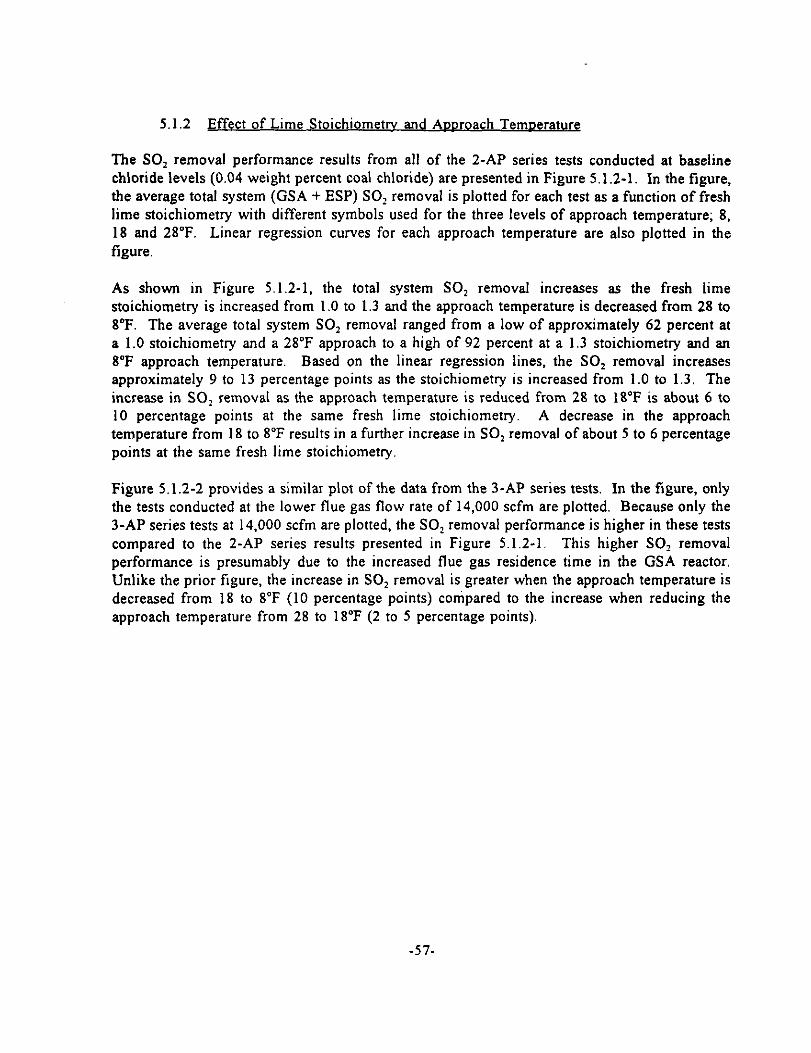
5.1.2 Effect of Lima Stoichiometrv and Aooroach Temnerature
The SO, removal performance results from all of the 2-AP series tests conducted at baseline chloride levels (0.04 weight percent coal chloride) are presented in Figure 5.1.2-l. In the figure, the average total system (GSA + ESP) SO, removal is plotted for each test as a function of fresh lime stoichiometry with different symbols used for the three levels of approach temperature; 8, 18 and 28°F. Linear regression curves for each approach temperature are also plotted in the figure.
As shown in Figure 5.1.2-l. the total system SO, removal increases as the fresh lime stoichiometry is increased from 1.0 to 1.3 and the approach temperature is decreased from 28 to 8°F. The average total system SO, removal ranged from a low of approximately 62 percent at a 1.0 stoichiometry and a 28°F approach to a high of 92 percent at a 1.3 stoichiometry and an 8T approach temperature. Based on the linear regression lines, the SO, removal increases approximately 9 to 13 percentage points as the stoichiometry is increased from 1.0 to 1.3. The increase in SO, removal as the approach temperature is reduced from 28 to 18°F is about 6 to 10 percentage points at the same fresh lime stoichiometry. A decrease in the approach temperature from 18 to 8°F results in a further increase in SO, removal of about 5 to 6 percentage points at the same fresh lime stoichiometry.
Figure 5.1.2-2 provides a similar plot of the data from the 3-AP series tests. In the figure, only the tests conducted at the lower flue gas flow rate of 14,000 scfm are plotted. Because only the 3-AP series tests at 14,000 scfm are plotted, the SO, removal performance is higher in these tests compared to the 2-AP series results presented in Figure 5.1.2-1, This higher SO, removal performance is presumably due to the increased flue gas residence time in the GSA reactor. Unlike the prior figure, the increase in SO, removal is greater when the approach temperature is decreased from 18 to 8°F (10 percentage points) compared to the increase when reducing the approach temperature from 28 to 18°F (2 to 5 percentage points).
-57-
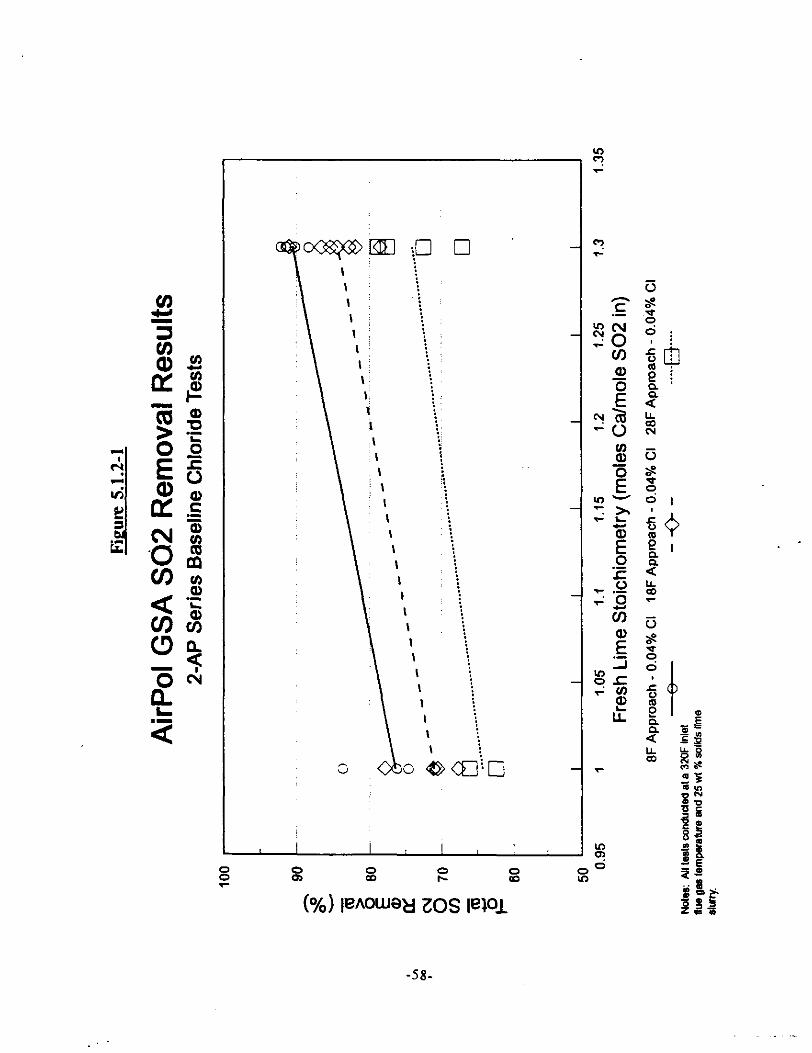
8 a 8 E is (%I 1eAou.w zos wx
$ b E
- P’5: ‘2
iti 0 .- c
v .o - -2
v)
E .- -l
- gr GUI
2 IL
-r
-?
go
-58-
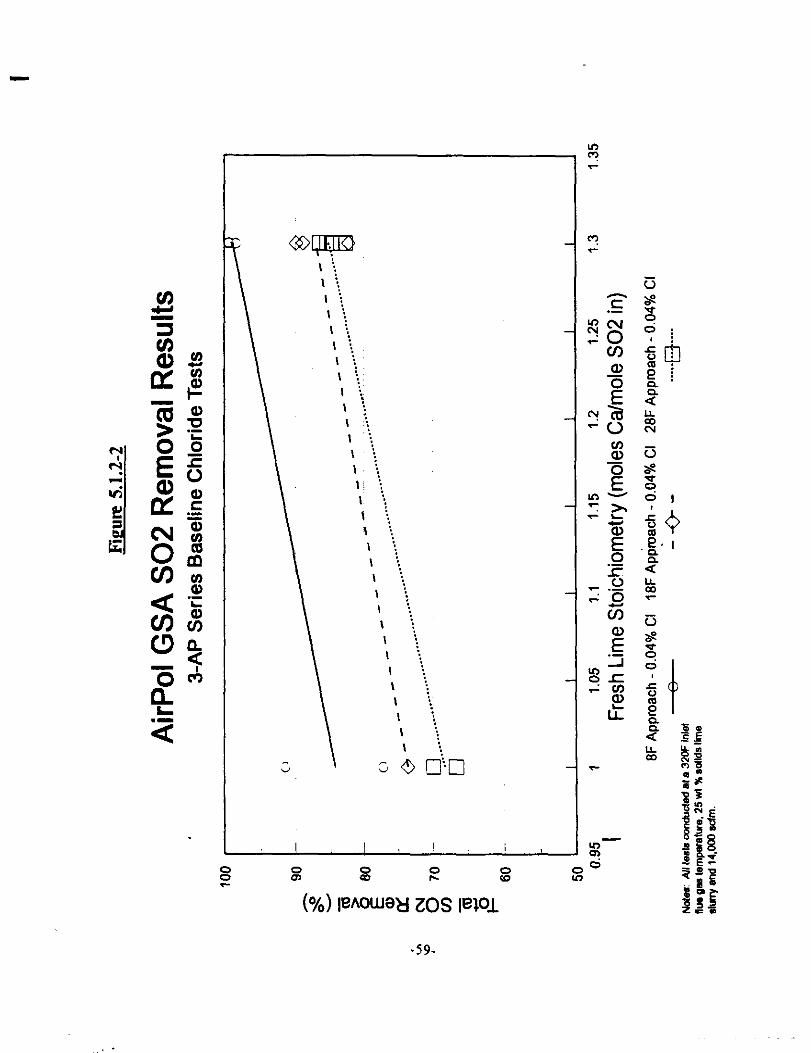
I i. I :. I : \ i: , :, \ i \ :: I . \ ;; I ::. \i : 1~ :; I z: 1 :; I : I : I I I
$ g E 8
(M m0u.w 10s Iem
-59-
.,. .
5.1.3 Effect of Flue Gas Flow Rate
The flue gas flow rate through the GSA system was a significant variable in affecting the SO, removal performance. Figures 5.1.3-1, 5.1.3-2 and 5.1.3-3 present the results from the 2-AP series tests conducted at baseline chloride levels. In each figure, the average total SO, removal is plotted for each test as a function of fresh lime stoichiometry The distinction is made in each figure for tests conducted at the two flue gas flow rate levels, 14,000 and 20,000 scfm. Linear regression lines are plotted for each flue gas flow rate. Figure 5.1.3-I plots data for tests conducted at an 8°F approach temperature, while Figures 5.1.3-2 and 5.1.3-3 plot data for tests conducted at an 18 and 28°F approach temperatures, respectively.
In all three figures, the SO, removal performance is lower at the higher flue gas flow rate, 20,000 scfm. The decrease in performance ranges from approximately 2 to 8 percentage points based on the linear regression lines, The lower SO, removal performance at 20,000 versus 14,000 scfm was also observed in the 2-AP series tests conducted with calcium chloride spiking. Figures 5.1.3-4 and 5.1.3-5 provide similar plots of the average total SO, removal as a function of fresh lime stoichiometry for tests conducted at an 18 and 28°F approach temperature, respectively. Similar to the baseline chloride tests, the SO, removal decreased from approximately 2 to 9 percentage points as the flue gas flow rate increased from 14,000 to 20,000 scfm.
This same effect was also observed in the 3-AP series tests. Figure 5.1.3-6 plots the average total SO, removal as a function of fresh lime stoichiometry for the 3-AP series tests conducted at baseline chloride levels. In the figure, the tests conducted at an 18 and 28°F approach temperature and at flue gas flow rates of 14,000 and 20,000 scfm are plotted. Only the regression lines are plotted for the test data at a flue gas flow rate of 14,000 scfm in order to more readily distinguish the data points from the tests conducted at 20,000 scfm. All three tests conducted at the higher flue gas flow rate resulted in decreased SO, removal performance. Based on the linear regression lines, the decrease in SO, removal was approximately 10 percentage points.
The increase in SO, removal at the lower flue gas flow rate is presumably due to the increased residence time in the GSA absorber. The residence time increases from approximately 3.9 seconds at a flue gas flow rate of 20,000 scfm to 5.5 seconds at 14,000 scfm. Although this is only a 1.6 second differential, it represents a 41 percent increase in residence time which is significant. The effect of residence time in the GSA absorber, especially at these low residence times, may be more significant compared to other dry scrubbing technologies such as spray drying because the cyclone downstream of the GSA absorber removes over 90 percent of the solidslsorbent from the flue gas stream, thus eliminating any further reaction of the sorbent with the flue gas SO,.
-6O-

x I I I I
w 8 i? $ (%) ie*ou.w zos iem
-61-
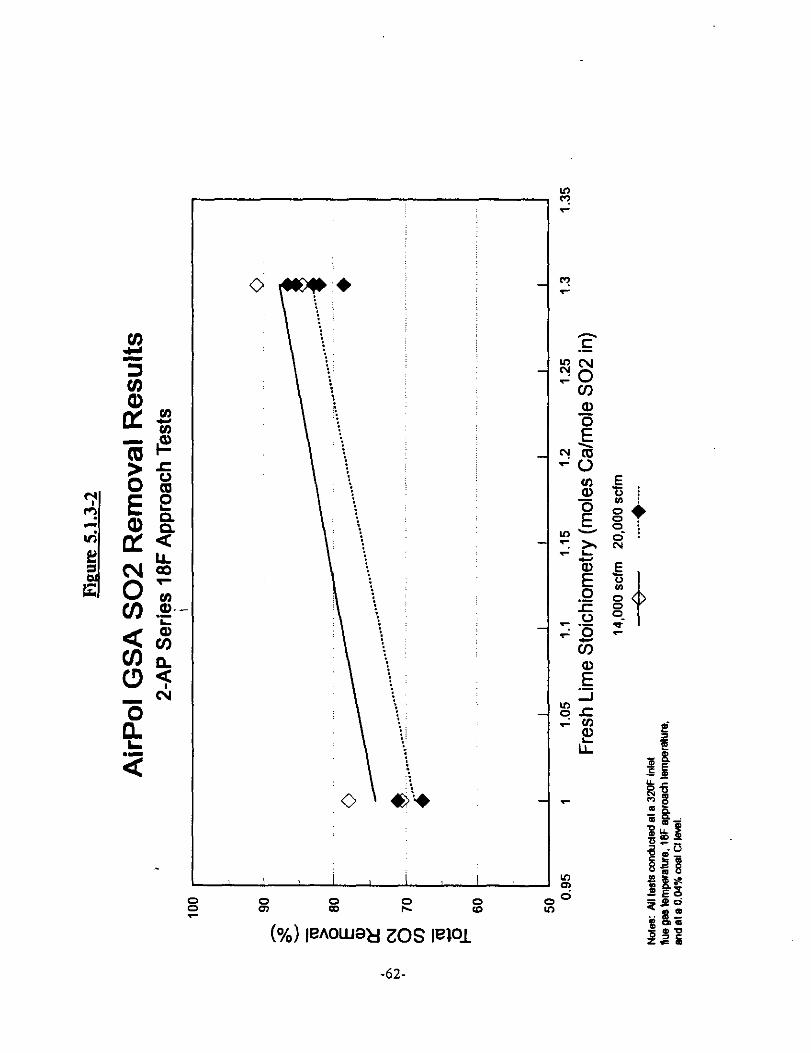
0 8 si z e s i? (%I w-ki 10s iwx
-62-
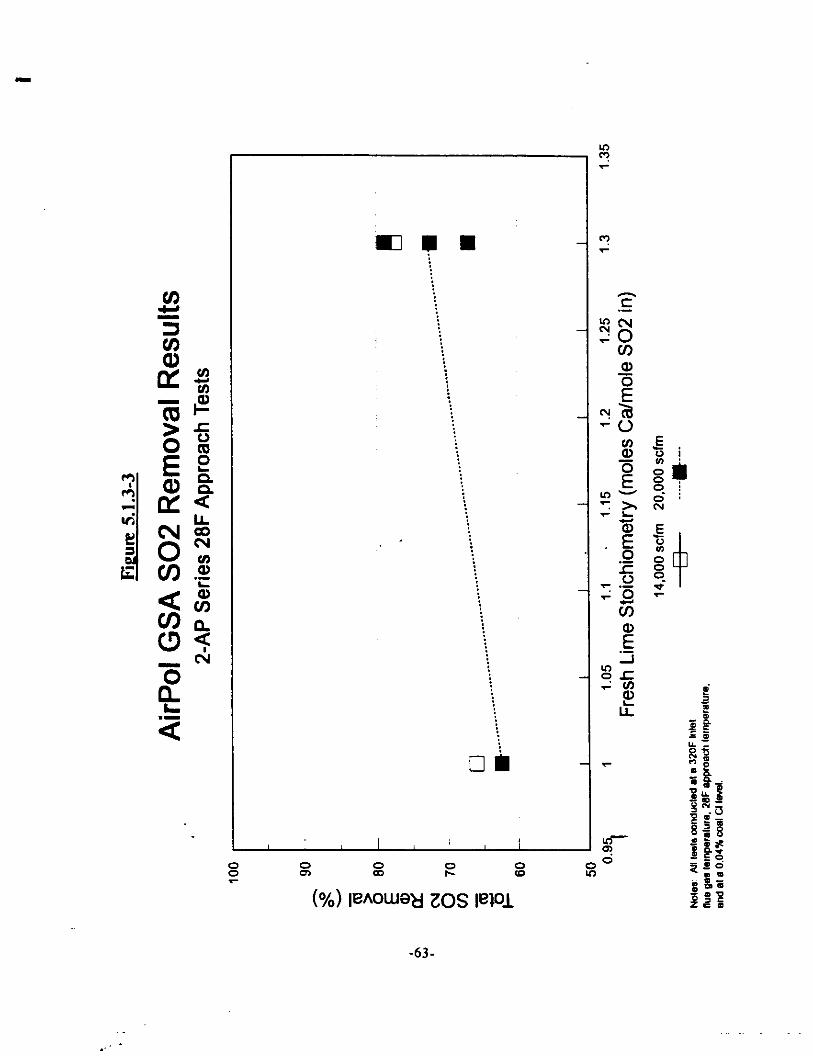
8 si z E i3
(96) w0u.w 10s iwi
-63-
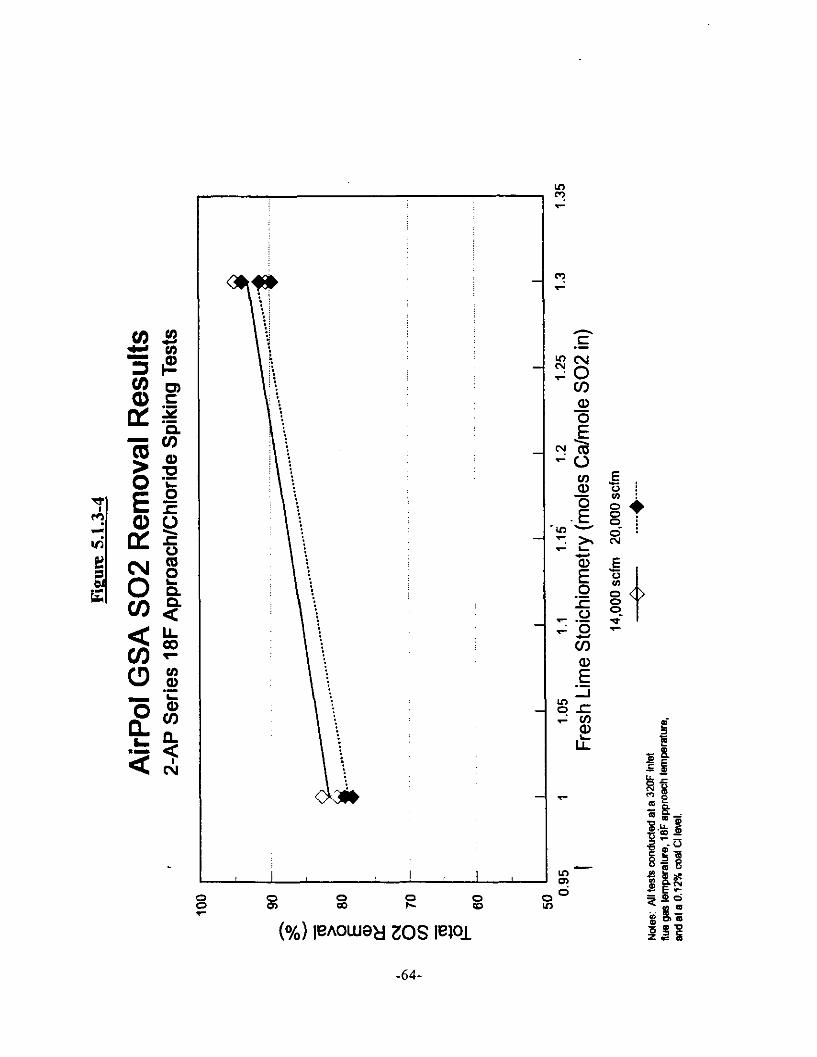
0 z 8
0 E 0
(%) ieA;uw 10s IWL~
go
-64-
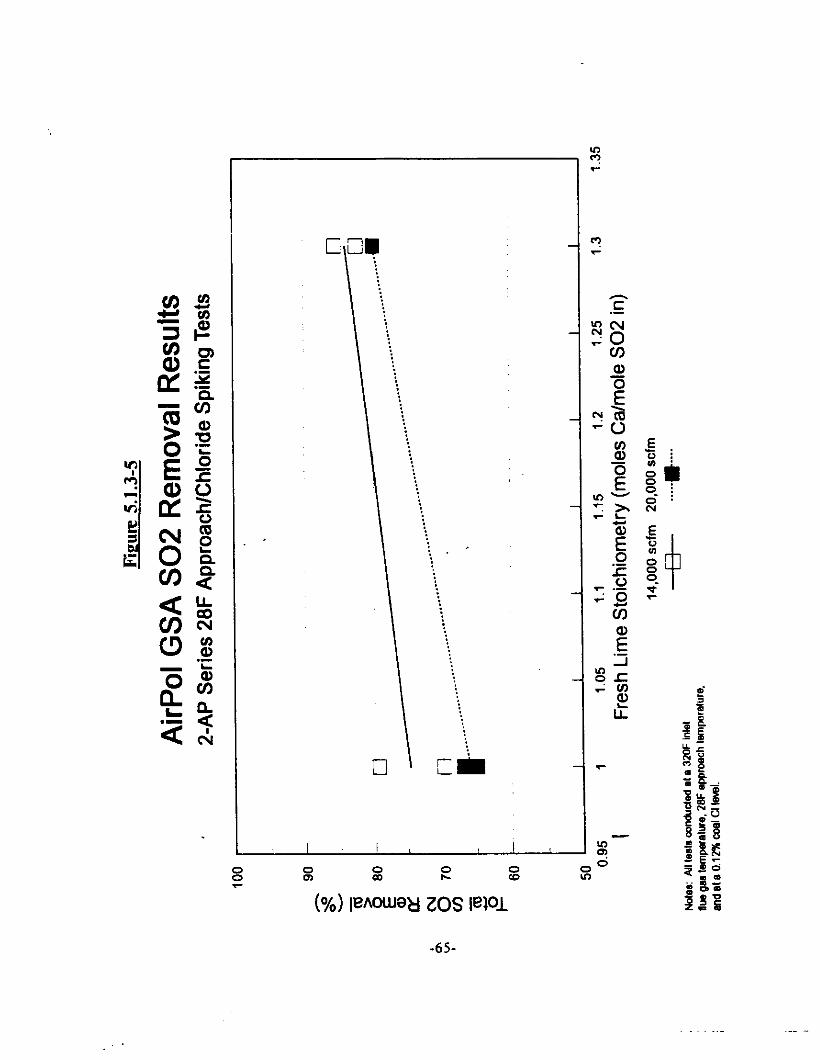
I I I
,
i! .- -l zc GUI
i?? IL
-
8
W leAmaid 10s iewi -65-
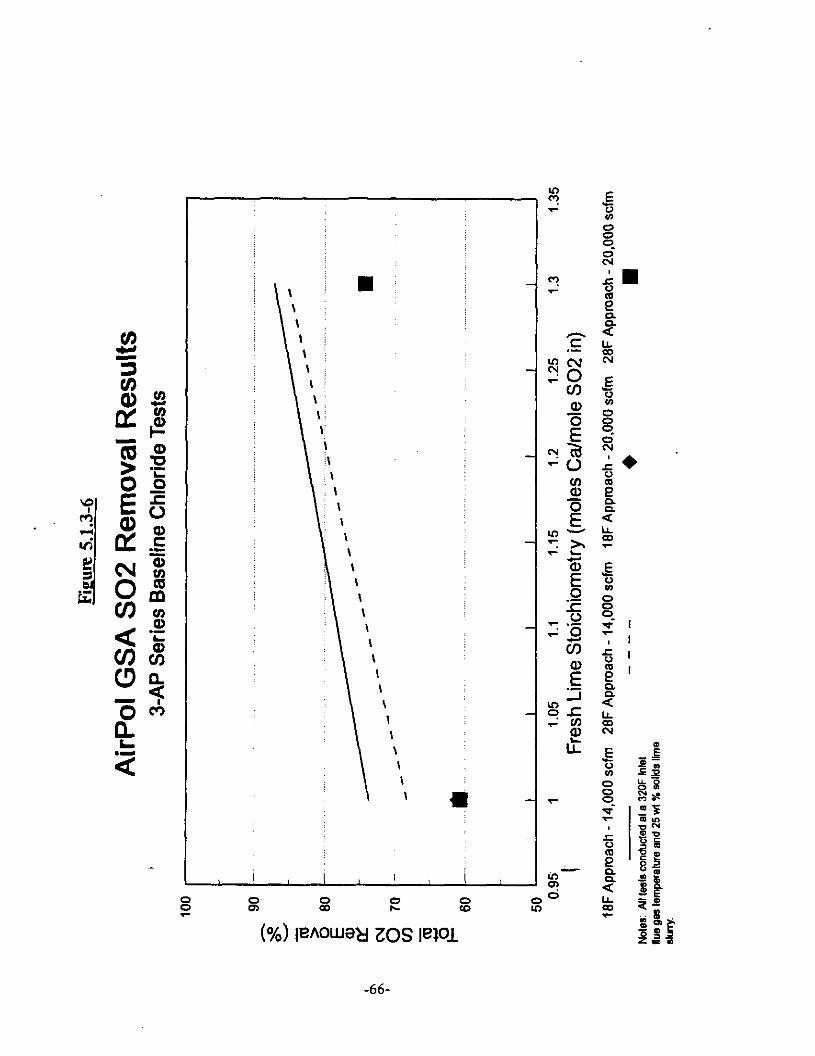
I I / I
s E z E (%I ieAouw 10s wx
-66-
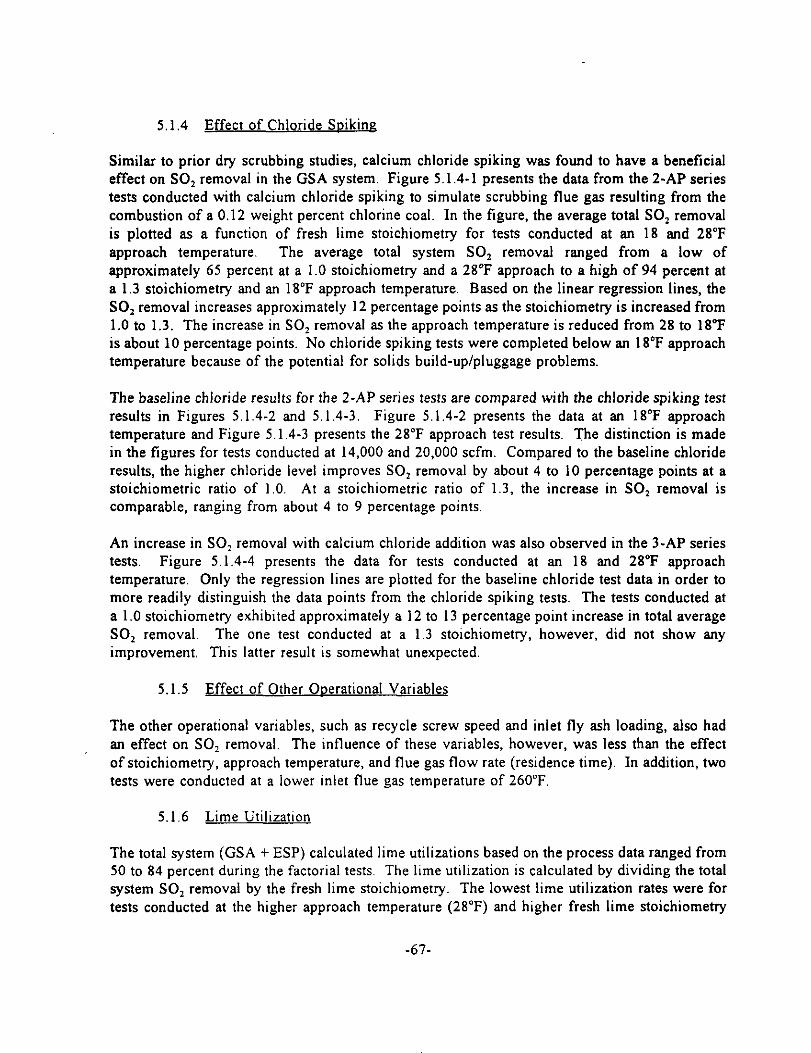
5.1.4 Effect of Chloride Soiking
Similar to prior dry scrubbing studies, calcium chloride spiking was found to have a beneficial effect on SO, removal in the GSA system. Figure 5.1.4-1 presents the data from the 2-AP series tests conducted with calcium chloride spiking to simulate scrubbing flue gas resulting from the combustion of a 0.12 weight percent chlorine coal. In the figure, the average total SO, removal is plotted as a function of fresh lime stoichiometry for tests conducted at an 18 and 28°F approach temperature. The average total system SO, removal ranged from a low of approximately 65 percent at a 1.0 stoichiometry and a 28°F approach to a high of 94 percent at a 1.3 stoichiometry and an 18°F approach temperature. Based on the linear regression lines, the SO, removal increases approximately 12 percentage points as the stoichiometry is increased from 1.0 to 1.3. The increase in SO, removal as the approach temperature is reduced from 28 to 18°F is about 10 percentage points. No chloride spiking tests were completed below an 18°F approach temperature because of the potential for solids build-up/pluggage problems.
The baseline chloride results for the 2-AP series tests are compared with the chloride spiking test results in Figures 5.1.4-2 and 5.1.4-3. Figure 5.1.4-2 presents the data at an 18°F approach temperature and Figure 5.1.4-3 presents the 28°F approach test results. The distinction is made in the figures for tests conducted at 14,000 and 20,000 scfm. Compared to the baseline chloride results, the higher chloride level improves SO, removal by about 4 to 10 percentage points at a stoichiometric ratio of 1 .O. At a stoichiometric ratio of 1.3, the increase in SO, removal is comparable, ranging from about 4 to 9 percentage points.
An increase in SO, removal with calcium chloride addition was also observed in the 3-AP series tests. Figure 5.1.4-4 presents the data for tests conducted at an 18 and 28°F approach temperature. Only the regression lines are plotted for the baseline chloride test data in order to more readily distinguish the data points from the chloride spiking tests, The tests conducted at a 1.0 stoichiometty exhibited approximately a 12 to 13 percentage point increase in total average SO, removal. The one test conducted at a 1.3 stoichiometry, however, did not show any improvement. This latter result is somewhat unexpected.
5.1.5 Effect of Other Ooerational Variables
The other operational variables, such as recycle screw speed and inlet fly ash loading, also had an effect on SO, removal. The influence of these variables, however, was less than the effect of stoichiometry, approach temperature, and flue gas flow rate (residence time). In addition, two tests were conducted at a lower inlet flue gas temperature of 260°F.
5.1.6 Lime Utilisation
The total system (GSA + ESP) calculated lime utilizations based on the process data ranged from 50 to 84 percent during the factorial tests. The lime utilization is calculated by dividing the total system SO, removal by the fresh lime stoichiometry. The lowest lime utilization rates were for tests conducted at the higher approach temperature (28°F) and higher fresh lime stoichiometry
-67-
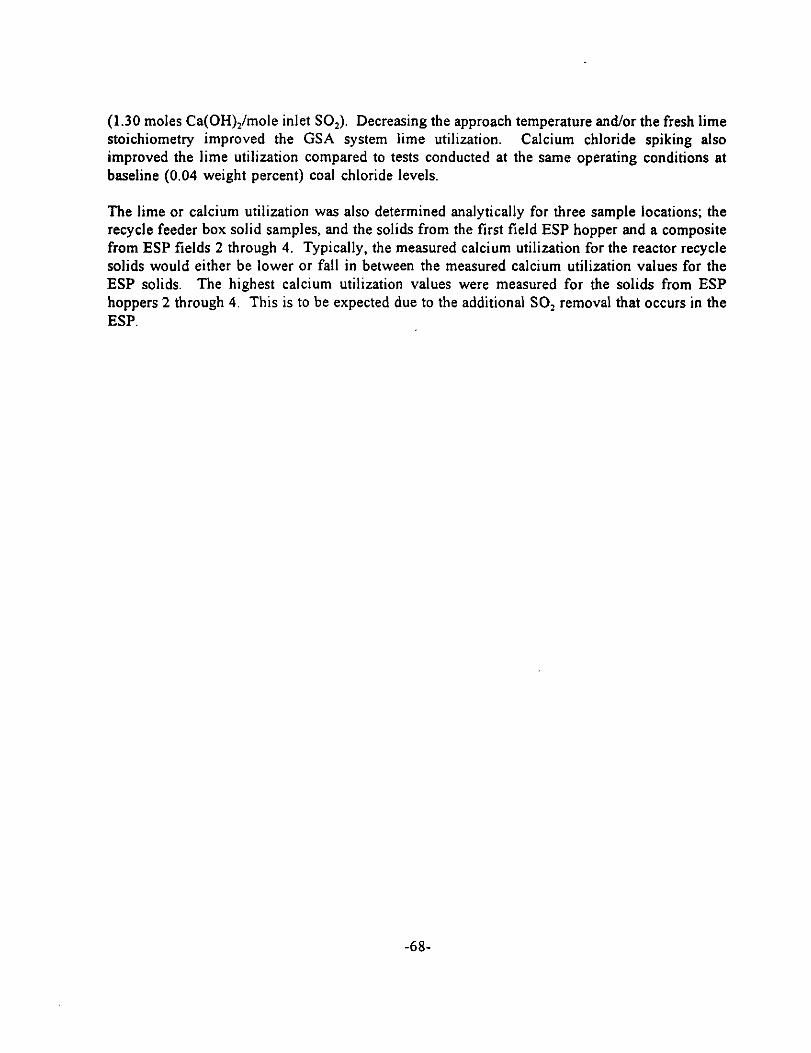
(1.30 moles Ca(OH),/mole inlet SO,). Decreasing the approach temperature and/or the fresh lime stoichiometry improved the GSA system lime utilisation. Calcium chloride spiking also improved the lime utilization compared to tests conducted at the same operating conditions at baseline (0.04 weight percent) coal chloride levels.
The lime or calcium utilization was also determined analytically for three sample locations; the recycle feeder box solid samples, and the solids from the first field ESP hopper and a composite from ESP fields 2 through 4. Typically, the measured calcium utilization for the reactor recycle solids would either be lower or fail in between the measured calcium utilization values for the ESP solids. The highest calcium utilization values were measured for the solids from ESP hoppers 2 through 4. This is to be expected due to the additional SO, removal that occurs in the ESP.
-68.
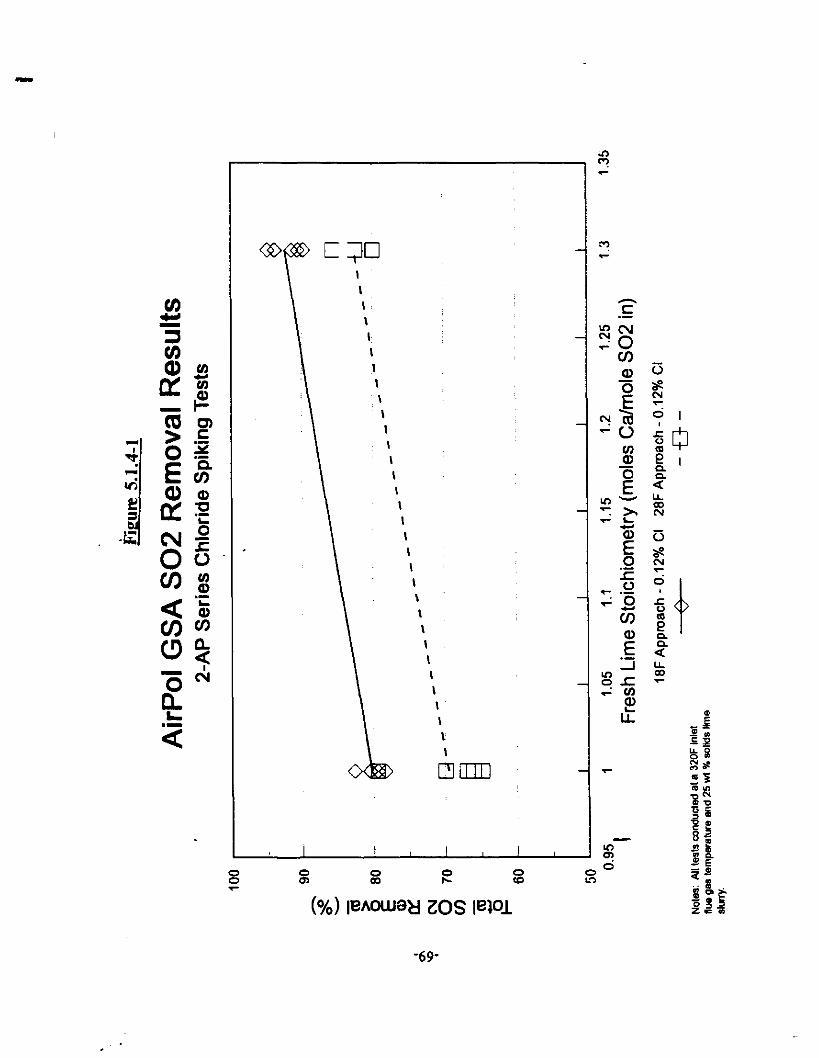
I I \ I \ I I I \ I I F
&mn
(%I ieAow4 10s iwi -69-
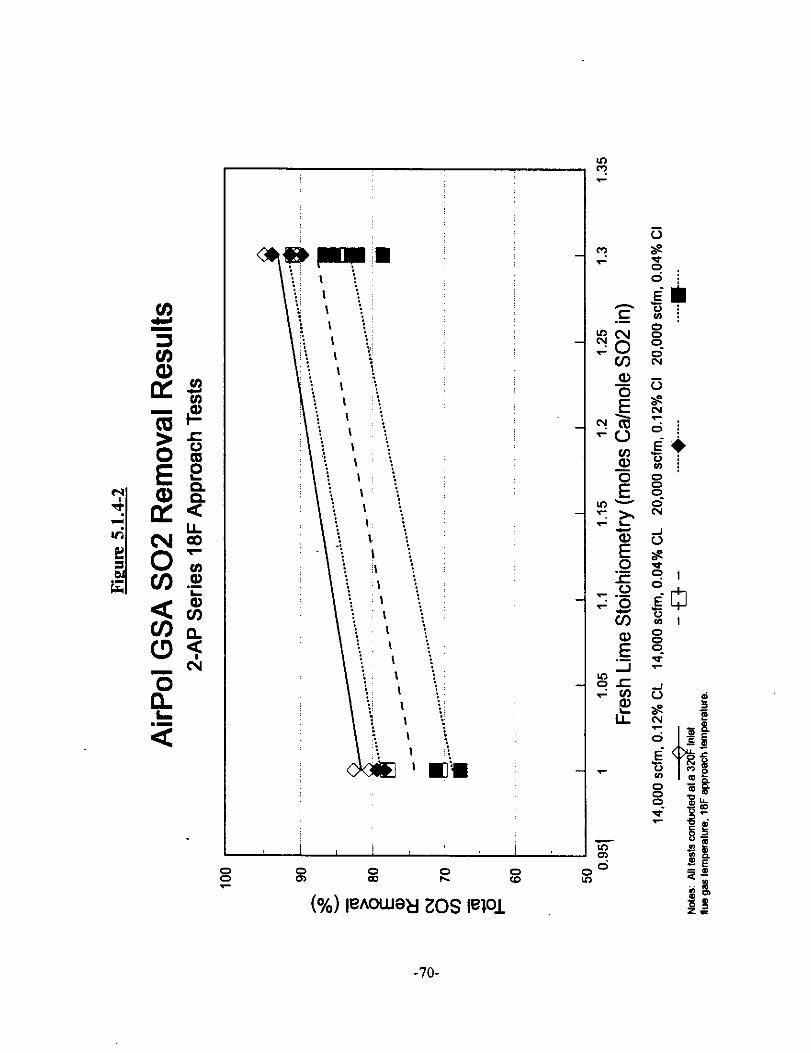
8 8 22 F? s
(%I wuwd 20s tern
-7o-
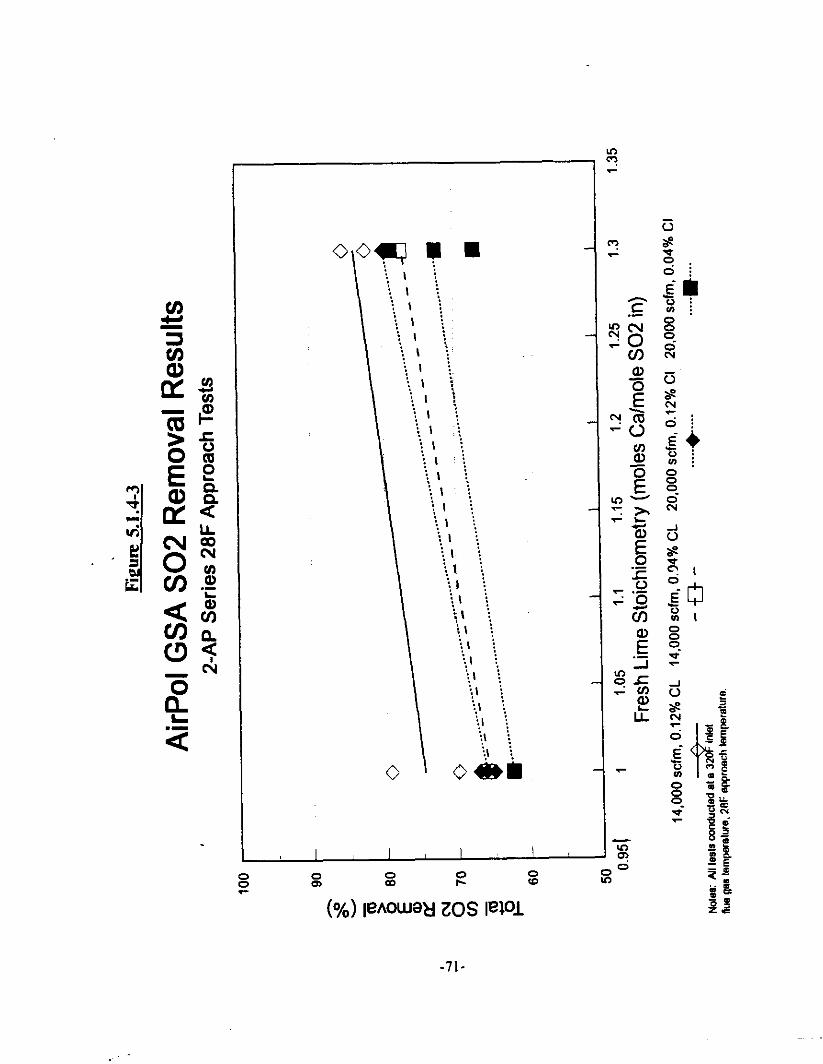
I I I I
-71.
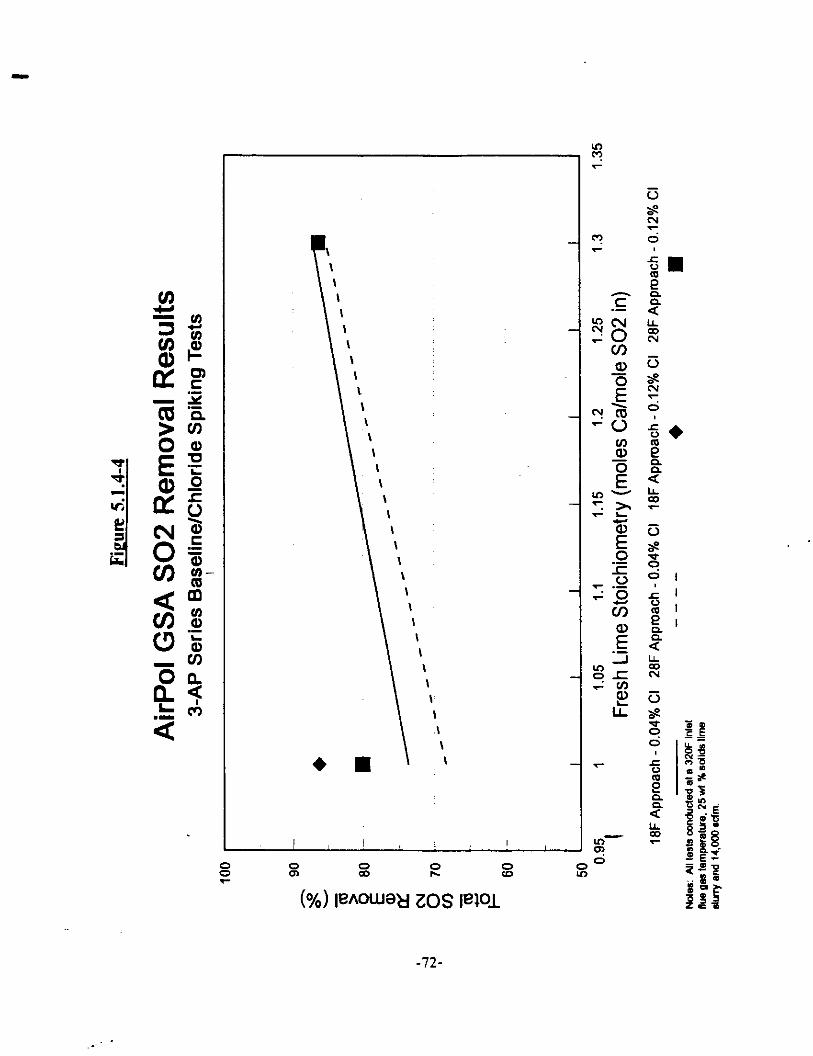
E z zos iw
ri 5 G E .o I$ c
7 .u 6 I Gg $1
cn I i? I
g $ .- -I l.L
2r Fi Fv, 2 IL
I Lo- o! % 0
-72-
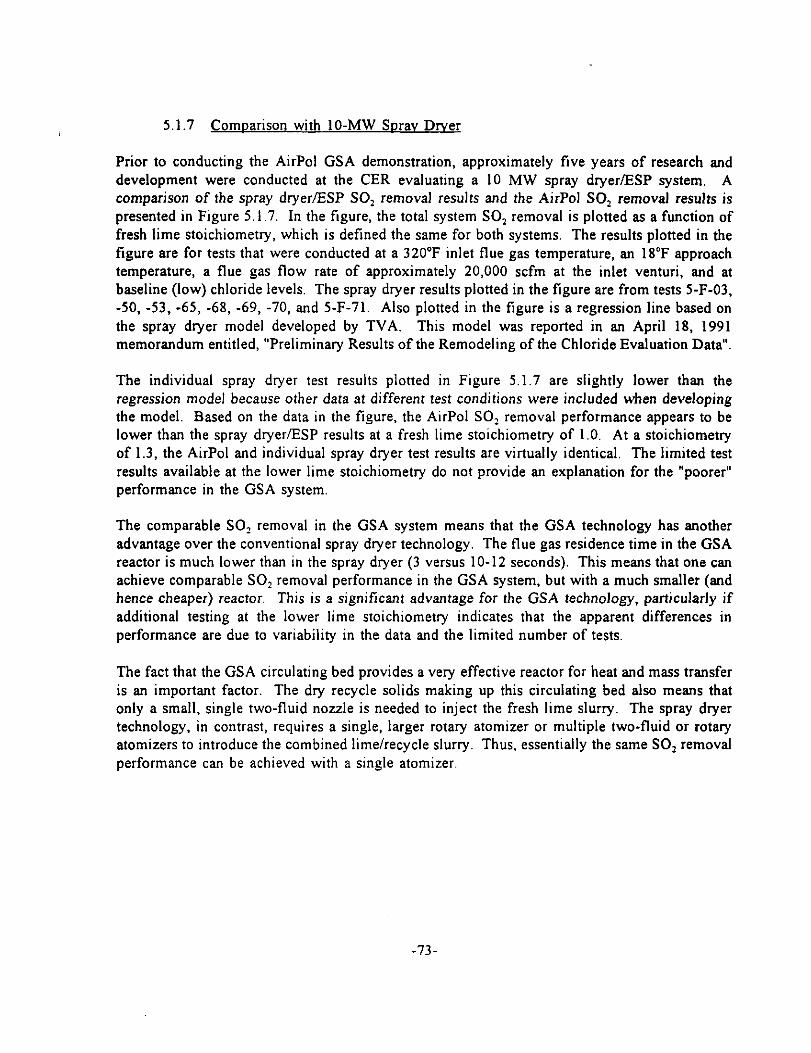
5.1.7 Comoarison with lo-MW Sorav Drver
Prior to conducting the AirPol GSA demonstration, approximately five years of research and development were conducted at the CER evaluating a 10 MW spray dryer/ESP system, A comparison of the spray dryer/ESP SO, removal results and the AirPol SO, removal results is presented in Figure 5.1.7. In the figure, the total system SO, removal is plotted as a function of fresh lime stoichiometry, which is defined the same for both systems. The results plotted in the figure are for tests that were conducted at a 320°F inlet flue gas temperature, an 18°F approach temperature, a flue gas flow rate of approximately 20,000 scfm at the inlet venturi, and at baseline (low) chloride levels. The spray dryer results plotted in the figure are from tests 5-F-03, -50, -53, -65, -68, -69, -70, and S-F-71. Also plotted in the figure is a regression line based on the spray dryer model developed by TVA. This model was reported in an April 18, 1991 memorandum entitled, “Preliminary Results of the Remodeling of the Chloride Evaluation Data”.
The individual spray dryer test results plotted in Figure 5.1.7 are slightly lower than the regression model because other data at different test conditions were included when developing the model. Based on the data in the figure, the AirPol SO, removal performance appears to be lower than the spray dryer/ESP results at a fresh lime stoichiometry of 1.0. At a stoichiometry of 1.3, the AirPol and individual spray dryer test results are virtually identical. The limited test results available at the lower lime stoichiometry do not provide an explanation for the “poorer” performance in the GSA system.
The comparable SO, removal in the GSA system means that the GSA technology has another advantage over the conventional spray dryer technology. The flue gas residence time in the GSA reactor is much lower than in the spray dryer (3 versus lo-12 seconds). This means that one can achieve comparable SO, removal performance in the GSA system, but with a much smaller (and hence cheaper) reactor. This is a significant advantage for the GSA technology, particularly if additional testing at the lower lime stoichiometry indicates that the apparent differences in performance are due to variability in the data and the limited number of tests.
The fact that the GSA circulating bed provides a very effective reactor for heat and mass transfer is an important factor. The dry recycle solids making up this circulating bed also means that only a small, single two-fluid nozzle is needed to inject the fresh lime slurry. The spray dryer technology, in contrast, requires a single, larger rotary atomizer or multiple two-fluid or rotary atomizers to introduce the combined lime/recycle slurry. Thus, essentially the same SO, removal performance can be achieved with a single atomizer.
-73-
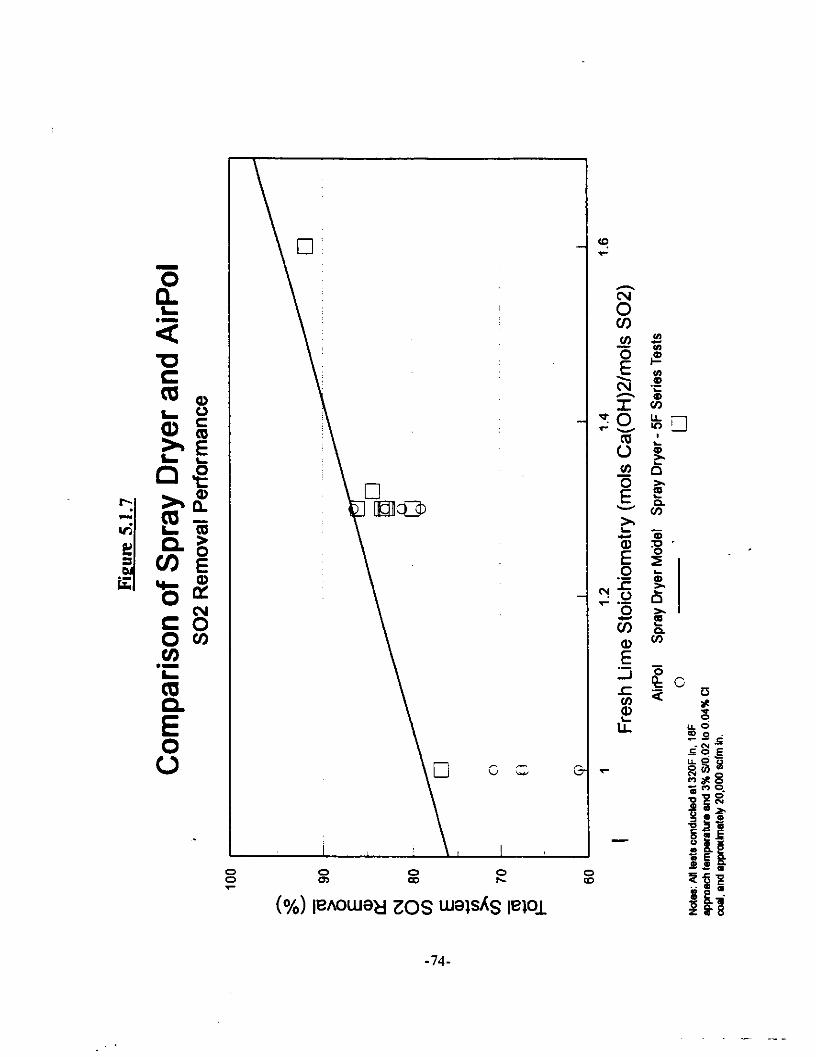
8 2 s I? (%I iemuw zos w&3 leiol
-74-
5. I .8 28-Dav Demonstration Run
As part of the Clean Coal III GSA test plan, a 28-day (approximately 690 hours) demonstration run was performed at one set of operating conditions. This run began on October 25 and was completed on November 24 with one short outage due to a boiler tube leak. The operating conditions selected for this demonstration run were an overall system SO, removal set point of 91 percent, an 18°F approach temperature, 20,000 scfm flue gas flow rate at the inlet venturi, 320°F inlet flue gas temperature, 30 ‘pm recycle screw speed, a fly ash injection rate equivalent to 1.5 gr/acf, and calcium chloride spiking to simulate scrubbing flue gas from a boiler firing a 0.12 weight percent chlorine coal. This demonstration run was divided into 9 test segments to keep the data files manageable. The length of these test segments varied from I to 7 days. With the exception of the last two test segments, l-DR-07 and l-DR-08, the fresh lime stoichiometry was allowed to fluctuate to meet the target SO, removal. The fresh lime stoichiometry was fixed at 1.40 and 1.45 moles Ca(OH),/mole inlet SO, for test segments l-DR-07 and l-DR-08, respectively.
The I-MW pulse-jet baghouse was down during all of these test segments with the exception of test 3-DR-04. The PJBH was operated for approximately 30 hours during this test segment before being shut down due to failure of approximately l/3 of the bags. The original plan had been to operate the PJBH during the last two weeks of the demonstration run, but this plan was abandoned.
A summary of the average operating conditions and SO, removal performance for the DR series test segments is presented in Table 5.1.8. With the exception of test segments l-DR-06 and l- DR-07, the average total system SO, removal for all of the test segments was greater than 90 percent. The average fresh lime stoichiometty required to achieve this SO, removal varied from 1.32 to 1.58 moles Ca(OH),/mole inlet SO, and the lime utilization rates ranged from 58 to 69 percent during the demonstration run.
The fluctuation in fresh lime stoichiometry is illustrated more clearly in Figure 5.1.8, which plots the average daily stoichiometry during the demonstration run. As shown in the figure, the average daily stoichiometty ranged from 1.4 to 1.6 moles Ca(OH),/mole inlet SO,. During the last three days of the demonstration run, the stoichiometry was fixed at values of 1.40 and 1.45 moles Ca(OH),/mole inlet SO,.
The demonstration run test conditions were selected based on the results from the prior factorial tests i.e., greater than 90 percent overall SO2 removal at a reasonable, 1.3 moles Ca(OH),/mole inlet SO, stoichiometry These results were obtained in test 2-AP-06, which was conducted in March, and tests 2-AP-91 and 2-AP-92, which were conducted in June. However, during the demonstration run, fresh lime stoichiometries greater than 1.4 moles Ca(OH),/mole inlet SO, were required to achieve over 90 percent overall SO, removal.
There are several possible explanations for this discrepancy in required stoichiometry to achieve greater than 90 percent SO, removal. Part of this discrepancy is probably due to unit 9 tiring a
higher sulfur coal during some of the test segments. Approximately one week into the demonstration run on October 31, the supply of Andalex coal was exhausted and the unit was switched to a higher sulfur Warrior coal. The unit continued to bum this higher sulfur coal until November 9. The unit also briefly burned this higher sulfur coal again on November 11, 18, and 22. Based on data from prior tests, an increase in inlet SO, concentration resulted in decreased SO, removal performance. Thus, the higher lime stoichiometries during these periods, i.e., 1.5- 1.6 moles Ca(OH),/mole inlet SO,, were not completely unexpected and these high lime stoichiometries are not a major concern. Also, some of the demonstration test segments were conducted at lower solids chloride levels compared to the factorial tests. Late in the demonstration run, it was discovered that the fly ash loading to the GSA reactor may have been higher than originally planned. The source of this excess ash may have been the higher ash levels in the flue gas entering the GSA system. This higher ash level would dilute both the chloride and the alkalinity levels in the system.
-76.

L - -77-
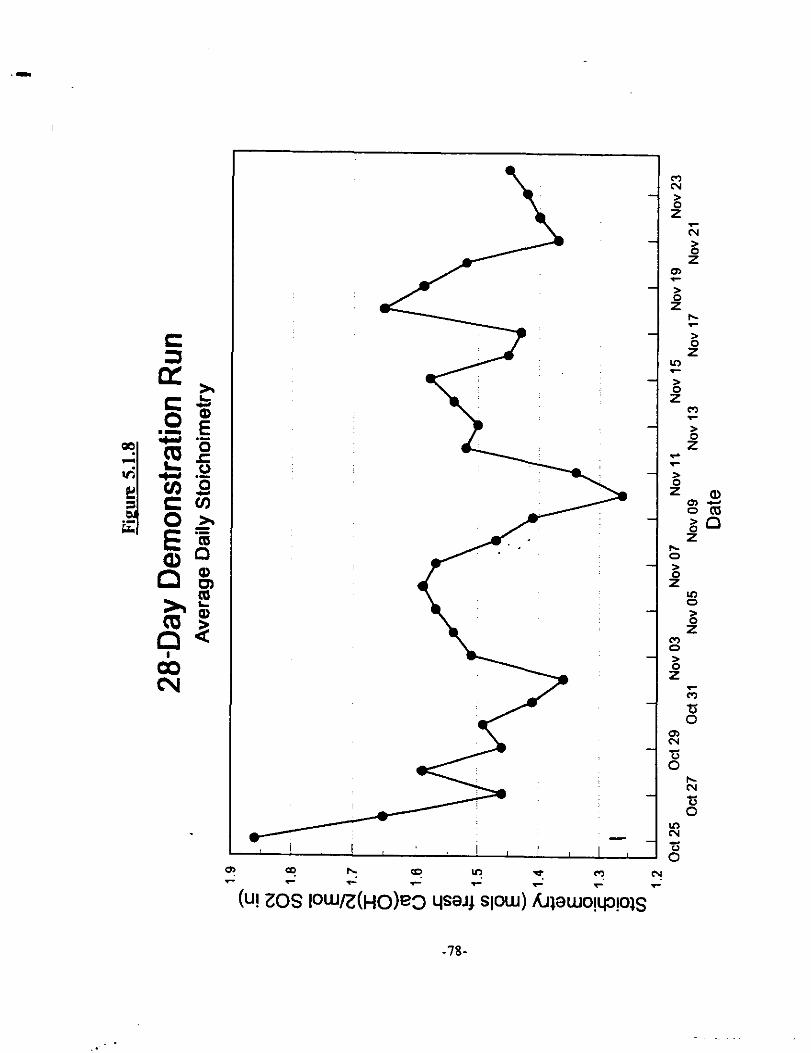
(u! ZOS lOWZ(HO)e3 WJ4 VJJ) @UJo!W!W
-78-
.
5.1.9 14-Dav Pulse-iet Bazhouse Demonstration Run
As mentioned in the previous section, the pulse-jet fabric filter was to be operated for two weeks in parallel with the ESP during the 28-day demonstration run. However, due to the failure of the PJBH bag fabric, the PJBH was not operated during this time period. Therefore, the demonstration run conditions were repeated, beginning in February, with the PJBH in operation to evaluate PJBH performance over a longer period of time at one set of operating conditions,
The operating conditions for the PJBH demonstration run were an overall system SO, removal set point of 91 percent, an 18°F approach temperature, 20,000 scfm flue gas flow rate at the inlet venturi, 320°F inlet flue gas temperature, 30 ‘pm recycle screw speed, and calcium chloride spiking to simulate scrubbing flue gas from a boiler tiring a 0. I2 weight percent chlorine coal. One difference in the operating conditions for the PJBH demonstration run compared to the prior, 28-day demonstration run, was a lower fly ash injection rate. During the 28-day demonstration run, the fly ash injection rate was set to achieve an inlet particulate concentration of 1.5 gr/acf to the GSA reactor. This concentration does not include the fly ash already present in the flue gas. The desired total particulate concentration is 2.0 gr/acf. Since the particulate concentration from Unit 9 is higher while firing the Andalex coal (approximately 1.0 gr/acf versus 0.5 gr/acf with previously fired coals), the fly ash injection rate set point was reduced to 1.0 gr/acf for the PJBH demonstration run.
All of the PJBH demonstration run test segments were conducted while Unit 9 fired medium- sulfur. low-chloride Andalex coal (2.8% S/0.04% Cl). Mississippi pebble lime was used for all the tests and the lime slurry solids concentration set point was 25 percent. The ESP was operated with all four fields in service and the baffle was in place in the fourth field ESP hopper during all test segments.
The PJBH demonstration run was divided into 4 test segments to keep the data files manageable. The length of these test segments varied from 4 to 5 days. One segment of the I-PJ series demonstration run was completed in February and three test segments were completed during the month of March. A summary of the average operating conditions and SO, removal performance is presented in Table 5.1.9-l for all of the PJBH demonstration test segments.
A plot of the average daily fresh lime stoichiometry during the demonstration run is presented in Figure 5.1.9-l. As shown in the figure, there were two periods when the stoichiometry was significantly higher than the overall demonstration run average of 1.40 moles Wmole of inlet SO,. The first period was from February 28 through March I. The high stoichiometry during this period was due to the lime flow meter calibration. Based on a flow meter calibration on March 1, the lime flow meter was indicating 4 percent higher than the actual lime flow rate. Therefore, the reported stoichiometry was 4 percent higher than the actual stoichiometty for some period prior to the March I calibration. Based on the data, the reported stoichiometry for February 28 may have also been influenced by the lime flow meter calibration.
The second period in which the fresh lime stoichiometry was significantly higher than the overall
-?9-
test average was after the pilot unit outage from March 8 to March 10. When the PIBH demonstration run resumed on March 12, the fresh lime stoichiometty was very high averaging over 1.7 moles &/mole of inlet SO,. The high stoichiometry required to achieve the 91 percent SO, removal set point is probably due to the low chloride concentration in the recycle and ESP solids during the first part of this test segment. Several of the recycle and ESP solid samples on March 12, had either none or very low levels of chloride. The reactor and ESP solids chloride levels did not reach steady state until approximately mid-day on March 13. Therefore, the data from March 12 was not used in developing the test segment averages.
Also influencing the fresh lime stoichiometry was the wet bulb temperature used during the demonstration run. There were several periods during the demonstration run when the approach temperature control was switched between the manual wet bulb measurements and the continuous wet bulb monitor (CWBM). This switching was due to problems with the CWBM in which the two measurements deviated by more than 3°F. Test data in which an inaccurate wet bulb temperature was used for approach temperature control was removed prior to developing the reported test results.
Figure 5.1.9-2 provides a plot of the average total system SO, removal for each PJBH demonstration run test segment. The total system SO, removal for both the GSAIESP and the GSAlPJBH configurations are plotted in the figure. The GSA/ESP total SO, removal averaged 91.2 percent during the demonstration run. The GSA/PJBH total SO, removal, presented in Table 5.1.9-2, was significantly higher and averaged 97.7 percent. Since the GSA/PJBH configuration provides much higher SO, removal performance compared to the GSAIESP, the stoichiometry to achieve 91 percent overall SO, removal would be lower than the average of 1.40 moles Q/mole of inlet SO, for the GSA/ESP configuration.
The average total system lime utilization for both the GSAIESP and GSA/PJBH configurations is presented in Figure 5.1.9-3. The GSA/ESP total system lime utilisation averaged 66.1 percent during the demonstration run. The GSA/PJBH total system lime utilization was 4.4 percentage points higher, due to the higher SO, removal across the PJBH, and averaged 70.5 percent. Therefore, the GSA/PJBH configuration would be more cost effective in terms of reagent utilization in comparison to the GSA/ESP configuration.
Figure 5.1.9-4 presents the calculated reactor lime utilization and the measured reactor recycle solids calcium utilization for each PJBH demonstration run test segment. As shown in the figure, the calculated and measured utilizations are almost identical for all four test segments. This very good agreement helps to validate the reported SO, removal results.
-SO-
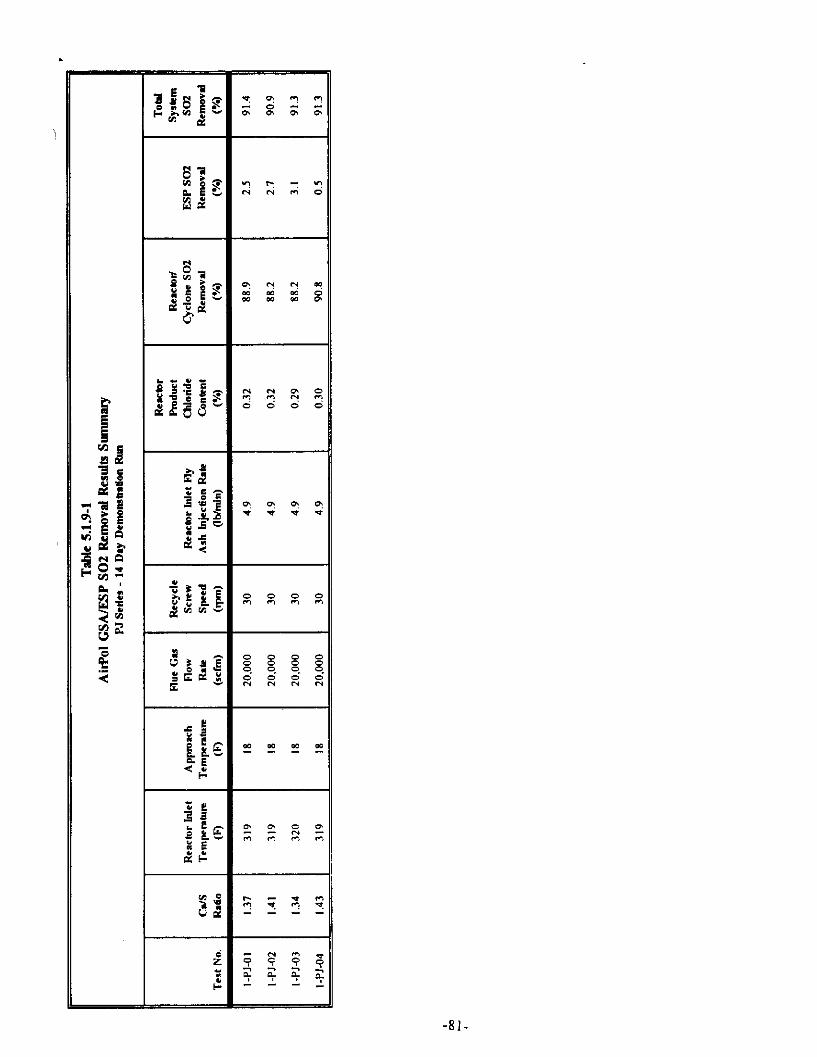
8 ;“’ us
afje
-81-
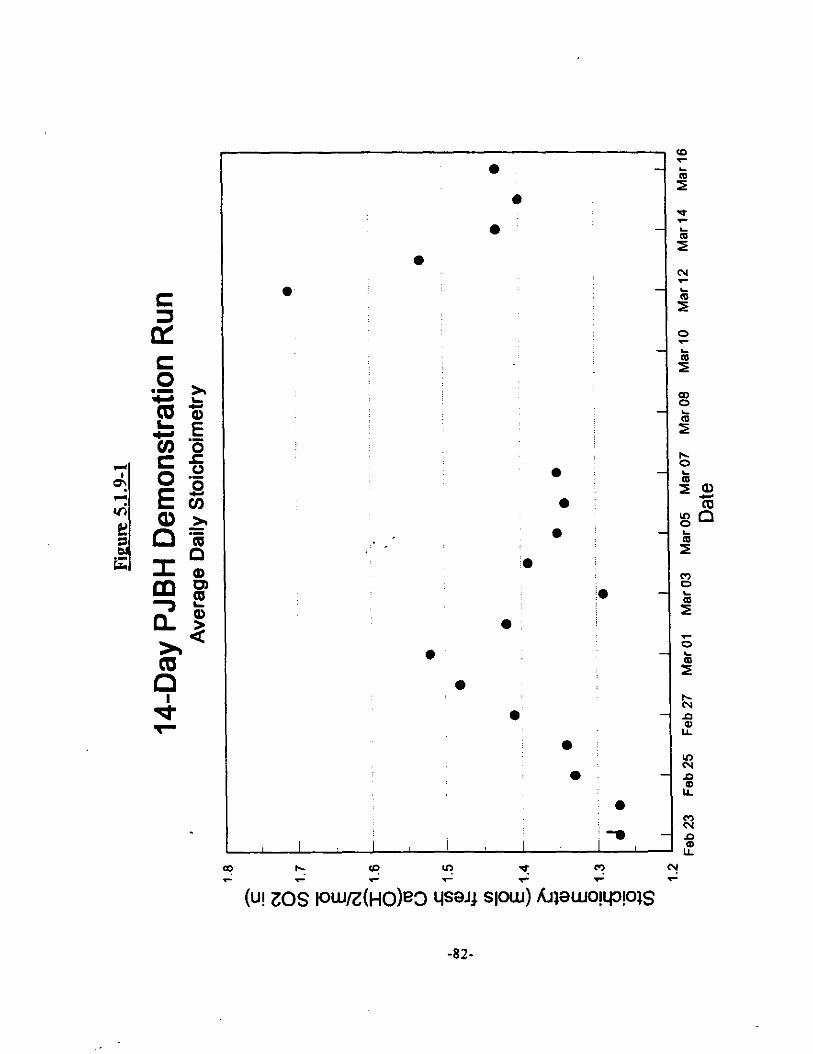
c
0
0 :
l
‘9 ? c1 ru
(U! & ~Ul/&o)e~ &Jr S,O,‘, ttJ~WJO;l.f3!0&’ .-
-82-

8 % % s z i%
(%) wwd 10s ws& iwl
-83-
_: .
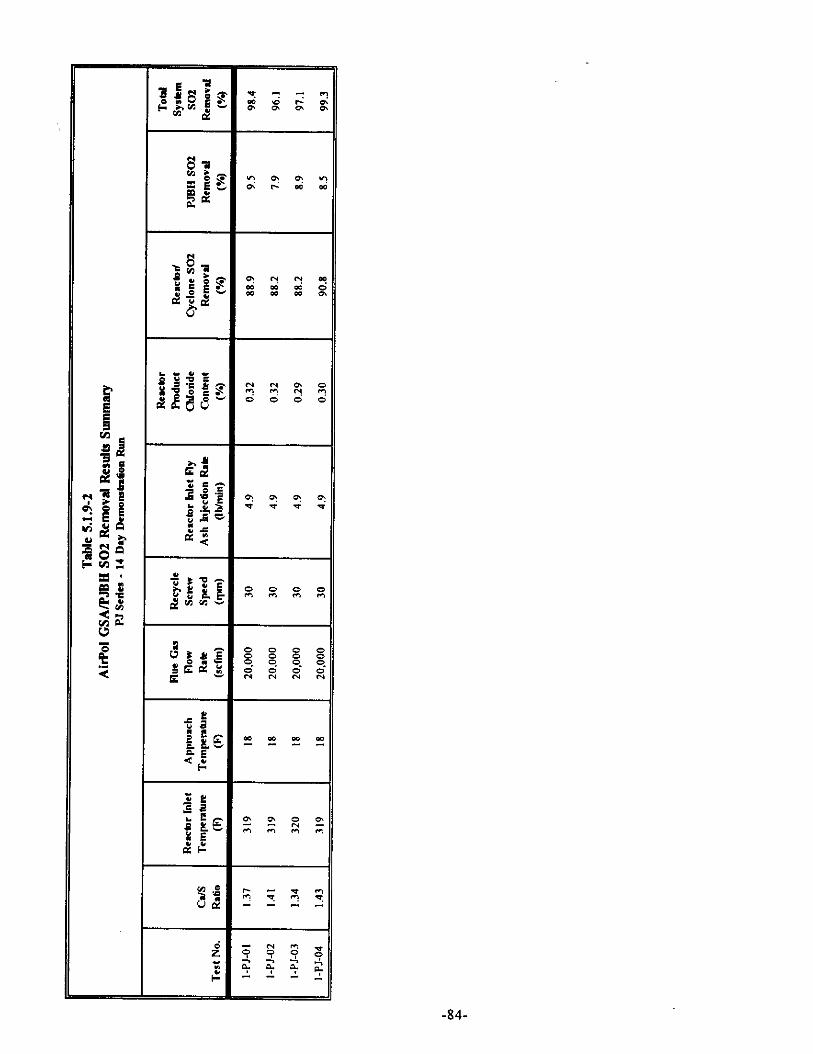
sii v1 sg = E. 52
% % % 4
-84-
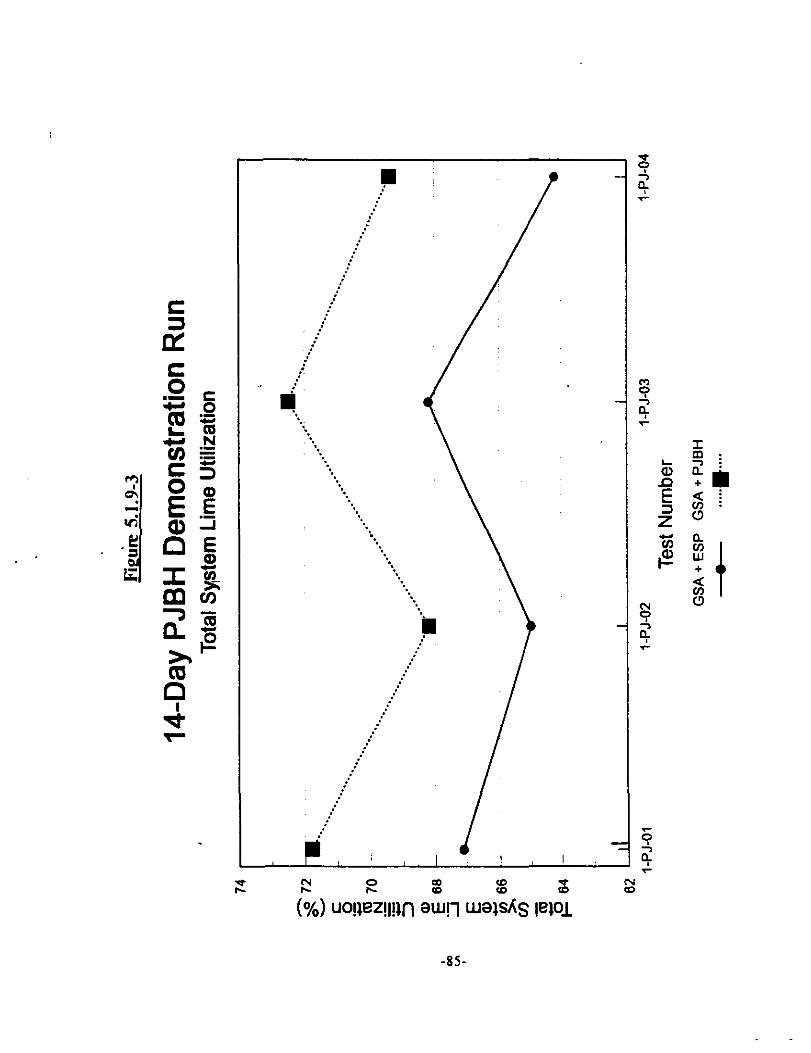
l% : p
cl
i + ;f 0 t
z &) “0!&&” ai%, w-a& ,ej: 2
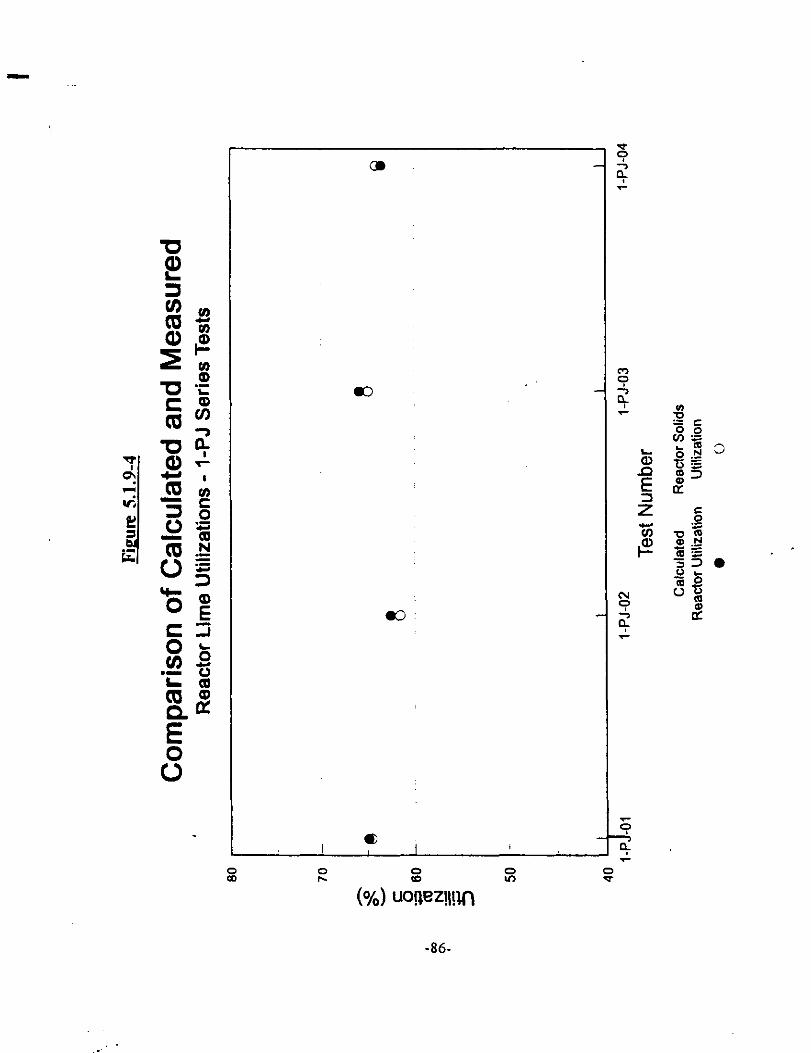
$ 2 (%) uGLmn
5: s
-86-
. ..’ t
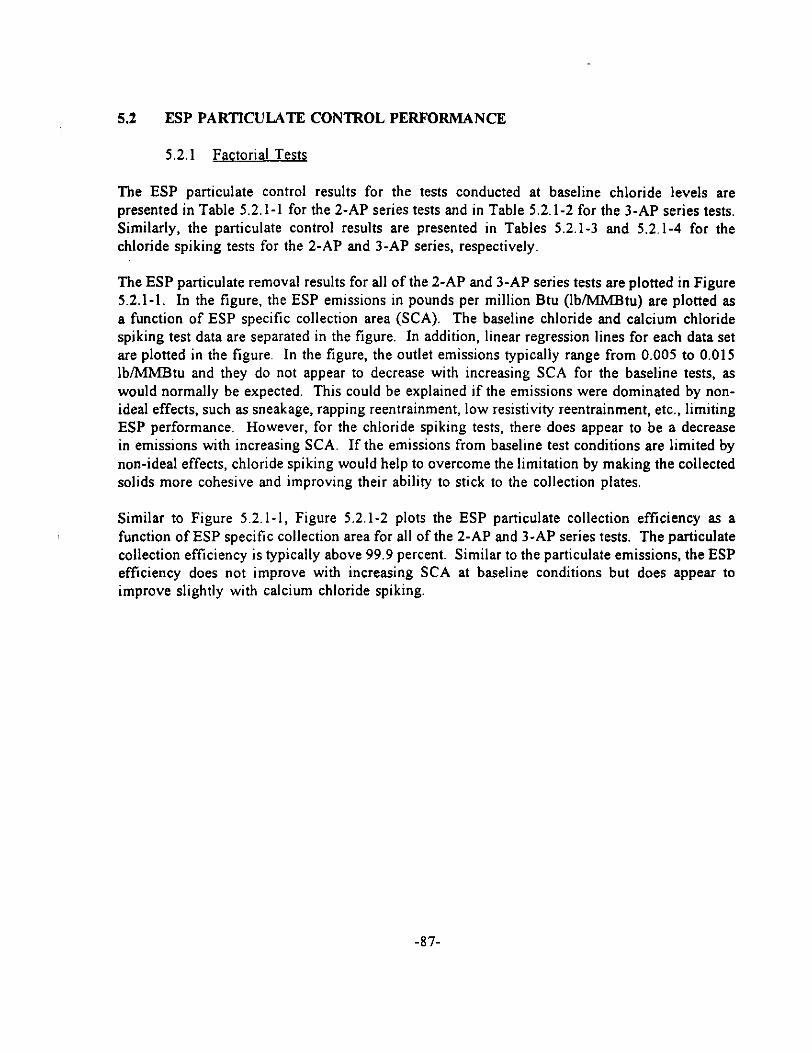
5.2 ESP PARTICUL.4TE CONTROL PERFORMANCE
5.2.1 Factorial Tests
The ESP particulate control results for the tests conducted at baseline chloride levels are presented in Table 5.2.1-l for the 2-AP series tests and in Table 5.2.1-2 for the 3-AP series tests. Similarly, the particulate control results are presented in Tables 5.2.1-3 and 5.2.1-4 for the chloride spiking tests for the 2-AP and 3-AP series, respectively.
The ESP particulate removal results for all of the 2-AP and 3-AP series tests are plotted in Figure 5.2.1-I. In the figure, the ESP emissions in pounds per million Btu (Ib/MMBtu) are plotted as a function of ESP specific collection area (SCA). The baseline chloride and calcium chloride spiking test data are separated in the figure. In addition, linear regression lines for each data set are plotted in the figure. In the figure, the outlet emissions typically range from 0.005 to 0.015 Ib/MhIBtu and they do not appear to decrease with increasing SCA for the baseline tests, as would normally be expected. This could be explained if the emissions were dominated by non- ideal effects, such as sneakage. rapping reentrainment, low resistivity reentrainment, etc., limiting ESP performance. However, for the chloride spiking tests, there does appear to be a decrease in emissions with increasing SCA. If the emissions from baseline test conditions are limited by non-ideal effects, chloride spiking would help to overcome the limitation by making the collected solids more cohesive and improving their ability to stick to the collection plates,
Similar to Figure 5.2.1-1, Figure 5.2.1-2 plots the ESP particulate collection efficiency as a function of ESP specific collection area for all of the 2-AP and 3-AP series tests. The particulate collection efficiency is typically above 99.9 percent. Similar to the particulate emissions, the ESP efficiency does not improve with increasing SCA at baseline conditions but does appear to improve slightly with calcium chloride spiking.
-87-
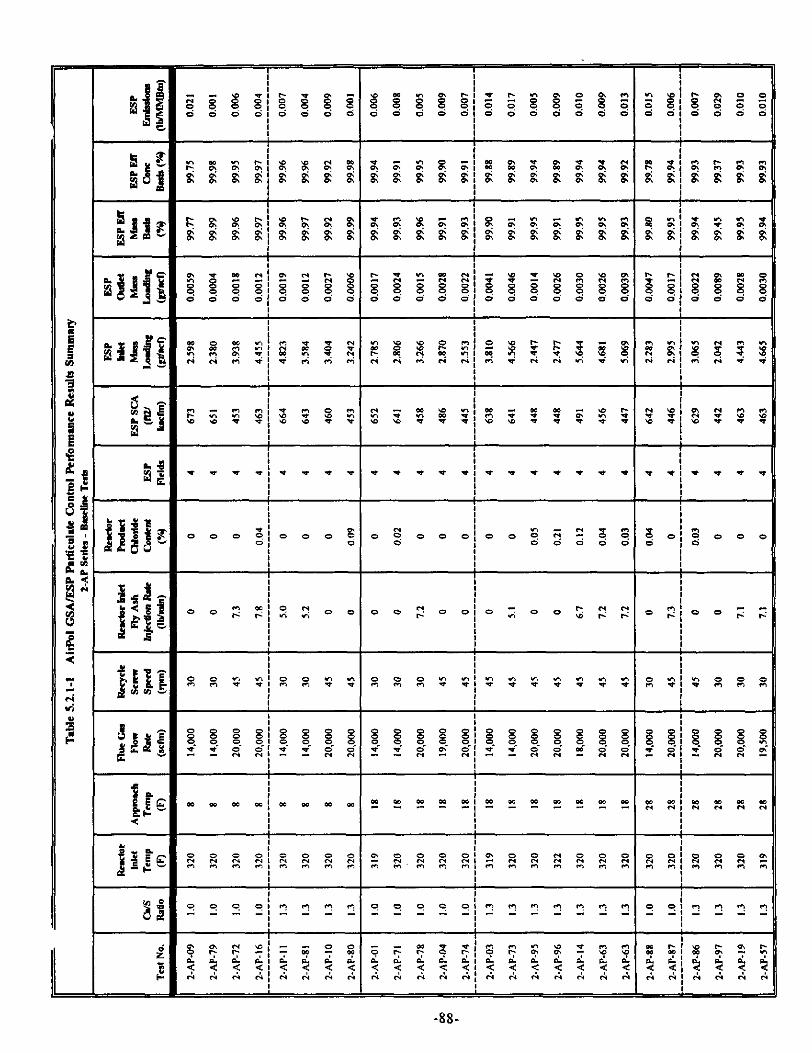
I I
v *It t 9 -a I
-+---
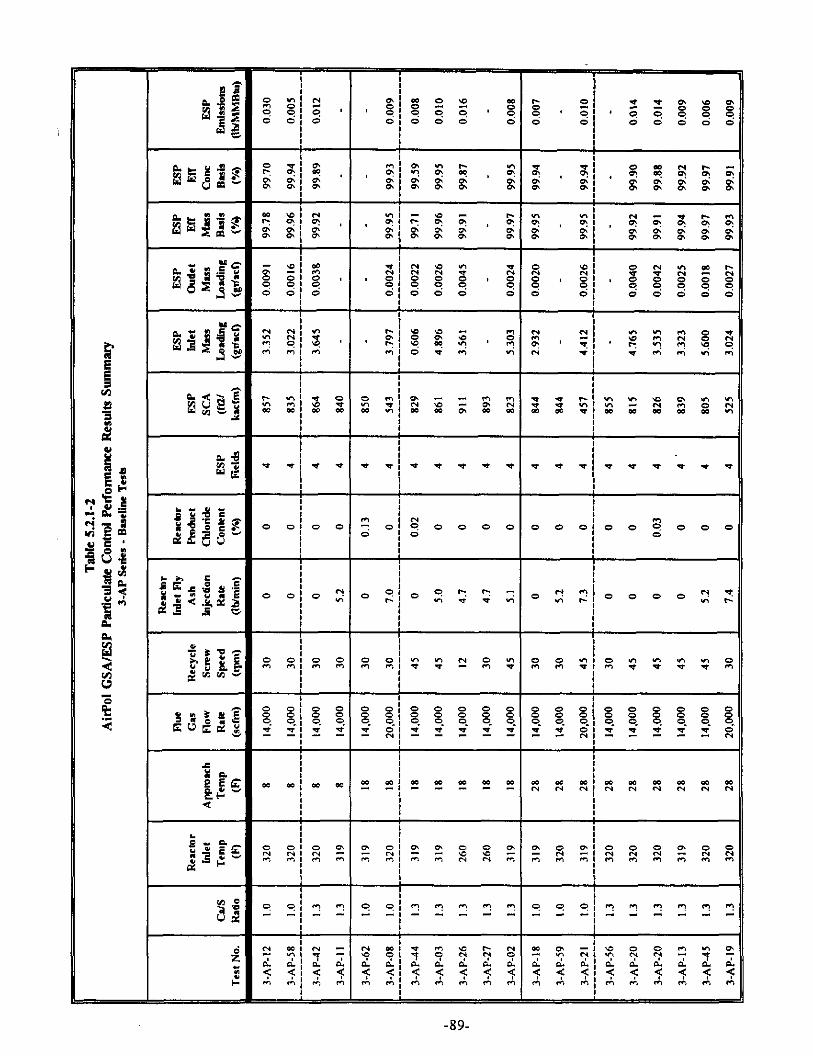
&S ; .= $F “ar,gI
:,rotg EUEZ:y
4 ni 2 x XI. ’
dl 0 I
!
? ., , x.i $ % %I $
-89-
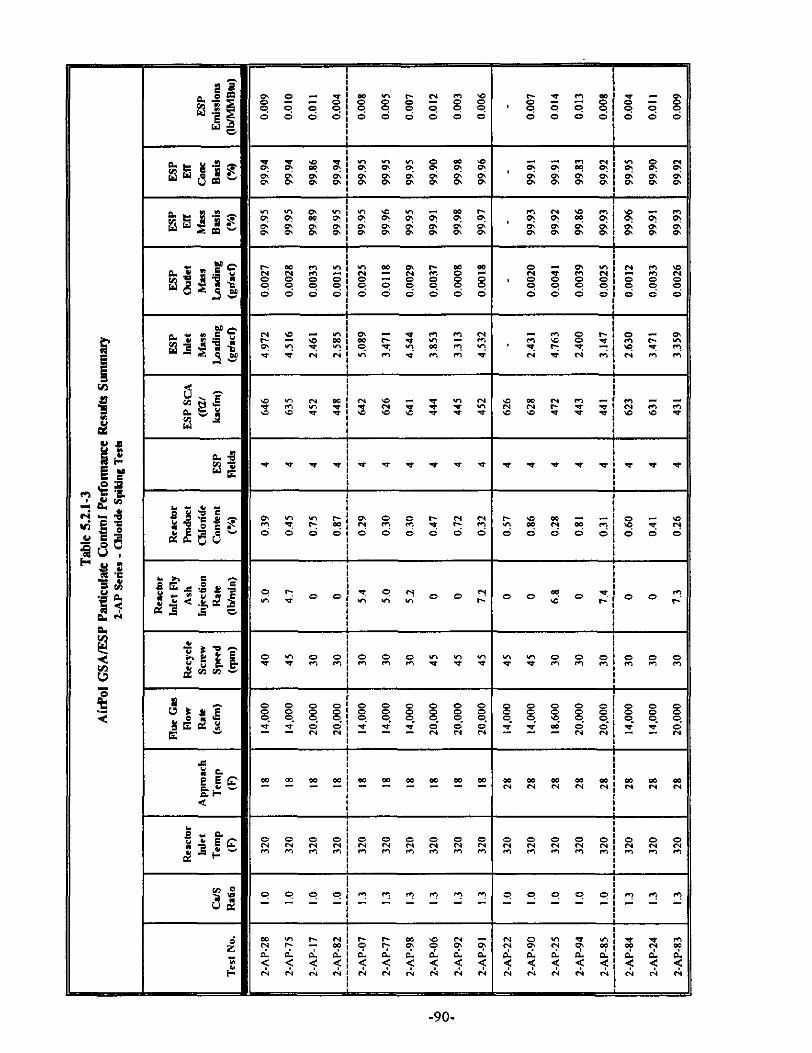
-9o-
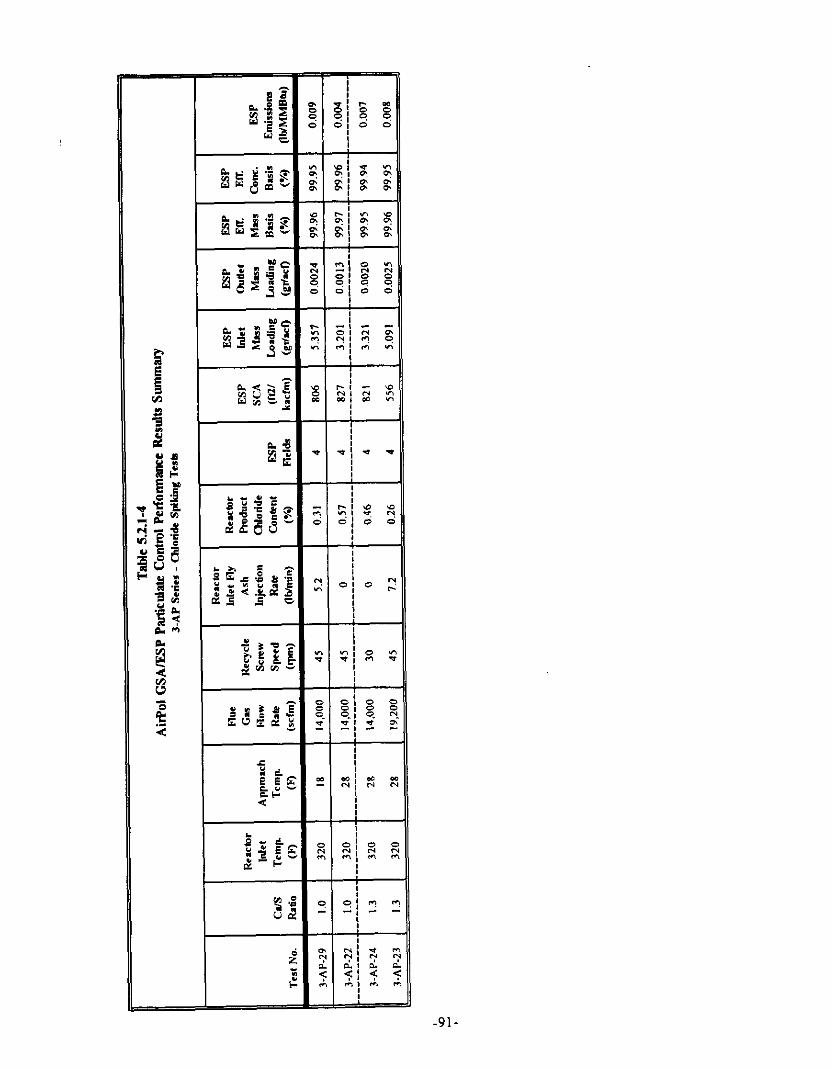
Lh g * gE5.t * .<.%df z.5 s
SP$f!i EUECL,
s 8
c
c
*
I -
; t
: !
:
fl
R r.3
0
4
i 0
;I% “x j/ 2 d
0 :
4 :
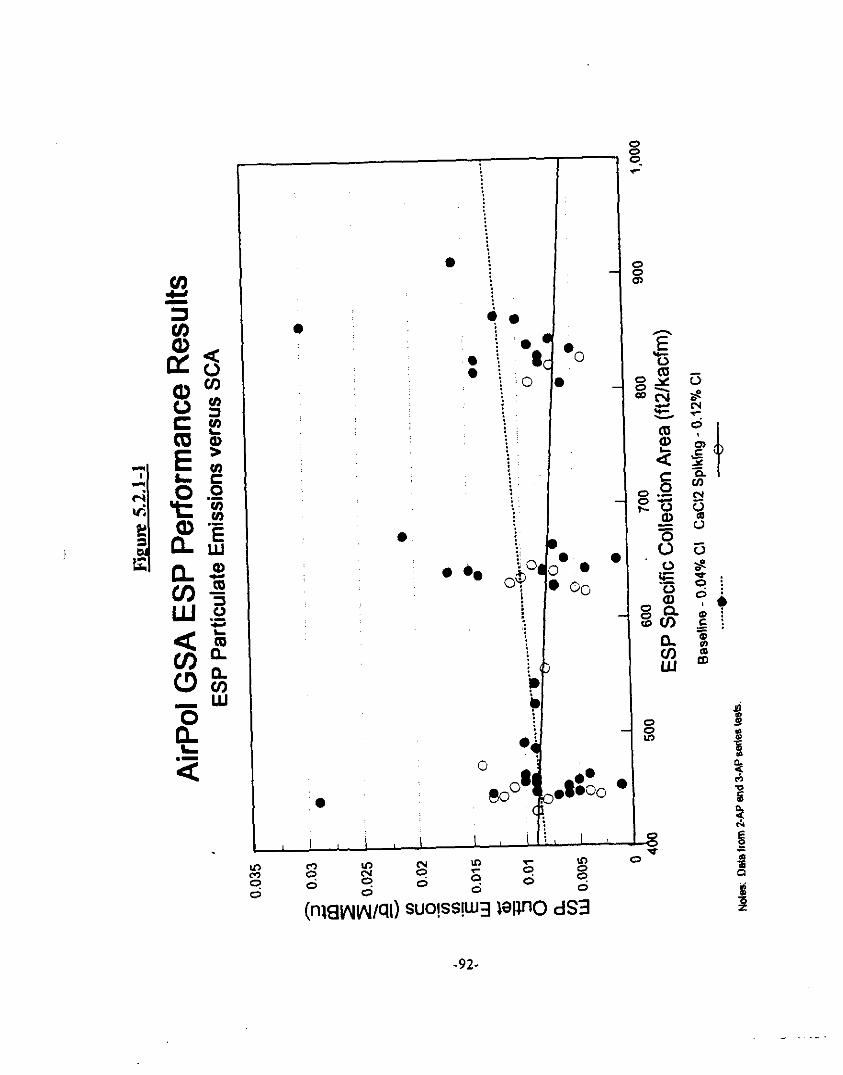
-S G
c s i
- : c
t ( I
“0 l
Q3
,&C 0
E t
g o 9 is!
lawOdS03 4
l i
1 :i
o&38:
-92-
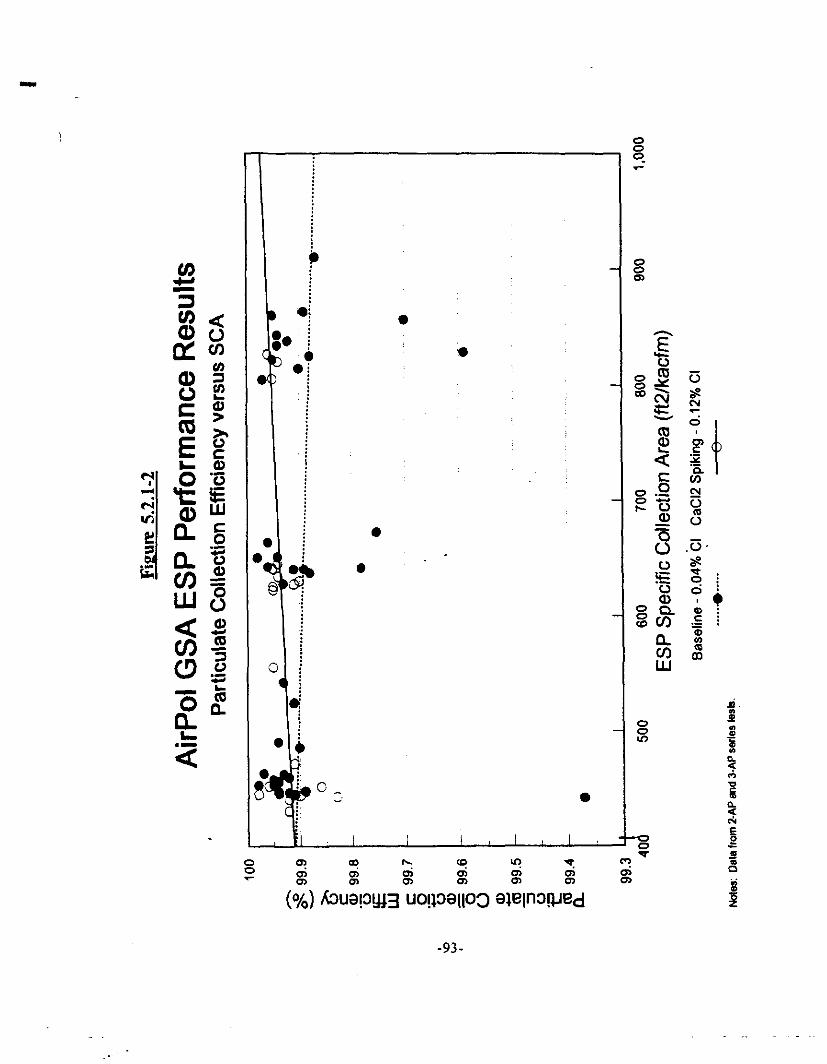
8
c
, .; *
Y b .:
IO *
/
0
l
0 i 4 j
d
‘+
o-
I I I I I
-93-
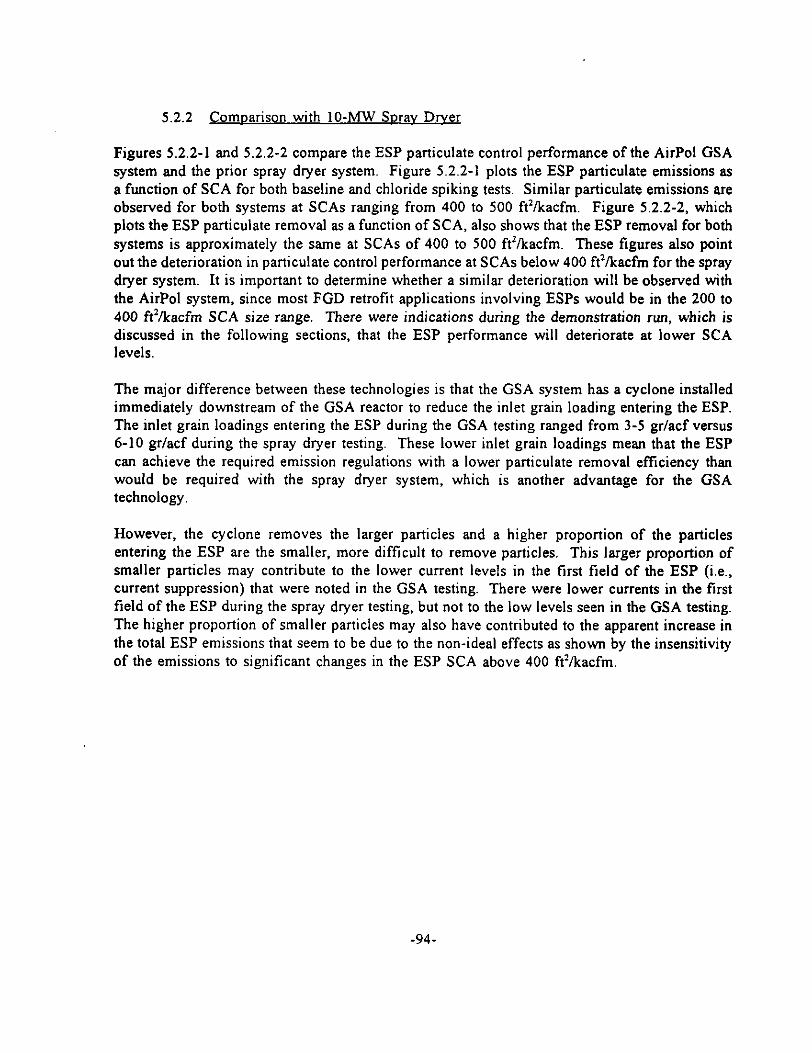
5.2.2 comoarison with IO-MW Srxav Drver
Figures 5.2.2-l and 5.2.2-2 compare the ESP particulate control performance of the AirPol GSA system and the prior spray dryer system. Figure 5.2.2-I plots the ESP particulate emissions as a function of SCA for both baseline and chloride spiking tests. Similar particulate emissions are observed for both systems at SCAs ranging from 400 to 500 f?/kacfm. Figure 5.2.2-2, which plots the ESP particulate removal as a function of SCA, also shows that the ESP removal for both systems is approximately the same at SCAs of 400 to 500 ft’/kacfm. These figures also point out the deterioration in particulate control performance at SCAs below 400 ft’/kacfm for the spray dryer system. It is important to determine whether a similar deterioration will be observed with the AirPol system, since most FGD retrofit applications involving ESPs would be in the 200 to 400 ft’/kacfm SCA size range. There were indications during the demonstration run, which is discussed in the following sections, that the ESP performance will deteriorate at lower SCA levels.
The major difference between these technologies is that the GSA system has a cyclone installed immediately downstream of the GSA reactor to reduce the inlet grain loading entering the ESP. The inlet grain loadings entering the ESP during the GSA testing ranged from 3-5 gr/acf versus 6-10 gr/acf during the spray dryer testing. These lower inlet grain loadings mean that the ESP can achieve the required emission regulations with a lower particulate removal efficiency than would be required with the spray dryer system, which is another advantage for the GSA technology.
However, the cyclone removes the larger particles and a higher proportion of the particles entering the ESP are the smaller, more difficult to remove particles. This larger proportion of smaller particles may contribute to the lower current levels in the first field of the ESP (i.e., current suppression) that were noted in the GSA testing. There were lower currents in the first field of the ESP during the spray dryer testing, but not to the low levels seen in the GSA testing. The higher proportion of smaller particles may also have contributed to the apparent increase in the total ESP emissions that seem to be due to the non-ideal effects as shown by the insensitivity of the emissions to significant changes in the ESP SCA above 400 ft’/kacfm.
-94-
-95-
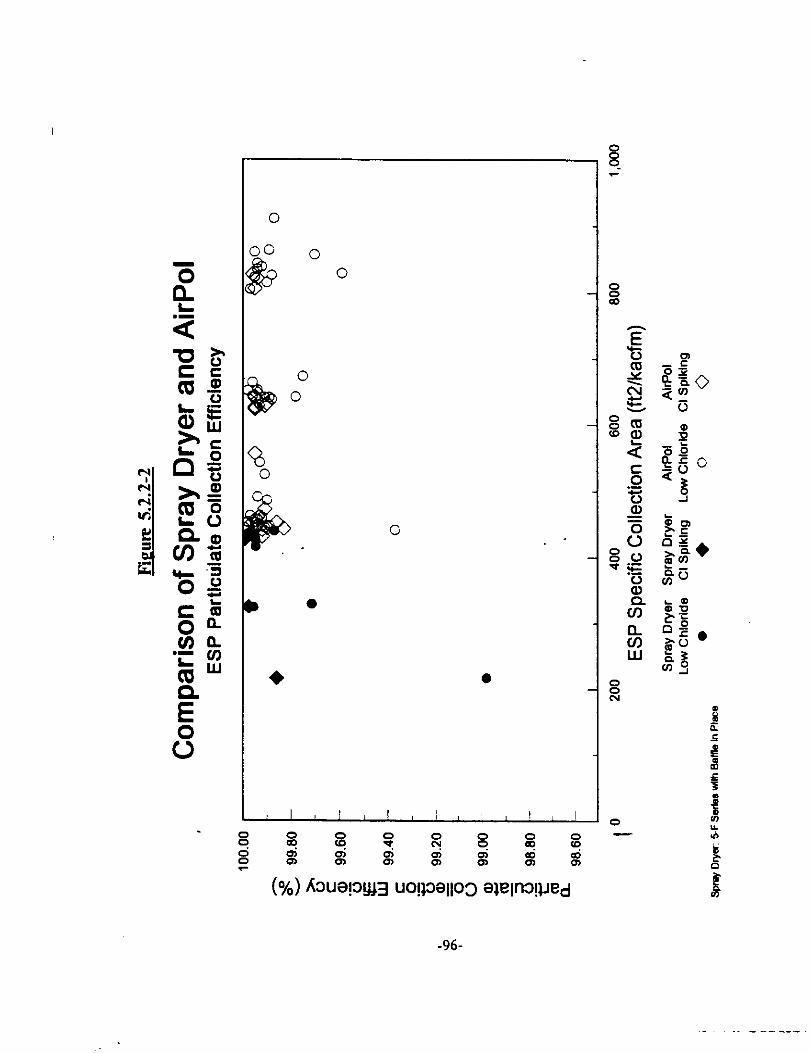
0
10 B 0
0 0
3
D a
+
0
0
-96-
5.2.3 28-Dav Demonstration Run
A summary of the ESP particulate control results for the 28-day demonstration run is presented in Table 5.2.3. Based on these results, there was a significant decrease in ESP particulate control performance during the 28-day demonstration run. This decrease in performance is illustrated in Figures 5.2.3-l and 5.2.3-2. In Figure 5.2.3-l. the ESP particulate collection efficiency is plotted for each test segment. Included :in the figure is both the test average and the individual mass loading test results. The average ESP particulate collection efficiency was greater than 99.95 percent through the first five test segments (I-DR-01 to 3-DR-04). The last three test segments, l-DR-05 through l-DR-07, exhibited poorer performance with the particulate collection efftciency averaging approximately 99.90 percent. Effectively, the particulate penetration doubled (0.05 versus 0.10 percent penetration) during the last three test segments.
Figure 5.2.3-2 presents the ESP particulate emissions for each test segment. Similar to Figure 5.2.3-1, both the test average and individual test data are presented. Concurrent with the poorer ESP particulate removal efficiency, an increase in ESP particulate emissions was also observed for the last three test segments as the ESP emissions increased from approximately 0.006 to 0.015 IbMMBtu.
The poorer ESP particulate control performance is due to a decrease in power levels in all fields. The reduction in power levels in the first two fields was due to solids build-up on the hopper ridges between fields 1 and 2 and between fields 2 and 3. The reduction in power levels in fields 3 and 4 were due to the increased particulate loading to these fields. A more complete discussion of the ESP operation during the demonstration run is presented in the next section.
-97-

r & .g 2 is. 86
2” y?
-98-
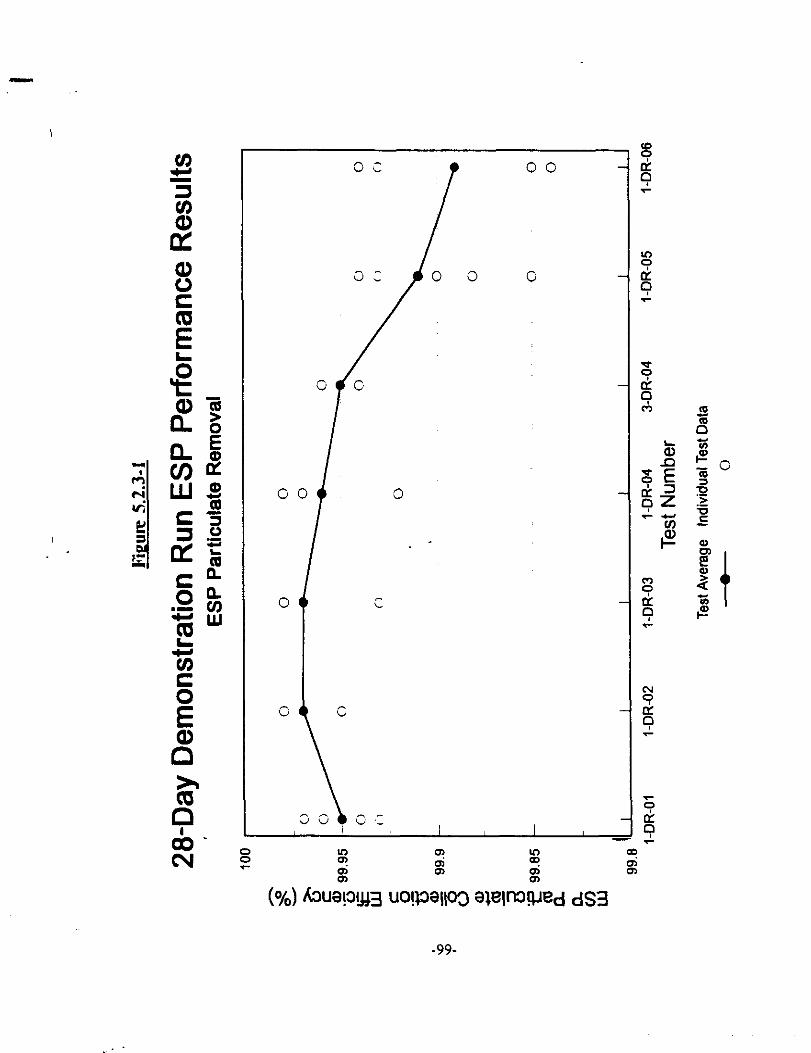
8
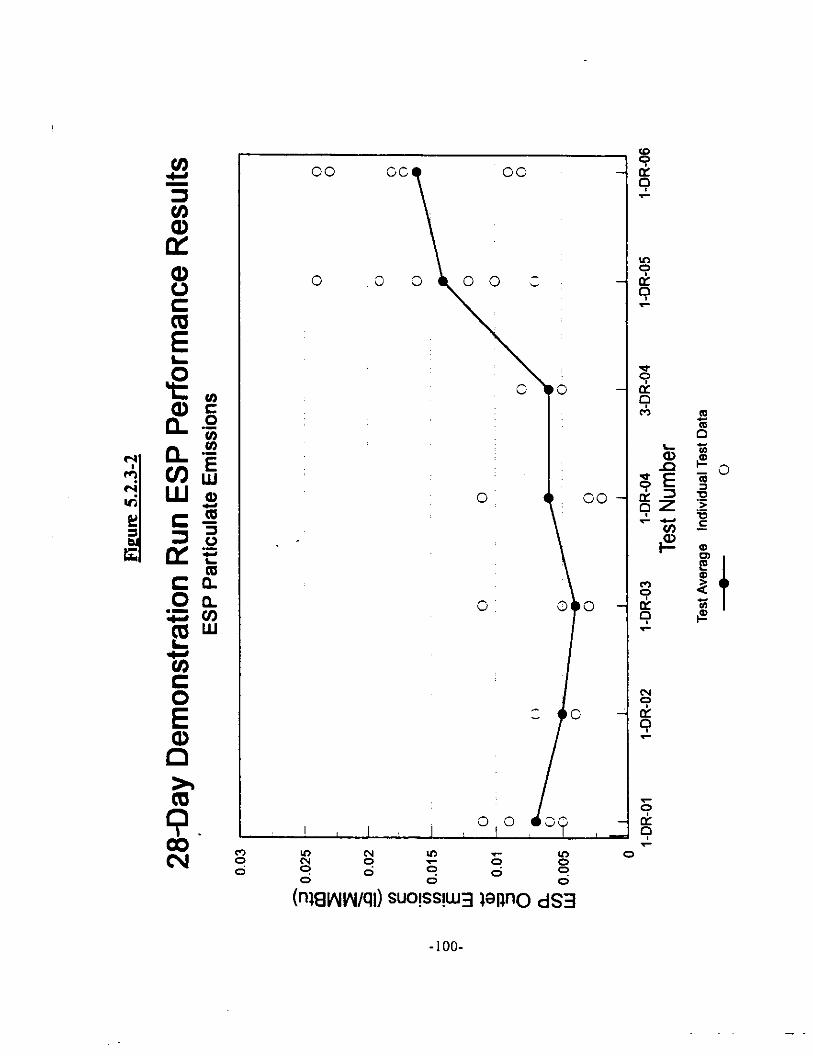
00
0
’
0
GC
0,
6~
j CO
G 0
G
(www~q~) =ww3 vwo ds3
-lOO-
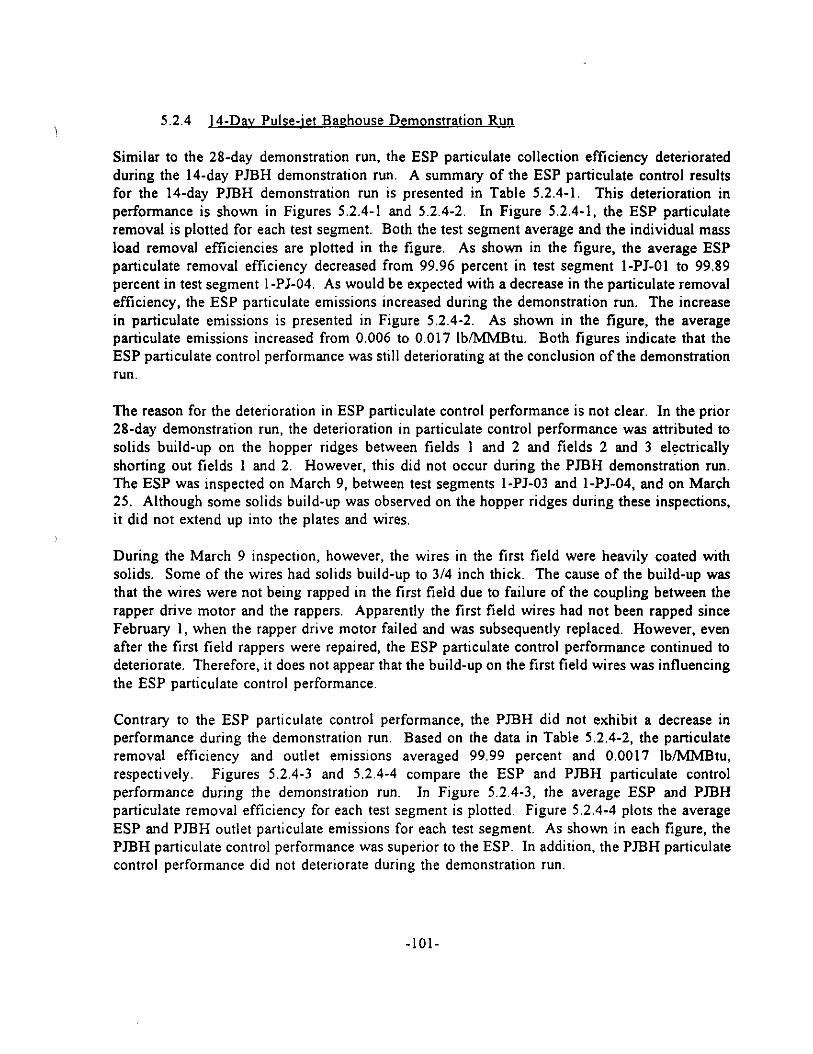
5.2.4 14-Dav Pulse-jet Baehouse Demonstration Run
Similar to the 28day demonstration run, the ESP particulate collection efficiency deteriorated during the 14-day PJBH demonstration run. A summary of the ESP particulate control results for the 14-day PJBH demonstration run is presented in Table 5.2.4-l. This deterioration in performance is shown in Figures 5.2.4-l and 5.2.4-2. In Figure 5.2.4-1, the ESP particulate removal is plotted for each test segment. Both the test segment average and the individual mass load removal efficiencies are plotted in the figure. As shown in the figure, the average ESP particulate removal efficiency decreased from 99.96 percent in test segment I-PJ-01 to 99.89 percent in test segment l-PJ-04. As would be expected with a decrease in the particulate removal efficiency, the ESP particulate emissions increased during the demonstration run. The increase in particulate emissions is presented in Figure 5.2.4-2. As shown in the figure, the average particulate emissions increased from 0.006 to 0.017 IbMMBtu. Both figures indicate that the ESP particulate control performance was still deteriorating at the conclusion of the demonstration run.
The reason for the deterioration in ESP particulate control performance is not clear. In the prior 28-day demonstration run, the deterioration in particulate control performance was attributed to solids build-up on the hopper ridges between fields 1 and 2 and fields 2 and 3 electrically shorting out fields 1 and 2. However, this did not occur during the PJBH demonstration run. The ESP was inspected on March 9, between test segments l-PJ-03 and l-PJ-04, and on March 25. Although some solids build-up was observed on the hopper ridges during these inspections, it did not extend up into the plates and wires.
During the March 9 inspection, however, the wires in the first field were heavily coated with solids. Some of the wires had solids build-up to 314 inch thick. The cause of the build-up was that the wires were not being rapped in the first field due to failure of the coupling between the rapper drive motor and the rappers. Apparently the first field wires had not been rapped since February 1, when the rapper drive motor failed and was subsequently replaced. However, even after the first field rappers were repaired, the ESP particulate control performance continued to deteriorate. Therefore, it does not appear that the build-up on the first field wires was influencing the ESP particulate control performance.
Contrary to the ESP particulate control performance, the PJBH did not exhibit a decrease in performance during the demonstration run. Based on the data in Table 5.2.4-2, the particulate removal efficiency and outlet emissions averaged 99.99 percent and 0.0017 Ib/MMBtu, respectively. Figures 5.2.4-3 and 5.2.4-4 compare the ESP and PJBH particulate control performance during the demonstration run. In Figure 5.2.4-3, the average ESP and PJBH particulate removal efficiency for each test segment is plotted. Figure 5.2.4-4 plots the average ESP and PJBH outlet particulate emissions for each test segment. As shown in each figure, the PJBH particulate control performance was superior to the ESP. In addition, the PJBH particulate control performance did not deteriorate during the demonstration run.
-lOl-
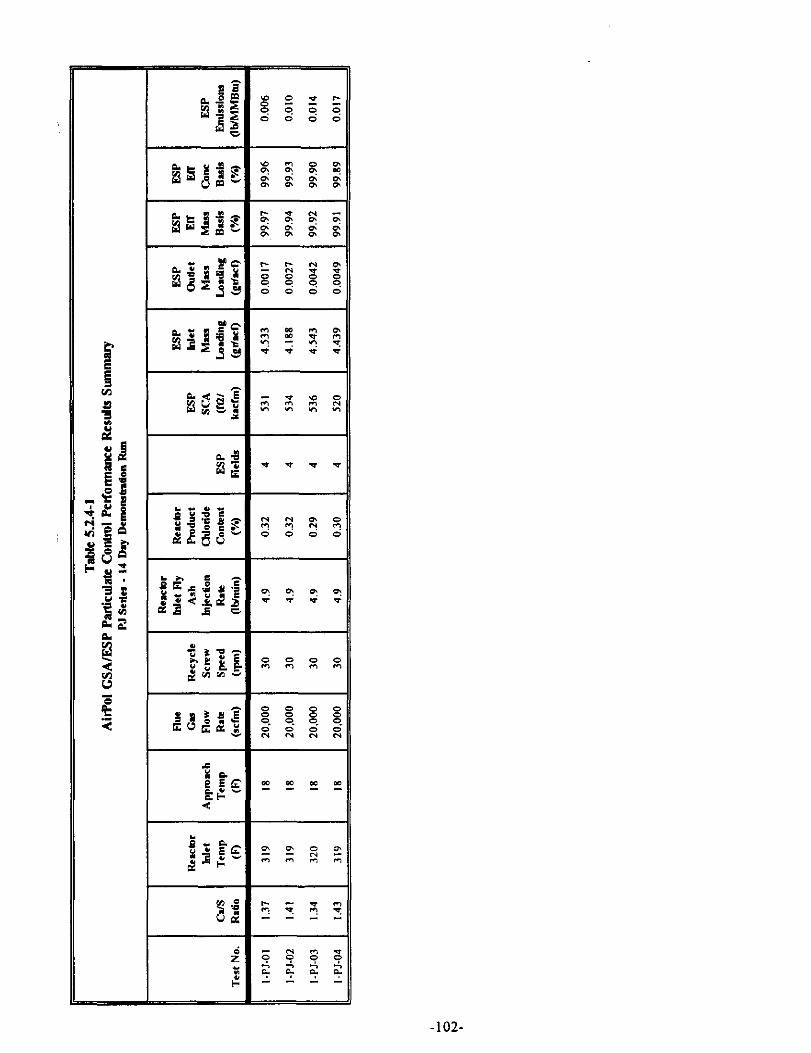
Lh : z 0 E = m Y ‘I E ;<.gcza a3 .5 =
qprva Euddg
cc gp <
% 2 % %
8 x x x 4 9 9 9 z F: :: ::
oa - (0 E? Ds
-102-
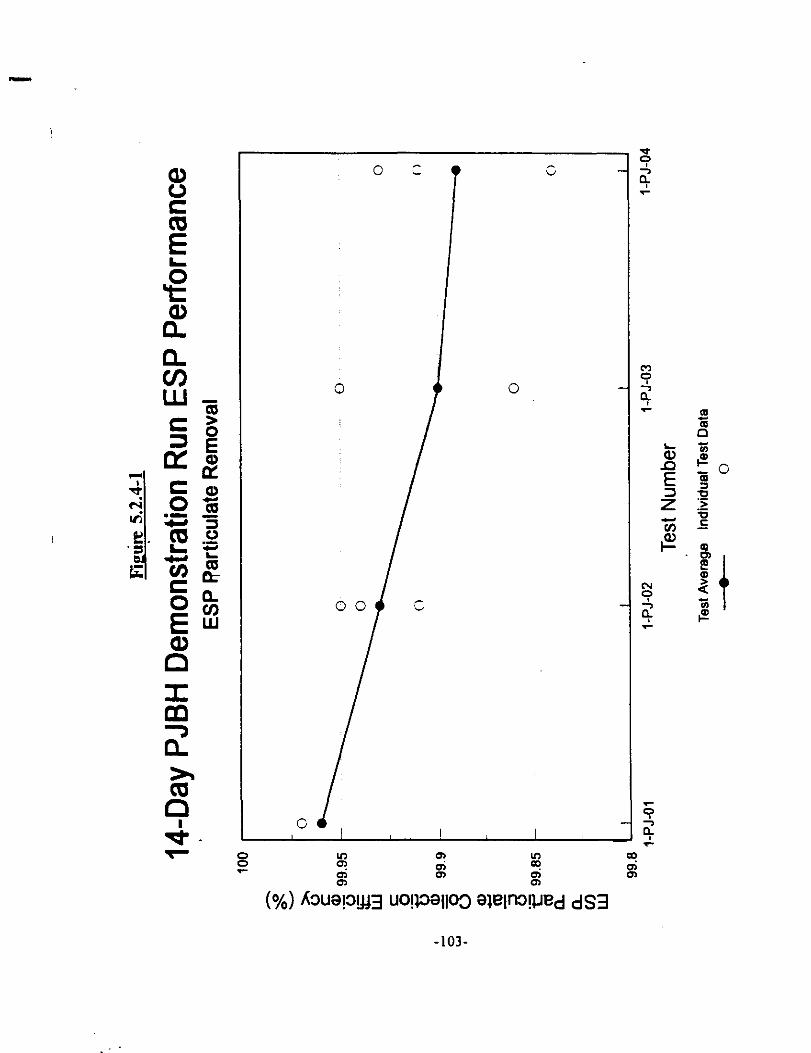
-103-
GO 00 0
,‘;,l,;;y: 9
Vww vu/q0 SUO!SS!uJ3 lW0 dS3
-104-
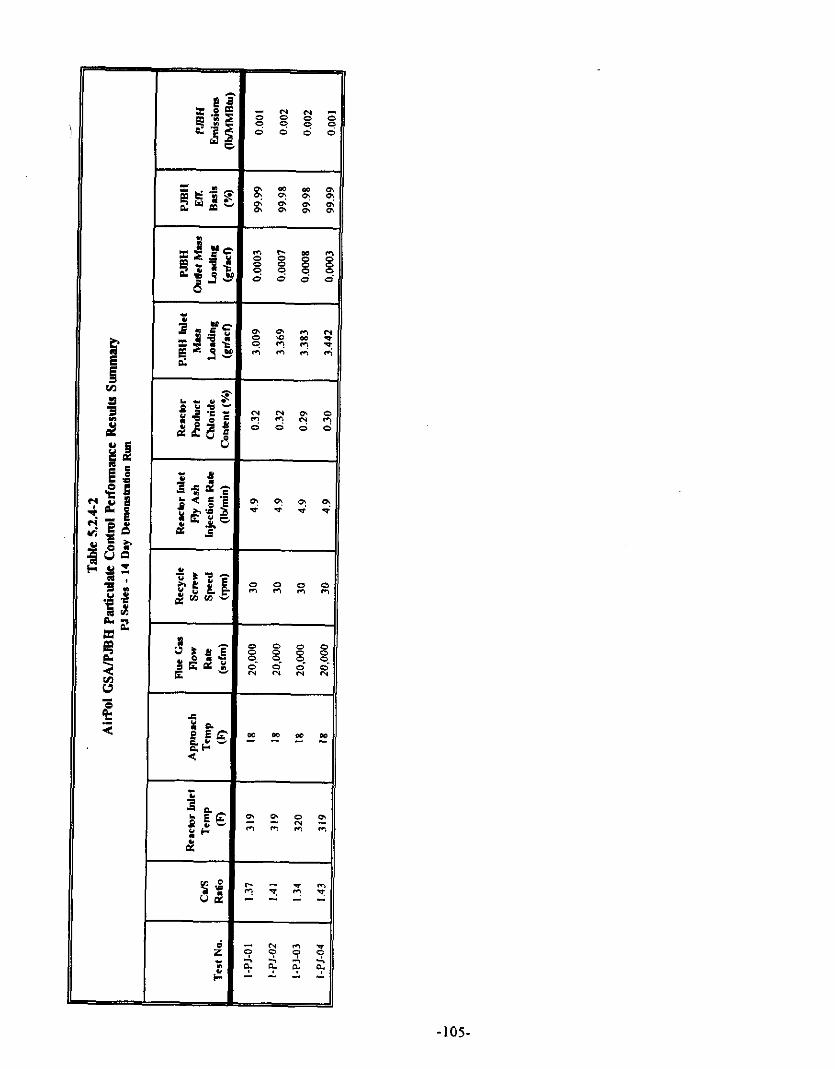
$ % a , 0 2
: N ::
01 2
2 %
-105
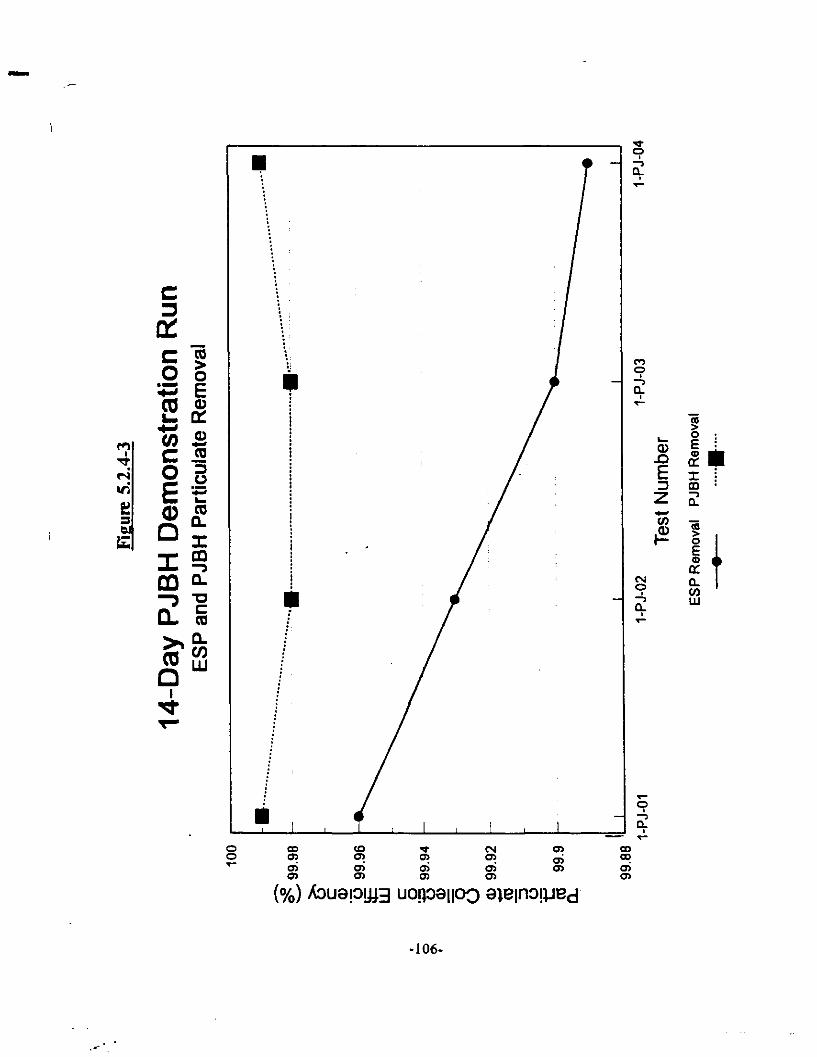
i ~ 1, :, ii
!
j I I I
i ;:
4 I
-106-
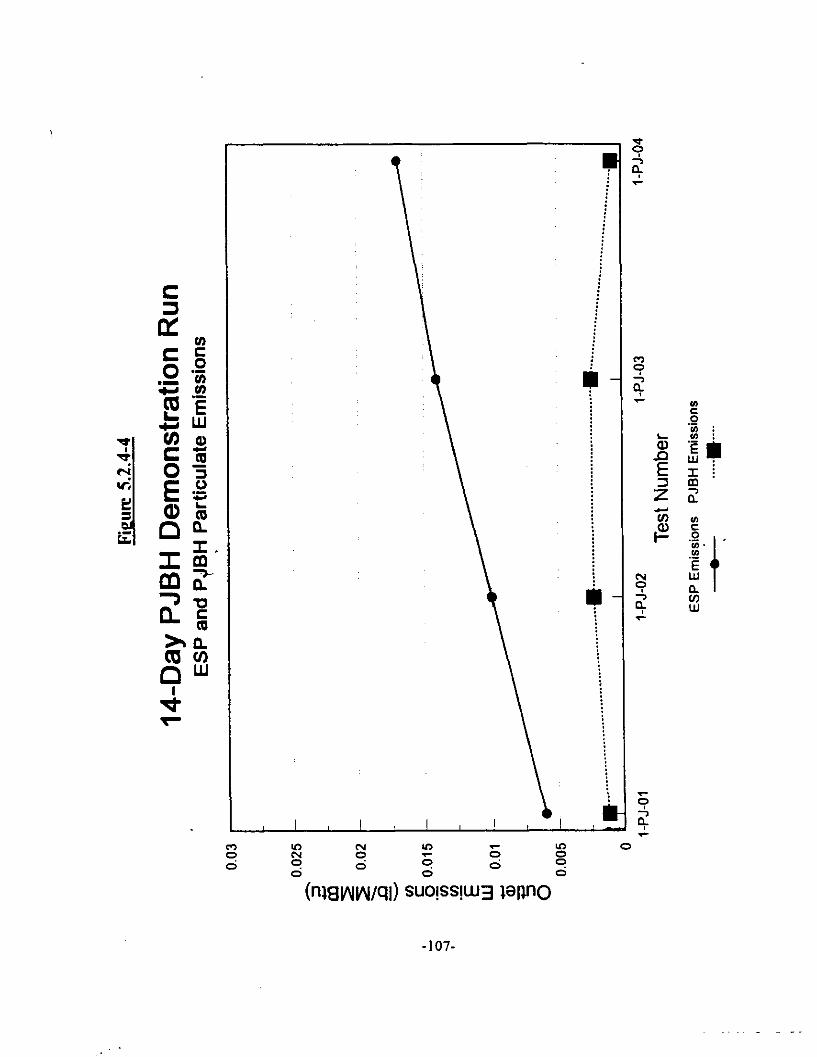
I
I
I I I I
_
t
Owwwq~) swsw3 wvo
-107-
5.3 ESP OPERATION
5.3.1 Factorial Tests
The average secondary voltage and current for the tests conducted at baseline chloride levels (0.04 weight percent coal chloride) are presented in Table 5.3.1-1 for the 2-AP series tests and in Table 5.3.1-2 for the 3-AP series tests. Similarly, the average secondary voltage and current are presented in Tables 5.3.1-3 and 5.3.1-4 for the chloride spiking tests (0.12 weight percent coal chloride equivalent) for the 2-AP and 3-AP series, respectively.
The changes in variable levels during the factorial tests resulted in changes in ESP operation. Specifically, the secondary current in field 1 and sometimes in fields 2 and 3 would be suppressed depending on the test conditions, The current suppression was greater during tests conducted at 20,000 scfm flue gas flow rate and at approach temperatures of 28°F compared to similar tests conducted at 14,000 scfm and lower approach temperatures. The current suppression is thought to be partially due to changes in particle size distribution due to the change in gas flow rate/velocity and changes in particle resistivity due to the change in approach temperature. Changes in other variable levels did not have as significant effect on the secondaty current suppression. In addition, the secondary current suppression in the first field did not influence the ESP particulate control performance.
-108-
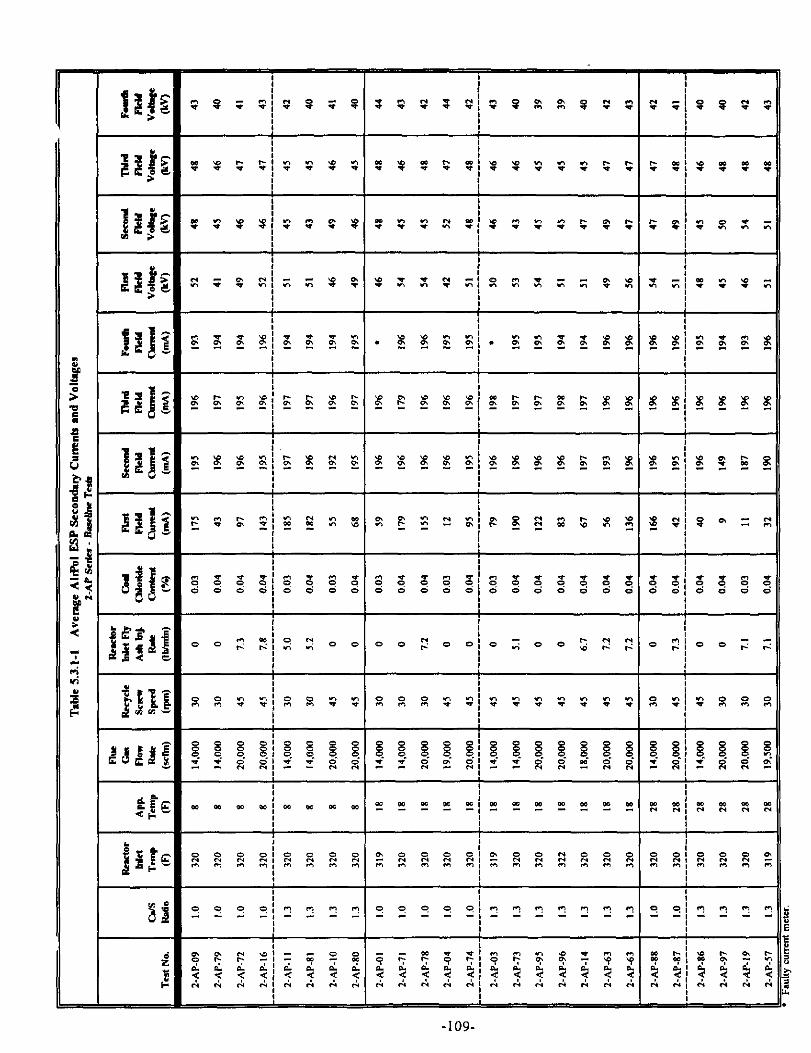
-109-
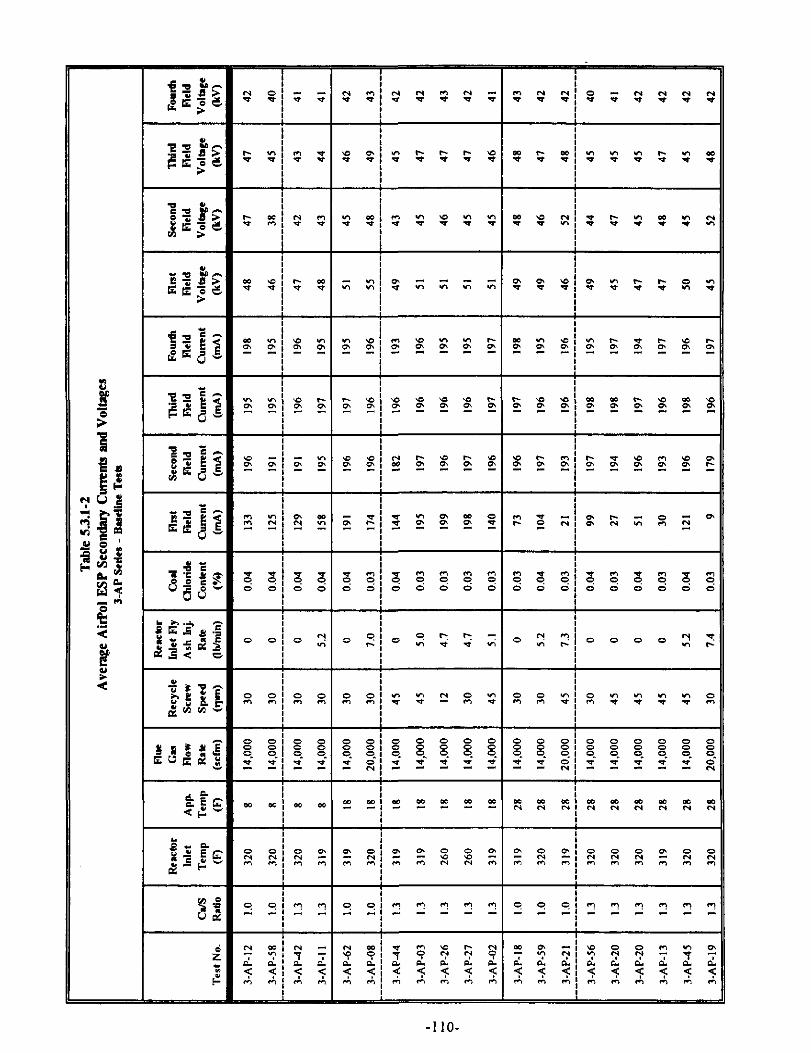
-1 IO-
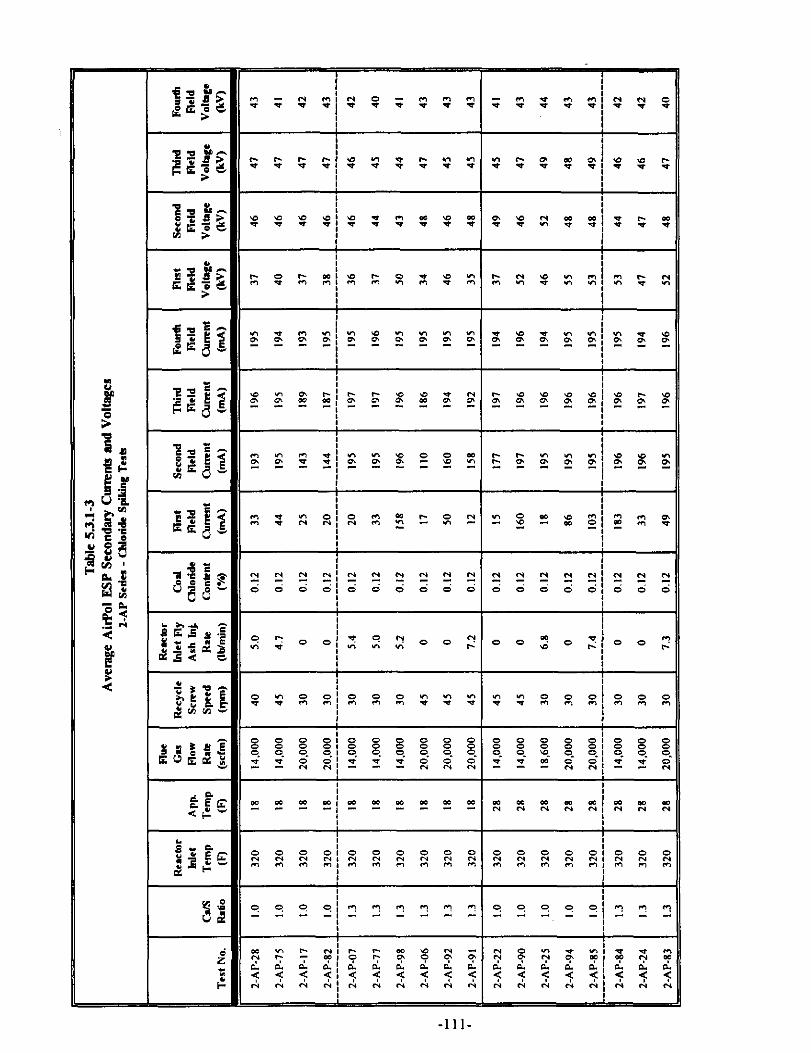
-lll-
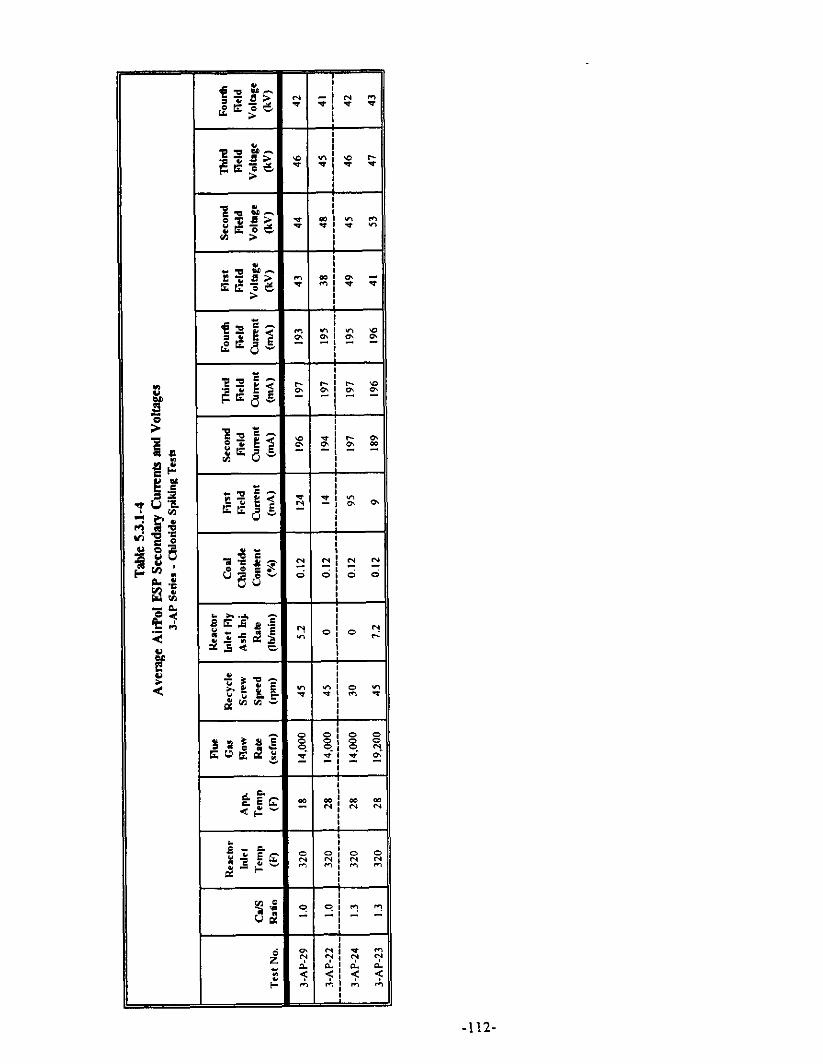
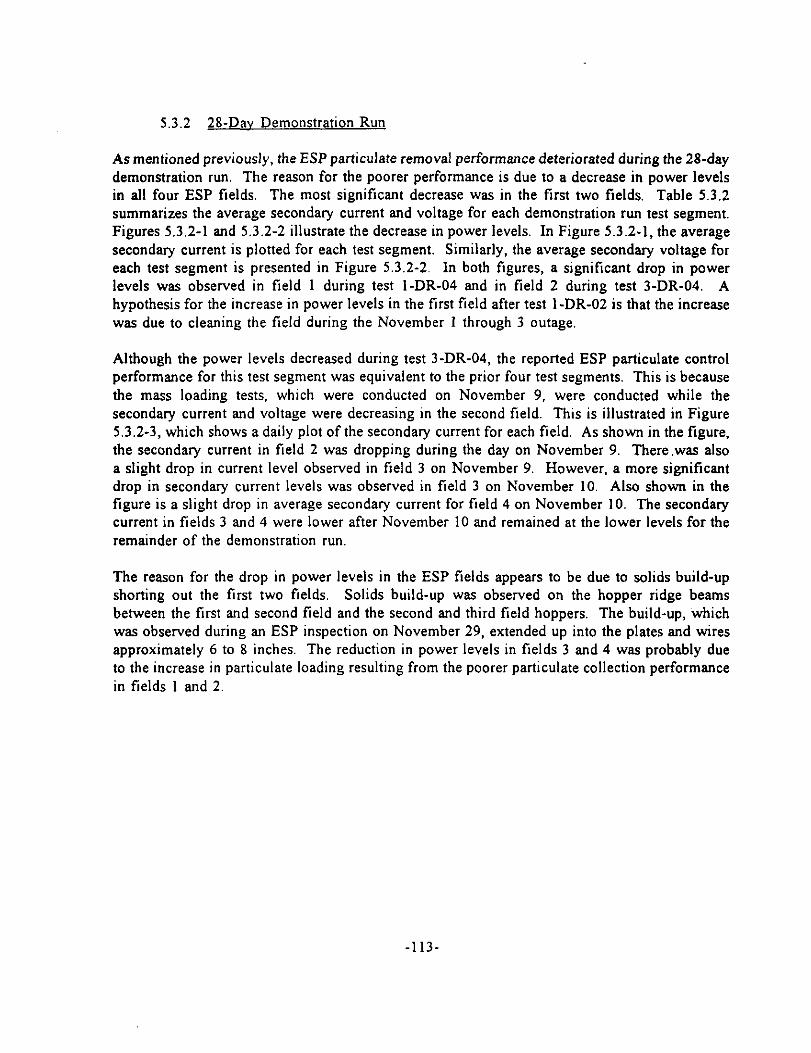
5.3.2 28-Dav Demonstration Run
As mentioned previously, the ESP particulate removal performance deteriorated during the 28-day demonstration run. The reason for the poorer performance is due to a decrease in power levels in all four ESP fields. The most significant decrease was in the first two fields, Table 5.3.2 summarizes the average secondary current and voltage for each demonstration run test segment. Figures 5.3.2-l and 5.3.2-2 illustrate the decrease in power levels. In Figure 5.3.2-1, the average secondary current is plotted for each test segment. Similarly, the average secondary voltage for each test segment is presented in Figure 5.3.2-2. In both figures, a significant drop in power levels was observed in field 1 during test l-DR-04 and in field 2 during test 3-DR-04. A hypothesis for the increase in power levels in the first field after test l-DR-02 is that the increase was due to cleaning the field during the November 1 through 3 outage.
Although the power levels decreased during test 3-DR-04, the reported ESP particulate control performance for this test segment was equivalent to the prior four test segments. This is because the mass loading tests, which were conducted on November 9, were conducted while the secondary current and voltage were decreasing in the second field. This is illustrated in Figure 5.3.2-3, which shows a daily plot of the secondary current for each field. As shown in the figure, the secondary current in field 2 was dropping during the day on November 9. There.was also a slight drop in current level observed in field 3 on November 9. However, a more significant drop in secondary current levels was observed in field 3 on November 10. Also shown in the figure is a slight drop in average secondary current for field 4 on November 10. The secondary current in fields 3 and 4 were lower after November 10 and remained at the lower levels for the remainder of the demonstration run,
The reason for the drop in power levels in the ESP fields appears to be due to solids build-up shorting out the first two fields. Solids build-up was observed on the hopper ridge beams between the first and second field and the second and third field hoppers. The build-up, which was observed during an ESP inspection on November 29, extended up into the plates and wires approximately 6 to 8 inches. The reduction in power levels in fields 3 and 4 was probably due to the increase in particulate loading resulting from the poorer particulate collection performance in fields 1 and 2.
-113-
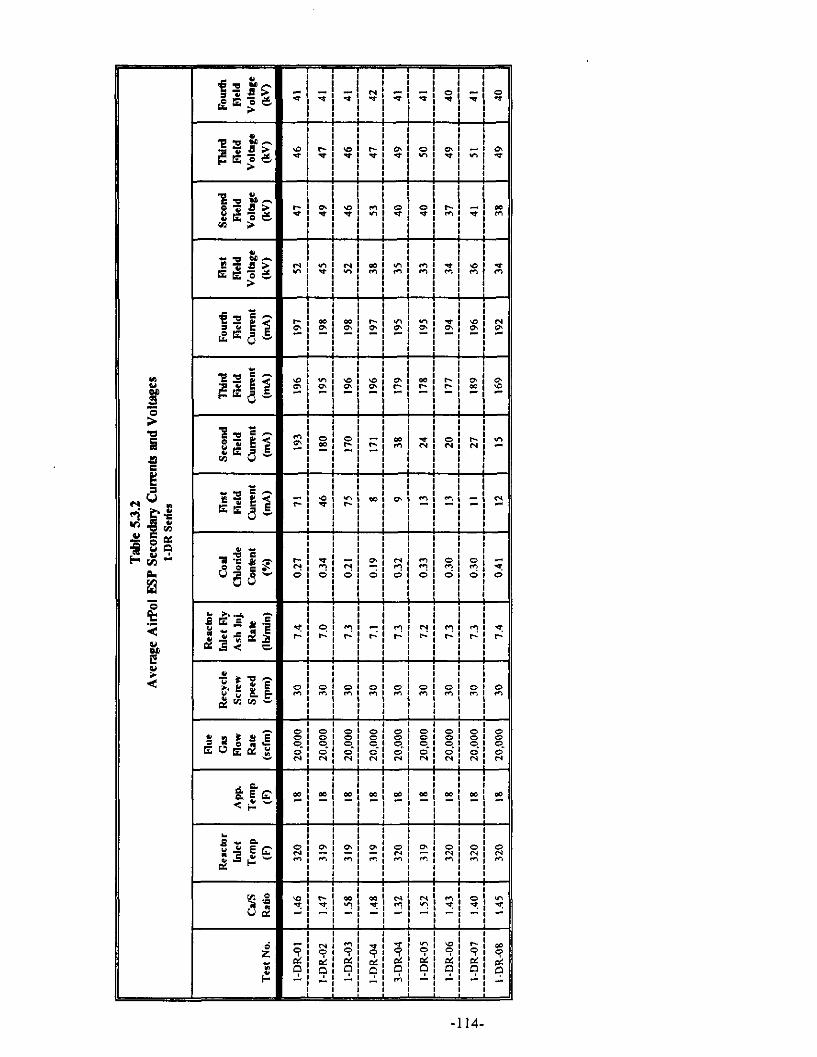
=i= I I , -i-
+ I I I 0 + I I I I + I I I I + I I I , I + I I I c 8 I I i I I 4 I + I I I I + I ! : 0 I +- j i / I r I ! t L I / ! c I j ; L I I ( I ’ I ! L
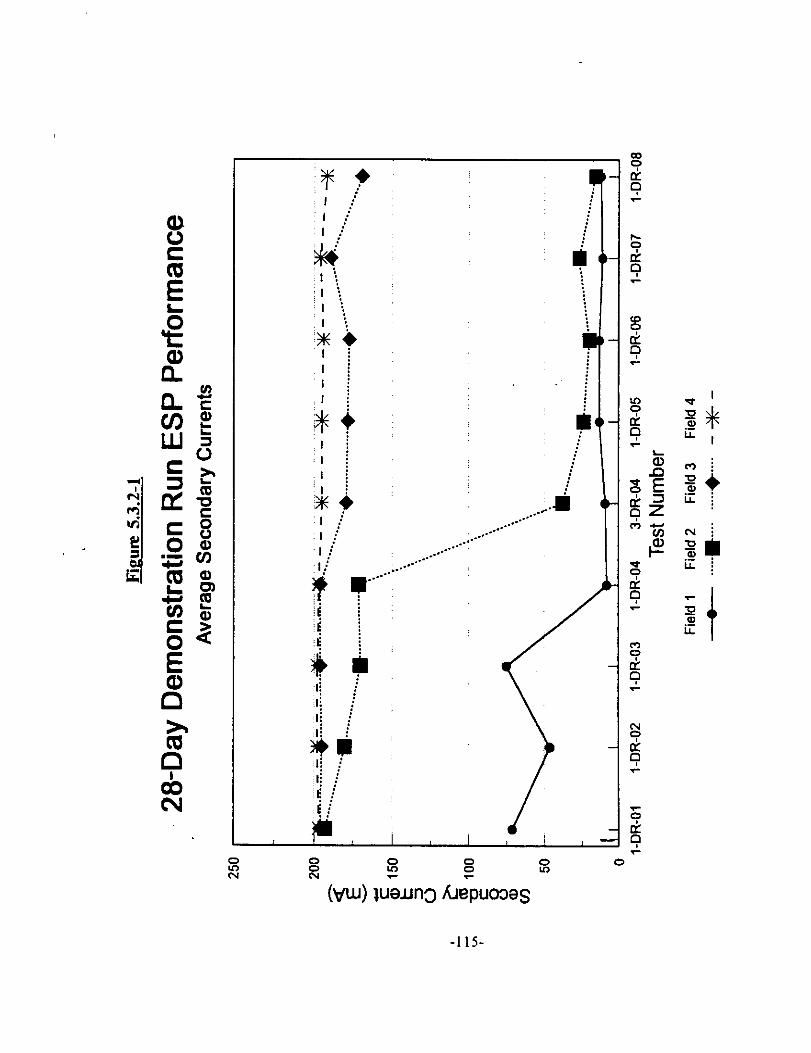
E 5: z 5: 0 (VW) l”iJJ”3 AJ~p”cnas
-115-
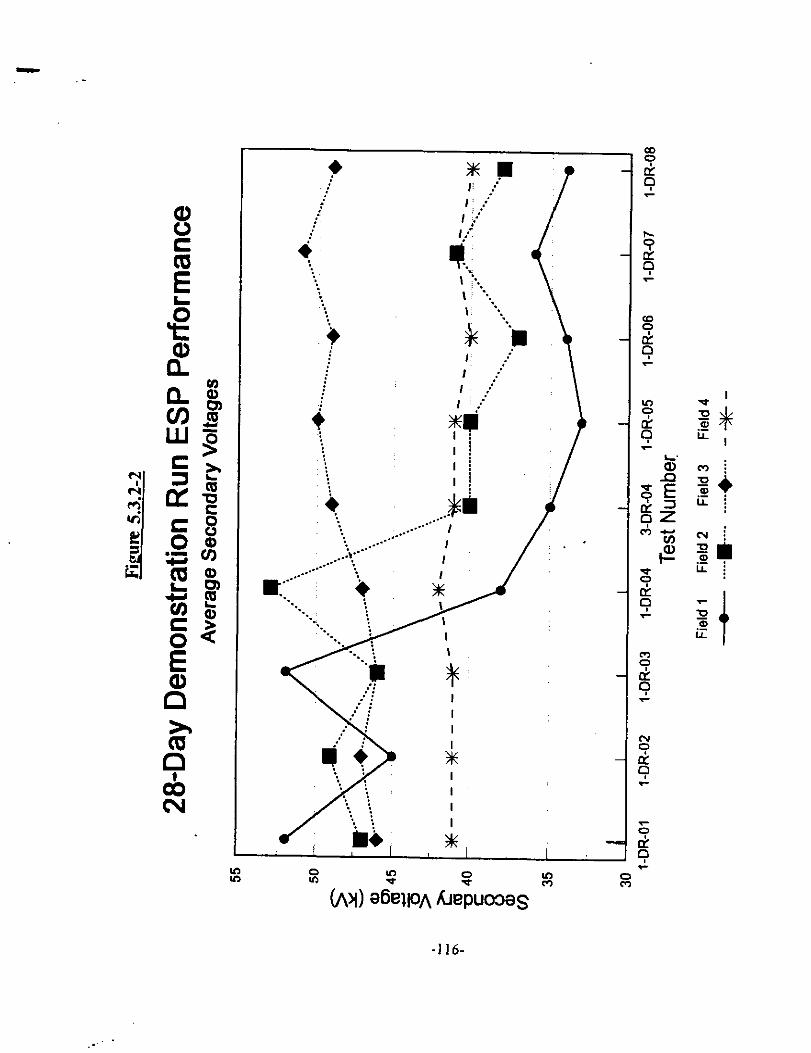
- .-
? mm ; ,i /. -: -7 .I’ , ,: : .:’ ;. : 4 : :., 4.1 m, *., , :. i. ,; -. : Ii ‘:. ( ,: .:- I ..;
i ,, :: , ~ ..: Tr: :I
i ; .: :
\:
I ~ ..: : I
.: : I
*; 4 A : . /’ Jo ~ *: :. : : : 1 : : / Li] A, I
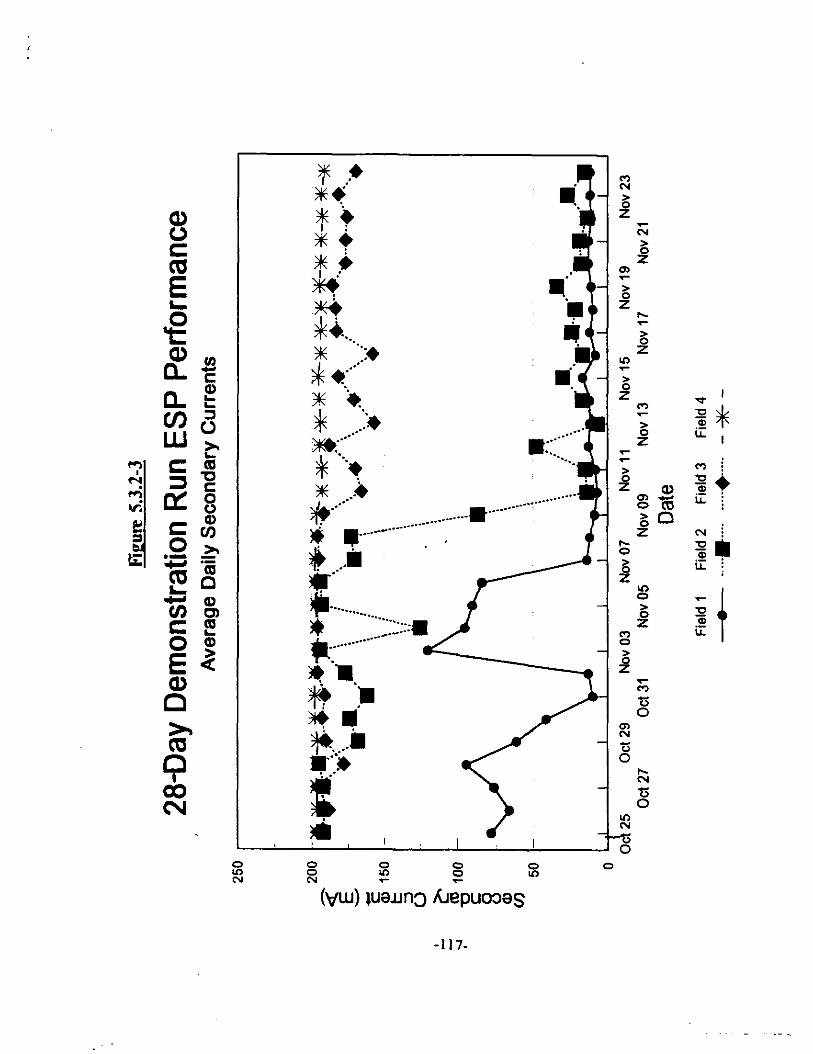
z : 5: s 5: 0 (VUJ) &m=) r0epumas
5.3.3 14-Dav Pulse-jet Baehouse Demonstration Run
The average secondary currents and voltages for each test segment during the PJBH demonstration run are presented in Table 5.3.3. As noted previously, the solids build-up on the first field wires due to failure of the rapper drive may have affected the first field secondaty current during the first three test segments. Figures 5.3.3-l and 5.3.3-2 present the secondary current levels for each field during the demonstration run. In Figure 5.3.3-1, the average secondary current levels are plotted for each test segment. The figure shows a significant increase in the average first field secondary current during test l-PJ-04 compared to the prior test segments when the first field wires were not being rapped. Figure 5.3.3-2, which plots the average daily secondary currents during the PJBH demonstration run, also shows a significant increase in the first field current for the last test segment, I-PJ-04. However, there was a sharp decrease in the first field secondary current on the last day of the demonstration run. Also observed during the demonstration run was a decrease in the second field secondary current from February 27 to March 3. No explanation was found for this decrease in secondary current in the second field.
-118.
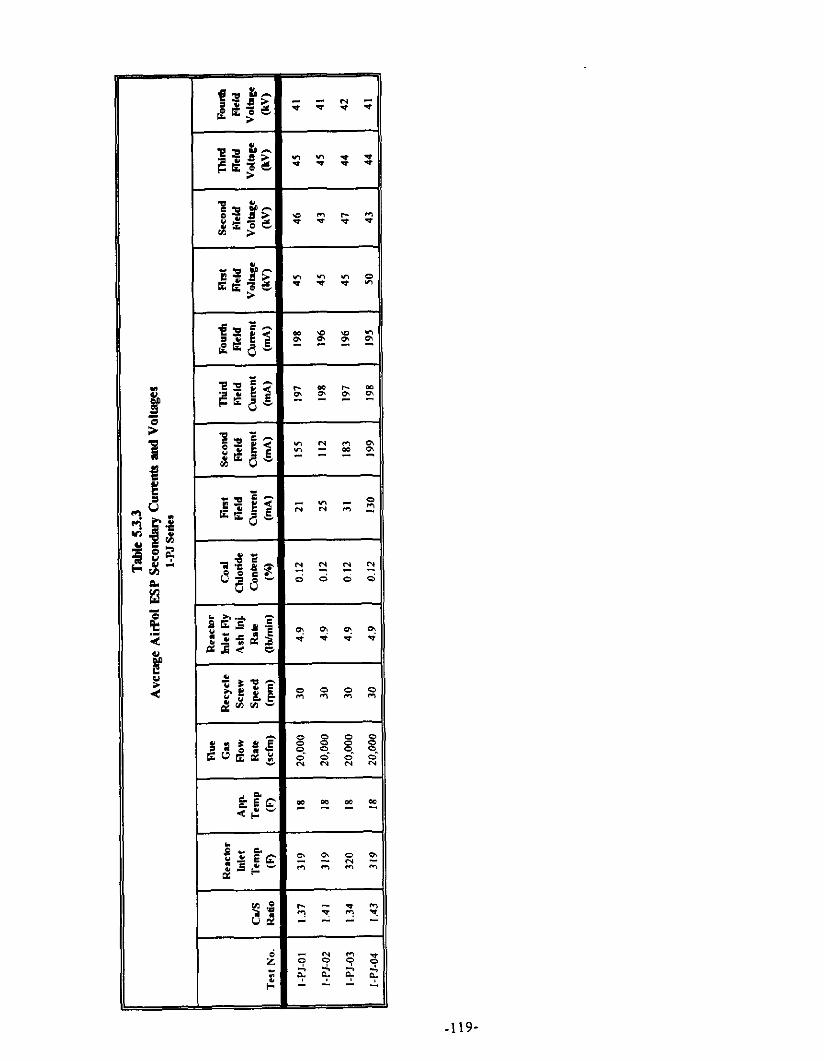
.119-
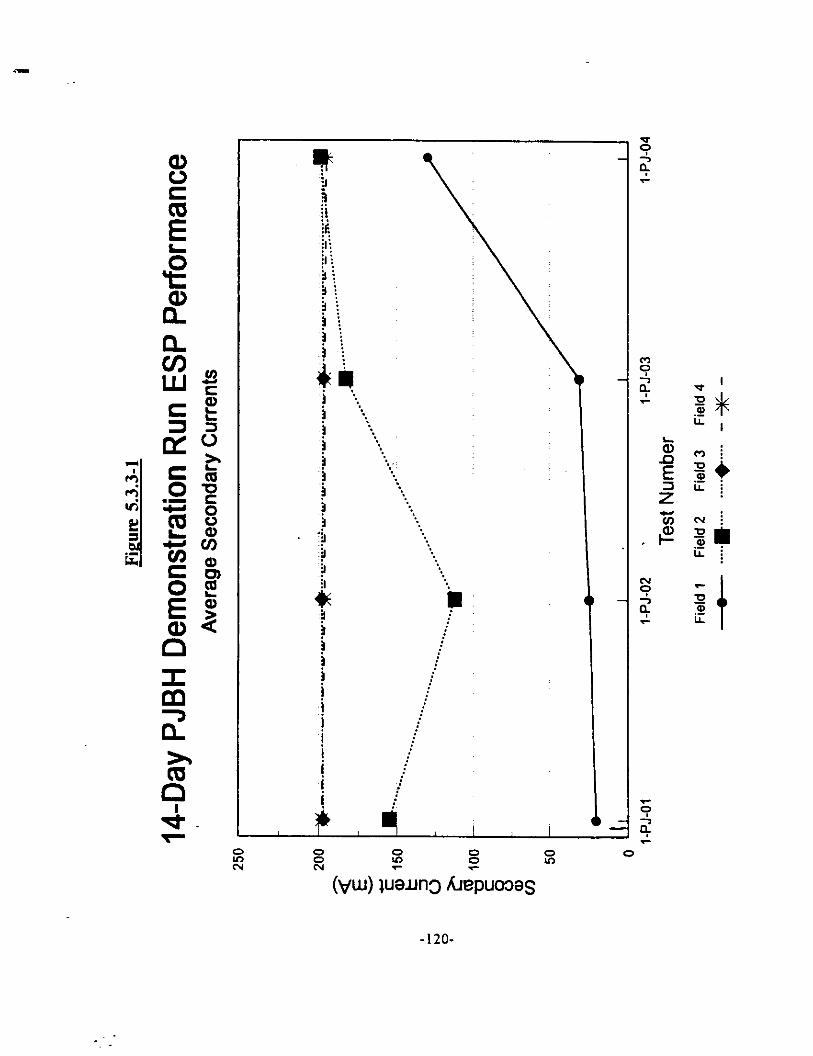
,F ;I r! ,j! ,i$ ,:,: : : il i :e i 9 i ,i i ! \
i
‘I i :.,* j **.. ! r ,I :*.: ~1 ..~ ! 3 I 1: :i ;j i :.
0 iI 7; i / i j i i ,: i j :i j ! ; I / ! / ! .: ,! .j !
q I I 0.
: :: 5: 8 z 0
N (VW) J”LJ”3 herpuo!xS
-IZO-
:
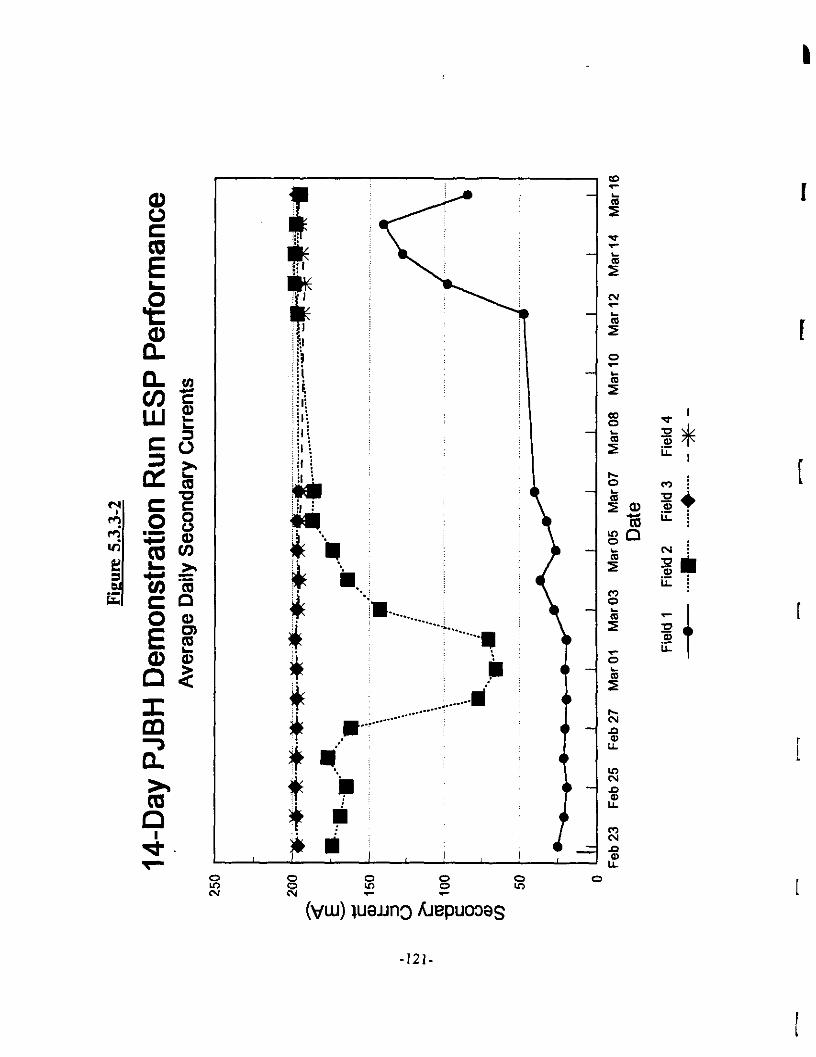
s E iz :: f2 0 N (VUJ) &~n3 he>umas
-121-
5.4 CORRELATION OF RESULTS
The following discussions are related to the correlations determined in the factorial test. The purpose of this factorial testing was to determine the effect of the process variables on the operation and SO, removal efficiency in the reactor/cyclone. the ESP, the PJBH. and the overall system so as to optimize the GSA performance.
Given the large number of major process design variables and the limited amount of test time available, only two levels for most of the variables were selected to cover the range of primary interest for a utility FGD application. To further reduce the length of the factorial test plan, but still retain the quality control on the test results, a half-factorial design with a full set of replicate tests was used for the GSA testing.
The major variables, as determined from the preliminary tests, were approach-to-saturation temperature, lime stoichiometry, fly ash loading, coal chloride level. flue gas flow rate, and recycle screw speed. Two levels were determined for nearly all of the variables. The one exception was the approach-to-saturation temperature where three levels were defined, but the third level was only run for those tests at the lower coal chloride level. The variables and their selected levels are shown in the Table 5.4.
A total of 78 factorial tests were performed. During 51 of these tests the baghouse was either off-line or pulling flue gas from the ESP outlet (in series arrangement), and during 27 of these tests the baghouse was pulling flue gas from the ESP inlet (in parallel arrangement).
The lime stoichiometry level, which was tested at 1.00 and 1.30 moles Ca(OH),/mole inlet SO,, seems to have the most significant effect on the SO, removal efficiency in the GSA system. The approach-to-saturation temperature, evaluated at three levels 8, 18, and 28 “F for the low coal chloride conditions and at two levels 18 and 28 “F for the higher coal chloride conditions, appear to be the second most important variable in the GSA system in terms of the overall system SO, removal efficiency.
The third most important variable seems to be the chloride level in the system. Two coal chloride levels were tested, the baseline coal chloride level of 0.02 to 0.04% and the equivalent of a 0.12% coal chloride level. The higher chloride level was achieved by spiking the feed slurry with a calcium chloride solution.
For further detailed information please refer to TVA’s final report entitled “10 MW Demonstration of the Gas Suspension Absorption Process at TVA’s Center for Emissions Research” in Appendix “B” of this report.
-122-
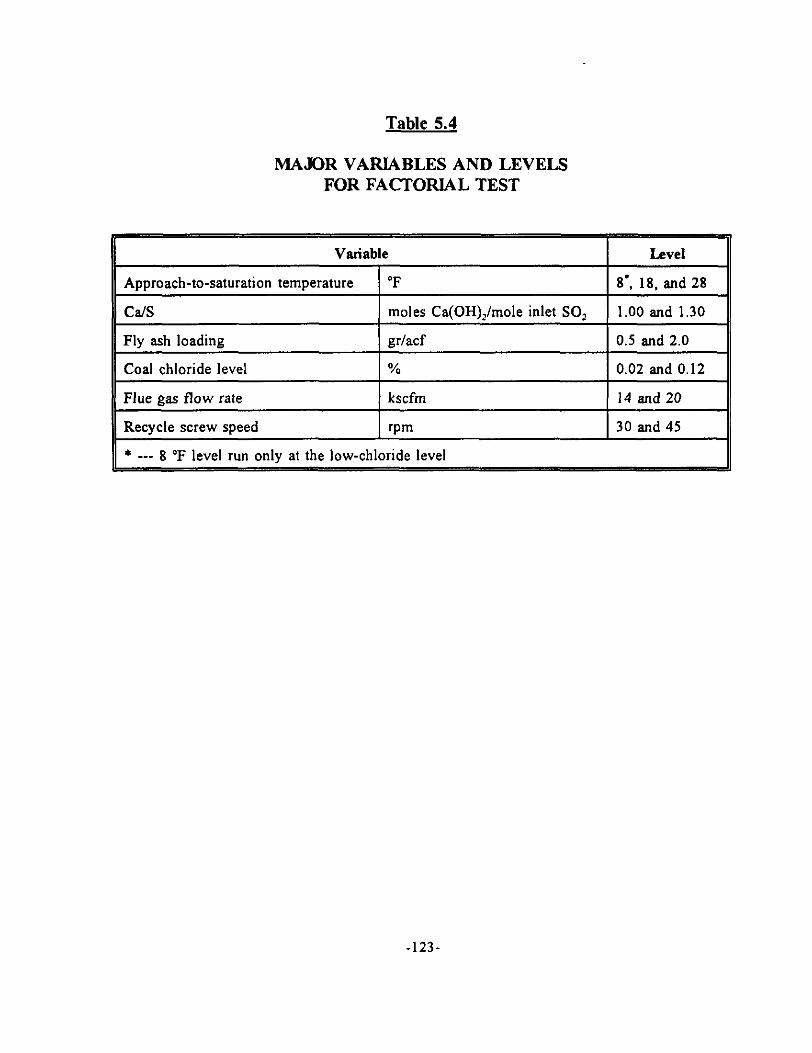
Table 5.4
MAJOR VARIABLES AND LEVELS FOR FACTORIAL TEST
l --- 8 “F level run only at the low-chloride level
-123-
6.0 ENVIRONMENTAL PERFORMANCE
6.1 IMPAff ON THE ENVIRONMENT
Environmental impacts associated with the GSA system are minimal. The consequence of both construction and operation of the project on various environmental conditions are discussed as follows:
6.1.1 Land Imaacts
Land impacts are insignificant since no additional land outside the TVA Shawnee Steam Plant boundaries was required for the GSA unit and the unit was constructed on previously impacted land between an existing spray dryer building and an electrostatic precipitator.
6.1.2 Air. Water Oualitv and Solid Waste Imoacts
According to the environmental monitoring report, the GSA system averaged greater than 90 percent SO, removal efficiency over the course of the demonstration run, even when the boiler switched to a higher sulfur coal. Meanwhile, the particulate emission rate for the ESP remained well below the NSPS for particulates (0.03 lbh4Ettu) throughout the run.
In accordance with the compliance monitoring results, the GSA demonstration system does not generate additional aqueous waste over the amount discharged from the plant during normal operations.
The solid waste by-product resulting from the operation of the GSA unit has the same composition as the spray dryer by-product. In keeping with the existing practices, these solids are diluted with water to generate a slurry containing approximately 10% solids before being pumped to an existing ash pond for ultimate disposal. Changes in ash pond effluent as a result of the operation of the GSA is negligible. Table 6.1.2 presents the results of a lechate test performed on GSA waste product by GA1 Consultant Inc. The results show that the leaching characteristics of GSA waste is well within the Resource Conservation and Recovery Act (RCRA) limits.
6.1.3 Ecological Imoacts
No adverse ecological impacts to either terrestrial or aquatic environments are expected for the GSA project. The GSA unit is constructed on previously disturbed land located beyond the 500 year flood plain of the Ohio River. Effluent from its operation constitutes less than 0.001% of the total Shawnee Steam Plant waste water balance discharged to the Ohio River. Although wetlands are present within the broader confines of the Shawnee Steam Plant, the GSA unit does not discharge any material to any wetlands or lakes.
-124-
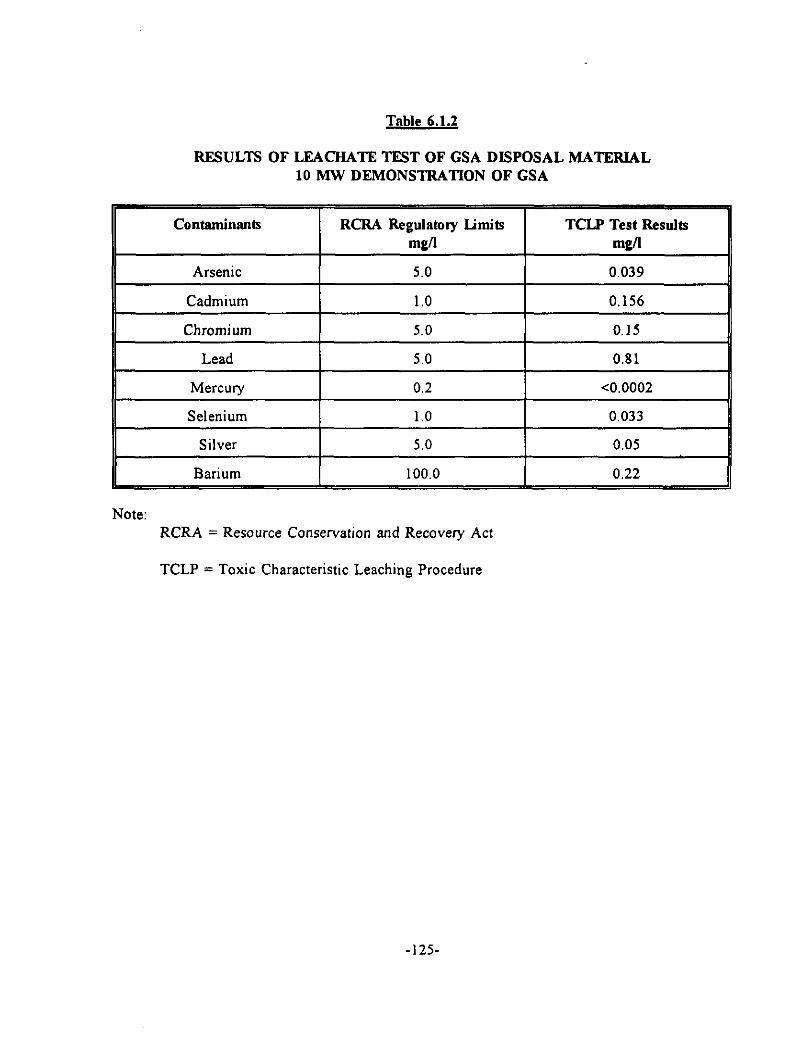
Table 6.1.2
RESULTS OF LEACHATE TEST OF GSA DISPOSAL MATERIAL 10 MW DEMONSTRATION OF GSA
Contaminants RCRA Regulatory Limits TCLP Test Results me/l mdl
Arsenic 5.0 0.039
Cadmium 1.0 0.156
Chromium 5.0 0.15
Lead 5.0 0.81
Mercury
Selenium
0.2 <0.0002
1.0 0.033
Silver
Barium
Note: RCRA = Resource Conservation and Recovery Act
TCLP = Toxic Characteristic Leaching Procedure
-125-

6.1.4 Health and Safetv Imoacts
The health and safety requirements applicable to the construction and operation of the GSA demonstration project include “construction” and “general industry” standards of the Federal Occupational Safety and Health Act in 29 CFR Parts 1910 and 1926, respectively. These standards include requirements related to walking and working surfaces, means of ingress and egress, operation of powered equipment, adequate ventilation, noise exposure controls, tire protection, and electrical equipment safeguards. Shawnee Fossil Plant employees are already trained in work protection and safety procedures under existing TVA guidelines. The current procedures are adequate to ensure that applicable standards are not exceeded. Contractors have complied with all site rules and regulations concerning health and safety.
The demonstration project has not required the storage and/or use of any “extremely hazardous substances” as defined under the Superfund Amendments and Reauthorization Act (SARA) Title III, or Emergency Planning and Community Right-to-Know program. Thus, no SARA Title III emergency planning notification is applicable to this project.
6.1.5 Imoact Summarv
The majority of the potential additional environmental consequences resulting from the installation, operation and testing of the GSA can be categorized as insignificant because TVA’s existing SD/ESP and AirPol’s GSA process are essentially identical and the GSA replaced the SD/ESP. However, two potential positive environmental impacts are identifiable: (1) the GSA consumes less lime than the existing system; (2) and will, therefore, generate less solid waste by- product. As a whole, the environmental benefits resulting from the commercial implementation of GSA systems are extraordinary.
-126-
6.2 WASTE STREAMS AND THEIR DISPOSAL
The by-products from the demonstration system are cleaned gas exiting the stack and waste material discharged from the reactor and cyclone. The cleaned gas is discharged into the atmosphere. The solid by-product is mixed with the ESP ash. diluted with water to generate a slurry containing approximately 10% solids and pumped to an existing ash pond for dewatering and ultimate disposal with other ash. Changes in ash pond effluent quality or quantity as a result of the operation of the GSA are infinitesimal.
The GSA system is designed to treat a slip stream from Unit 9 Boiler of 20,000 SCFM of boiler flue gas. The average composition of the by-product from the GSA system is as follows:
WOW2 1.4 % CaCO, 9.0 % CaSO, 44.0 % CaSO, 19.4 % Acid Insoluble 26.2 %
The quantity of waste is approximately 1,060 lb/hr, being sluiced with 17,000 gallons of water per day. The once-through cooling water used by the entire plant and returned to the Ohio River is 1.5 billion gallons of water per day. Since the waste from the GSA unit was the same as that currently discharged to the ash ponds and had only 0.001 % of the total water discharge to the Ohio River, the demonstration project did not show any environmental impact or impact on current operational practices.
The SO, loading was 389 lbs/hr in the inlet gas stream and 31 lbs/hr in the outlet. The dust loading was 501 lbs/hr in the inlet gas stream and 2.18 lb&r in the outlet gas stream. This level of particulate discharge into the atmosphere is below the NSPS maximum limit of 0.03 lb/MBtu.
-127.
6.3 POTENTIAL ENVIRONMENTAL CONCERNS
Successful removal of hazardous air pollutants was expected in the design of the GSA demonstration system. Air toxics tests were conducted by Energy and Environmental Research Corporation (EERC). The results of the air toxics testing show that the GSA process is capable of removing HF. particulate and trace metals. For detailed analytical data of air toxics testing please refer to a separate monitoring report prepared by EERC.
-128-
7.0 ECONOMICS
The economic evaluation was performed by Raytheon Engineers & Constructors. The economic evaluation basis was a pulverized coal-fired plant producing a nominal 300 MW (net). Operating conditions for the boiler were assumed to be typical of modem units. Table 7.0 is a brief summary of performance and economics of the GSA technology based upon Raytheon’s report presented for a brief review of this project. The detailed information of this section is available in the Economic Evaluation Report presented by Raytheon Engineers & Constructors in Appendix “A” of this report. Appendix “A” consists of two sections describing the results of the analysis presented in the Raytheon’s report.
The Section 3 of the appendix “A” is the general criteria of the evaluation, which incorporates both process and economic design criteria.
The specific economic evaluation for AirPol’s Gas Suspension Absorber (GSA) is presented in Section 20 of the Raytheon’s report.
-129-
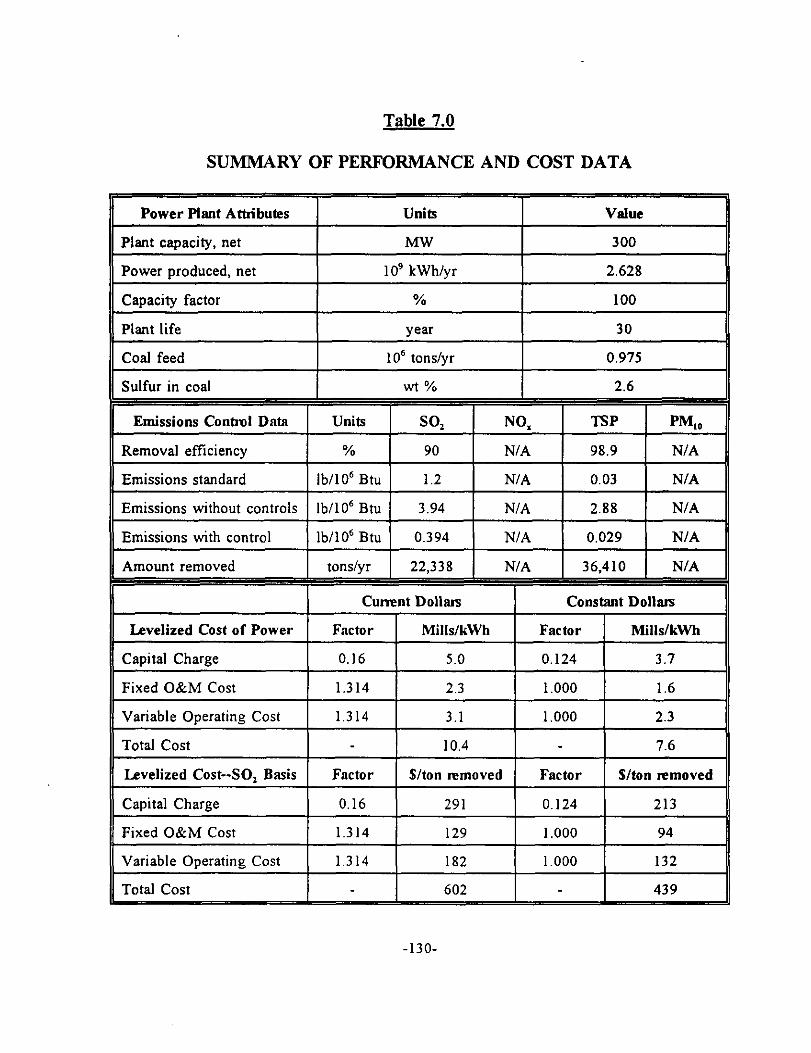
Table 7.0
SUMMARY OF PERFORMANCE AND COST DATA
II Power Plant Atbibutes I Units I Value II
Plant capacity, net Mw 300
Power oroduced. net lo9 kWh/vr 2.628
II Capacity factor % 100 II Plant life
Coal feed
year
lo6 tons/yr
30
0.975
II Sulfur in coal I wt % I 2.6 II Emissions Contml Data Units SO, NO, TSP PM,,
Removal efftciency % 90 N/A 98.9 N/A
Emissions standard lb/lO’ Btu 1.2 N/A 0.03 N/A
Emissions without controls lb/lo6 Btu 3.94 N/A 2.88 N/A
Emissions with control lb/lo6 Btu 0.394 NIA 0.029 N/A
Amount removed tonslvr 22,338 N/A 36,410 N/A
II I Cunent Dollrus I Constant Dollars II Levelized Cost of Power Factor MilIs/kWh Factor Mills/kWh
Capital Charge 0.16 5.0 0.124 3.7
Fixed O&M Cost 1.314 2.3 1.000 1.6
Variable Operatins Cost 1.314 3.1 1.000 2.3
Total Cost
Levelized Cost--SO, Basis
Capital Charge
Factor
0.16
10.4
$/ton removed
291
Factor
0.124
7.6
S/ton removed
213
II Fixed O&M Cost I 1.314 I 129 I 1.000 I 94 II Variable Operating Cost 1.314 182 1.000 132
Total Cost 602 439
-130-
8.0 COMMERClALlZATlON POTENTIAL AND PLANS
8.1 MARKET ANALYSIS
8.1.1 Aoolicabilitv of the Technology
The equipment has been demonstrated to operate at the same design requirements as previously experienced in the incineration industry where the GSA has established a position as a lower cost semi-dry type of scrubber. The technology offers solutions for many of the problems experienced in the use of conventional spray dryers for SO2 control for utility and industrial boiler installations. The GSA demonstration unit operated with very little buildup, without corrosion and reached removal levels above 90% at reasonable consumption of the lime reagent.
The GSA has some superior features that make it attractive to the utility industry. The unit has a very small footprint when compared to either wet systems or conventional dry scrubbers. The collected byproduct is easier to handle due to a very low moisture level (less than I%) and low leachability. The spray is accomplished with a single large orifice nozzle that can be serviced on line. The power consumption is less than competing technologies due to minimized air consumption, limited material handling systems and the design does not require fine atomization of the lime slurry spray.
The unit may be used for any size of boiler as it is best installed as a modular system. It will be more attractive for systems less than 300 MW especially for retrofit installations. The unit has both low capital and low operating costs when compared with wet lime stone scrubbing and should be well received for industrial boilers.
The unit has been tested for air toxics removal and achieved some superior results. This could help in the development of the market especially for new and smaller retrofit applications.
8.1.2 Market Size
The domestic market for this technology appears to be limited at the present time. The current unknown status of clean air act regulations as to level of cleaning requirements and the timing for meeting the requirement offers a serious problem in entering the market. Will the requirements be limited to only larger units? How much improvement in gas cleaning is needed by these units to reach compliance? These uncertainties makes the market extremely difficult to quantify at this time. Currently we project the major market for GSA to develop between the year 2000 to 2010.
AirPol anticipates a market size of one (I) domestic order for a smaller boiler over the next live (5) years. The market should then grow at a SO percent rate per year over the following ten (10) years. The order for the GSA technology are expected to grow from $3 - 5 million to $15 - 30 million.
-131-
8.1.3 Market Barriers
The utility industry has been slow to accept new technologies until it is demonstrated for application with scaled up capacity. AirPol has secured its first installation on a 50 MW municipal boiler where extensive testing will be performed during the first six (6) months of operation. The unit will begin operation in 1996 and should support acceptance by the utility industry for smaller installations by 1997.
The technology will compete with fuel switching and the cost of purchasing SO, allowances. We expect this to be the major barrier to the introduction of this or other new technologies.
8.1.4 Economic Comparison with Comoetine Technoloeies
The economics of the GSA system is projected as a general comparison to a conventional spray dryer and a wet system
As part of the DOE CCT Program, an economic evaluation of the GSA process was conducted using the same design and economic premises that were used to evaluate about 30 to 35 other FGD processes. The relative process economics for the GSA system were evaluated for a moderately difficult retrofit to a 300 MW boiler burning a 2.6 percent sulfur coal. The design SO, removal efficiency was 90 percent.
The resulting capital cost estimates (in 1990 dollars) are shown in Table 8.1.3-1 along with those for the conventional wet limestone, forced-oxidation (WLFO) scrubbing system. The total capital requirements for the GSA process are substantially lower than those for the WLFO ($149/kw vs. 216/kw). Since the presumed accuracy of these estimates is +/- 10 percent, this lower capital requirement estimate for the GSA process is significant. The substantially lower capital requirements are primarily due to the lower costs in the SO, absorption technology.
The levelized annual revenue requirements for the two processes (in 15-year levelizing) are shown in Table 8.1.3-2. The GSA system operating cost differs most in the reagent cost. The reagent cost for GSA process is 2.8 times that of WLFO due to the higher lime cost. However, this higher reagent costs are offset by lower power cost and lack of steam requirement for re- heating. Overall, the levelized costs for GSA are 20 percent lower than those for the WLFO process.
A comparison of the space to be occupied by the GSA to the spray dryer unit shows that the space requirement of a GSA is much lower than that of a spray dryer. Owing to its comparatively simple design and fewer components, the GSA capital cost is lower than that of the spray dryer. Meanwhile, based on the fact that the GSA requires less power and has better lime utilization than a spray dryer, the GSA will also have lower operating cost.
The details of the comparison can be found in Appendix “A”, Economic Evaluation Report
-l32-
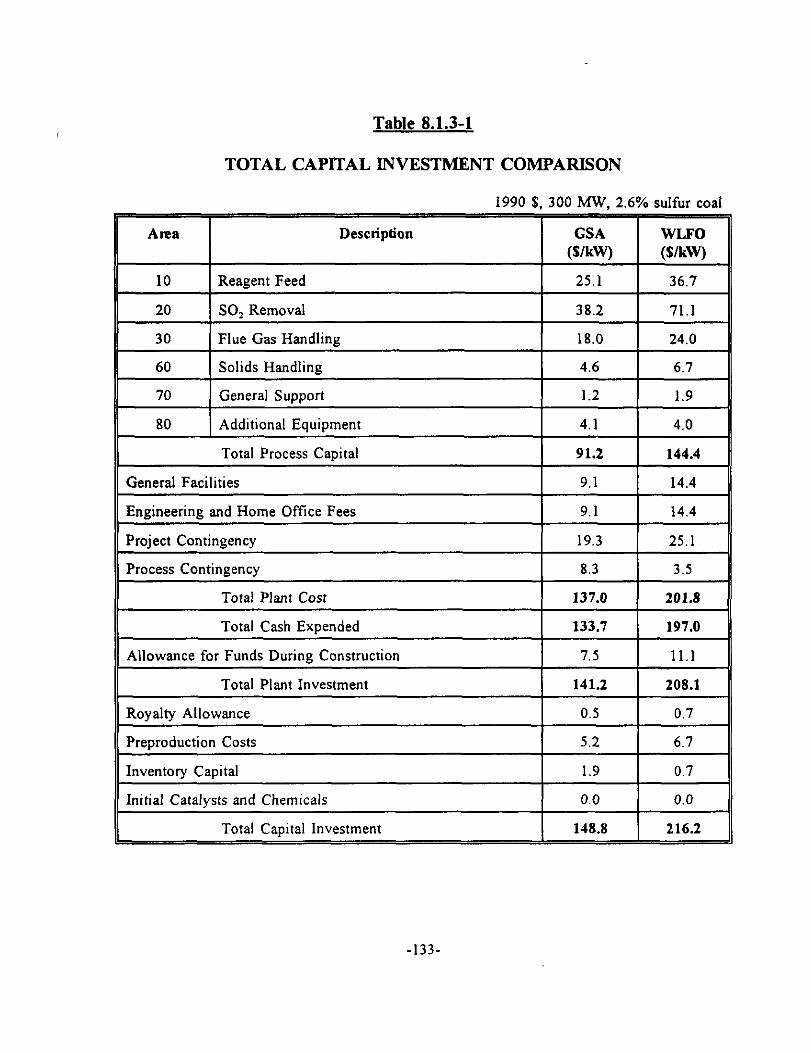
Table 8.1.3-1
TOTAL CAPITAL INVESTMENT COMPARISON
1990 S. 300 h4W. 2.6% sulfur coal
II Ama I
Description I
GSA I
WLFO iSlkW1
10 Reagent Feed 25.1 36.7
20 SO, Removal 38.2 71.1
30 Flue Gas Handling 18.0 24.0
60 Solids Handline. 4.6 6.7
70 General Support 1.2 1.9
80 Additional Eauiument 4.1 4.0
Total Process Capital
General Facilities
91.2 144.4
9.1 14.4
Engineering and Home Office Fees
Project Contineencv
9.1 14.4
19.3 25.1
Process Contingency
Total Plant Cost
8.3 3.5
137.0 201.8
Total Cash Expended 133.7 197.0
Allowance for Funds Durine Construction 7.5 11.1
Total Plant Investment
Rovaltv Allowance
141.2 208.1
0.5 0.7
Preproduction Costs
Inventorv Caoital
5.2 6.7
1.9 0.7
Initial Catalysts and Chemicals
Total Capital Investment
0.0 0.0
148.8 216.2
-133-
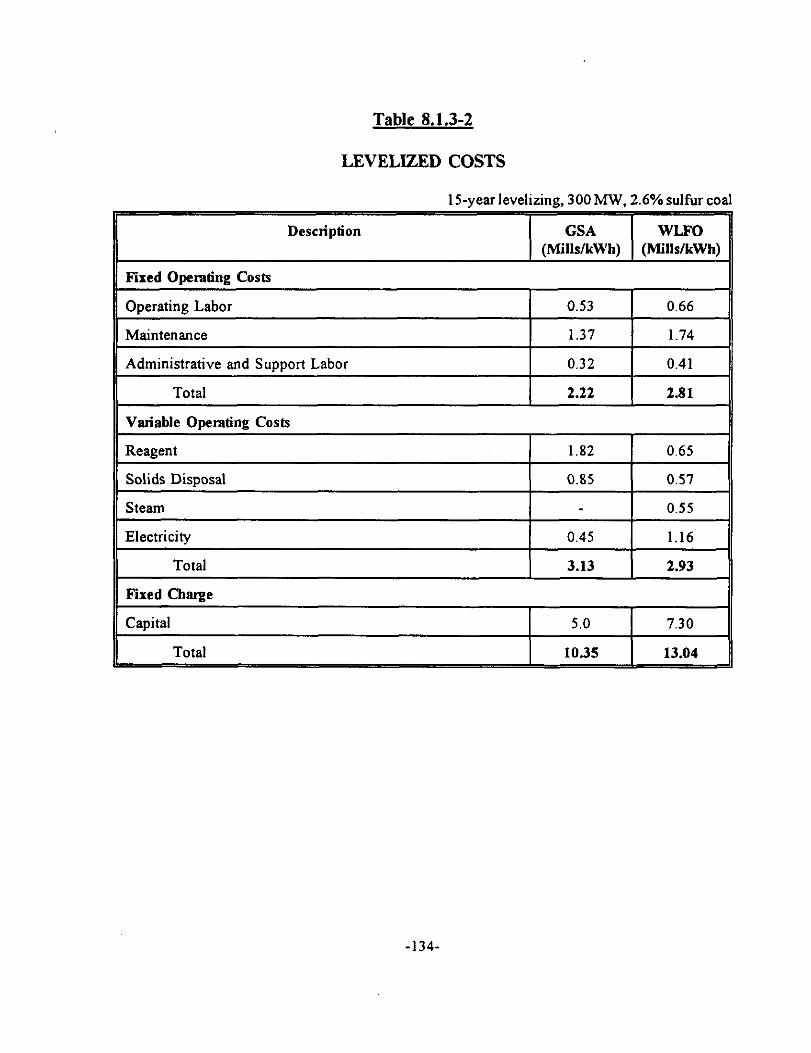
Table 8.1.3-2
LEVELIZED COSTS
15-yearlevelizing, 3OOMW, 2.6% sulfur coal
Desclipfon
Operating Labor 0.53 0.66
Maintenance 1.37 1.74
Administrative and Support Labor 0.32 0.41
Total 2.22 2.81
Vatiable Opemting Cosb
Reagent 1.82 0.65
Solids Disposal 0.85 0.57
Steam 0.55
Electricity 0.45 1.16
Total 3.13 2.93
Fired Chuge
Capital 5.0 7.30
II Total I 10.35 I 13.04 II
-134-

8.2 COMMERCIALIZATION PLANS
A set of commercial steps were established by AirPol as part of this program and are in the process of being carried out. They consists of the following elements:
1. Analyse the test data from the test program to determine the operating capabilities for SO, removal of the GSA versus conventional spray dryer scrubbers.
2. Evaluate the pilot plant operating results to determine the mechanical design and maintenance requirements to be incorporated in the design of larger systems. In addition, the operating and maintenance cost will be evaluated and compared with competitive designs.
3. Develop a presentation based on the test program results, equipment experience, previous incineration experience (1988 - Present) and requirements of the utility marketplace. The presentation will present past experience, test results, capital costs, operating costs and disposal considerations.
4. Develop an estimating capability for bidding and building complete GSA - FGD facilities for smaller industrial boilers, transfer of the technology and for bidding larger USA utility plants, The units will be modular and include computerization of the process calculations, equipment descriptions, cost estimates and general arrangement drawings.
5. Make presentations to people, organisations and conferences within the DOE CCT program to find potential demonstration plants for installation of the GSA technology. The goal is to secure at least one (1) other demonstration installation.
6. Explore export possibilities to developing markets where low capital cost and new technology will be accepted and evaluated along side of developed proven technologies. The goal is to secure at least two (2) installations (hard coal and brown coal).
7. Use the TVA pilot installation and the first full scale demonstration plant(s) and overseas installations to qualify for large USA FGD utility applications.
8. Develop capabilities to service the full FGD utility market by bidding and building FGD process plants based on the prior commercialization work.
AirPol has completed the steps (1) to (5) and is currently working on steps (6) and (7). Some comments as to the results are appropriate prior to discussing the market potential as projected in this point of the commercialization.
In step (1) the initial test pointed out positive aspects of the GSA in removing high SO, loading from a coal fired plant. The loading was about 1800 PPM which is in the high sulfur range (1500 - 3000 PPM). The GSA was able to reach higher levels of removal than conventional spray dryers while operating at lower approaches to saturation. where the removal rates are enhanced.
-135.
When chloride is added the GSA was able to reach even higher levels of removal. Overall the GSA can be expected to equal or exceed the removal efficiency of a conventional semi-dry wheel type spray dryers.
In step (2) the more interesting parts of the test program began to emerge. Significant problems were not experienced in the operation of the unit compared to the operating experience of conventional semi-dry scrubbers. Start-up and commissioning prior to testing was accomplished in less than one month while previous experience at the test facility suggested an anticipate three (3) to six (6) month time frame. Solid build-up did not occur and no mechanical operating difftculties were encountered.
Steps (3) and (4) are ongoing and have reached an acceptable level for securing orders. The presentation and cost estimation will continue to develop and change through the life of the GSA.
Step (5) has been accomplished in the securing of a 50 MW municipal order. The unit will be operational in the second half of 1996.
In step (6) AirPol is active in several export markets and expects to receive the first orders during 1995. The same market barriers exist but the market is more active and compliance dates during 1997 through 1999 are a driving force.
We project full market development in steps (7) and (8) for the GSA will occur after the year 2000 when compliance with phase two of the Clean Air Act Amendment of 1990 must be achieved.
-136-
9.0 CONCLUSIONS AND RECOMMENDATIONS
The 10 MW Demonstration of Gas Suspension Absorption project was completed successfully and on time. Following conclusions are drawn from the entire demonstration run.
1.
2.
3.
4.
5.
6.
7.
8.
9.
10,
The GSA/ESP process can achieve more than 90 percent SO, removal efficiencies at modest stoichiometric ratio (1.30 moles Ca(OH),/mole inlet SO,) and a close approach-to-saturation temperature (8 “F) when treating flue gas resulting from the combustion of a 2.6 percent sulfur, low-chloride (0.02 - 0.04 percent) coal.
The GSAlESP process can achieve 90+ percent SO, removal efficiencies at a modest stoichiometric ratio and a higher approach-to-saturation temperature (18 OF) with slightly higher levels of chlorine in the coal (0.12 percent).
Most of the SO, removal efficiency occurs in the reactor/cyclone with relatively low SO, removals (2 - 5 percentage points) in the ESP.
The enhanced mass and heat transfer characteristics of the GSA reactor allows high SO, removal efficiencies to be achieved at a very low flue gas residence time. The GSA reactor/cyclone also operates at a high flue gas velocity (20 - 25 ftkec). Thus, the GSA reactor is only one-third to one-fourth the size of the conventional spray dryer vessel, which reduces the capital investment for the GSA system.
The expected enhancing effect of chlorine on the SO, removal efficiency in the GSAiESP process was documented. Even modest coal chloride levels (0.12 percent), which are typical of many coals, can provide this effect.
The GSA/ESP process has very low particulate emission rates, i.e. well below the NSPS for particulates, when a four-field ESP with a specific collection area (SCA) of 440 ft*/kacfm is used as the particulate control device.
The SO?, removal efficiency in the GSA/PJBH system was typically about 3 - 5 percentage points hrgher than that achieved in the GSA/ESP system at the same test conditions.
The GSA system produces a by-product material containing very low moisture levels. This material contains both fly ash and unreacted lime and thus, with the addition of water, undergoes a pozzolanic reaction and can be disposed of in a landfill.
The GSA system has no wet/dry interface and the entire system is fabricated from carbon steel rather than high-cost alloy material.
The GSA system has lower capital costs and comparable revenue requirements to those for a conventional wet limestone forced-oxidation (WLFO) system for a 2.6 percent sulfur coal application. At lower coal sulfur levels, the GSA system will have lower revenue
-137.
requirements than the comparable WLFO system
As presented in the this report, the GSA process has been designed with proper considerations for existing site conditions, cost economization, environmental impacts and operation concerns. The demonstration unit has achieved all the projected performance and will be commercialized in time for the intended market,
It is concluded that the results of the 10 hIW Demonstration of Gas Suspension Absorption have met the goal of the Clean Coal Technology Program.
10.0 REFERENCES
1. Comprehensive Report to Congress Clean Coal Technology Program, 10 Mw Demonstration of Gas Suspension Absorption U.S. Department of Energy, Assistant Secretary for Fossil Energy, Office of Clean Coal Technology, July 1990.
2. Environmental Information Volume, 10 MW Demonstration of Gas Suspension Absorption, Clean Coal Technology III Program. AirPol Inc., Tennessee Valley Authority.
3. The Clean Coal Technology Program: 10 MW Demonstration of Gas Suspension Absorption for Flue Gas Desulfurization, Frank E. Hsu, Sharon K. Marchant.
4. The Clean Coal Technology Program 10 MW Demonstration of Gas Suspension Absorption for Flue Gas Desulfurization, First Annual CCT Conference, Frank E. Hsu, September 1992.
5. Environmental Monitoring Plan --- Gas Suspension Absorption Demonstration Project Shawnee Test Facility, Roy V, Carter, Kenneth G. Wastrack, TVA, October 1992.
6. Flue Gas Desulfurization of High Sulfur Coals --- Retrofit Costs, Lime Consumption and Removal Efficiencies --- 10 MW DOE Demonstration Program, Proceedings of the 18th International Technical Conference on Coal Utilization & Fuel Systems (Clearwater, Florida), Willard L. Goss, April, 1993.
7. The Clean Coal Technology Program 10 MW Demonstration of Gas Suspension Absorption for Flue Gas Desulfurization, Second Annual CCT Conference, Frank E. Hsu, September 1993.
8. 10 hIW Demonstration of Gas Suspension Absorption Final Public Design Report, Frank E. Hsu, March 1994.
9. Summary of Findings: 10 MW Demonstration of Gsa Suspension Absorption (GSA), Proceedings of the 19th International Technical Conference on Coal Utilization & Fuel Systems (Clearwater, Florida), Willard L. Goss, March 1994.
10. Environmental Monitoring Report, 10 MW Demonstration of Gas Suspension Absorption, Frank E. Hsu, June 1994.
11. The Clean Coal Technology Program 10 MW Demonstration of Gas Suspension Absorption for Flue Gas Desulfurization, Third Annual CCT Conference, Frank E. Hsu. September 1994.
-139.
11.0 APPENDIXES
Appendix “A”: “Economic Evaluation Report” by Raytheon Engineers & Constructors Section 3: General Criteria Section 20: AirPol Gas Suspension Absorber (GSA)
Appendix “B”: “10 MW Demonstration of the Gas Suspension Absorption Process at TVA’s Center for Emissions Research” by Tennessee Valley Authority
-140-
APPENDIX “A”
ECONOMIC EVALUATION REPORT
Section 3: Geneml Criteria
Section 20: AirPol Gas Suspension AbsoltKr (GSA)
By Raytheon Engineers & Constructors
Prepsued for the United States Department of Energy Under Cooperative Agreement No. DEFZZ-90PC90.542
Cleared by Office of Patent Counsel Chicrgo Opemtions Office U.S. Department of Energy
SYSTEM DESIGN CRITERIA
SECTION 3
GENERAL CRITERIA
General design criteria were establishes ror this stuoy to maintain
consistency tram case to case analyses, as well as with other EPHI-sponsorea
projects and criteria. Design criteria an0 sparing requirements were
established jointly oy UE&C ana EPHI. both process ana economic criteria are
applicable to all processes evaluatea. Criteria specific' to each process are
presentea I" the inaiviaual FGU system sections. It must be emphasizea that
the use ot premises or assumptions aifterent trom EPKI's criteria coula alter
the comparative ranking of process costs. The dry injection processes involve
much less equipment relative to wet FGU. The application of maintenance, as well as process, and project contingency factors based on percentages of
capital cost will tena to favor lower capital processes unless their
percentages are adjusted upward dramatically to reflect the inherent risk ot
these lesser developea processes. There is no data on the dry injection
processes to validate lower maintenance ana operating cost. The items
discussea in this section are as tollows:
. Changes From Previous EPHI Estimates
0 Process Design Criteria
--Generating Plant
--Coal and flue Gas
--Sulfur Uioxiae Removal Requirements
--boiler Capacity
--General Equipment
--FGU System battery Limits
--Raw Materials
--bolias Disposal
b Economic Design Criteria
--Capital Estimate Sumnary
--Operating Cost Sumnary
3-1
CHANGES FROM kwv10us EPRI .ESTIMTES
The aesign ana economic criteria for the current cost estimates have changed
from those useo in previous EPHI cost estimates. The principal changes
incluae the following:
Coal Sulfur - reaucea from 4.0% to 2.6%. which matches the Department of
Energy coal usea in the Clean Coal Technology program. The future computer mOoe1 will permit sensitivity calculations over the range of 0.5% to 6.0%
sulfur.
Engineering - reaucea from 12.5% to 10% of total process capital to reflect
the experience ana knowledge gained from the first generation of FGD systems
installea at utility power generating stations. This tactor may have to oe
aajusted upwaro it legislation leaas to a large demand for aomestic
architect/engineering services that are currently in short supply.
maturing Technology - Many of the problems with the first generation of
scrubbers have oeen solvea. and overseas designs have incorporatea numerous
aavancements. As the inoustry benetits from the learning curve, design
improvements are oeing incorporatea into newer aesigns. The resulting cost
reauction retlects reauced contingency, less component sparing, in-situ
oxiaation. ana reaucea reheat.
Financial/Accounting Practice - with the reaucea unit size (from 500 Mw to
300 Mw), the construction period was reaucea from three to two years, thereby
resulting in a lower adjustment for Allowance for Funas During Construction. j
In addition, when incorporating the charge for FGD power consumption, the
plant net kw are no longer reaucea. FGD power is now charged strictly as an
operating cost at 50 mills/kwh.
PROCESS DESIGN CRITERIA
Generating Plant
The generating plant chosen for study is a new one-unit, pulverized coal-fire0
plant producing a nominal 300 MW (net). Operating conaitions for the boiler
are assumea to be typical of moaern units.
3-2
The plant is assumed to be located near Kenosha, Wisconsin, at an elevation of
600 ft. above sea level. Atmospheric pressure used for flue gas composition
ana volume aetermination is 29.4 in. Hg (99.2 kPa). An ambient temperature
range of -25" to 105'F (aver. 60°F) was assumed. Structural criteria are
those for Seismic Zone 1 as definea by the Uniform Building Code. Plant
aesign life was assumed to be 30 years for new plant installations (wet ano
LSu systems) and 15 years for retrofits (dry injection processes).
A fifteen year plant life was selected for those older units which would
typically require lower SO2 removal efticiency in a system-wide compliance
strategy. The wet LSFO and LSD processes were evaluated Dn both new 30-year
ana retrofit 15year plant lives for comparison to the ary FGD economic
evaluations.
The reference plant is equippeo with a separate particulate removal aevice
(cola, rigia frame electrostatic precipitator) upstream of all wet FGD
systems. Dry scrubbing systems are also assumed to use the existing ESP for
simultaneous removal of fly ash and SO2 absorption reaction products. The
particulate collection device iS assumed tD be designed to meet Current
tederal New Source Performance Stanaards (NSPS) (0.03 lb/lo6 Mu).
Coal and Flue Gas
The coal used for the base case analysis in the stuay is a medium sulfur. deep
minea, Pennsylvania bituminous coal, The coal analysis is presented in
Table 3-l. The coal selectea is consistent with the base coal specified in
the 1989 EPHI Technical Assessment Guide, EPRI P-6587-L (1).
boiler performance parameters useo for calculating flue gas flow and
composition are tabulated in Table 3-2.
Combustion calculations using the coal analysis from TaDle 3-l and combustion
parameters from Table 3-2 result in the flue gas composition and flow rates
snown in Table 3-3. Raw material and utility consumption rates calculateo in
this stuay are Dased on full load flue gas conditions at 100 percent load.
3-3
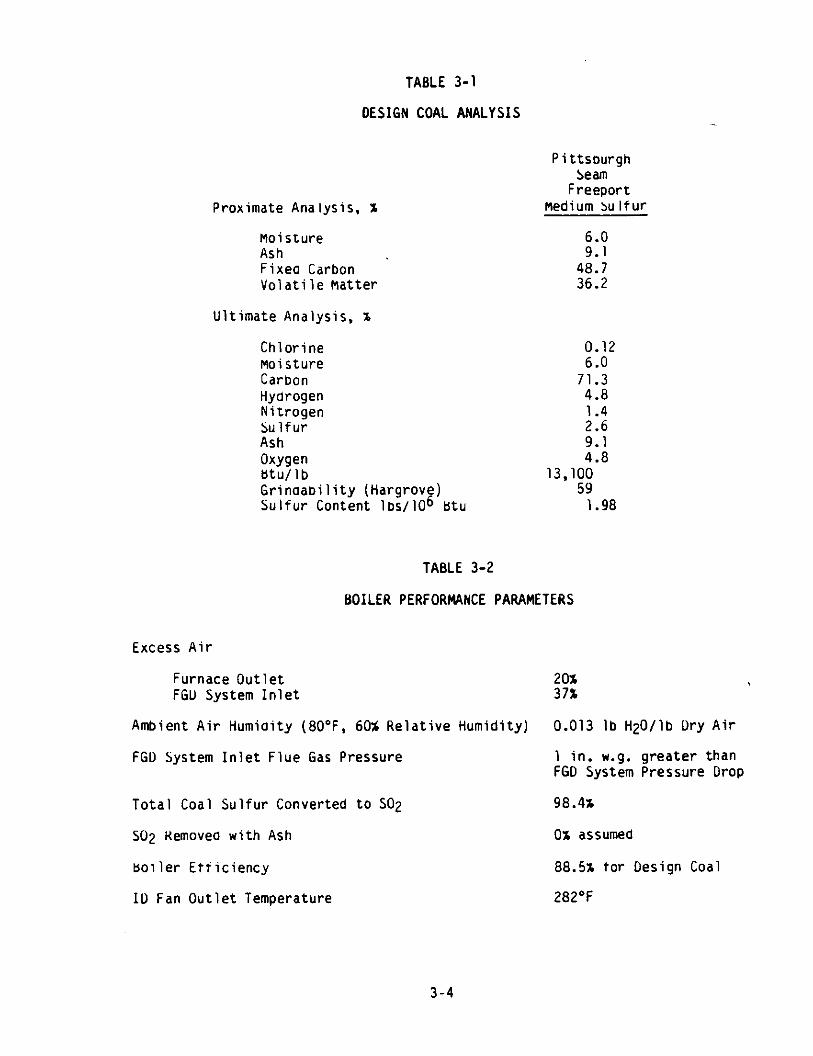
TABLE 3-1
DESIGN COAL ANALYSIS
Proximate Analysis, x
Moisture Ash Fixea Carbon Volatile hatter
Ultimate Analysis. x
Chlorine Moisture Carbon Hydrogen Nitrogen Sulfur Ash Oxygen tX.u/lb GrinaaDility (Hargrove) Su'lfur Content 1~106 titu
Pittsourgh Seam
Freeport medium bulfur
::: 48.7 36.2
0.12 6.0
71.3 4.8
::"6 9.1 4.8
13,100 59
1.98
TABLE 3-2
BOILER PERFORMANCE PARAMETERS
Excess Air
Furnace Outlet FGIJ System Inlet
Ambient Air Humioity (8O"F, 60% Relative Humidity)
FGD System Inlet Flue Gas Pressure
Total Coal Sulfur Converted tD SO2
SO2 Hemovea with Ash
Boiler Etiiciency
ID Fan Outlet Temoerature
0.013 lb H20/lb Dry Air
1 in. w.g. greater than FGD System Pressure Drop
98.4%
0% assumed
88.5% for Design Coal
282“F
3-4
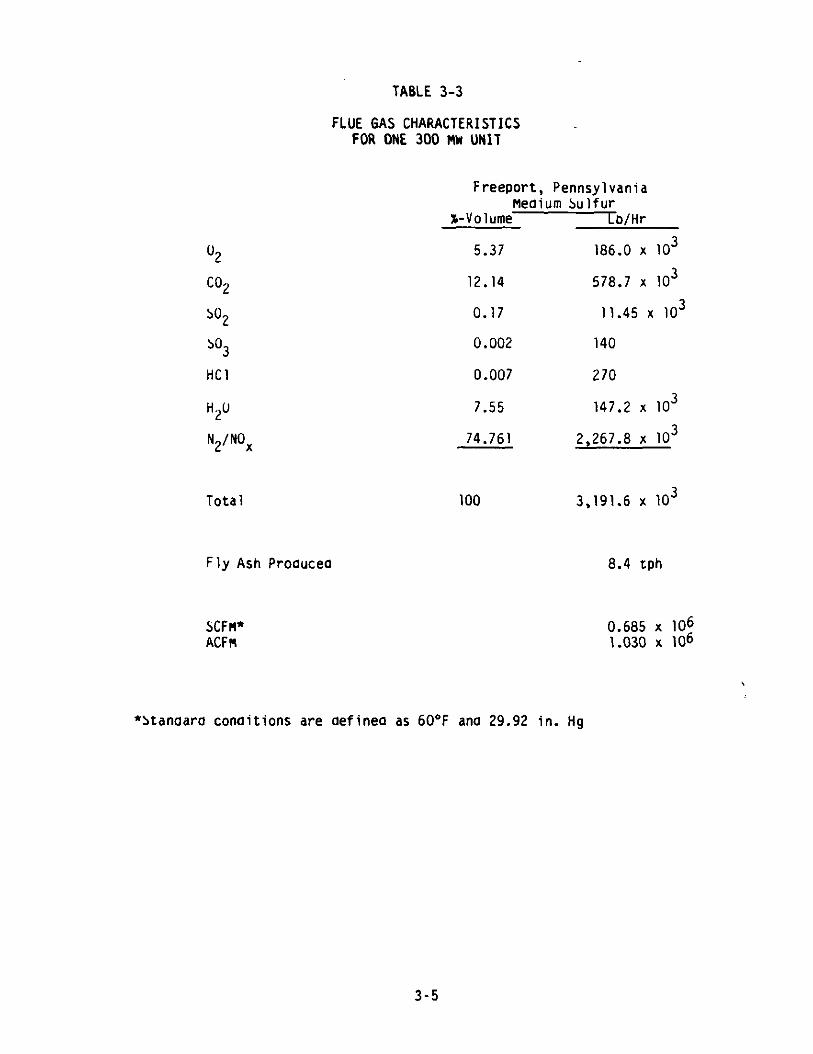
TABLE 3-3
FLUE GAS CHARACTERISTICS FOR ONE 300 MM UNIT
U2
coil
'02
So3
HCl
H2U
N2/NOx
Freeport, Pennsylvania Meclium Sulfur
X-Volume?Q/Hr
5.37 186.0 x lo3
12.14 578.7 x lo3
0.17 11.45 x lo3
0.002 140
0.007 270
7.55 147.2 x lo3
74.761 2,267.a x lo3
Total 100 3.191.6 x lo3
Fly Ash Proaucea 8.4 tph
SCFm* 0.685 x 10⁶ ACFM 1.030 x 10⁶
*btanaara conaitions are aefinea as 6O'F ana 29.92 in. Hg
3-5
Sulfur Dioxide Removal Requirements
The latest feoeral New jource Performance Jtanaaras (NSPS) require a 90 percent
overall reduction in potential SD2 emissions for the medium sulfur coal (2.6
Percent sultur in the oesign coal) usea in this stuoy. The removal efticiency
is to oe basea on a 30-aay rolling average. This stuay criteria assumes a
nominal FGD aesign efticiency ot 90 percent, on a continuous 100 percent loao
basis. For those processes which cannot achieve 90% removal efticiency, the
reported maximum SO2 removal capability is assumea. These nominal
etticiency values are used to develop material balances which provide the
basis for calculation of the annual operating cost ana equipment Sizing.
The reouction efficiency of an FGD system may, in actual practice, temporarily
rail below the NSP) limits aue to plant upsets and operational problems. The
stuoy makes several conservative assumptions which should oftset these periods
ot low performance:
1. No creoit is given in this study to sulfur entrained in the fly ash or bottan ash. Consequently the actual removal rate is higher than the design values.
2. No allowance is given for the fact that utilities can compensate for low removal efficiencies by:
--increasing the SO2 removal efficiency aoove the NSPS limit auring partial loaa ana non-peak perioos.
--increasing the absorptive capacity of the scrubbing solution. This involves increasing the pH of a lime. limestone or sodium system Or increasing the concentration of other active species.
--increasing the L/G ratio.
--operating the spare aosorber module.
Boiler Capacity
The base case ooiler capacity data shown in Table 3-4 were compiled from an
upaate to the EPHI TAG report(g). The base case net plant heat rate inClUoes
a four percent allowance for plant auxiliaries, out does not reduce the net
plant output aue to FGD steam or power consumption. The steam and power usage
developea for each FGD process are treatea strictly as operating costs using
the economic criteria presented later in this section. These Economic Design
Criteria describe in more aetail the method used to account for the steam and
3-6
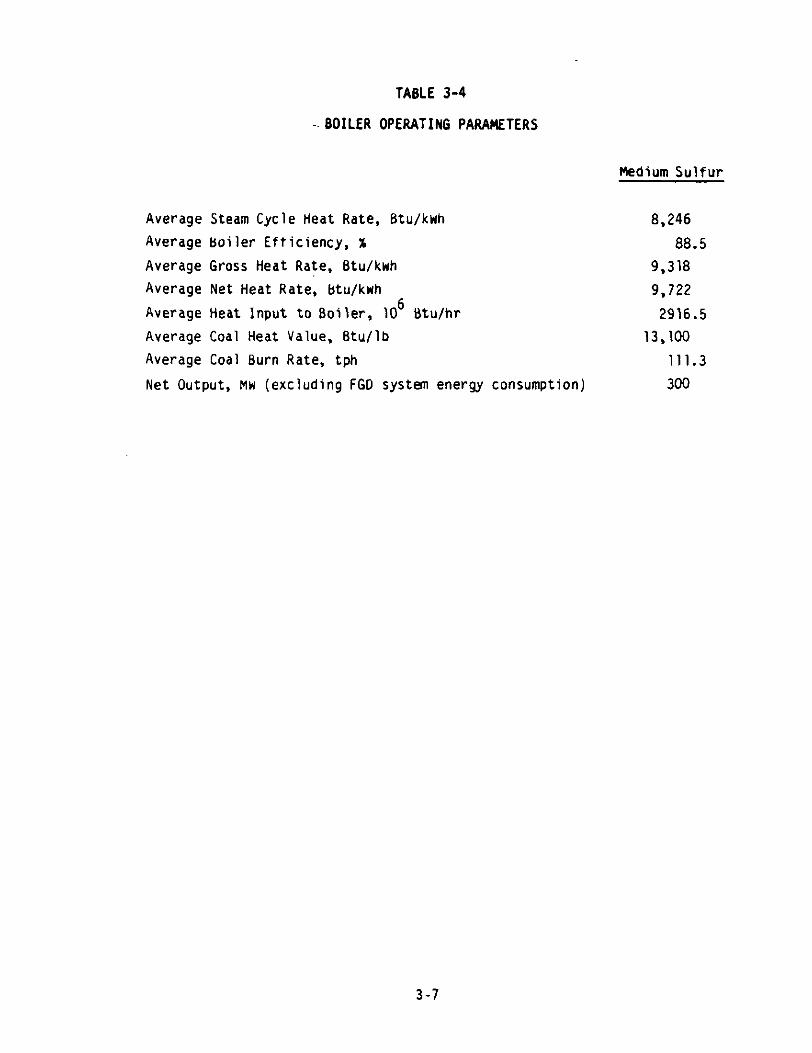
TABLE 3-4
_ BOILER OPERATING PARAMETERS
Medium Sulfur
Average Steam Cycle Heat Rate, Btu/kwh 8,246
Average boiler Efficiency, x 88.5
Average Gross Heat Rate. btu/kwh 9,318
Average Net Heat Rate; btu/kwh 9,722
Average Heat Input to boiler, lo6 btu/hr 2916.5
Average Coal Heat Value, Mu/lb 13,100
Average Coal burn Rate, tph 111.3
Net Output, MW (excluding FGD system energy consumption) 300
3-7
power requirements of each FGU process. The comDustion conditions describeo
in TaDle 3-4 result in a coal flow rate ana tlue gas tlow rate equal to that
used in El% report CS-1428. "FGO Economic and Design Factors" (3).
General Equipment
Certain equipment requirements and criteria are comnon to all medium sulfur
coal, wet FGD processes. It has oeen assumea that scruboea gas reheat of 25’F
over the saturatea gas temperature is required tor the wet FGD system base
case analysis. Heheat is proviaea using steam-heatea amoient air. Heheat
steam coils use Doth latent heat and SenSiDle heat by subcooling the
condensate to 2OO"F, prior to its return to the ooiler feedwater cycle. All
Wet systems include 100 percent flue gas Dypass duct work. llucts are sizea
tor 3600 fpm gas velocity for normal operation. Dry and semi-dry FGD systems
are assumea to require no flue gas reheat, with the exception of the LIFAC
process.
Combineo inaucea araft (ID)/oooster fans have been incluaed for all systems.
The fans provide the required ditferential pressure to overcome the FGD system
pressure arop requirements. Two fans are assumea to operate simultaneously in
parallel. The total tlange-to-flange pressure drop of the FGD system
determines the total fan pressure requirement.
Equipment reaunaancy has been incorporate0 into all DaSe case FGD systems to
increase reliability. Equipment typically is spared if its loss would require
imneaiate system shutdown. Absorber vessels include 3-50 percent capacity
modules. Pumps are 100 percent spared where the loss of a single pump would :
require shutaown. No sparing is useo where a bank of recycle pumps supply
Several spray levels in an absorber. An uninstalled warehouse spare pump has
been incluaea in these cases. Items such as tanks, bins, silos, agitators.
and heat exchangers are not spared. by-product production and additive feed
systems are assumed to contain spare critical components for continuous
operation and are not sparea as a system. It is also assumed that, should
shutdown be necessary, surge capacity is includeo in the by-product ano
aoaitive systems to allow repair without shutoown of the FGD system.
Equipment sparing ana sizing criteria is given in Table 3-5.
3-a
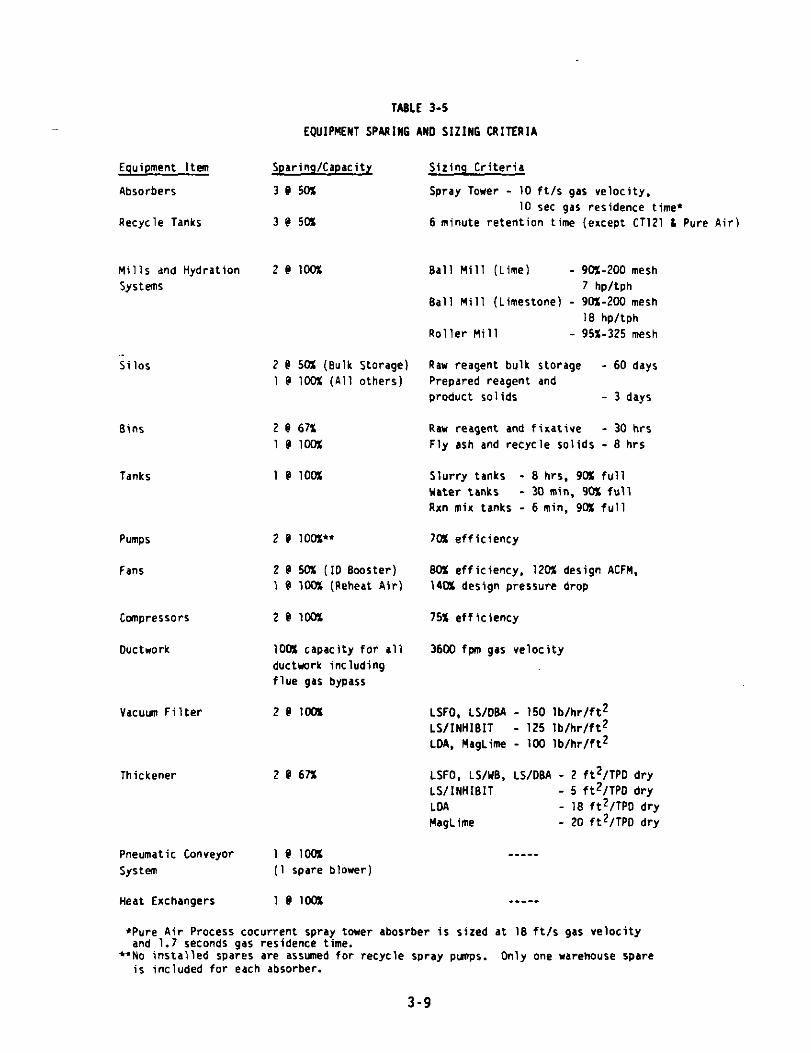
Equipment Item
Absorbers
Recycle Tanks
Mills dnd Hydration System
&lOS
Tanks 1 @ 100x
Pumps
Fans
cmnpressors
Ductwork
Vacuum Filter
Thickener
TABLE 3-5
EQUIPMENT SPARING AND SIZING CNITERIA
Sparing/Capacity
3 0 50x
3 e 5M
Sizing criteria
Spray Tower - 10 ftls gas velocity. 10 set gas residence time*
6 minute retention time (except CT121 6 Pure Air)
ZPlOO% Ball Mill (Lime) - 901-200 mesh 7 hp/tph
Ball Mill (Limestone) - 90%2OO mesh 18 hp/tph
Roller Mill - 95X-325 mesh
2 @ 501 (6ulk Storage) Raw reagent bulk storage - 60 days 1 P 100x (All others)
2 @ 67% lPlcc%
Prepared reagent and product solids - 3 days
Raw reagent and fixative - 30 hrs Fly ash and recycle solids - 6 hrs
2 P 100x"
2 e SM (ID Booster) I @ lOD% (Reheat Air)
26 lcox
lOD% capacity for all ductwork including flue gas bypass
2 e 100%
2 Q 67%
Slurry tanks - 6 hrs. 9C% full U&ta' tanks - 30 min. 9(n: full Rxn mix tanks - 6 min. gL% full
70% efficiency
GC% efficiency, 12(x design ACFM. 14M design pressure drop
75% efficiency
3600 fpm gas velocity
LSFO, LSlDBP - 150 lb/hr/ft2 LWNHIGIT - 125 lb/hr/ft2 LDA, HagLime - 100 lb/hr/ft2
LSFO. LS/YB, LS/DGA - 2 ft2/TP0 dry LWINHIEIT - 5 ftZ/TPD dry LDA - 16 ft2/TP0 dry MagLime - 20 ft2/TPD dry
Pneumatic Conveyor l@lOO% __---
system (1 spare blower)
Heat Exchangers l@lOc% -_---
*Pure Air Process cocurrent spray tower abosrber is sized at 16 ft/s gas velocity and 1.7 seconds gas residence time.
**No installed spares are assumed for recycle spray punps. Only one warehouse spare is included for each absorber.
3-9
System Battery Limits
General. battery limits are required to aetermine the scope of equipment and
suosequent cost impact on each of the FGD processes. It is sometimes
difticult to differentiate between the cost of FGIJ and particulate removal
systems. This difficulty arises from the following interrelationships:
0 Spray dryer ana sorbent injection processes use a particulate collector to perform the aual function of removing tly ash and the reaction proaucts. The particulate collector cost is not includeo.
0 The solids collected in the ESP (or FF) downstream of a dry FGU process is a mixture of fly ash and aosoraent product. This mixture is pneumatically conveyeo trcxn the particulate device to storage silos ana transportea to the landfill.
0 Processes proaucing a sludge typically combine fly ash with the sludge as a stabilizing a ent.
9 This mixture of fly ash and sludge is
transported to the landfi 1.
0 POrtiOnS of flue gas duct are sharea by both particulate removal and FGD equipment.
tiecause these areas are shared by both systems, the capital ana operating cost
of particulate removal and flue gas desulfurization cannot be easily
separatea. A systematic methooology is needed to obtain the FGD cost exclusive
of the particulate removal cost. This study will use the following approach:
0 The existing particulate system is assumed to be adequate for any increased grain loading caused by the FGD retrofit.
e A differential cost is developed for any adaitional cost associated with removal of solias from the existing particulate device. This could include installation of extra insulation and/or the replacement, of a wet ash handling system with a dry pneumatic conveying system- I
0 This difterential cost is adaed to the cost of the FGD system to derive the total FGD system cost.
FGD System battery Limits. The cost for the FGD system is developed within
the following battery limits.
a Duct work - From the plant air preheater outlet to the chimney including all dampers. support steel, manifolds. etc.
e ID fan - That portion of the capital and operating cost of ID/booster fans necessary to provide the pressure to convey the flue gas through the FGD system and associatea auctwork is considered.
3-10

Kaw water - Generating plant raw water system at the boundary of the FGLI system ana the generating plant. Supply conditions are 50 psig and 6D°F. The assumea chemical analysis is given in Table 3-6.
Steam - Process steam is assumed to be available from the generating Plant turbine cycle at main steam, cold reheat, and crossover extraction points. Minimum available pressures and corresponding temperatures at each extraction point are assumed to exceed:
Main Steam 2400 psig, 1DDD'F
Intermediate 418 psig. 572'F
Crossover a4 psig, 665QF
Electrical power - Power supply to the FGD system is assumed to be available from the generating plant transtormer yara to the FGD plant boundary as 34.5 kV feeaers. All necessary electrical equipment for voltage reduction and distribution is included in the FGD system.
Emergency power - Sufficient emergency power is available from the generating plant emergency power system, including an emergency power Ous tor the FGD system. The FGD system includes switching ana distribution for critical service items.
Solias disposal - Solids aisposal includes transportation ana ultimate placement in a lanafill for the base case.
Reagents and Raw Materials
Kaw material compositions assumed for the FGD process evaluations are listea
in Table 3-7.
Solids Disposal
Depending on the process an FGD system can have many proauct streams:
b Prescrubber purge - A prescrubber purge strem is required in Some FGD processes to remove fly ash. SD2. chloriae. and/or to presaturate the gas prior to entering the absorber. Each PrescruODer has an aciaic Dlowdown stream which is disposed of with the fly ash or pumped to the cooling tower blowaown pona at no Cost to the FGD process.
b Fly ash - The fly ash ana reaction proaucts collected by the ESP are pneumatically conveyed to fly ash aisposal silos for storage. These solios are unloaaea from the silo by rotary unloaaers and transported one mile oy truck to the lanafill for disposal. The lanafill average placement depth is 30 feet. Cost for fly ash disposal is not incluaeo in the operating cost.
3-11
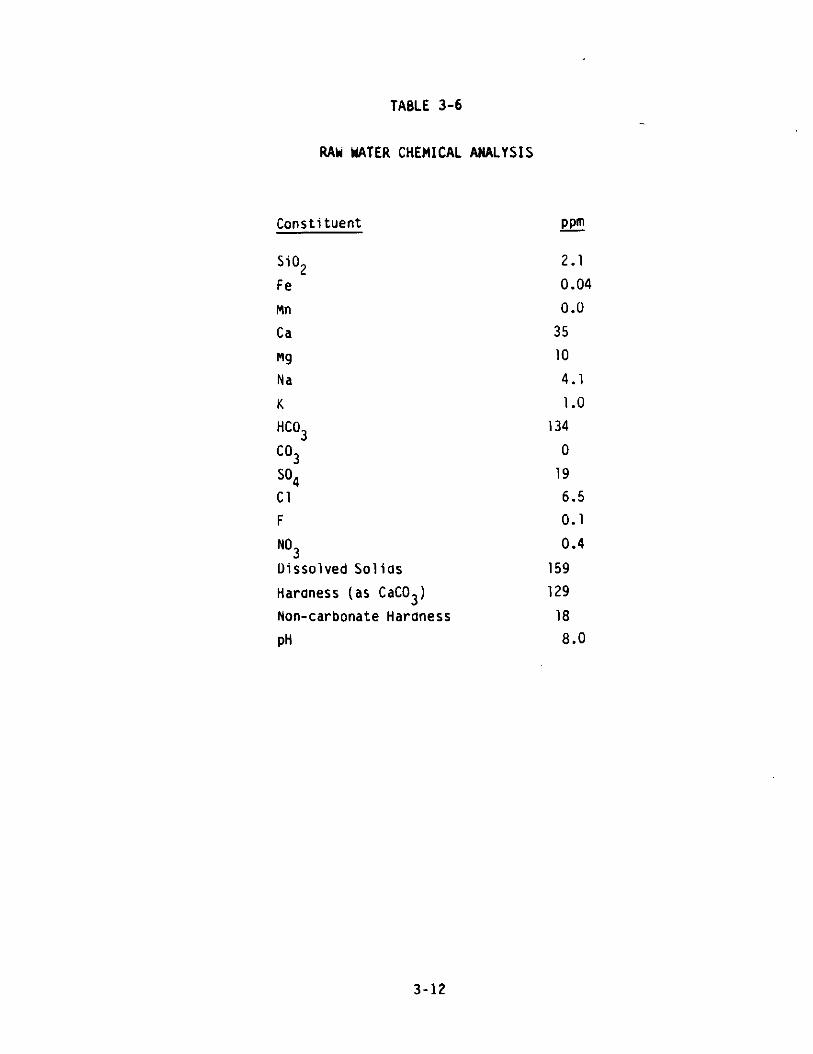
TABLE 3-6
RAY WATER CHEMICAL ANALYSIS
Constituent
SiD2
Fe
Mn
Ca
w Na
K
HC03
cD3
sD4 Cl
F
ND3 Dissolved Solias
Haraness (as CaCD3)
Non-carbonate Hardness
PH
wm -
2.1
0.04
0.0
35
10
4.1
1.0
134
D
19
6.5
0.1
0.4
159
129
ia
a.0
3-12
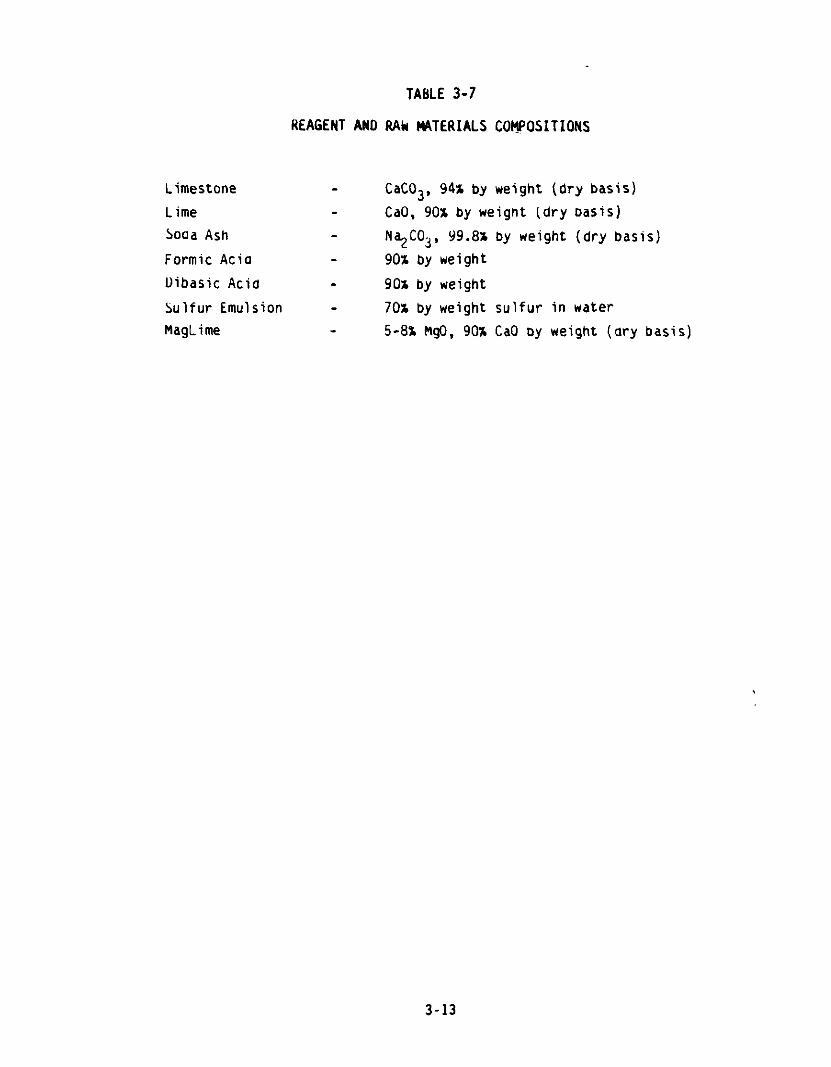
TAtlLE 3-7
REAGENT AND RAti ClATERIALS COl$POSITIONS
Limestone CaC03. 94% by weight (dry basis)
Lime CaO, 90% by weignt (dry oasis)
Soaa Ash N%C03, Y9.8x by weight (dry basis)
Formic Acio 90% by weight
Dibasic Acid 90% by weight
Sulfur Emulsion - 70% by weight sulfur in water
MagLime 5-8X MgO. 90% CaO oy weight (dry basis)
3-13
Fly ash/aosorber product mixture - Fly ash plus the absorber pr;;;:t solias are collectea in the ESP in ary or semi-dry processes. mixture is pneumatically conveyea to silos for storage. The solias are unloaded from the siio by rotary unloaders and transported One mile by truck to the landfill. A lineo lanafill is usea for soaium based systems and an unlinea landfill is used for Time OaSea systems. The lanafill depth is 30 feet.
Gypsum - Slurry product from wet systems containing a high ratio of sulfate to sulfite (99X+) is dewatered ano truckea to an unlined landfill located one mile from the plant ana impounded to a height of 30 feet.
Sludge from wet systems containing a high ratio of sulfite to sulfate is neutralized/stabilizea with lime and fly ash ana trucked one mile to a landfill site. An unlinea landfill is used for all sludge disposal sites. except for the lime dual alkali ana MagLime processes where the site is linea with an impermeaole memorane. The average lanafill depth is 30 feet.
Aaaitional criteria ana guiaance for solids disposal are availaole from EPRI
(4) *
I
3-14
ECONOMIC DESIGN CRITERIA
The economic criteria for all evaluated FGD processes were standardized to
provide consistent economic comparisons. The cost development and breakdown
follow EPRI Economic Premises (included in Section 4 as drawn from the 1989
TAG), and are based on January 1990 dollars with a January 1, 1990 plant
startup.
The base case plant net output shown in Table 3-4 does not account for the
varying quantities of steam and power consumed by each FGD process. The steam
and power requirements draw energy from the boiler, which would otherwise be
included in the net output of the plant. Consequently, adding the FGD steam
and power usage to the base case heat requirements reduces the net MW output
of the plant. However, accounting for this energy consumption by only
reaucing the net plant NW will not result in a change in the levelirea cost in
terms of S/ton of SD2 removed. Therefore, steam and power usage is
reflectea only as a airect cost to the plant (50 mills/kwh ana S2.85 -
$5.30/1000 lbs steam aepending on its pressure). No reouction in net plant
power output is assumed for the cost calculations.
None of the capital and operating costs for the particulate removal process
have been incluoed in the FGD system economic analysis. Only costs for
required ESP or FF modifications are included. A cold-side ESP (560 SCA) is
assumed to operate upstream of the wet FGD systems (and downstream of the dry
FGU systems) to ensure that NSPS for particulate are met and that the ash
loading of the flue gas stream entering the scrubber system is held to an
acceptable level. A reverse gas fabric filter has been assumed to operate :
downstream of the absorber for the lime spray oryer (LSD) FGD system only. No
cost differential for this FF has been assumed in the LSO cost estimate.
Capital Estimate Sumnary
The oases ana items includea for each component of the capital estimate are
summarizea in the following sections.
Process Capital. Process Capital is the total constructea cost of on-site FGD
ana relatea facilities, including direct and indirect construction COStS.
3-15
Table 3-8 is a listing of those items included in the estimate of process
capital. FGD system capital cost components are listea in Table 3-9.
The equipment size is determined from mass balance aata developea for each FGD Process. Quotes were obtainea from three or four biaaers for all major pieces
of equipment. Prices were then cross-checked with a national computerired
material cost tracking network. bulk quantities ana installation labor charges were developed for each equipment item over a wiae range of Sizes to
arrive at installation factors for each piece of equipment. Laoor manhours
were adjusteo for local proouctivity rates (Kenosha, WI for the base Case).
The process capital estimate is broken down on an area oasis for each
process. All processing areas are not applicable for each process, but some
are comnon to all Drocesses. The cost areas are listed in Table 3-10.
General Facilities or Off-Site Capital. The general facilities include roads.
office buildings, shops, laooratories, etc. EPKI guidelines for this cost
item are a 5 to 20% share of the process capital cost. A value of 10% of the
total process capital was chosen for this study.
Engineering ana Home Office Fees. An estimate of engineering, home office
overhead and fees is included for costs representative of this type of plant.
EPKI guidelines for this cost item are 10 to 15% of the process capital for
this cost. A value of 10% was chosen for this stuay.
Project Contingency. Project contingency covers additional equipment or other,
Costs which would result from a more aetailea oesign. Project contingency '
factors will be based on the EPKI Class Ill cost estimate guidelines (10 to
20%) and applied on an area-by-area oasis. Higher contingency factors will oe
applied to those equipment items of special aesign, and lower factors to those
capital purchases that are standard, off-the-shelf items. In general, a value
of 15% will be usea for all standard equipment.
Process Contingency. A process contingency is applied to a new technology in
an attempt to quantify the design uncertainty and cost of a conxnercial-scale
system. The contingency is relatea to the level of process development. The
process contingencies are expressea as percentages of the area process Capital
3-16

TABLE 3-8
ITEMS INCLUDED IN PROCESS CAPITAL COST ESTIMATE
Earthwork Concrete buildings and Structures Process Equipment Piping Electrical Painting Instruments and Controls Insulation Oirect Field Labor Indirect field Costs
Payroll Taxes Insurance, Bonds Construction Supplies Temporary Facilities Construction Equipment Vendor Fees
TABLE 3-g
FGD SYSTEM CAPITAL COST ESTIMATE COHPONENTS
Capital Investment
Process Capital (includes sales tax) General Facilities Engineering and Home Office Fees Project Contingency Process Contingency
Total Plant Cost, TPC Total Cash Expended, TCE AFDC (Allowance for Funds During Construction) Total Plant Investment, TPI
Koyalty Allowance Preproauction Costs Inventory Capital Initial Catalyst and Chemicals Land
Total Capital Kequirement, TCK (Capital investment Jan., 1990, Startup Jan., 1990)
A
c"
E" = A+B+C+D+E ;PC x Adjust factqr*
= TCE + F G H
: K fP
l Adjustment Factor for TCE per taole 3-4 of EPKI TAG (P6587-L. Keprinted in Section 4 of this report)
3-17
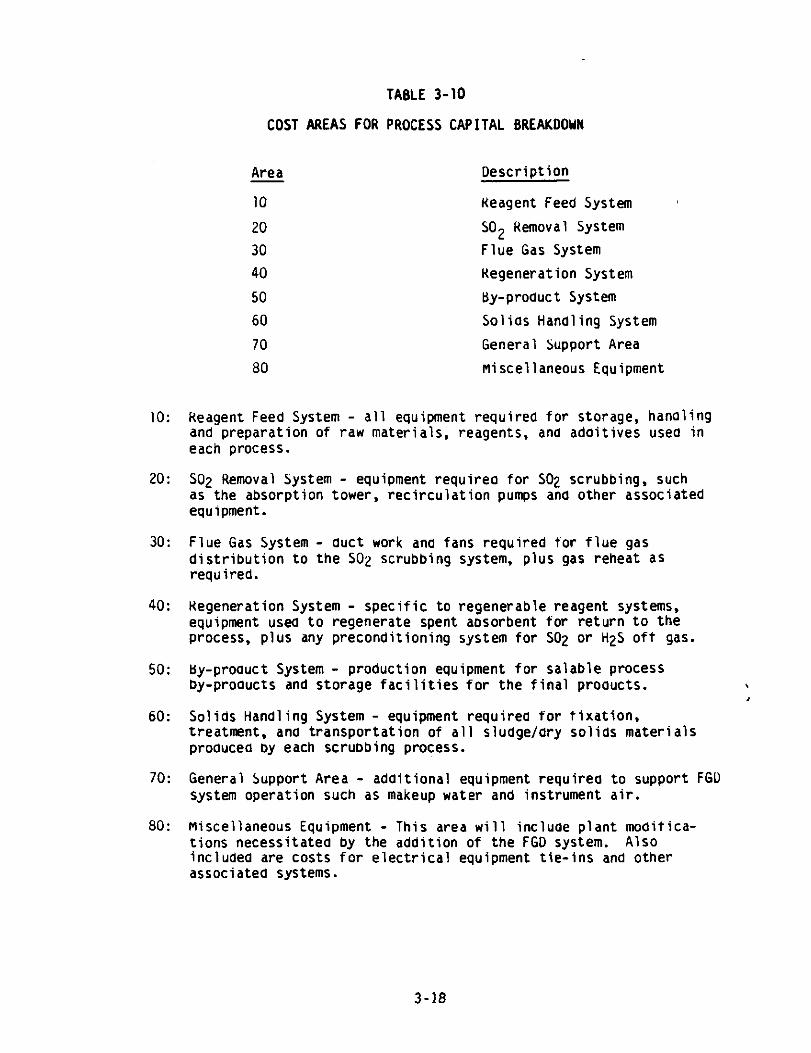
TABLE 3-10
COST AREAS FOR PROCESS CAPITAL BREAKDDYN
10:
20:
30:
40:
50:
60:
70:
80:
Area Description
10 Keagent Feed System
20 SO2 Removal System
30 Flue Gas System
40 Kegeneration System
50 by-product System
60 Solids Handling System
70 General Support Area
a0 miscellaneous Equipment
Keagent Feed System - all equipment required for storage, hanaling and preparation of raw materials. reagents. ana adaitives used in each process.
SO2 Removal System - equipment requirea for SD2 scrubbing, such as the absorption tower, recirculation pumps ana other associated equipment.
Flue Gas System - duct work ana fans required for flue gas distribution to the SD2 scrubbing system, plus gas reheat as required.
Hegeneration System - specific to regenerable reagent systems, equipment useo to regenerate spent aosorbent for return to the process, plus any preconditioning system for SD2 or H2S off gas.
by-proauct System - production equipment for salable process by-proaucts and storage facilities for the final proaucts.
, Solids Handling System - equipment requirea for fixation. treatment, ana transportation of all sludge/dry solids materials proaucea oy each scruobing process.
General Support Area - additional equipment requirea to support FGD system operation such as makeup water and instrument air.
Miscellaneous Equipment - This area will incluae plant moditica- tions necessitated by the addition of the FGD system. Also includea are costs for electrical equipment tie-ins and other associated systems.
3-18
costs. basea on EPHI guiaelines. 2 to 50% factors will oe appliea to the
total capital investment requirement for each cost area. Since some FGD-
systems utilize conanon equipment in some areas and new, untested designs in
others. the process contingency is applied by cost area. Generic reagent
handling systems would receive a low process contingency, while a new
regeneration system tested only at the pilot plant level would receive a
high process contingency within the same process cost estimate.
Sales Tax. Sales tax is included in the process capital estimate.
Total Plant Cost (TPC). The total plant cost is the sum of the process
capital, general facilities. engineering and home office fees, and
contingencies.
Royalty Allowance. The royalty allowance was established by EPRI at 0.5
percent of the process capita\.
Preproauction Costs. Preproauction costs are intended to cover operator
training, equipment checkout. major changes in plant equipment, extra
maintenance, ana inefficient use of materials auring plant startup.
Preproauction costs are estimated as follows:
. One-month fixea operating costs (operating and maintenance labor, administrative ana support labor. ana maintenance materials).
b One-month of variable operating costs at full capacity (chemicals, water, and other consumaoles, ana solios disposal charges). Full Capacity estimates of the variable operating costs will assume
,
operation at 100% loaa.
b Two percent of the Total Plant Investment. TPI (to cover expected changes and modifications to equipment required to bring the FGD system up to full capacity).
Inventory Capital. The inventory capital includes the value of raw materials
ana other consumables on a capitalized basis. The inventory capital is
estimatea using the raw material supply based on 100% capacity operation
during 60 aays.
3-19
Initial Catalyst and Chemicals. The initial cost of any catalyst or chemicals
contained in the process equipment is included. Those materials in storage
are included in inventory capital.
Allowance for Funds During Construction (AFDC). The schedule for engineering,
procurement, and construction of a 300 Mw Wet FGD system is assumed to be two
years for installation of the entire system. The Total Plant Cost (TPC) is
given in January, 1990 dollars. For an escalation rate of 5% per year, the
TPC is multiplied by 0.0548 to calculate the allowance for interest expenses
during a two year construction period.
Total Cash Expended (TCE). The total cash expended is an estimate of the
total cash expended over the construction duration of the FGD system. The TCE
includes only the escalation up to various dates of expenditures and does not
include the AFDC.
Total Plant Investment (TPI). The total plant investment is the sum of the
total cash expended and the allowance for interest during construction.
Total Capital Requirement (TCR). All capital necessary to complete the
project including AFDC. raw material inventory, royalties and preproduction
casts.
Land. FGD system land requirements include the plant site area and disposal
area. Land has not been included as a separate line item. Land requirements
are similar for wet processes as a group and for dry processes as a group. 1
Land costs will vary with site location.
Operating Cost
Operating costs for the FGD systems are separated into fixed and variable operating
costs. Fixed operating costs include operating and maintenance labor. maintenance
materials, and administrative/support labor. Factors for these costs are based on
EPRI Economic Premises. Variable operating costs include consumables such as fuel,
water, power, chemicals, and solids disposal. Table 3-11 sumnarizes the criteria
used for these operating costs.
3-20
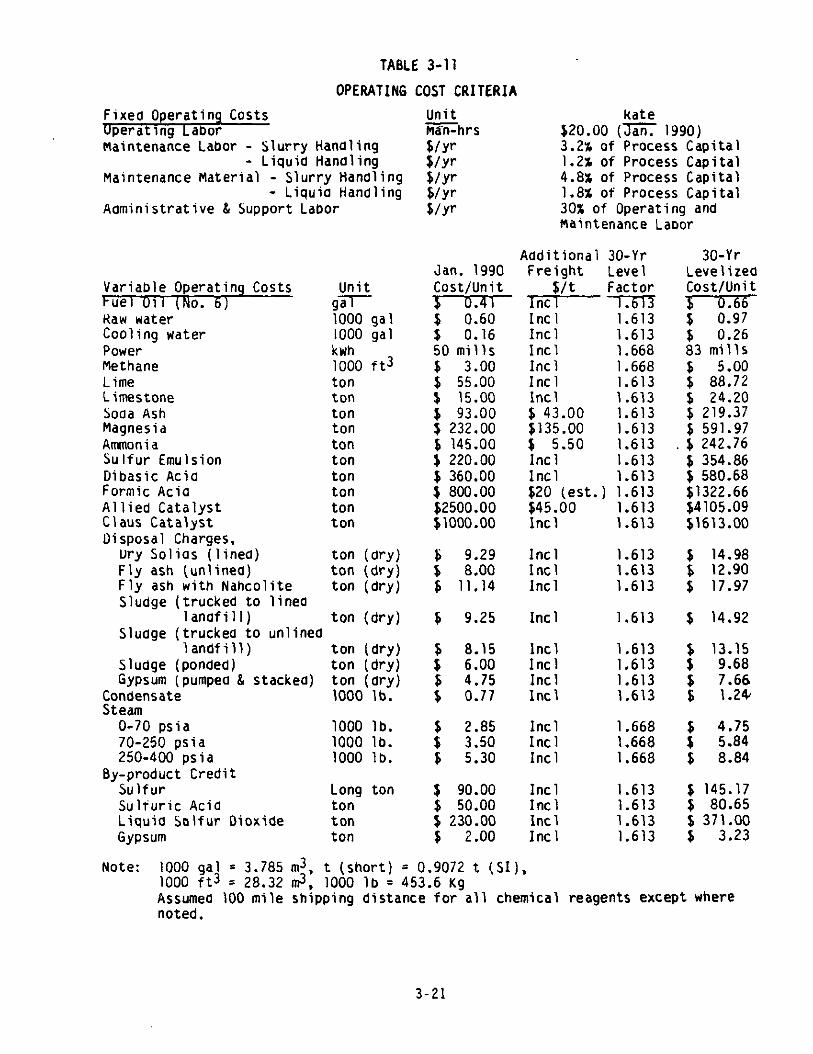
TABLE 3-11
OPERATING COST CRITERIA
Fixed Operating Costs Operating Labor Maintenance Labor - Slurry Hanaling
- Liquid Handling Maintenance Material - Slurry Handling
- Liquia Handling Administrative & Support Labor
Variable Operating Costs Fuel Oil (N 0. Kaw water Cooling water Power Methane Lime Limestone Soda Ash Magnesia Ammonia Sulfur Emulsion Dibasic Acia Formic Acia Allied Catalyst Claus Catalyst
ton (dry) ton (dry) ton (dry)
Disposal Charges, ury Solias (lined) Fly ash (unlined) Fly ash with Nahcolite Sludge (trucked to linea
landfill) ton (dry) Sludge (truckeo to unlined
landfill) ton (dry) Sludge (ponded) ton (dry) Gypsum (pumpea & stacked) ;;;D(y;y)
;;Z;;nsate
O-70 psia 1000 lb. 70-250 psia 1000 lb. 250-400 psia 1000 lb.
By-product Credit Sulfur Long ton Sulfuric Acia ton Liquid Solfur Dioxide ton Gypsum ton
Unit salr 1000 gal 1000 gal kwh 1000 ft3 ton ton ton ton ton ton ton ton ton ton
Unit Khrs
;:::
Rate $20.00 (3an. 1990) 3.2% of Process Capital 1.2% of Process Capital 4.8% of Process Capital 1.8% of Process Capital 30% of Operating and Maintenance Laoor
Aaditional 30-Yr Jan. 1990 Freight Level Cost/Unit s/t Factor 3 .
I% -l-m-3
1.613 S 0.60 S 0.16 50 mills $ 3.00 $ 55.00 $ 15.00
: 293:'oooo $ 14s:oo $ 220.00 6 360.00 $ 800.00 $2500.00 $10Do.00
Incl 1.613 Incl 1.668 Incl 1.668 Incl 1.613 Incl 1.613
~14335% 1.613
$ 5:50 1.613 1.613
Incl 1.613 Incl 1.613 ",a; ;"ost.) 1.613
Inci 1.613 1.613
$ 9.29 $ 8.00 5 11.14
6 9.25
$ 8.15 $ 6.00 6 4.75 $ 0.77
$ 2.85 $ 3.50 5 5.30
lncl 1.613 Incl 1.613 Incl 1.613
Incl 1.613
lncl 1.613 Incl 1.613 Incl 1.613 Incl 1.613
Incl 1.668 Incl 1.668 Incl 1.668
Incl 1.613 Incl 1.613 Incl 1.613 Incl 1.613
30-Yr Levelizeo Cost/Unit
83 mills
$ 242.76
S 1.24
$ 4.75 f 5.84 $ 8.84
$ 145.17 $ 80.65
Note: 1000 gal = 3.785 m3, 1000 ft3
t (short) = 0.9072 t (SI), = 28.32 a?. 1000 lb = 453.6 Kg
Assumed 100 mile shipping distance for all chemical reagents except where noted.
3-21
Levellzed Cost
The capital and operating costs determinea for each FGD system are convertea to a
levelizea cost using a tjxea charge rate for capital costs, and appropriate
levelization factors for operating costs. Leveliration factors for processes
evaluated over a 30-year service life are listed in Table 3-11. Levelization
factors for 15-year service lives are 1.371 for labor and other variable operating
costs with the exception of power and steam (L.F. = 1.4). A tixea charge rate
Specific to the plant life and discount rate assumed is multiplied times the total
capital requirement to determine the capital charges for inclusion in the levelizeo
Cost estimate. Both constant and current dollar totals are presented in each
case. The total levelizeo cost of each FGD system is presented as mills/kwh,
$/kM-yr and in terms of $/ton SO2 removed.
3-22
References:
1. "Tkhnical Assessment Guide: Volume 1: Electricity Supply 1989," EPRI Report No. P-6587-L. Revision 6 (September 1989).
2. "FGD Economic and Design Factors," EPRI Report No. CS-1428 (April 1980).
3. "FGD Sludge Disposal Manual." EPHI Report No. CS-1515 (September 1980).
3-23
Section 20
%irPol GAS SUSPENSION ABSORBER (GSA)
SYSTEN DESCRIPTION
The AirPol Gas Suspension Absorber (GSA) FGO system is a dry, throwaway process. The evaluation presented in this section is done on the basis of a retrofit plant
with an expected 15-year service life. The AirPol GSA is intended for retrofit
as well as new plants.
In this system, hot flue gas enters a venturi-shaped bottom of a vertical reactor where it contacts a mixture of suspended solid particles, made up of hydrated lime reagent, fly ash and recycled reaction products. Fresh lime slurry is
sprayed directly into the suspended bed of particles. The water in this slurry humidifies the flue gas to improve SO, removal efficiency. Humidification would
also improve downstream ESP performance due to conditioning of the flue gas. A relatively high gas velocity (24 fps compared to wet FGD towers operating at 9-10
fps) is required 'to fluidize and convey the solids in the reactor, further promoting SO, reaction with the lime solids. The spent solids and fly ash are
carried out of the top of the absorber and 99% of the solids exiting the reactor are collected in a cyclone. Most of the solids collected in the cyclone are recirculated back to the system to achieve greater sorbent utilization. The remaining solids in the flue gas are captured downstream in the ESP. These waste solids are transported to a landfill for disposal.
PrOCeSS DeSCription
A moving fluid bed is created in the GSA reactor by flue gas flowing upward
through a suspended bed of fine-grained solids. Unlike a classical fluidized bed where the particles retain a top horizontal surface within the reactor, the gas velocity is high enough to carry the solids out of the reactor where they are then largely captured, and reintroduced to the reactor. By this mechanism, the solids may be rewetted providing a large reactive surface.
20-I
The classical fluidized bed was first used in the 1920's for coal gasification in the Winkler generafor. Industrial applications of the circulating fluid bed (CFB) began in the 1960's, where it was initially used for alumina calcination
in the aluminum industry. "Gas suspension absorption" or GSA was first developed in Europe as a method to calcine limestone for use in cement production. When used in power plant applications, the GSA process shows the potential to combine some of the economic benefits of lime spray dryers with sulfur dioxide removal efficiencies close to those of wet scrubbing processes (i.e., greater than 95%
removal capability).
In the AirPol GSA system, there are several process parameters which promote high desulfurization efficiencies. One parameter is the very large concentration of fly ash, reaction products, and unreacted lime that build up inside the reactor. This concentration will normally be as high as 500-1500 g/Nm3 (200-800
grains/acf) which is 50-100 times as much as would be present in a conventional spray dryer. The advantages of this high concentration of solids in the reactor is two fold; (1) it enables rapid evaporation of the water from the lime slurry coating the surface of each particle; (2) it prevents solid build-up on the reactor walls, avoiding a common problem for spray dryers. Another parameter is the relatively long time the reagent solids are in contact with the flue gas. This is achieved by recycling the lime particles through the absorber up to 100
times.
Chemistry and Criteria
Raw lime (in pebble form) is slaked with an excess of water to form a calcium hydroxide slurry, by the following reaction:
CaO + H,O d Ca(OH), (20-l)
For the base case evaluation, the flue gas enters the gas suspension absorber at 277-F. The slaked lime slurry is injected into the reactor through a dual-fluid nozzle in the venturi throat. As the flue gas flows up through the reactor, it mixes intimately with the lime reagent to form calcium salt reaction products
according to the following equations:
tiw\EPf!AAIwoL.20 20-2
Ca(OH), t SO, --* CaSO, * jH,O + iH,O (20-2)
Ca(OH), t SO, t& t H,O --* CaSO, . 2 H,O (20-3)
Ca(OH), t SO, t H,O --* CaSO, . 2 H,O
The predominant sulfation reaction in the absorber is Equation 20-Z. producing
hydrated calcium sulfite. As the sorbent particles pass through the system, some of the unreacted lime reacts with the carbon dioxide and hydrogen chloride in the flue gas to form calcium carbonate and calcium chloride:
Ca(OH), t CO, + CaCO, + Hz0 (20-5)
Ca(OH), t 2HCl -9 CaCl, + 2H,O (20-6)
The spent sorbent, unreacted reagent, and fly ash exiting the GSA reactor are collected downstream by a cyclone-type collector and ESP or Fabric Filter.
Table 20-I sumnarizes the specific process design criteria developed for the economic evaluation of the AirPol GSA process.
Process Oesian
The AirPol GSA systemwill be discussed according to Figure 20-l in the following
order:
0 Reagent Feed System, Area 10
l SO, Removal System, Area 20
0 Flue Gas System, Area 30
0 Solids Handling System, Area 60
0 General Support Equipment, Area 70
0 Additional Equipment, Area 80
Equipment listings for each area are given at the end of this section.
n*vAEPfu\*,wOL.20 20-3
Table 20-l +irPol 6AS SUSPENSION ABSORBER (6SA)
PROCESS DESIGN CRITERIA*
Flue Gas Handlina Area Criteria Flue aas flow rate** GSA piessure drop Mechanical collector pressure drop Duct and chimney pressure drop Total system pressure drop (including
mechanical collector) Flue gas temp.(air heater outlet)** Approach to adiabatic saturation
temperature
a, Removal Area Criteria SO, removal (2.6% S Coal)** Absorber - type
- capacity** Gas residence time in absorber Gas velocity in absorber Slurry water injection - type
- air pressure Mechanical collector - type
- capacity Total solids recycle
Interstitial water retained by solids
Reaaent Feed Area Criteria Reagent - purchased
- absorber feed Lime storage silo capacity** Lime feed bin capacity** Slaking system - type
- capacity**
Reagent feed rate
Solids Handlina Area Criteria Solids silo capacity (total)** Sulfite/sulfate mole ratio
General Suooort Area Criteria Makeup water tank capacity**
1,020,OOO ACFM @ 277°F 5.6 in..H,O 3.4 in. H,O 1 in H,O 10.0 in. H,O
277'F
18'F
90% Gas suspension absorber : y FX;capacity (2 op, 1 spare)
2i ft/sec Dual-fluid nozzle 100 psi Separating Cyclone 6 F 25% capacity (4 op, 2 spare) 0.067 lb solids
Ft' Flue Gas Less than 1%
Pebble lime (10% inerts) Lime slurry 60 days 30 hours Detention Slaker 3 @ 50x capacity (2 op. 1 spare) 1.30 moles Ca in feed
mole inlet SO,
3 days 4/l
30 min
*For one 300 MU unit **Identical for all processes evaluated
20-4

) / 1 \a- / - - Y-L 1 t-@-,
L I l E
i s
27
p c e c
E b:
n*w\EPRhAlmL.aa 20-5
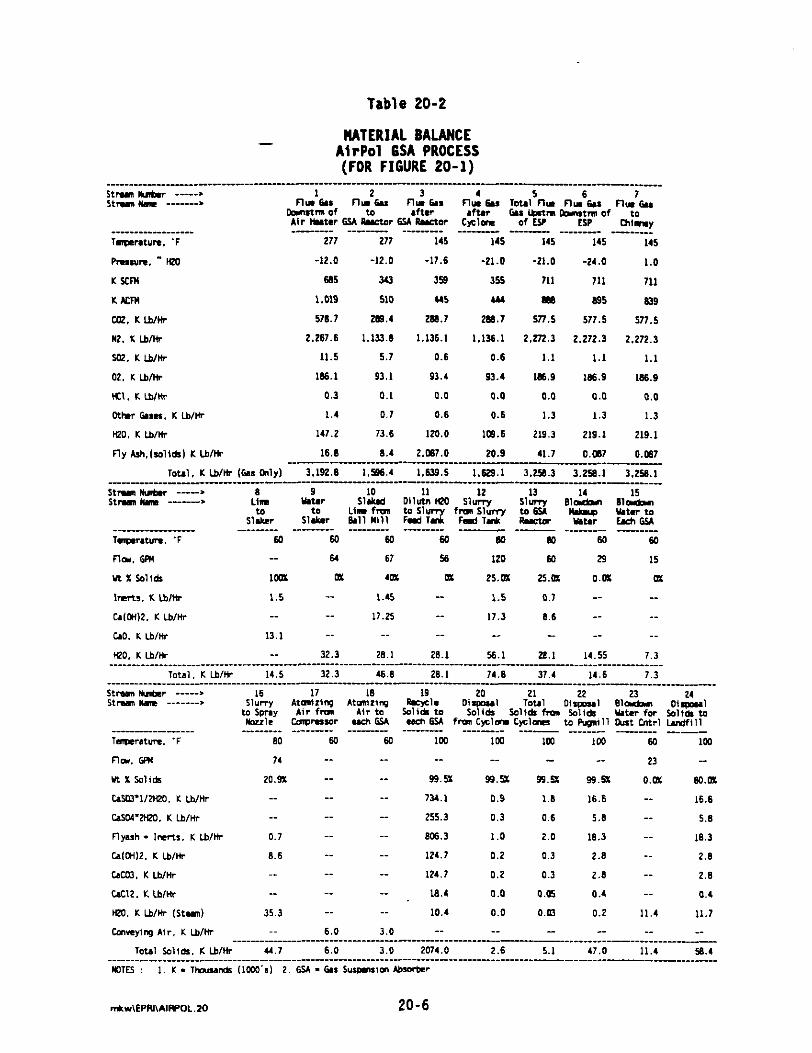
Table 20-2
MATERIAL BALANCE - AirPol 6SA PROCESS (FOR FIGURE 20-l)
____________________~~"~~~~"""~~~~~~~-"~~~--------""-----------------~~~~~~~--~"""~~~~~~~~~"~~~~ strun bJbr -----* 5 St- m ____"_", nu'641 "C6u
Dpnrtm Of :i: n*'ba Mr later by 6Lr 664 btctm
f&4 Tot.1 nu nuD66.. Cjclme 6I~‘ktgm ";s Of c&y -"_-_"__-""-"""__" _- ----- ---- ---_ -___ --__- --___ _________ ______
Tmprrtun. 'F 277 277 145 145 145 145 1‘S
Prawn. - wo
Kscnl
Kuml
C02,KWlh
"2. K Wk
302. K WHr
02. K WM
K1. K we
othr 6om. K WM
wzo. K wlk
-12.0 -12.0 -17.6
6a6 343 36s
! ,019 510 US
576.7 zap., 268.7
2.267.6 1.1X3.6 1.136.1
11.6 5.7 0.6
166.1 93.1 a.,
0.1 0.1 0.D
1.4 0.7 0.6
w.2 73.6 120.0
-21.0 -21.0 -2,.o 1.0
355 711 711 711
444 as 665 a36
269.7 s77.5 577.5 577.6
1.136.1 2272.3 2.272.3 2.272.3
6.6 I.1 1.1 1.1
63.4 166.9 166.9 L66.6
0.0 0.0 0.0 0.0
6.6 1.3 1.3 1.3
109.6 219.3 216.1 219.1
flykh.kdidrlKWM 16.6 6.‘ 2.687.0 to.9 41.1 o.m7 0.067 __---""____-___-_~~"________________I___~~~~~~~~~~ Tot.,. K Wlh (Gas MyI 3.162.6 1.596.4 1.6x9.6 1.629.1 3.2fA.3 3.250.1 3.2yl.l
__________________I_~-~~"-"------------~---------------"---------"----~~--~-"--- St- eJ!ter --"") I1 St- h -----. km 247 51&l tvltin Ko Sl& &
s&7 s,L Lllnftm toSlurry fmn6lmy tc.6F.t
6&a& ,lm!km
6BllWlll FdTu* FdTu* - Yltu z2.i ““______________ ““-“-- ------- ““I”_ -------- ---- _- ““_____” ____ Tmr.tYm. ‘F 64 w 50 60 6D 0 50 64
F-l-. 6Fn “” 64 67 56 120 M 29 15
w x solids *WI m 404 m 25.m 25.Ds 0-m ox
Imt¶. K WHr 1.6 - ,.a -- 1.5 0.7 -- ""
DlM)P. K lbmr "" _" 17.25 -- 17.3 6.6 -- _"
00. K WHr 13.1 -- "_ _" "" "" __
.tPO:LLb!M "_""__""""" """""_""-_" 1: ""-_""-- "Et _""""""_ ?l! """"_"" "E! -"""--"" ?!- "___ 8.1"""" !!E" "__"_ I11 Tot.,. K WHr 14.5 32.3 46.6 26.1 74.6 37.4 M.6 7.3
____________________"""""""""-"~"~~~""-"---"~~~""-~"-------"-"-----~~~--"~"~~""~~~~"~~~~~""~~" %nm lbdmr -----a St- m __"_"__, Atanizing AbYMZlrq
'SEY eachby frmCSlrn cyc1crn to fugnil I*lt tnrl bdflll
""""_"-"_-_"""_ """""_""" ------- ""-- ----""-I -------- ""-- ______"" ______ _____ hlFeratum. ‘F 60 64 60 1m lrn ,m Irn 60 lrn n.m, GRI I, -- “” “” “_ “” 23 -
ti 1. salldr 20.9x -- _" 99.6K 93.n WA.% 99.5x 0.0x 6D.m
C.yU'GW!O. K Wh "" "" _" 734.1 D.9 1.6 16.6 -- 16.6
cdsw2tm. KWHr "" "" "" 255.3 0.3 0.6 5.6 -- 5.6
Flyash + hl"t6. K lb/Mr 0.7 -- _" 606.3 1.D 2.0 16.3 -- 16.3
OlMl2. K WHr 6.6 -- _" I2‘.7 0.2 0.3 2.6 -- 2.6
CACDJ. K WM ." "_ _" I2,.7 0.2 0.3 2.6 -- 2.6
c&,2. K wlk "" "" "" 16.4 0.0 0.05 0.4 -- 0.4
WD, K WHr (St4 35.3 -- __ 10.4 0.0 0.m 0.2 II., II.7
CmnyinQ Air. K WM 6.0 3.0 -- "" "" _" _" _______________-"-"-"""""""""~""""~"~--""-"""""-"~~~~~"~~"~"~""""""-""~""""""~~
______ !E!!"?!!~l"LLb!!!: _______ !!:I _____""_" !! _"""_""" 50 """""_ IO!!! ""_""""_" fr! "__""" %' 17.0 11.4 56.4 - """""""""" -- _"______
mm : 1. K . ThaIa,* llom'.l 2. 6% - br 6"*pnncn 4bsarhr
n+w\EPRI\AIIPOL.2O 20-6
The capital and operating costs for the ESP have not been included in the FGD
system economic analyzs. However, the cost for the mechanical cyclone collector installed at the absorber outlet is included. An existing cold-side ESP 1s assumed to operate downstream of the FGD system and that it is adequately sized to ensure that the preretrofit particulate emission rate is maintained. All of the fly ash and reaction product solids collected in the ESP are conveyed
pneumatically to the solids disposal silo for storage, then transported by truck to the landfill disposal area.
Reaoent feed system, area 10.
0 Reagent storage and handling - The lime is delivered by rail car in the form of pebble lime.. The pebble lime is discharged into two below-grade hoppers. The hoppers are pneumatically unloaded, and the contents stored in two bulk storage silos (total capacity of 60 days). The storage silos are fabricated of concrete and are water- and air-tight. The silos are equipped with baghouse dust collectors capable of handling all of the transport air flow from the pneumatic systems. The lime is pneumatically conveyed from the bulk storage silos to two day bins (total capacity of 30 hrs.). The bins are equipped with bag filters designed to handle the exhaust conveying air.
a Feed preparation and storage - From the day bins, the pebble lime is gravimetrically conveyed to one of three 50% capacity detention slakers. The pebble lime entering the slaker contains 10% inert material. Blowdown water is introduced which hydrates the pebble lime; the unreacted materials are removed from the bottom of the slaking tank by a traveling grate and discarded with the FGD solids materials. The slaked lime, Ca(OH),, exiting the slaker flows to an agitated lime slurry feed tank (E-hr capacity) where it is diluted with blowdown water to 25 percent solids and allowed to stabilize. The slaked lime slurry is then pumped to the dual fluid nozzles at the base of each reactor.
SO. removal system. area 20.
l The SO, removal system for this evaluation includes three venturi-entry GSA reactors, each capable of handling 50% of the total flue gas flow. This allows two reactors to be on line at 100% boiler load while the third is on standby or undergoing maintenance. Each reactor is sized to have a gas retention time of 3.1 seconds.
. The slaked lime slurry is mixed with additional water and is then injected into the base of each operating reactor via an injection lance assembly. For this design, the reagent ratio is assumed to be 1.30 moles CaO required per mole of inlet SO, to achieve 90% SO, removal efficiency. A single dual fluid nozzle located in the center of each reactor disperses the slurry as a ~spray of fine droplets. The injection lance can be withdrawn and serviced during normal operation without loss in SO, absorption efficiency due to the large excess of reagent solids present in the fluid bed. This normal maintenance service is done once per week and takes 5-10 minutes.
n*wwTmAIPPOL.m 20-7
Compressed air (at 100 psig) is used to shatter the slurry droplets exiting the nozzles, producing fine droplets which will evaporate quickly in the reactor. The compressed air is supplied by one of two centrifugal air compressors (one operating and one spare). The feed rate of lime slurry is automatically controlled by the outlet SO, concentration and as a function of percent SO, removal required. The flow of additional water to the nozzles is regulated to maintain the outlet flue gas temperature at approximately 18-F above the flue gas adiabatic saturation temperature. The humidification enhances SO, removal efficiency and conditions the flue gas for better ESP performance.
Flue gas enters the bottom of the reactor at 277'F. The solid reactant particles flow upward, concurrently with the flue gas. In the reactor, the lime hydrate particles react with the SO, and SO, in the flue gas to form the product salts. The product salts, fly ash and unreacted lime discharge from the top of the reactor along with the flue gas.
The solids are separated from the flue gas by two cyclone mechanical collectors located at the exit of each reactor. The cyclones remove approximately 99% of the solids from the gas. Approximately 99% of these solids are recirculated back to the reactor. The amount of solids returned to the reactor is controlled via a mechanical screw feeder located in the bottom of a feeder box. A second conveyor located at the top of the feeder box removes excess solids from the system (approximately 1%) which are then sent to the disposal silo.
The recirculated solids enter the reactor just above the point of lime slurry injection. The particles are coated with lime and provide a large surface area for SO, absorption. In addition, unreacted lime is returned to the fluid bed from the solids collected by the cyclone for optimum utilization of the reagent.
The gas leaving the cyclone continues to the ESP (or FF) where most of the remaining solids are removed. For a new plant, the selection of a new particulate removal device (baghouse or ESP) can be made independently of the required SO, removal efficiency since SO, removal in the particulate collection device is relatively low.
Flue aas system. area 30.
0 The flue gas exits the air preheater at 277-F and flows to the GSA reactors. In the absorbers the gas is humidified and reacts with the reagent particles. The particle-laden flue gas exits the absorber at 145-F. The absorber causes an increase in pressure drop of about 5.6 inches of water. An additional pressure drop of 3.4 inches of water also occurs across the cyclone separators installed at the reactor outlet.
0 A bypass system around both the GSA reactor and cyclone particulate collection system is included for plant startup or emergency shutdown. ID/booster fans located between the ESP and stack operate in parallel to maintain sufficient pressure to overcome the pressure loss from the FGD system and additional duct.
ti..\EPR,\A,IIP0L.20 20-E
l The cost to install six inches of additional insulation have been included as ESP modificat4ons to prevent the temperature of the gas in the ESP from dropping below the saturation temperature, which could result in condensation due to the increased water vapor downstream of the GSA reactors.
Solids handling system. area 60.
l Approximately 1% of the solids collected in the cyclones is combined with solids removed from the ESP hoppers and pneumatically conveyed to the disposal silos. It was assumed that the existing ash handling system would be demolished due to insufficient capacity and/or wet sluicing operation. A new positive pressure pneumatic conveying system is used to transfer the solids from the particulate collector to the storage silos. A new silo was included in the estimate to handle the incremental solids capacity. The product solids are mixed with water in two 67% pugmills for dust control (to about 20x moisture) and loaded into off-highway trucks by either a shuttle loader (belt conveyor) or a front-end loader. The trucks transport the solids to a landfill disposal area located one mile from the plant site. A bulldozer at the disposal area spreads and compacts the material to an average depth of 30 feet. The loading, transfer, and landfill area equipment operate one shift/day, 5 days/week. Disposal rates are presented in Table 20-3.
General SUDDOrt eoUiDment. area 70.
l The AirPol GSA system requires the following support equipment: instrument air compressor, makeup water system, and control room.
Additional eauioment. area 80.
l Additional equipment - Onsite electric power equipment including transformers and grounding that is required to supply electricity to the FGD system.
TECHNICAL EVALUATION
The AirPol GSA process is a relatively new SO, removal technology for a utility
application. However, the successful industrial operation of the GSA in Denmark has demonstrated its potential to become a commercially viable process. As part of the Department of Energy (DOE) Clean Coal Technology Program, the AirPol GSA system has been installed as a IO-MW demonstration unit at the Tennessee Valley Authority's (TVA) Shawnee Power Station.
With AirPol GSA, considerable improvement in the SO, removal efficiency is
obtained compared to most other dry processes. The major differences between the GSA and a typical Circulating Fluid Bed (CFE) design are as follows:
rfwv\EPFlM,~0L.20 20-9
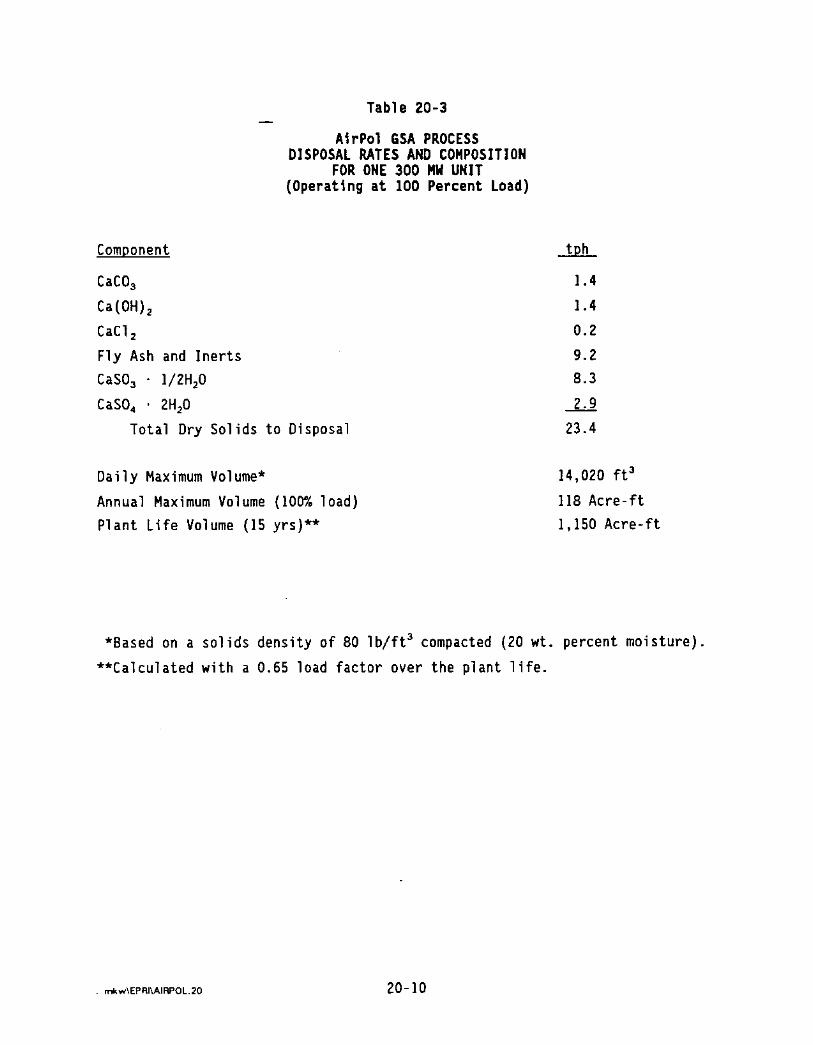
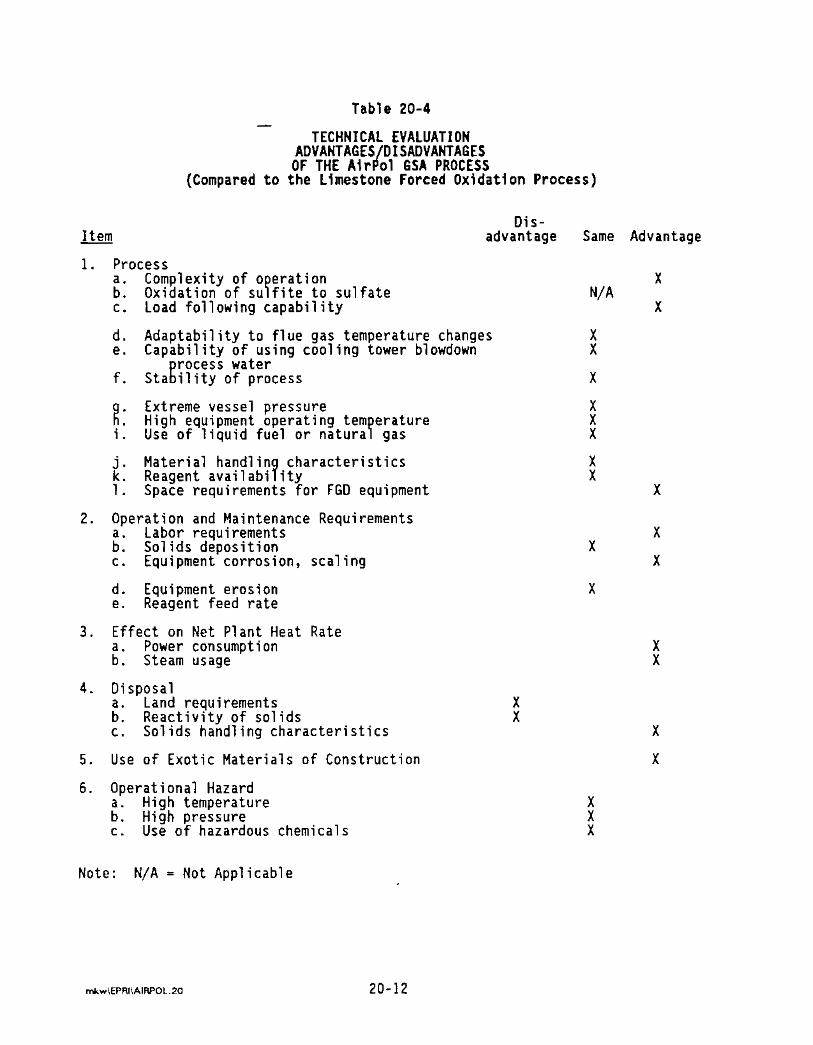
limestone scrubbers (not producing a marketable gypsum byproduct) can generally use ceeling tower water for limestone grinding circuits, and for most other makeup water applications, although, water with high chloride content can also have adverse effect on wet scrubber performance.
l A higher solids recycle rate is required relative to other dry technologies.
a The largest GSA reactor installed to date treats 114,000 ACFH of flue gas, equivalent to approximately 35 MW.
COMHERCIAL STATUS
The GSA technology was developed by FLS Hiljo A/S of Denmark for removing acid gases from the flue gas generated by many industrial processes. The first commercial GSA system was installed on a municipal solid waste incinerator in
Denmark in 1988. This technology is currently being used at several waste
incinerator applications in Europe to remove both HCl and SO, from flue gas. The
largest unit sold to-date is a recent order at an iron pelletizing installation
at LKAE' in Sweden. The GSAs for one pelletizing line will handle a total of 228,000 SCFM. Two reactors will be installed per line, each reactor more than 12 feet in diameter. An installation list is shown in Table 20-5.
As part of the DOE Clean Coal III Technology program, AirPol, Inc., a U.S. subsidiary of FLS Miljo A/S, has built a GSA demonstration plant at TVA's Center
for Emissions Research (CER). The demonstration is being conducted on a 10 MWe
slip stream from a I50 MWe coal-fired boiler at the Shawnee plant near Paducah,
Kentucky. The unit burns a high-sulfur (2.7 percent) eastern bituminous coal. Testing began in November 1992 and ended in late November 1993. The results of the testing includes the following:
'LKAE is the Swedish iron ore processing company: Luossavaara Kirunavaare A8. Luossavaara Kirunavaare in northern Sweden is the world's largest underground iron ore mine.
tiw\EPRI\A,mL.20 20-14

Table 20-5
I~TALLATION LIST FOR AirPol 6SA PROCESS
UNIT AND LOCATION
Kara 14 Roskilde, Denmark
Slagelse Wl Slagelse, Denmark
Seas Stignaes, Denmark
Reno Nord 11 6 2 Aalborg, Denmark
Reno Nord #3 Aalborg, Denmark
Aarhus Nord 13 Aarhus, Denmark
Slagelse #2 Slagelse, Denmark
Kara #I Roskilde, Denmark
Kara #3 Roskilde, Denmark
Shawnee Unit #g DOE/TVA Paducah, Kentucky
San Ying Enterprises, CO Taipei, Taiwan, R.O.C.
LKAE Kiruna, Sweden
Hamilton Hamilton, OH
UNIT SIZE
177 TPD
I44 TPD
15 HW (Pilot Plant)
212 TPD
320 TPD
212 TPD
106 TPD
200 TPD
160 TPD
10 MW Slipstream
100 TPD
( ylr Kg;
50 MW
FUEL TYPE
Waste Incinerator
Waste Incinerator
Coal-Fired Boiler
Waste Incinerator
Waste Incinerator
Waste Incinerator Baghouse
Waste Incinerator
Waste Incinerator
Waste Incinerator
Coal-Fired Boiler
Waste Incinerator
Iron Ore Sintering
Coal-Fired Boiler
FILTER NPB
ESP
Baghouse
ESP
ESP
Baghouse
Baghouse
ESP
Baghouse plus Wet Scrubber
ESP
Baghouse plus Wet Scrubber
ESP
Baghouse
20-15
0 Efficiencies approaching 100% at reagent ratio of I.4 and 5'F approach to saturation temperature. (Additional test results are shown in Figure 20-2.)
l Able to operate at 8'F approach to saturation without build-up.
a No build-up encountered during operation.
l Improved particulate collection efficiency by the installed precipitator compared to other competitive systems.
l High GSA availability.
The project was co-funded by TVA, DOE, and AirPol. This testing marked the first
application of this technology in the U.S.
The AirPol GSA system will also be installed on the 50 HW boiler at the Hamilton station, owned by the City of Hamilton, OH. The GSA process was chosen to allow the Hamilton boiler to burn high sulfur Ohio-mined coals while meeting state and
federal pollution control regulations. The projected start-up date for this
facility is during the third quarter of 1995.
ECONOHIC EVALUATION
For this evaluation, the AirPol GSA FGO process is a dry throwaway system retrofit to a pulverized coal-fired boiler. This process is compared in this section to the commercially developed Limestone Forced Oxidation (LSFO) FGD process retrofit to a similar coal-fired boiler. The base case economic evaluation of the AirPol process is presented in Table 20-7, 20-8, and 20-9. As
stated in the General Design Criteria, the gross plant output is 313 MW, resulting in a nominal 300 MW unit after subtracting out plant auxiliary power, exclusive of FGD energy consumption. Raw material and utility consumptions were
calculated for the AirPol process operating at 100 percent load and are presented in Table 20-6. The FGD system power consumption is addressed only as an operating cost with no reduction in net plant output. Cost sensitivities to various parameters are also presented. These curves were developed by adjusting capital and operating costs with changes in a single input, and re-evaluating the capital and levelized costs. The sensitivity curves are plots of the results for four
additional parameter values, combined with the base case value.
tiw\EPRR*KPOL.m 20-16
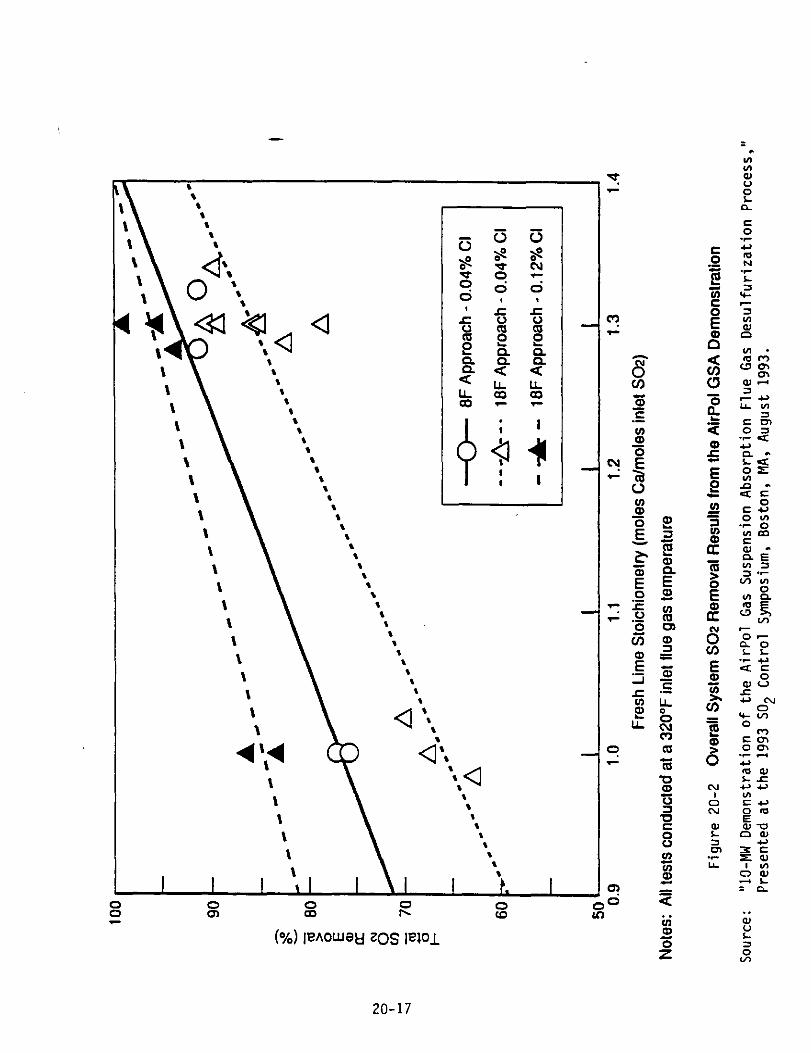
-
L ,
4 ‘,4 \ ‘*,a \ \ \ \ \ \ \ \ \ \ \ \
I \ , I
. I I I
E it? Is2 i? i2 (%I 1e~0u.w 20s leiol
20-17

- Table 20-6
AlrPol 6SA SYSTEM RAW MATERIAL AND UTILITY CONSUMPTION
FOR ONE 300 NH UNIT (Operatlng at 100 Percent Load)
Item Ouantitv
Pebble Lime @ 1.30 Stoichiometric Feed Ratio 7.3 tph
Cooling Tower Blowdown Water 170 gpm
Power (Ooeratina HD and Eauivalent kW Consumed) HD kW
Area 10 - Reagent Feed System 230 Hp (170 kW)
Area 20 - SO, Removal System 330 Hp (250 kW)
Area 30 - Flue Gas System 1,760 Hp (1,310 kW)
Area 60 - Solids Handling System 230 Hp (170 kW)
Area 70 - General Support Equipment 20 Hp (10 kW)
Total 2,570 Hp (1,910 kW)
20-18
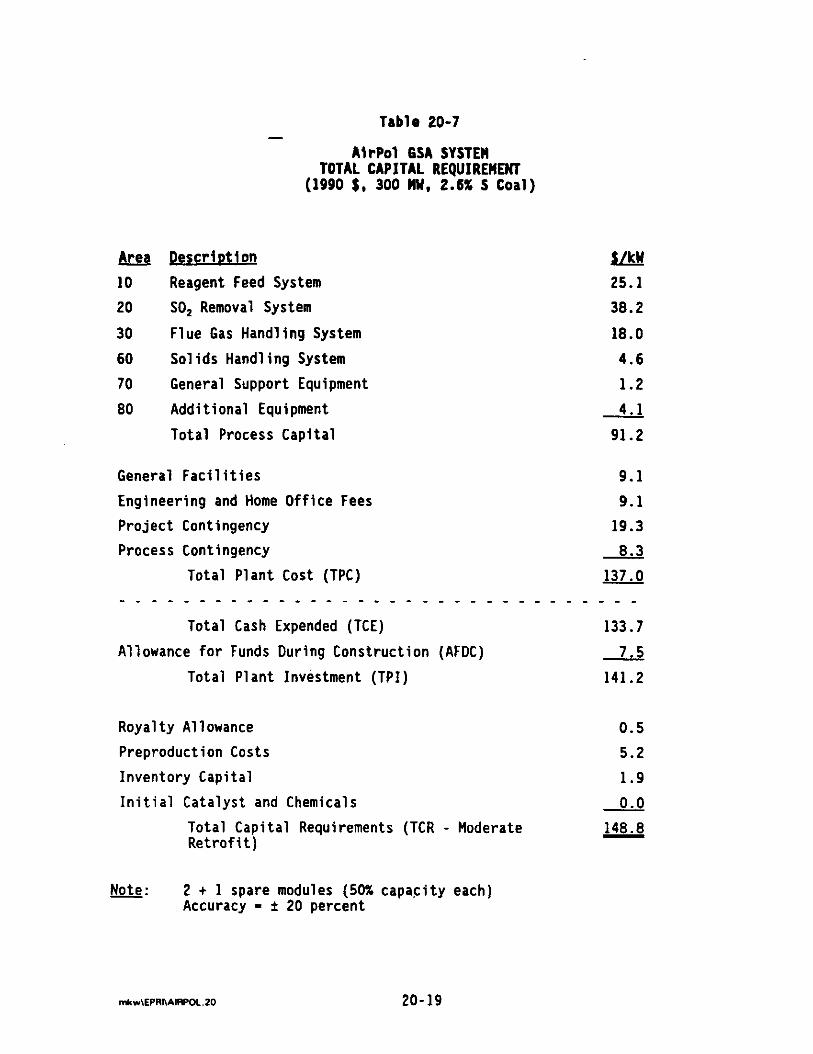
- Table 20-7
&gg
10
20
30
60
70
80
AlrPol 6SA SYSTEN TOTAL CAPITAL REQUIRENENT
(1990 $, 300 NH. 2.6% S Coal)
Description L!!a! Reagent Feed System 25.1
SO, Removal System 38.2
Flue Gas Handling System 18.0
Solids Handling System 4.6
General Support Equipment 1.2
Additional Equipment 4.1
Total Process Capital 91.2
General Facilities
Engineering and Home Office Fees
Project Contingency
Process Contingency
Total Plant Cost (TPC) -__-_--__---_-_- -_-___________
Total Cash Expended (TCE)
Allowance for Funds During Construction (AFDC)
Total Plant Investment (TPI)
9.1
9.1
19.3
8.3
137.0 - - -
133.7
7.5
141.2
Royalty Allowance 0.5
Preproduction Costs 5.2
Inventory Capital 1.9
Initial Catalyst and Chemicals 0.0
Total Capital Requirements (TCR - Moderate Retrofit)
&&: 2 + 1 spare modules (50% capacity each) Accuracy = f 20 percent
148.8
20-19
Table 20-l shows the capital costs for the AirPol system. The overall project contingency for theAirPo1 process was calculated as 14 percent, while the
overall process contingency was calculated as approximately 6.1 percent of the
total plant cost. These values are higher than LSFO due to the lack of large
scale U.S. installations. The weighted average maintenance factor (annual cost of maintenance material and labor) was estimated to be 4.1 percent of the total plant cost fn this evaluation. The total capital requirement represents the
differential cost to the utility for the FGD system, resulting in an estimated capital cost of 149 S/kW for a moderately difficult retrofit situation.
The fixed and variable operating costs are shown in Table 20-E. First-year costs and levelized costs in terms of both constant dollars and current dollars are
presented. Constant dollar analysis assumes no inflation and 0.3 percent real
escalation on power. Current dollar analysis assumes a 5 percent annual
inflation rate and 0.3 percent real escalation on power.
The levelized cost for the AirPol process (Table 20-g) is calculated by the "present worth" method (as defined in EPRI Economic Premises, Section 4), assuming a 15-year plant operating life. The FGD system levelized cost is 7.6 mills/kwh (constant dollars). This levelized cost is the sum of the fixed and
variable operating costs (Table 20-E), plus the cost of capital over the 15-year plant life.
When compared with the limestone forced oxidation process, the AirPol process operating cost differs most in the reagent cost (see Table 20-E). The reagent cost is 2.8 times that of limestone forced oxidation due to the higher lime cost and reagent ratio. However, the higher reagent costs are offset by lower power costs and lack of steam requirement for reheat. Overall, the levelized cost is 20 percent lower than the limestone forced oxidation process.
A comparison of the total process capital for this system with that of Limestone
Forced Oxidation also indicates the major capital investment requirements for both processes are for the SO, absorption equipment. Comparison of the total
capital requirement for both processes indicates that the AirPol process will
require approximately 31 percent less initial investment than a limestone forced oxidation system retrofitted on a 2.6% sulfur coal-fired boiler.
n*w\EPIU\*lwOL.m 20-20
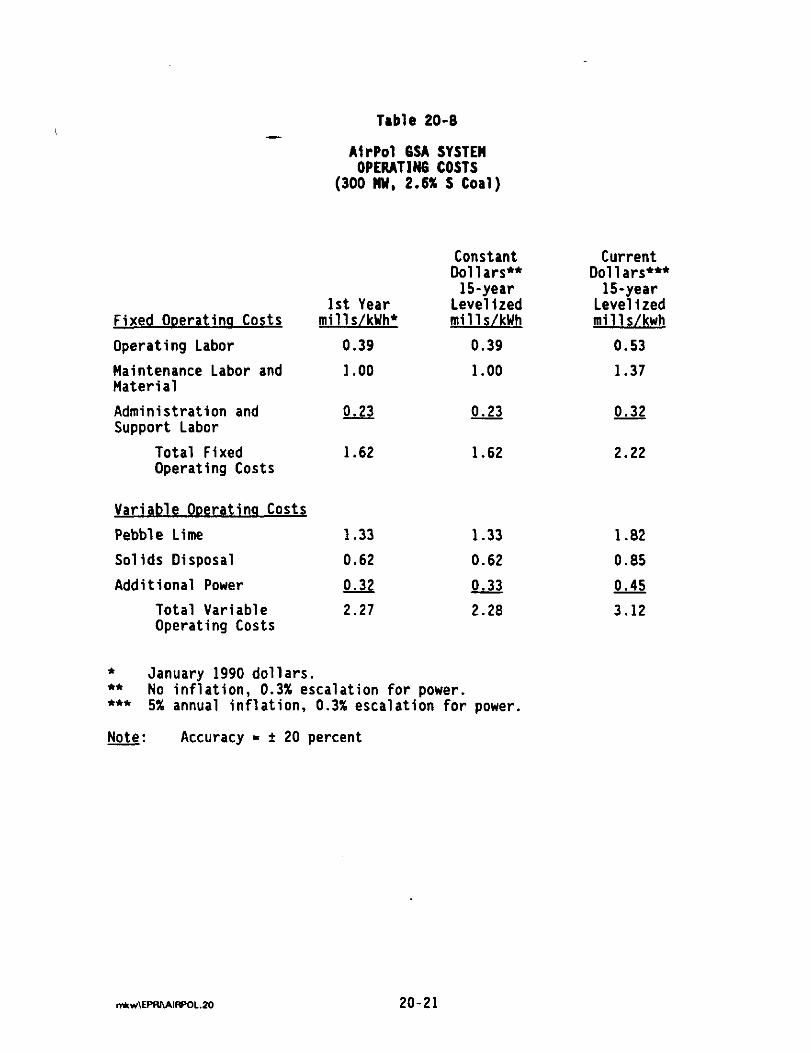
Table 20-E
AirPol 6SA SYSTEN OPERATIN COSTS
(300 NN, 2.6% S Coal)
Fixed Ooeratino Costs
Operating Labor
Maintenance Labor and Material
Administration and Support Labor
Total Fixed Operating Costs
1st Year mills/kWh*
0.39
1.00
Constant Dollars**
15-year Levelized mills/kWh
0.39
1.00
0.23 0.23
1.62 1.62 2.22
Variable Ooeratina Costs
Pebble Lime 1.33
Solids Disposal 0.62
Additional Power 0.32
Total Variable 2.27 Operating Costs
1.33 1.82
0.62 0.85
0.33 0.45
2.28 3.12
t January 1990 dollars. l * No inflation, 0.3% escalation for power. l ** 5% annual inflation, 0.3% escalation for power.
Note: Accuracy = f 20 percent
Current Dollars***
15-year Levellzed mills/kwh
0.53
1.37
0.32
20-21
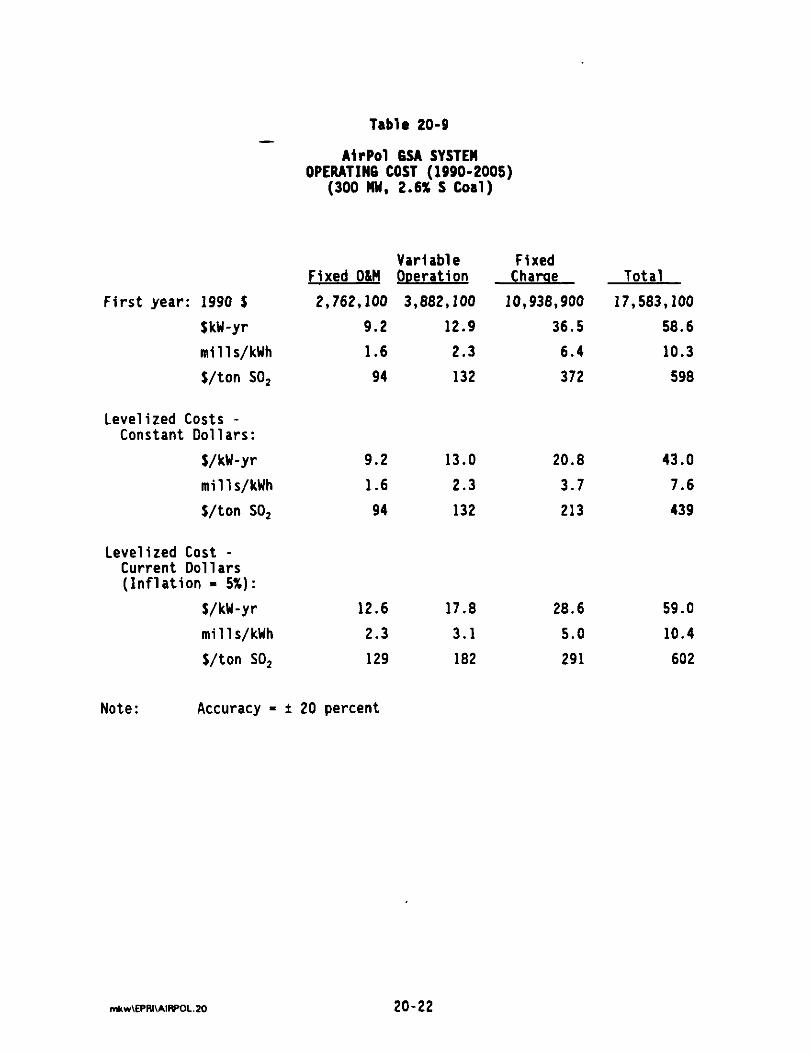
-
First year: 1990 f
fkW-yr
mills/kWh
J/ton SO,
Levelized Costs - Constant Dollars:
S/kW-yr
mills/kWh
S/ton SO,
Levelized Cost - Current Dollars (Inflation = 5%):
S/kW-yr
mills/kWh
S/ton SO,
Table 20-9
AirPol 6SA SYSTEM OPERATING COST (1990-2005)
(300 NH. 2.6% S Coal)
Variable Fixed Fixed O&H Ooeration Charoe Total
2,762,100 3,882,100 10,938,900 17,583,100
9.2 12.9 36.5 58.6
1.6 2.3 6.4 10.3
94 132 372 598
9.2 13.0 20.8 43.0
1.6 2.3 3.7 7.6
94 132 213 439
12.6 17.8 28.6 59.0
2.3 3.1 5.0 10.4
129 182 291 602
Note: Accuracy - f 20 percent
20-22
Coal sensitivity of the AirPol GSA process to various parameters are shown in
Figures 20-2 through70-21. Parameters analyzed include the following:
l
l
l
l
l
l
l
l
l
l
l
l
Coal sulfur content
Lime stoichiometric feed rate
Flue gas flow rate, acfm
Solids disposal cost
Lime cost
Power cost
Maintenance factor variations
Inflation rate
Unit size
SO, removal efficiency
Retrofit difficulty
Plant life
The levelized costs for the AirPol process are very sensitive to coal sulfur content as shown in Figure 20-2. Over the 0.5 to 6 percent sulfur range investigated, the levelized cost (mills/kWh) increases approximately 13 percent
with a 1 percent increase in coal sulfur content. This high sensitivity can be
attributed to the increased cost of capital investment in the reagent handling areas and corresponding increase in fixed costs and variable operating costs
including lime, waste disposal, and power.
Reagent feed rate has a significant effect on operating costs. A 25 percent
increase in stoichiometry corresponds to an 8.4 percent increase in levelized cost. Reagent cost also is important, with a 25 percent change from the base
case cost resulting in a 5 percent difference in levelized cost. Maintenance cost differences affect the levelized cost by 6 percent for a 50 percent deviation from the base case value.
tidEPRMIIPOL.20 20-23
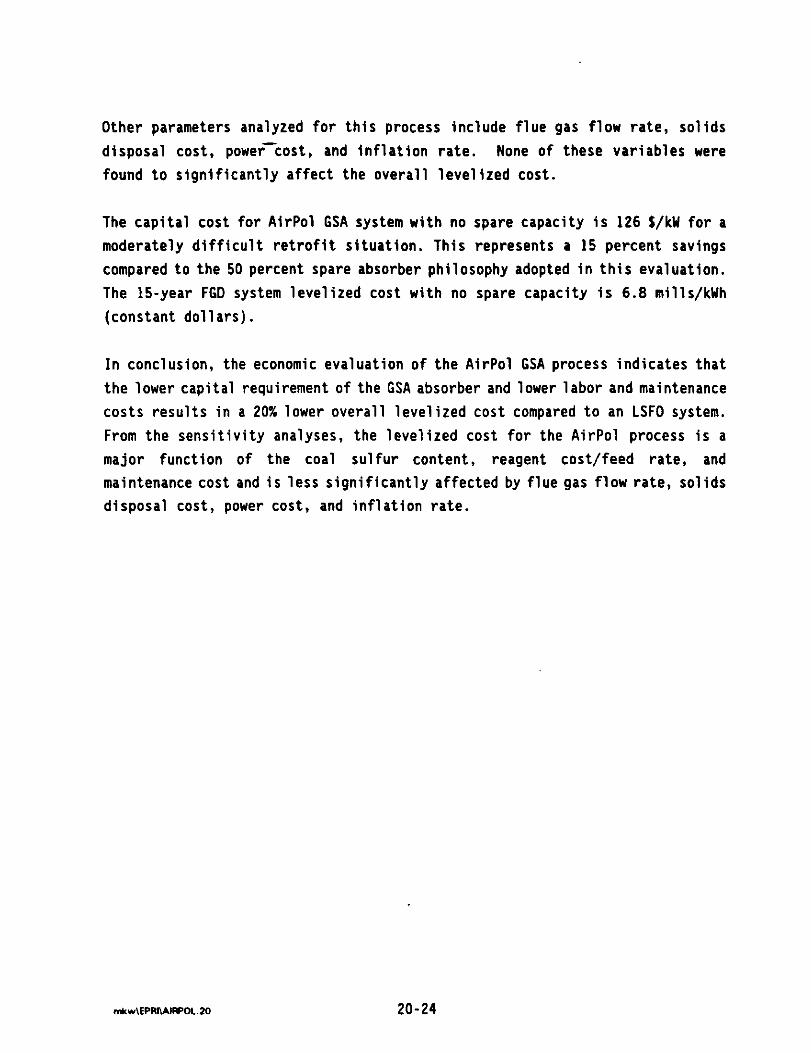
Other parameters analyzed for this process include flue gas flow rate, solids
disposal cost, power>ost, and inflation rate. None of these variables were found to significantly affect the overall levelized cost.
The capital cost for AirPol GSA system with no spare capacity is 126 S/kW for a moderately difficult retrofit situation. This represents a 15 percent savings compared to the 50 percent spare absorber philosophy adopted in this evaluation. The 15-year FGD system levelized cost with no spare capacity is 6.8 mills/kWh (constant dollars).
In conclusion, the economic evaluation of the AirPol GSA process indicates that
the lower capital requirement of the GSA absorber and lower labor and maintenance costs results in a 20% lower overall levelized cost compared to an LSFO system.
From the sensitivity analyses, the levelized cost for the AirPol process is a major function of the coal sulfur content, reagent cost/feed rate, and maintenance cost and is less significantly affected by flue gas flow rate, solids disposal cost, power cost, and inflation rate.
20-24
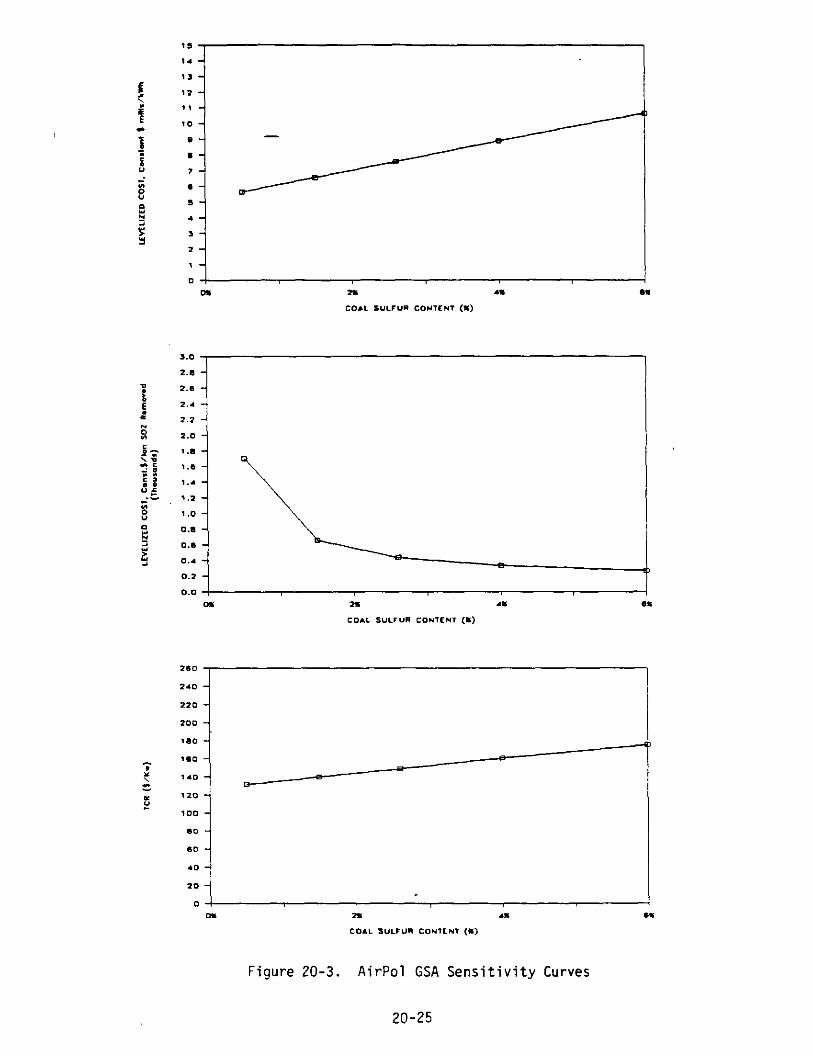
f : i E
OS 2s 1. *.
COIL SULFwi COYTCNT w
1.* -
1,s -
I.. -
3.1 -
1.0 -
0,s -
0,s -
0.. -
0.3 -
09 2% 1.
COIL S”LF”R COYTENT (I)
10 -
20 -
0 I cm 2s . . 6s
COIL SULVUI) CDNlrNT ,w
Figure 20-3. AirPol GSA Sensitivity Curves
20-25
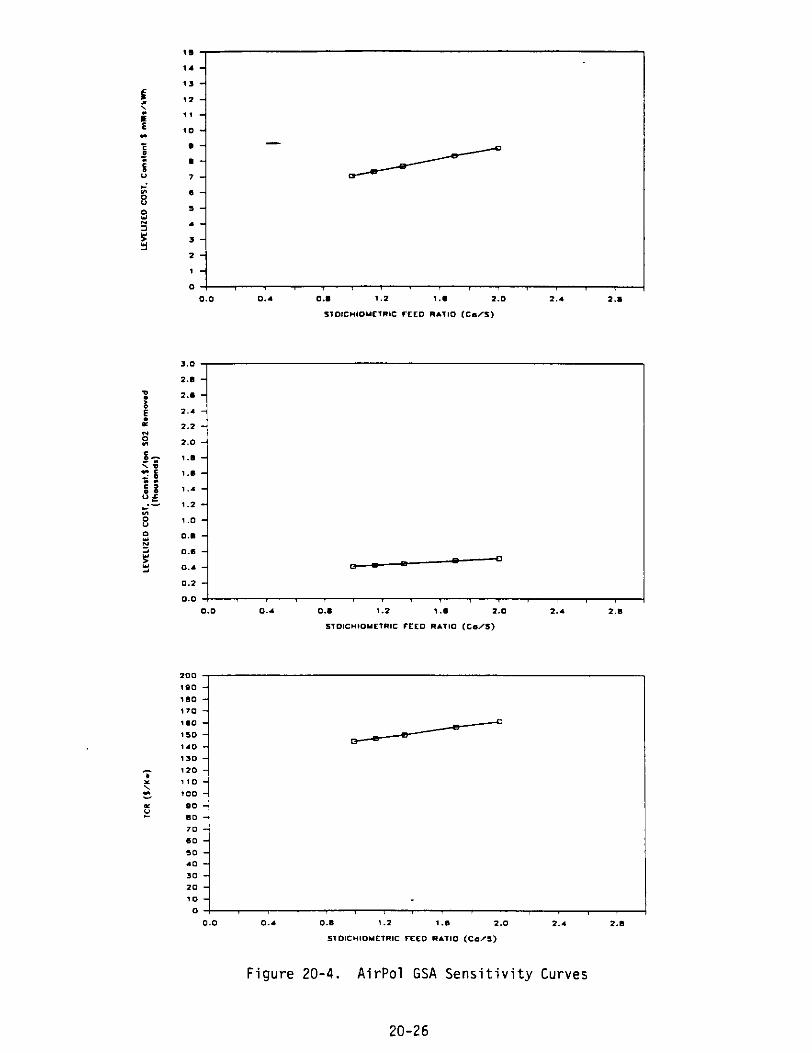
13 - c : II - ; ,1- E 30 - . i .- - : i ,-
7- i g *
g s- .-
$ 1- z-
1: 0.0 0.. 0.. 1.1 1.a 2.0 2.. 2..
sIoIc*IoYcrllc FEED 1.110 (C./I)
a.0 2.1 -
g 2.0 - E I.. - : 2.2 - 4 2.0 - 4: I.. - 2: fO ,.e- :a 1..- Of ;- I.2 - g *.o- g 0.m
$ o.s 0.. - 0.2 -
0.0 0.. 0.* 1.2 I.* 2.0 2.1 2.8
SIDIC”IDYFTl?lC FEED R.TIO (m/s)
Figure 20-4. AirPol GSA Sensitivity Curves
20-26
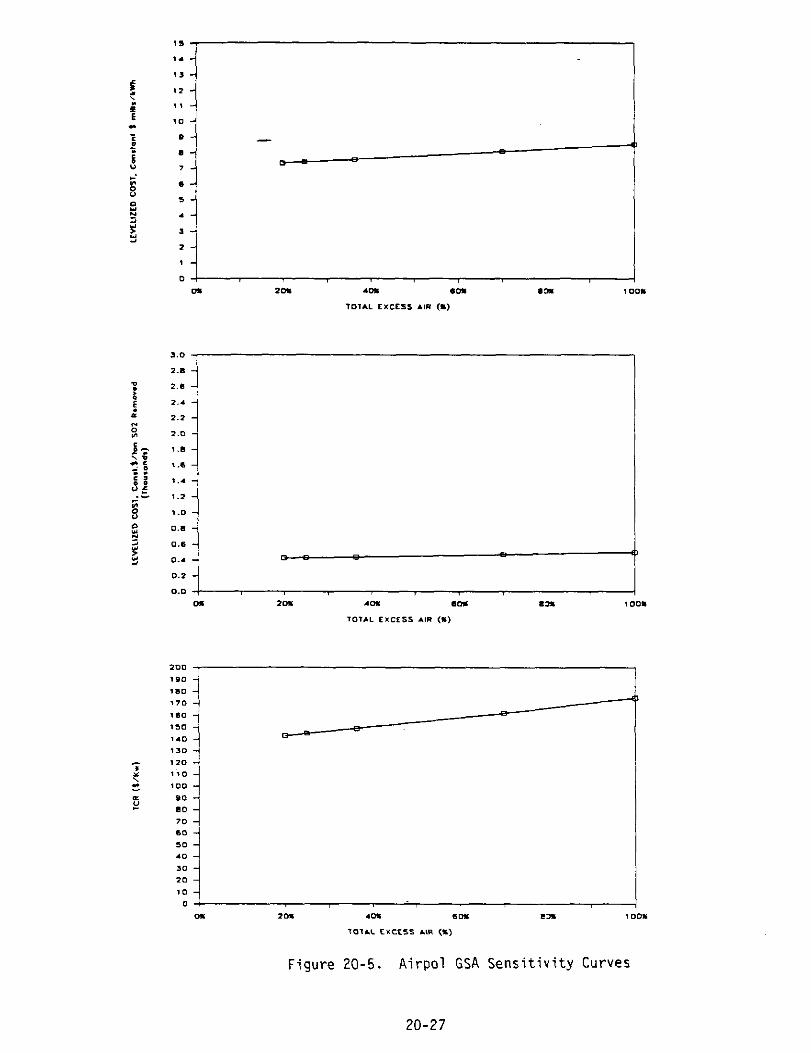
1
7.30 - 120 - 1>0 - 100 - so - 10 - 70 - *o - 50 - 40 Y 10 - 20 - 10
0 0% 20s .G% sm SYm
101.8. EXCESS .,R (S)
Figure 20-5. Airpol GSA Sensitivity Curves
20-27
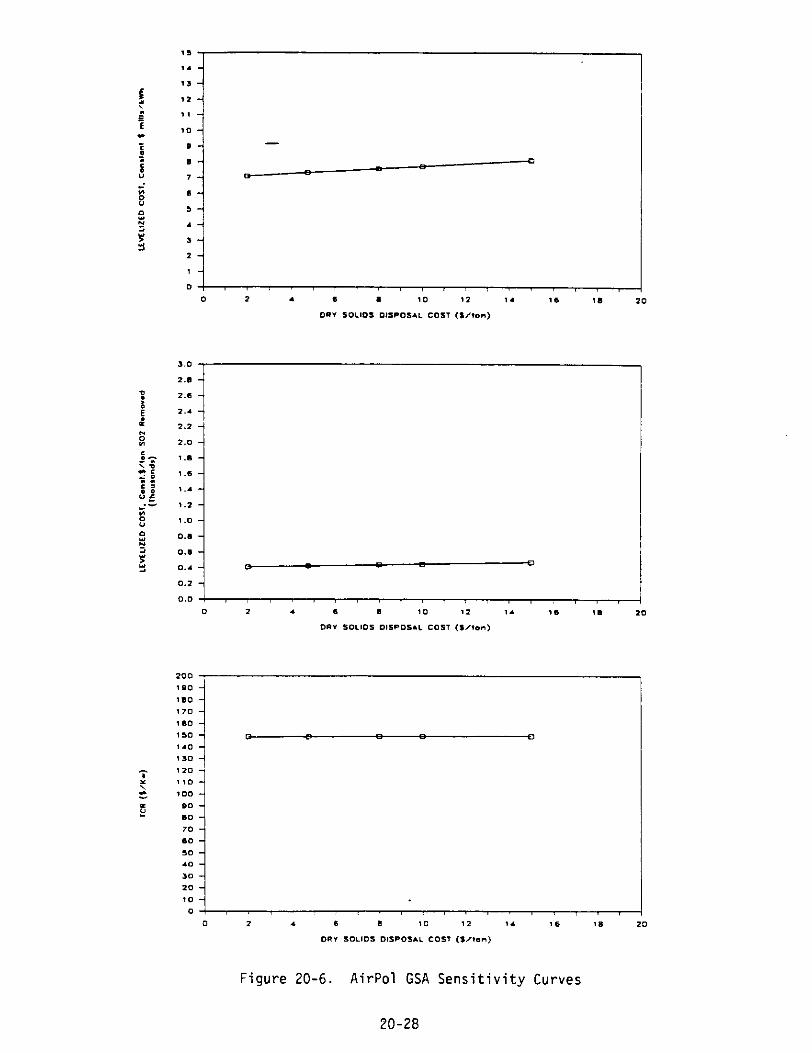
;/ ,,,,,,,,,, / ,,,,,,,, 1
0 I . e . 10 12 I. 16 I* 20
De* SOLIOS DISP0S.L COST (t/ton)
2.6
2.0 1 1.. 2.2
2.0 - 7.B - 7.s - 1.. -
I.1 - 1.0 -
0.8 - 0.8 - 0.. -
0.3 -I 0.0, , , / , ,
___
1no 170 160
100 IL
130
- =
(10 710 120 110 10.3 -
DO - so - 10 - eo - 50 - 10 - 10 - 20 - (0 - o,, ,
0 I 1 6 B 10 72 t. 76 lb
DR” SOLIDS D)1SPOS.L COST cwtan)
Figure 20-6. AirPol GSA Sensitivity Curves
20-28
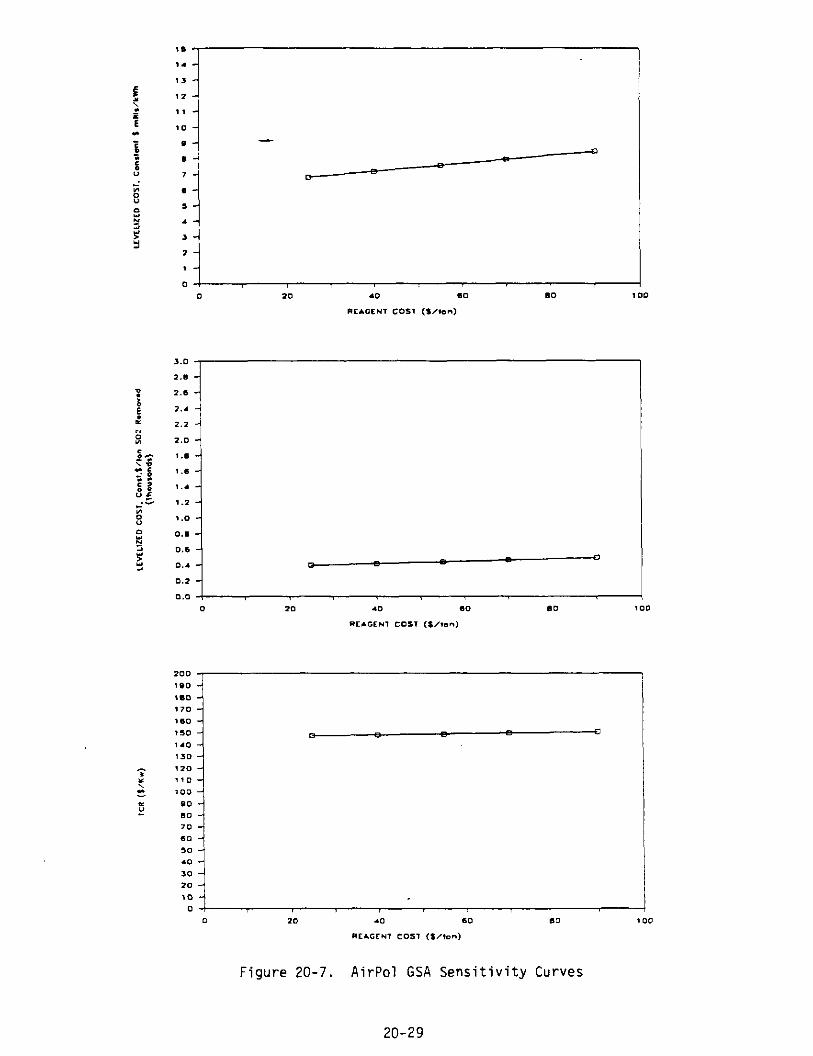
E : ; E . i :
E
g
;
? Y
P
E .’ I, 8 f- 7s ;g
?i9 i 5 s
& 5
5
7 : ?1
E
e-
,- .-
3- 1-
0
3.0 -
2.B -
2,s ,
2.. -
2.1 -
2.0 ,
1.s -
1.6 -
I.. -
7.2 -
7.0 -
0.B -
;I,,,,-,-,; 1 0 IO .o eo *cl
FcE.GFNI CDS, (*/ton)
200 - 100 - 3so - 970 - 1so - 130 - 0 1.0 - 110 - 310 - 7-o - 100 - DO - 8.3 - 70 - so - 50 - .o - 30 - 10 - 10 -
0 D IO 10 60 !lD too
RFIGCUI COST (WW”,
Figure 20-7. AirPol GSA Sensitivity Curves
20-29
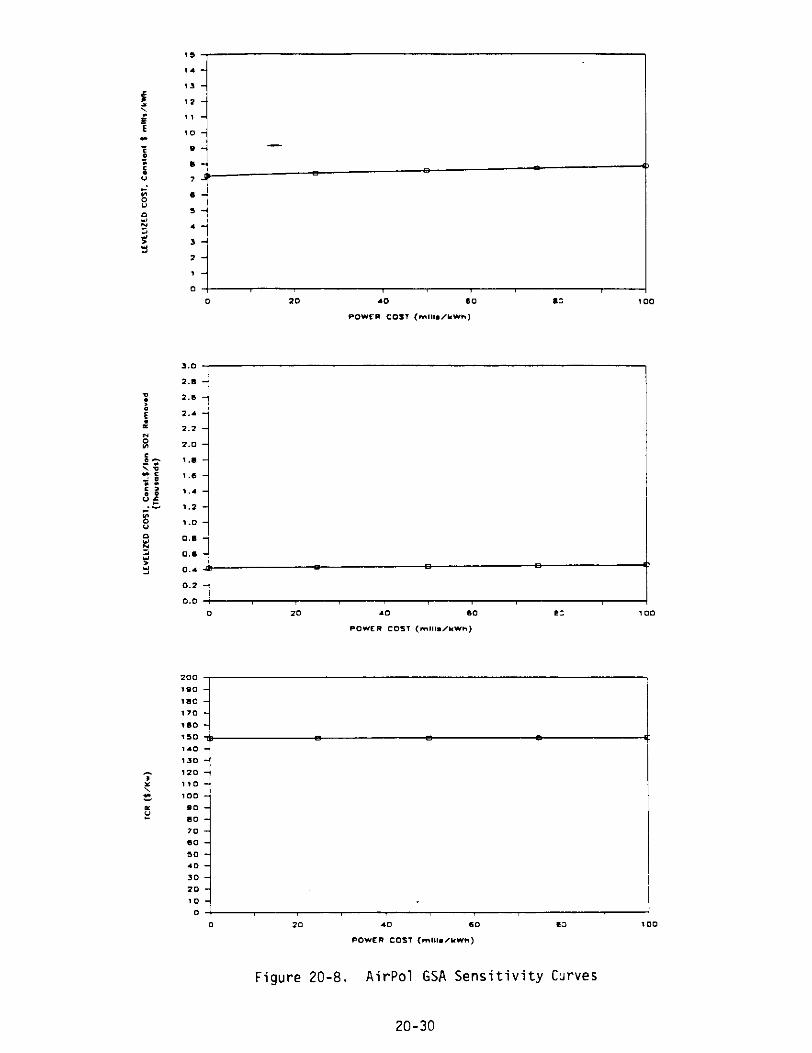
(5 1. - 13 -
72 - 11 -
10 - s- -
m- ‘1 7 -’ s-
,- .-
3- 2-
0 0 10 .D 60 .: 100
POIEl COST (rn,,,.,“Wh)
_._ 3.a
2.6 1..
1
2.1 -
2.0 - 1,s -
I.6 - *.. - 1.2 - l.0 -
0.m - 0,s -
0.4 .a 0.2 -
0.0 :
1
200 l-0 - 1mo - 170 - 760 - 150 ~,: 1.0 - 1x0 - 120 - 170 - 100 - SD - 80 70 eo 30 10 30 20 i
Figure 20-E. AirPol GSA Sensitivity Curves
20-30
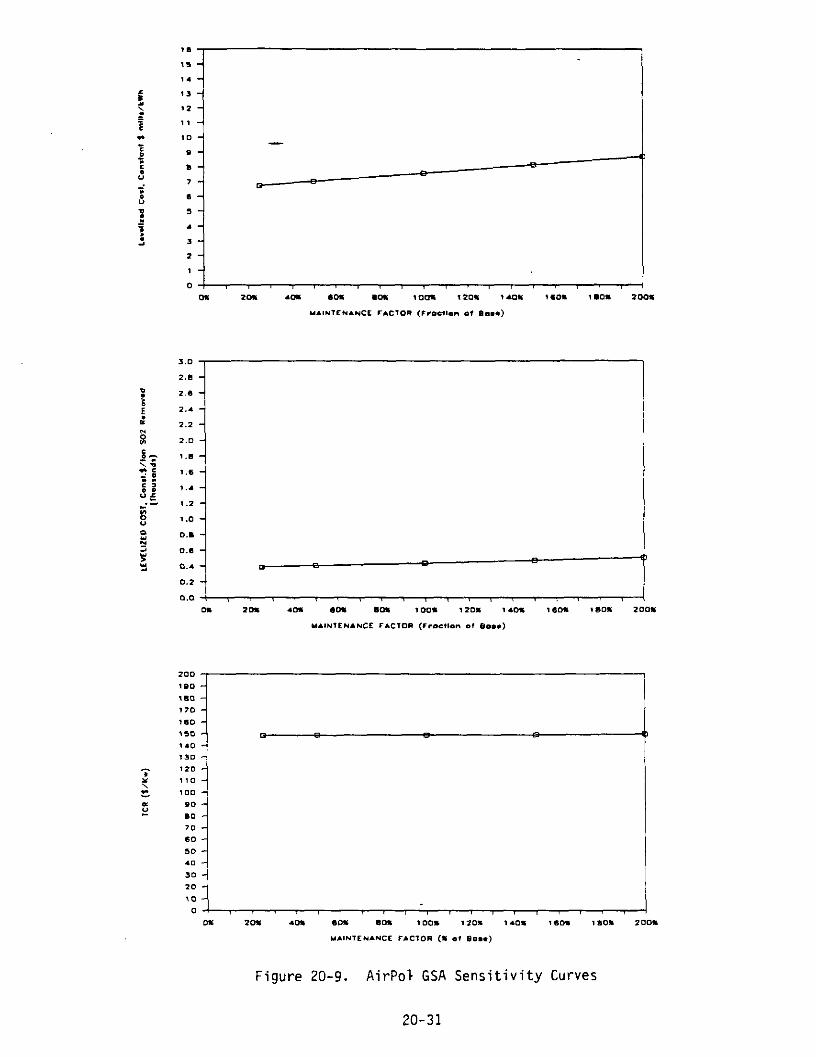
a- ,- .- J- I- 1- cl,,,, ,, ,,,,,,, ,,, ,
m 201 .m .m .ow, ,00. t20. *.os 1.0. 1.0. ZOO‘ Y.IYIC*.UCT F.CIOI1 (rrocrlon a, so,.)
ii-
2.0 - 1.m -
1.6 - 1.. - 1.1 -
1.0 - cl.. - 0.s -
cl.. - 0.2 -
O.Q7 , / , i / > , , , , , , , / , , , , 09 209 .cs eDI sea ,ocl* 320. !.cm 1m” lc.0. 2
Y.IUICN.*CE FICTDl (rroctlon 01 Bon.)
1
ii’;
1x0 J 720 - 370 - 700 -
so - so - 70 * 60 - 5.3 - .O - 30 - 20 - (0 -
o,, ,, ,, ,,,, ,,,,,,,,, 0% 20% .m SOS vm ,cms 1Zc.I 1.0s lb.% 180% 300.
YAINIE*.*Cc FIClOIl (S 0, so*.)
Figure 20-9. AirPol GSA Sensitivity Curves
20-31
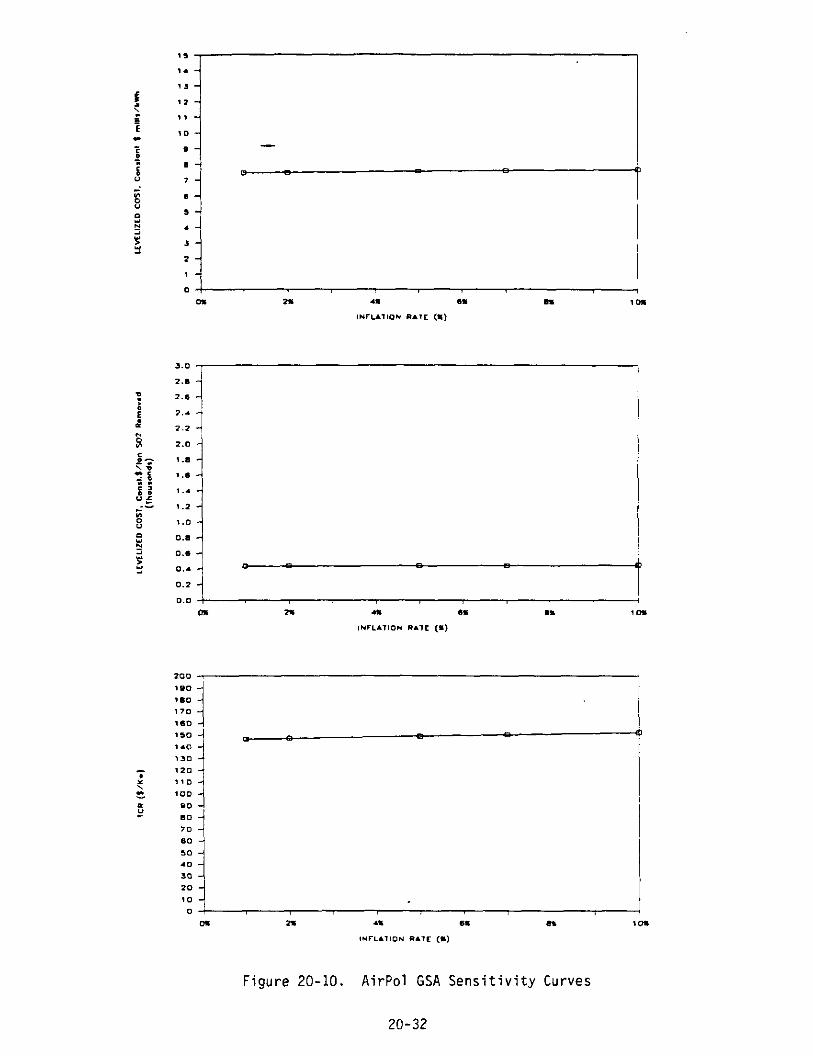
(9 3. - (3 - (1 - 11 - 70 - e- - .- n 7- e- ,- .- s- z-
0-I 09 2. . . e. ms 109
INFLAIION R.lE (X)
r-n: 2.1 2.2 1 2.0 - 1.s - 7,s - L. - I.2 - 1.D - 0.m - 0.e 0.. D 0.2 - 0.0 09 n . . e. l 309
Figure 20-10. AirPol GSA Sensitivity Curves
20-32
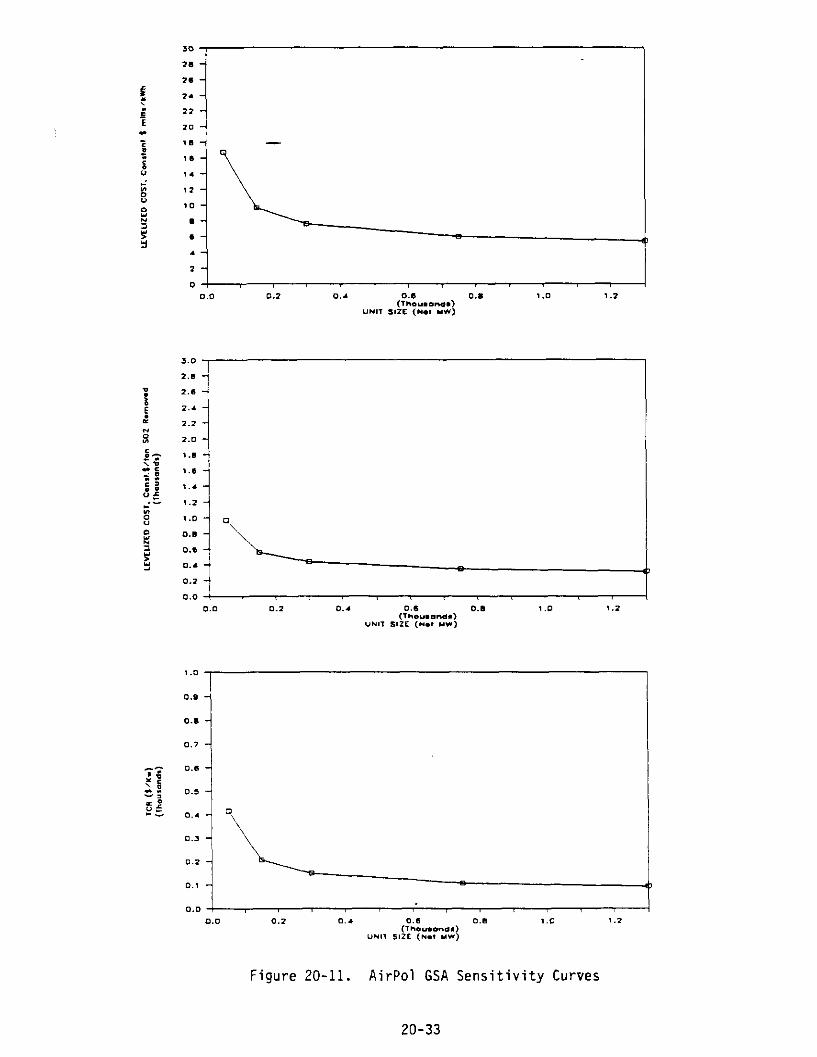
. ..” 2.m - 2.6 - 2.. - 2.1 - 2.0 - 1.a - 1.s - 1.. - 3.1 - >..a
;I: I O’\
.“=i 0.0 0.1 0.. 0.6 0.1 1 .o 1.1
u*o”.ond., “Nil SIZE (rd.* I*)
Figure 20-11. AirPol GSA Sensitivity Curves
20-33
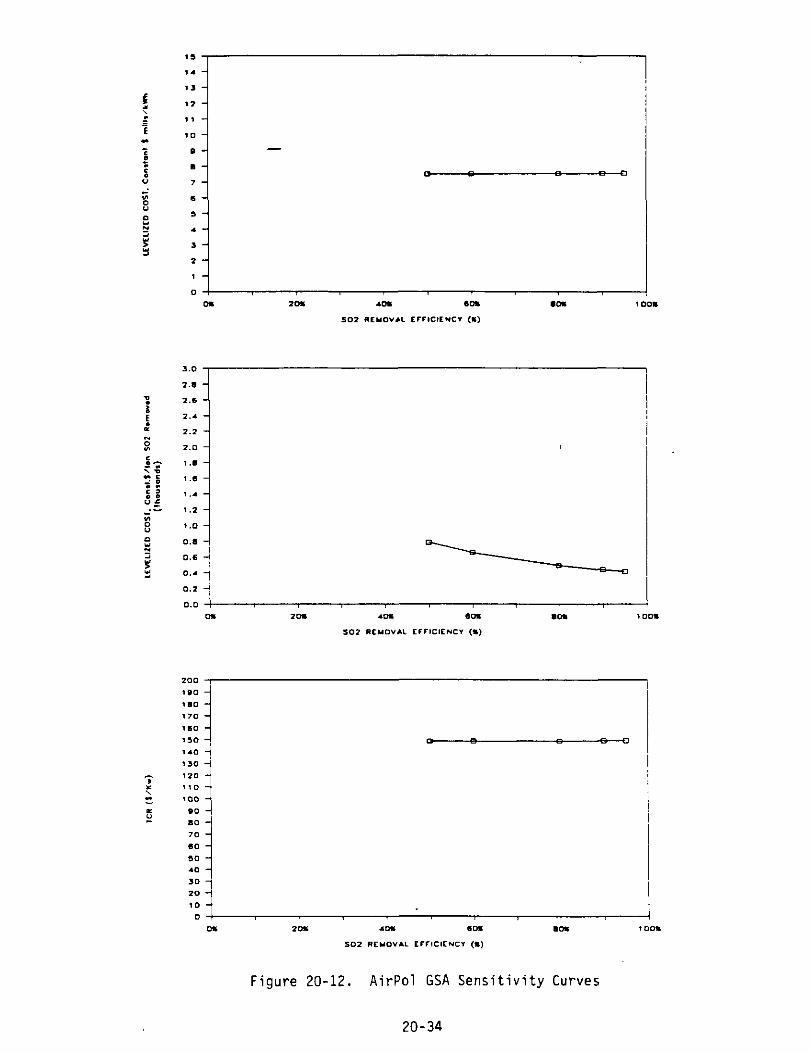
a.” 2.0 - 1.6 -
2.. - 2.2 - 2.0 - 1,s -
Y-0 - 7.. - >.* -
*.o - o.* -
0.6 - 0.. - 0.2 -
D_D’ cm IO8 .09 809 mm 1 DO.
502 I)CYD”.L FTFICIFLIC” (.)
Figure 20-12. AirPol GSA Sensitivity Curves
20-34
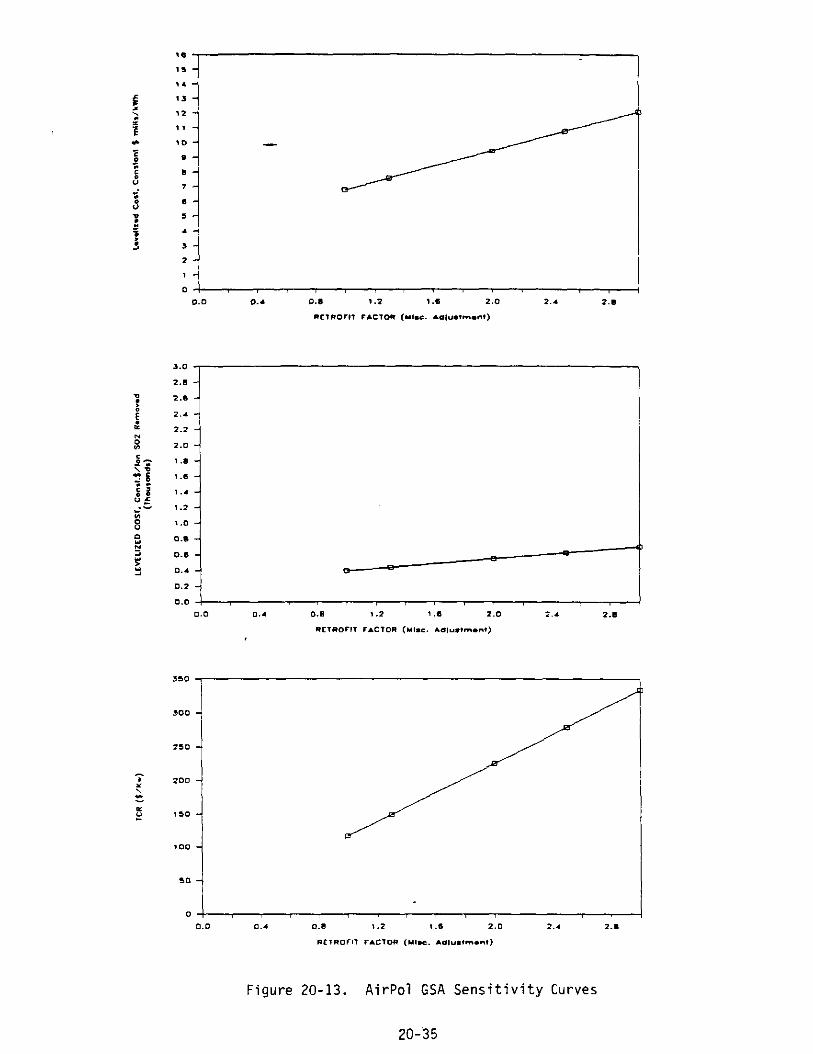
,e 1, - ,a-
E ‘I- > >*- ‘i Iv- . (0 - 3 e-
; 0 . 7
j * ; - /
i: l .i
j ,-
1-
D
0.0 0.. 0.8 1.1 1,s 2.0 I.. ,.m
I1ETRDIII FICTDl W.S. .*w.*m.nt)
3.0 -
2.0 -
2.s -
2.1 -
2.1 -
2.0 -
I.* -
1.6 -
1.. -
I.2 -
7.0 1
ij ,,b/-----y-i
0.0 0.. 0.m 1.2 7,s 1.0 i-4 2.B I1CTIOFIT C.CIOll (“l.c. .w”,*m.n.)
300 -
250 -
: 200 -
=
100 -
50 50 -
0 ,
0.D 0.D 0.. 0.. 0.0 0.0 1.2 1.2 3.6 3.6 2.0 2.0 2.4 2.4 1-B 1-B
IlElllOFIl F.CTlm (“I.C. .a,“.tm.nt~ IlElllOFIl F.CTlm (“I.C. .a,“.tm.nt~
Figure 20-13. AirPol GSA Sensitivity Curves
20-x
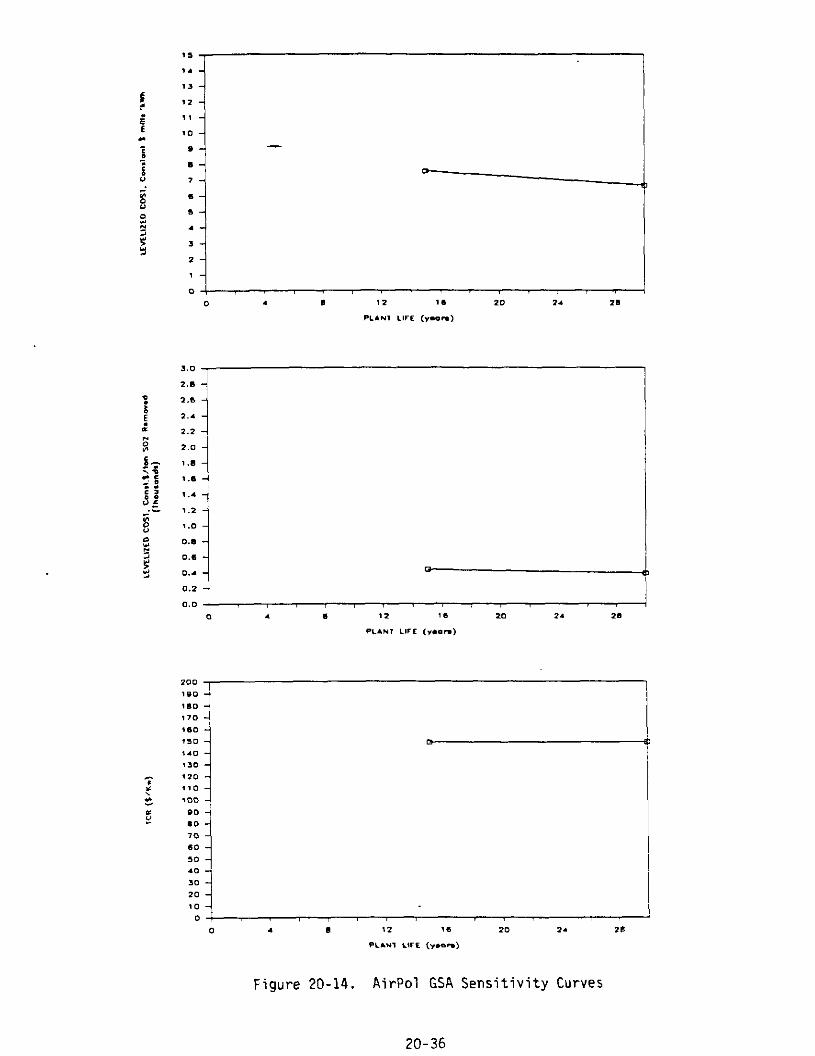
i; 0 . I 12 1a SC’ I). zm
PL.W LlFC (*.on,
3.0
2.B -
2,s -
I.. -
1.2 -
2.0 -
1,s -
1.s -
I.. -
I.2 -
1.0 -
0.8 -
0.6 -
0.. -
0.2 -
0.0
0 . * 12 16 20 2. 2m
PL.Nl LIrE (*.a”)
zoo *so - ISO - 170 - 1110 - 15.3 - q 1.0 - 110 -
420 - 110 - 100 -
00 -
10 -
70 - 60 -
50 - .O
30 -
20 -
10 - 0
0 1 I 12 7s 20 3. 28
PL.Y, LIFT <r.*n>
4
Figure 20-14. AirPol GSA Sensitivity Curves
20-36
REFERENCES
1.
2.
3.
4.
5.
6.
Hedenhag, J., "Technical and Economic Comparison of State of the Art Wet and Dry FGD Systems," presented at the Industrial Power Conference, Lakewood, Colorado, March 28-30, 1993.
"AirPol Gas Suspension Absorption Demonstration Plant," DOE Quarterly Project Sumnary, January 1993.
"TVA Eegins Testing AirPol's Pollution Control Technology," (DOE) fossil Enerav Review, October-December, 1992.
Project specific transmittals of information from AirPol to Raytheon, June/July/October 1993.
Burnett, T. et.al. "IO-MW Demonstration of the AirPol Gas Suspension Absorption Flue Gas Desulfurization Process," presented at the 1993 SO, Control Svmposium, Boston, Massachusetts, August 24-27, 1993.
Burnett, T. et.al. "Recent Results from the IO-MW Demonstration of the Gas Suspension Absorption Process at TVA's Center for Emissions Research," to be presented at the 1994 International Joint Power Generation Conference, October 1994.
20-37
VENDOR COMENTS -
AirPol, Inc. (Mr. Frank Hsu)
. The first 18 months of the GSA demonstration at TVA's CER were successful
in proving the GSA's capability to effectively remove SD, from the flue gas.
TVA plans to continue the development of the GSA with the following
activities:
1.
2.
3.
4.
Continue to monitor and evaluate the performance of the ESP to ensure
that the GSA process will not have an adverse impact on this
particulate control device;
Conduct lower SCA tests by deenergizing one or more fields in the ESP
to determine the resulting effect on particulate emissions;
Evaluate the effect of other limes on the performance of the GSA
system; and
Evaluate the potential for using the by-product material from the
atmospheric fluidized bed combustion unit as a source of lime to
displace some of the fresh lime feed to the system.
1NDUSTRY COMMENTS
Tennessee Valley Authority (Mr. Tom Burnett)
l We assume that the request for detention slaker use is based on the need to
remove the lime grit before feeding the lime slurry to the two-fluid nozzle
since the current nozzle is not designed to be abrasion-resistant. (The
lime grit is very abrasive even though it is ground to a very small size in
the ballmill slaker and remains in the lime slurry that is fed to the two-
fluid nozzle.) The utility industry is likely to have a strong preference
for a ballmill slaker to prevent the production of an additional wastewater
stream that must be handled and disposed of in an acceptable manner. We
would suggest that AirPol either develop an abrasion-resistant nozzle or
dcw\Ewu,AIwOL.2O 20-38
develop and include a means for handling and disposing of the grit material
to alleviate thrutility concerns over this issue.
. The use of cooling tower blowdown for slaking the lime will similarly meet
significant resistance in the utility industry. Previous work by the
Electric Power Research Institute (among others) has indicated that the
dissolved salts in the cooling tower blowdown adversely affect the lime
slaking reaction leading to lower lime utilization rates in these dry,
lime-based systems. Since the cost of lime is the major annual operating
cost in a utility GSA system, any change that reduces the lime utilization
rate will have severe repercussions for the process economics. We would
suggest that AirPol undertake a test program to confirm that cooling tower
blowdown can be used to slake the pebble lime without affecting the lime
utilization before recommending its use in an actual application.
. We do not believe that the conversion of the pneumatic system for the
overflow solids line to a mechanical screw conveyor and chute would be the
best way to move this material from the recycle feeder box to the storage
silo. At the IO-MW plant, where we had an existing bucket elevator to
receive the overflow material and lift it to the top of the silo, a
mechanical screw conveyor may have been appropriate. However, in a full-
scale, new GSA installation, we believe that a pneumatic system will be
used to move the by-product material to a silo. (There may also be a screw
conveyor to remove the by-product material from the recycle feeder box and
into a chute with a rotary valve that feeds the pneumatic transfer system,
but a pneumatic system will still be necessary.)
nhW\EPRI\AIFPOL.ZO 20-39
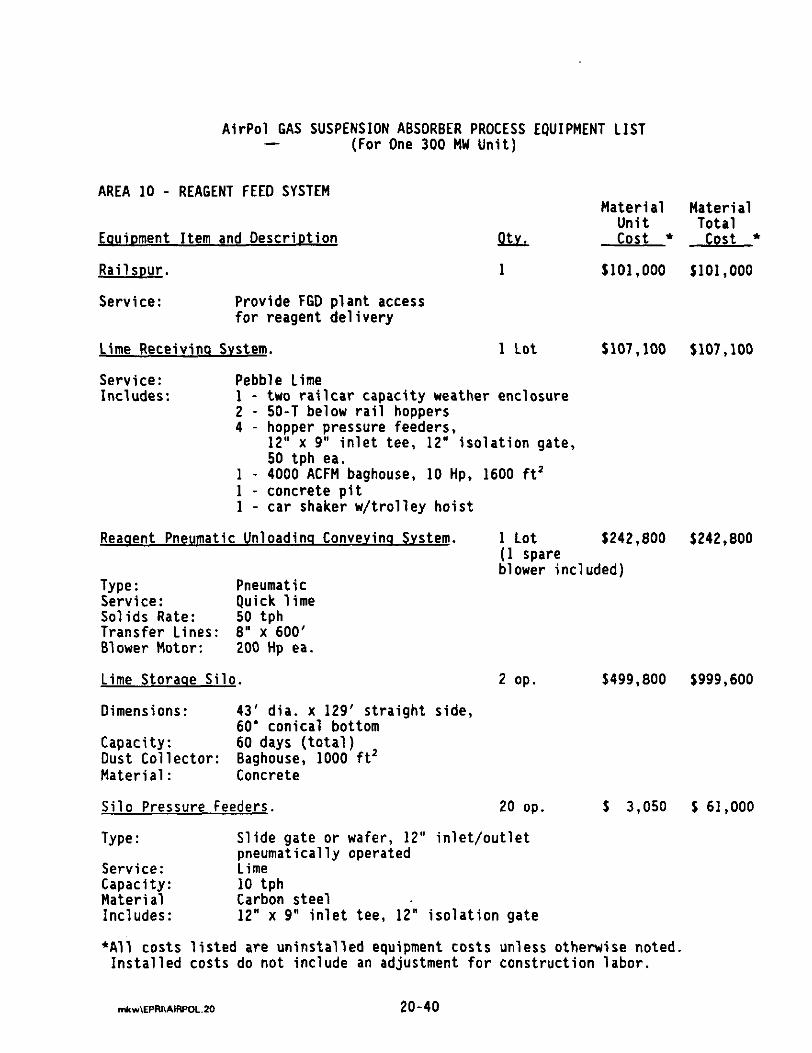
1
Provide FGD plant access for reagent delivery
AirPol GAS SUSPENSION ABSORBER PROCESS EQUIPMENT LIST - (For One 300 MW Unit)
AREA 10 - REAGENT FEED SYSTEM
Eouioment Item and Descriotion
Material Material Unit Total cost * cost l
Railsour.
Service:
5101,000 $101,000
Lime Receivinq Svstem. 1 Lot
Service: Pebble Lime Includes: 1 - two railcar capacity weather enclosure
2 - 50-T below rail hoppers 4 - hopper pressure feeders,
12" x 9" inlet tee, 12" isolation gate, 50 tph ea.
5107,100 $107 (100
I - 4000 ACFM baghouse, 10 Hp. 1600 ft' 1 - concrete pit 1 - car shaker w/trolley hoist
Reaqent Pneumatic Unloadina Convevina Svstem.
Type: Pneumatic Service: Solids Rate:
$i;Ehlime
Transfer Lines: 8" x 600' Blower Motor: 200 Hp ea.
Lime Storaqe Silo.
Dimensions: 43' dia. x 129’ straight side, 60' conical bottom
Capacity: 60 days (total) Dust Collector: Baghouse, 1000 ft' Material: Concrete
Silo Pressure Feeders.
1 Lot $242,800 $242,800 (1 spare blower included)
2 op. $499,800 $999,600
20 op. S 3,050 S 61,000
Type: Slide gate or wafer, 12" inlet/outlet pneumatically operated
Service: Lime Capacity: 10 tph Material Carbon steel Includes: 12" x 9" inlet tee, 12" isolation gate
*All costs listed are uninstalled equipment costs unless otherwise noted. Installed costs do not include an adjustment for construction labor.
r.*w\EPFu\AIPPOL.20 20-40
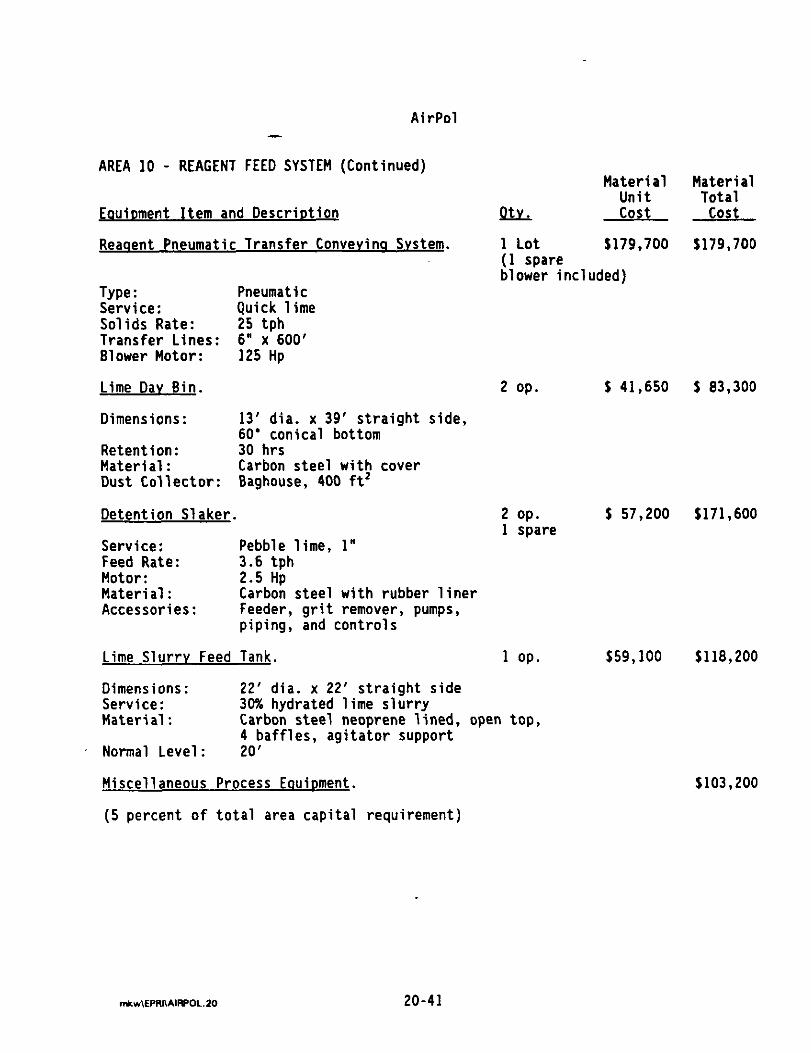
- AirPol
AREA 10 - REAGENT FEED SYSTEM (Continued)
Eauioment Item and Descriotion
Reaqent Pneumatic Transfer Convevinq Svstem.
Material Unit
0L.L cost
1 Lot $179,700 (1 spare blower included)
Type: Pneumatic Service: Solids Rate:
;;i;kphlime
Transfer Lines: 6" x 600' Blower Motor: 125 Hp
Lime Dav Bin. 2 op.
Dimensions: 13' dia. x 39' straight side, 60' conical bottom
Retention: 30 hrs Material: Carbon steel with cover Dust Collector: Baghouse, 400 ft'
Detention Slaker. 2 op. S 57,200 1 spare
Service: Pebble lime, 1” Feed Rate: 3.6 tph Motor: 2.5 Hp Material: Carbon steel with rubber liner Accessories: Feeder, grit remover, pumps,
piping, and controls
Lime Slurrv Feed Tank. 1 op.
Dimensions ,: 22' dia. x 22' straight side Service: 30% hydrated lime slurry Material: Carbon steel neoprene lined, open top,
4 baffles, agitator support Normal Level: 20'
M;;;;;al
cost
$179,700
S 41,650 5 83,300
$171,600
Miscellaneous Process Eouioment.
(5 percent of total area capital requirement)
$59,100 $118,200
$103,200
20-41
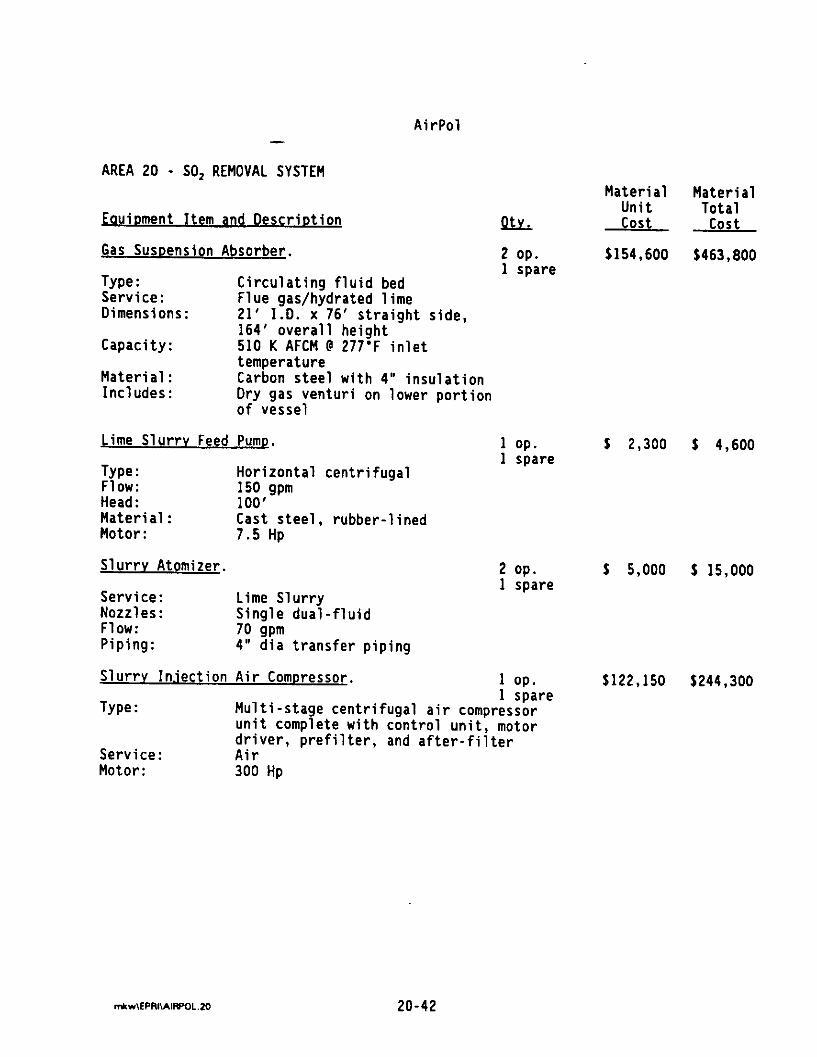
AirPol
AREA 20 - SO, REMOVAL SYSTEM
Eauioment Item and Descriotion
Material Material Unit Total
!aL cost cost
Gas Susoension Absorber. 2 op. 5154,600 $463,800
Type: Circulating fluid bed 1 spare
Service: Dimensions:
Flue gas/hydrated lime 21' I.D. x 76' straight side,
Capacity:
Material: Includes:
164' overall height 510 K AFCM @ 277'F inlet temperature Carbon steel with 4" insulation Dry gas venturi on lower portion of vessel
Lime Slurrv Feed Pumo.
Type: Flow:
Horizontal centrifugal 150 gpm
Head: 100' Material: Cast steel, rubber-lined Motor: 7.5 Hp
Slurrv Atomizer.
Service: Nozzles:
Lime Slurry Single dual-fluid
Flow: 70 wm Piping: 4" dia transfer piping
1 op. 1 spare
f 2,300 S 4,600
2 op. s 5,000 f 15,000 1 spare
Slurrv Injection Air Comoressor. 1 op.
Type: 1 spare
Multi-stage centrifugal air compressor unit complete with control unit, motor driver, prefilter, and after-filter
Service: Air Motor: 300 Hp
$122,150 $244,300
20-42
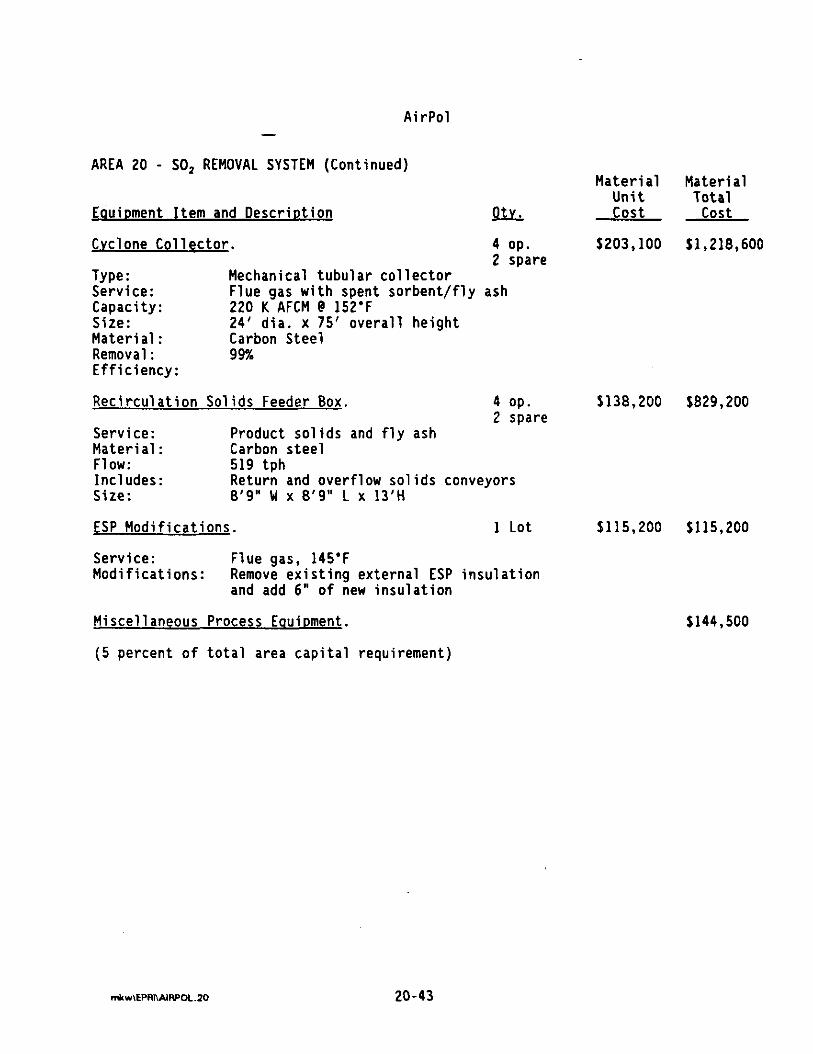
- AirPol
AREA 20 - SD, REMOVAL SYSTEM (Continued)
Eduioment Item and Descriotion
Cvclone Collector.
w!z
4 op.
Material Material Unit Total cost cost
5203,100 51,218,600
Type: Service: Capacity: Size: Material: Removal: Efficiency:
2 spare Mechanical tubular collector Flue gas with spent sorbent/fly ash 220 K AFCM @ 152-F 24' dia. x 75' overall heiaht Carbon Steel 99%
Recirculation Solids Feeder Box. 4 op. 2 spare
Service: Product solids and fly ash Material: Carbon steel Flow: 519 tph Includes: Return and overflow solids conveyors Size: 8'9" W x 8'9" L x 13'H
f138.200 $829,200
ESP Modifications. 1 Lot
Service: Flue gas, 145'F Modifications: Remove existing external ESP insulation
and add 6" of new insulation
6115,200 $115,200
Miscellaneous Process Eouipment.
(5 percent of total area capital requirement)
$144,500
20-43
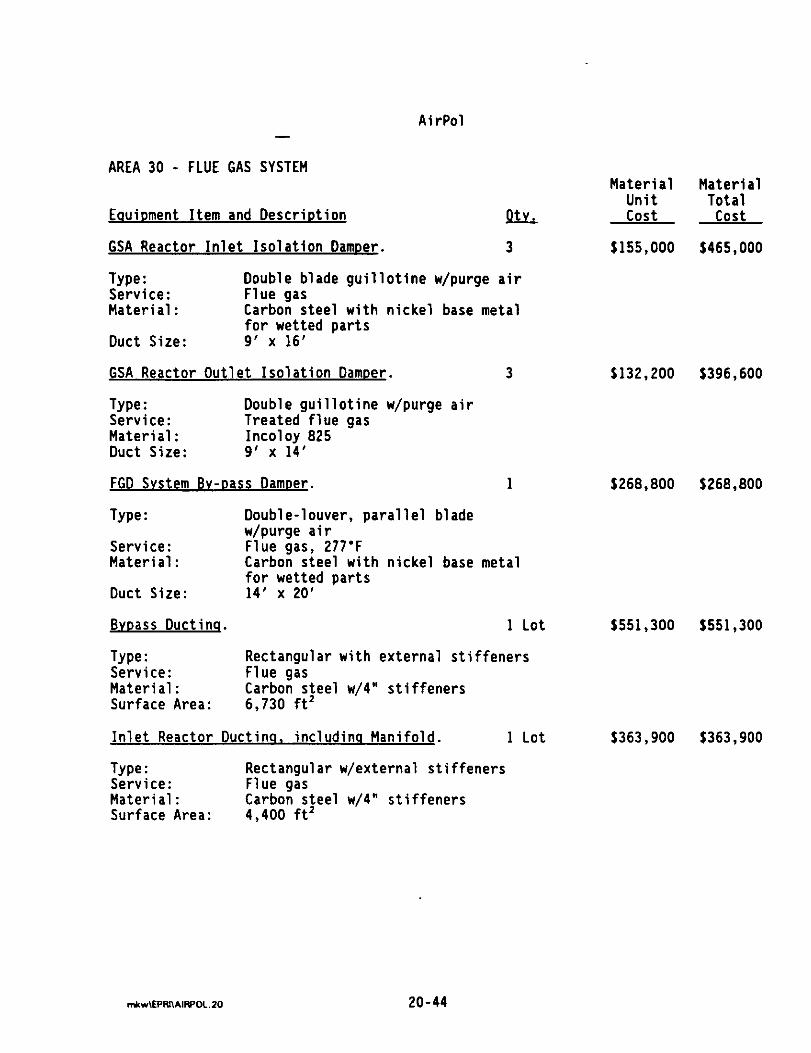
- AirPol
AREA 30 - FLUE GAS SYSTEM
Eauioment Item and Description Qb
GSA Reactor Inlet Isolation Damoer. 3
Type: Double blade guillotine w/purge air Service: Flue gas Material: Carbon steel with nickel base metal
for wetted parts Duct Size: 9' x 16'
GSA Reactor Outlet Isolation Damoer. 3
Type: Double guillotine w/purge air Service: Treated flue gas Material: Incoloy 825 Duct Size: 9' x 14'
FGD Svstem 8v-oass Damoer.
Type:
Service: Material:
Duct Size:
8voass Ductinq.
Type: Service: Material: Surface Area:
Double-louver, parallel blade w/purge air Flue gas, 277'F Carbon steel with nickel base metal for wetted parts 14' x 20'
1 Lot
Rectangular with external stiffeners Flue gas Carbon steel w/4" stiffeners 6,730 ft'
Inlet Reactor Ductina. includina Manifold. 1 Lot
Type: Rectangular w/external stiffeners Service: Flue gas Material: Carbon steel w/4" stiffeners Surface Area: 4,400 ft2
Material Material Unit Total cost cost
$155,000 $465,000
$132,200 $396,600
$268,800 $268,800
$551,300 $551,300
$363,900 $363,900
20-44
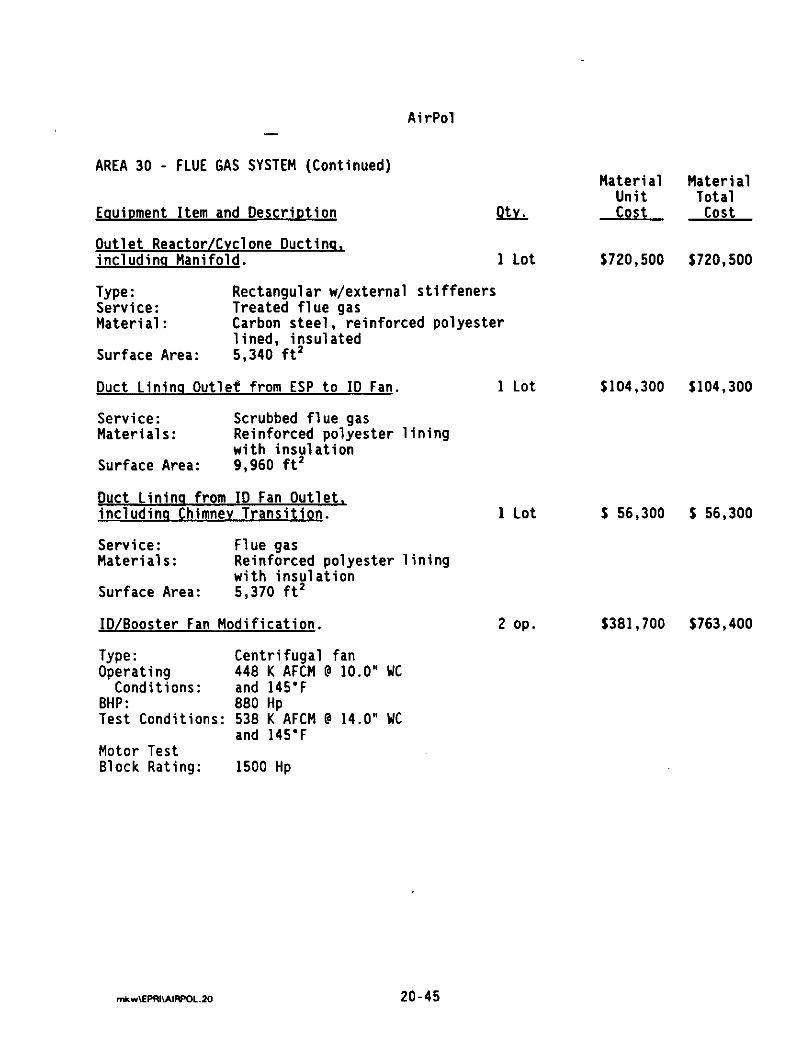
- AirPol
AREA 30 - FLUE GAS SYSTEM (Continued)
Eauioment Item and Description EL
Outlet Reactor/Cvclone Ductinp, includina Manifold. 1 Lot
Type: Rectangular w/external stiffeners Service: Treated flue gas Material: Carbon steel, reinforced polyester
lined, insulated Surface Area: 5,340 ft'
Duct Linina Outlet from ESP to ID Fan. 1 Lot
Service: Scrubbed flue gas Materials: Reinforced polyester lining
with insulation Surface Area: 9,960 ft'
Duct Linina from ID Fan Outlet.. includina Chimnev Transition.
Service: Flue gas Materials: Reinforced polyester lining
with insulation Surface Area: 5,370 ft2
ID/Booster Fan Modification.
Type: Centrifugal fan Operating 448 K AFCM @ 10.0” WC
Conditions: and 145'F 8HP: 880 Hp Test Conditions: 538 K AFCM @ 14.0" WC
and 145'F Motor Test Block Rating: 1500 Hp
1 Lot s 56,300 S 56,300
2 op.
Material Material Unit Total cost cost
$720,500 $720,500
s104,300 $104,300
$381,700 $763,400
n*r\EPRI\AIFlPOL.10 20-45

AirPol -
AREA 60 - SOLIDS HANDLING SYSTEM
Material Material Unit Total
fouioment Item and Descriotion QUL cost cost
Solids Pneumatic Convevina Svstem. 1 Lot 5179,700 5179.700 (1 spare blower included)
Type: Pneumatic Service: Fly ash/calcium sulfite/
calcium sulfate mixture Capacity: 25 tph Transfer Lines: 6" x 600' Blower Motor: 150 Hp
Solids Silo. 1 (Sized for spent sorbent quantity only assuming capacity exists for flyash collected)
Dimensions: 28' dia. x 84' straight side, 60' Cone Capacity: 3 day storage Service: Spent sorbent/fly ash mixture Material: Carbon steel w/stainless steel cone Accessories: Baghouse, 1000 ft'
Pua Mill. 2 op.
Service: Spent sorbentlfly ash/water Discharge
Capacity: 30 tph Motor: 40 Hp
Demolition of Ash Pioinq. 1 Lot
Includes: Removal of all existing pneumatic conveying piping, blowers, and all associated equipment
Miscellaneous Process Eauioment.
(5 percent of total area capital requirement)
$268,800 $268,800
5 33,950 S 67,900
5 57,750 f 57,750
S 28,700
20-46
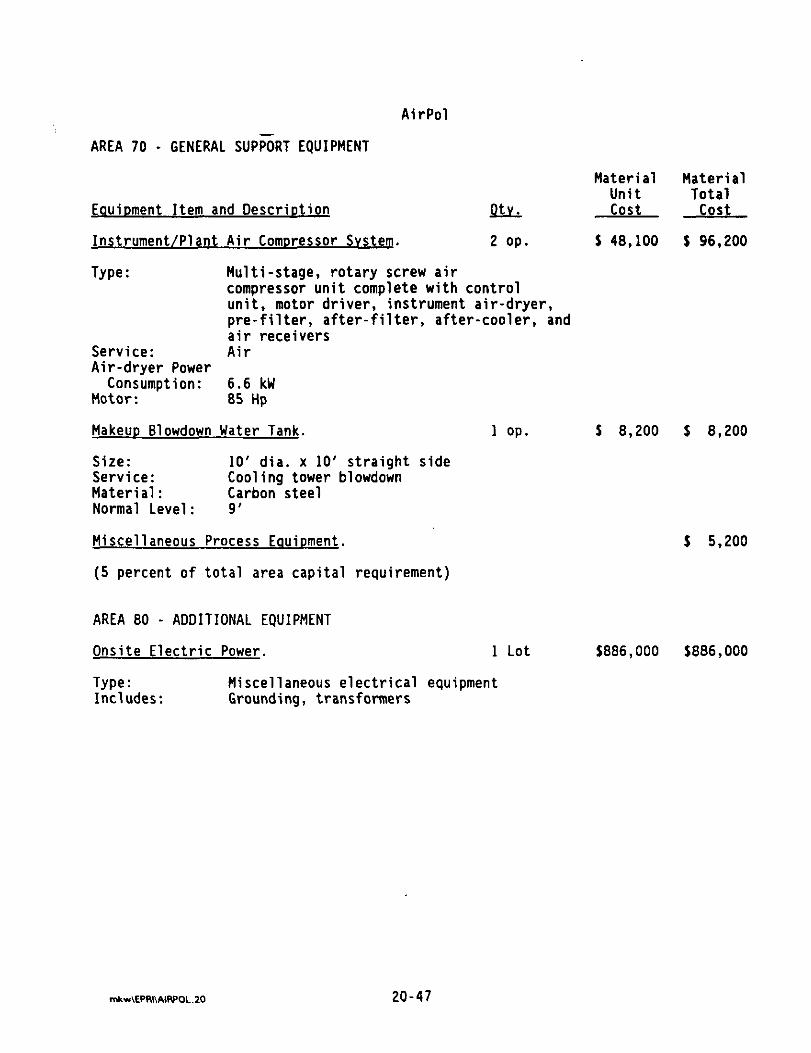
AirPol
AREA 70 - GENERAL SUPPoRT EQUIPMENT
Material Material Unit Total
Eauioment Item and Descriotion Q&L cost cost
Instrument/Plant Air Comoressor Svstem. 2 op. I 48,100 S 96,200
Type: Multi-stage, rotary screw air compressor unit complete with control unit, motor driver, instrument air-dryer, pre-filter, after-filter, after-cooler, and air receivers
Service: Air Air-dryer Power
Consumption: 6.6 kW Motor: 85 Hp
Makeup Blowdown Water Tank. 1 op. 5 8,200 s 8,200
Size: 10' dia. x 10' straight side Service: Cooling tower blowdown Material: Carbon steel Normal Level: 9'
Miscellaneous Process Eauioment. S 5,200
(5 percent of total area capital requirement)
AREA 80 - ADDITIONAL EQUIPMEN
Onsite Electric Power. 1 Lot
Type: Miscellaneous electrical equipment Includes: Grounding, transformers
$886,000 58B6,OOO
20-47

APPENDIX ‘B”
10 MW DEMONSTRATION OF
THE GAS SUSPENSION ABSORPTION PROCESS
AT TVA’S CENTER FOR EMISSIONS RESEARCH
,
By Tennessee Valley Authority
Pmpnred for the United States Dep,artment of Energy Under Coopemtive Agreement No. DEF22-90PC90542
Cleated by Oftice of Patent Counsel Ckicrgo Opemtions Oftice. U.S. Depmtment of Energy