Embed Size (px)
Citation preview

May 14, 2010
100514R-2009 Site Investigation Report File: M09480A01.500
Seabridge Gold Inc. 106 Front Street East, Suite 400 Toronto, Ontario M5A 1E1 Mr. Jim Smolik Dear Mr. Smolik: Kerr Sulphurets Mitchell Project 2009 Site Investigation Report Enclosed please find our report on 2009 Site Investigations. This report presents results of 2009 field programs consisting of; site selection and characterization, mapping and geotechnical assessment of bedrock and surficial geology, geophysical surveying including ice radar, seismic refraction surveying, seismic surface wave shear soundings, resistivity soundings as well as geotechnical and hydrogeological drill hole testing. The report also covers sampling and geotechnical lab testing of core and grab sample materials. For convenience, a summary is included of all lab testing conducted by KCB to date (2008 and 2009) which is presented in Appendix V. The results of the 2009 concrete and roadbed aggregate laboratory sample testing program by Levelton are summarized and included in Appendix V. Yours truly,
KLOHN CRIPPEN BERGER LTD. Graham Parkinson, P. Geo. Project Manager
GP:us
SEABRIDGE GOLD INC. May 14, 2010 Kerr Sulphurets Mitchell Project 2009 Site Investigation Report
TABLE OF CONTENTS
PAGE
100514R-2009 Site Investigation Report File: M09480A01.500 Page i
1. INTRODUCTION ...................................................................................................1
2. 2009 SITE INVESTIGATION PROGRAMS .........................................................6
2.1 May 2009 Ice Radar Program ......................................................................6
2.2 June Geological Mapping and Geotechnical Site Assessments ...................8
2.2.1 Geotechnical Assessment of Water Storage Pond Dam Foundation Area ..................................................................................................8
2.2.2 Investigations of the Sulphurets Rock Storage Facility Area ........22
2.3 July 2009 Moraine and Till Sampling Program, Mine and TMF Areas ....24
2.4 July 2009 Line Cutting and Geophysical Seismic / Resistivity Programs .28
2.4.1 Mitchell Valley Area Geophysical Investigations .........................29
2.4.2 TMF Area Geophysical Investigations ..........................................32
2.5 September Geotechnical Borehole Drilling Programs ...............................33
2.5.1 Borehole Completion and Piezometer Well Installation ...............37
2.5.2 Hydrogeological Slug Testing .......................................................37
2.5.3 Packer Testing ................................................................................38
2.5.4 Geological Results of 2009 Mitchell Valley and Sulphurets Area Drill holes.......................................................................................38
3. 2009 LABORATORY TESTING PROGRAM .....................................................52
3.1 KCB Testing on Soils ................................................................................52
3.2 Testing of Rock Samples ...........................................................................53
3.3 Testing on Tailings ....................................................................................53
3.4 Testing on Aggregates ...............................................................................54
4. SUMMARY OF RESULTS OF 2009 SITE INVESTIGATIONS ........................57
4.1 Results of Investigations in Water Storage Facility Area ..........................57
4.2 Results of Site Investigations in Areas of Rock Storage Facilities ............57
4.2.1 Results for Mitchell – McTagg Rock Storage Facility Area .........57
4.3 Results for Mitchell Process Plant Area ....................................................58
SEABRIDGE GOLD INC. May 14, 2010 Kerr Sulphurets Mitchell Project 2009 Site Investigation Report
TABLE OF CONTENTS (continued)
100514R-2009 Site Investigation Report File: M09480A01.500 Page ii
4.3.1 Results for Sulphurets Ridge Rock Storage Facility......................59
4.4 Mine Area Borrow Materials and Surficial Moraine and Till Deposits ....60
4.5 TMF Area Site Investigation Results .........................................................61
5. RECOMMENDATIONS .......................................................................................63
TABLES
Table 2.1 Summary of 2009 Geotechnical Drilling Program ................................... 35
Table 2.2 Installed KCB 2009 Well Information ...................................................... 37
Table 2.3 Summary of KCB Borehole Bedrock Packer Testing Permeabilities ...... 38
Table 3.1 Laboratory Test Program of Soils ............................................................. 53
Table 3.2 Laboratory Testing Program of Tailings ................................................... 54
Table 3.3 Aggregate Testing Program ...................................................................... 55
FIGURES (IN TEXT)
Figure 1.1 Project Location Map .................................................................................. 2
Figure 2.1 Structural Features of the Sediments of the Mitchell / McTagg Valleys (Mapped by Henderson et al, 1992) .......................................................... 10
Figure 2.2 Airphoto of Water Storage Facility and Dam Site Area showing areas with no trees (avalanche tracks) ........................................................................ 11
Figure 2.3 Water Storage Facility Area, Structural Trends and Overburden thickness contours (m) .............................................................................................. 22
Figure 2.4 Locations of Geophysical Surveys (Seismic Lines, MASW Soundings and Resistivity Soundings), Upper Mitchell Valley Infrastructure Area. ....... 31
Figure 2.5 Location of North Dam seismic lines (in green, small numbers are depth to bedrock in m). Triangles indicate mapping station locations. .................. 32
Figure 2.6 Location of South Dam seismic lines (with depths to bedrock in m). Triangles indicate mapping station locations. ........................................... 33
Figure 2.7 Hy-Tech Geotechnical Drill Rig in Mitchell Valley at KC09-09 ............. 36
SEABRIDGE GOLD INC. May 14, 2010 Kerr Sulphurets Mitchell Project 2009 Site Investigation Report
TABLE OF CONTENTS (continued)
100514R-2009 Site Investigation Report File: M09480A01.500 Page iii
Figure 2.8 Locations of Mitchell Valley Geotechnical and Monitoring Drill holes .. 39
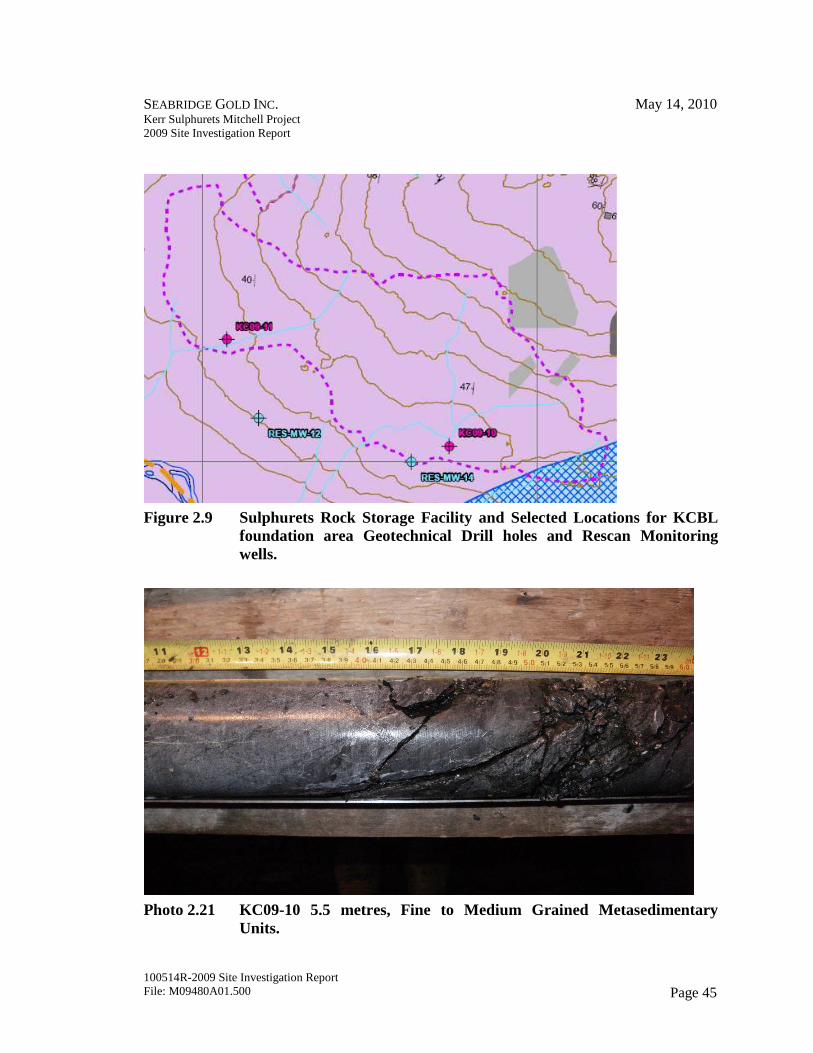
Figure 2.9 Sulphurets Rock Storage Facility and Selected Locations for KCBL foundation area Geotechnical Drill holes and Rescan Monitoring wells. 45
PHOTOS
Photo 2.1 View Looking Northwest at area downstream of WSP Dam and Avalanche Tracks...................................................................................... 12
Photo 2.2 Major Avalanche Chute located 300 m to South of WSF Damsite (looking NW of rock canyon of lower Mitchell Creek). ......................................... 13
Photo 2.3 Aerial View looking upstream along Lower Mitchell Creek bedrock canyon in area of WSP Dam Footprint. .................................................... 15
Photo 2.4 Gorge of Mitchell Creek in Area of Water Treatment Dam Upstream Toe Area (looking south). ................................................................................ 16
Photo 2.5 Intrusive dykes and more resistant fine sandstone layers within finely bedded north-northwest dipping siltstone sediments (looking south). ..... 17
Photo 2.6 Locally folded and deformed sediments ................................................... 18
Photo 2.7 Bedding planes exposed on east bank of Water Treatment Pond area. .... 19
Photo 2.8 Slickensides on bedding planes exposed in Mitchell Creek Canyon ........ 20
Photo 2.9 Finely Bedded, NW dipping Sediments in Sulphurets RSF Foundation .. 23
Photo 2.10 Shane Warner sampling basal till in TMF North Dam area. .................... 25
Photo 2.11 Eroded knife edge of 30 m high silty to sandy gravel. This is a moraine deposit situated over basal till and lacustrine silt layers at confluence of McTagg and Mitchell creeks. ................................................................... 26
Photo 2.12 Dense, consolidated silty to clayey High Plasticity Lacustrine Deposit, Situated beneath Moraine Deposits, Valley Bottom at Mitchell-McTagg Confluence. Sample Site 37. ..................................................................... 27
Photo 2.13 Fine grained, silty sand deposit located on west bank of Water Storage Pond – potential dam core material. 56.516368°N, -130.330842E. ......... 28
Photo 2.14 Volcanics from KC09-07 Depths of 9.6 m to 10.0 m ............................. 40
Photo 2.15 Moraine and Boulder Intersections in KC09-08 at Depth 3.0 m .............. 41
SEABRIDGE GOLD INC. May 14, 2010 Kerr Sulphurets Mitchell Project 2009 Site Investigation Report
TABLE OF CONTENTS (continued)
100514R-2009 Site Investigation Report File: M09480A01.500 Page iv
Photo 2.16 KC09-08 High RQD Andesite Tuff at Depth of 36 m .............................. 41
Photo 2.17 KC09-08 Fault Zone Consistent with Location of Sulphurets Thrust Trace. Depth 44 m ................................................................................................ 41
Photo 2.18 KC09-09 50 cm thick Sand Layer at 27.3 m depth ................................... 42
Photo 2.19 KC09-09 2.5m thick layer of Silty Fine Sand at 73 m ............................. 43
Photo 2.20 KC09-09 Argillites with quartz veining, Depth 117.5 m to 126.3 m ....... 43
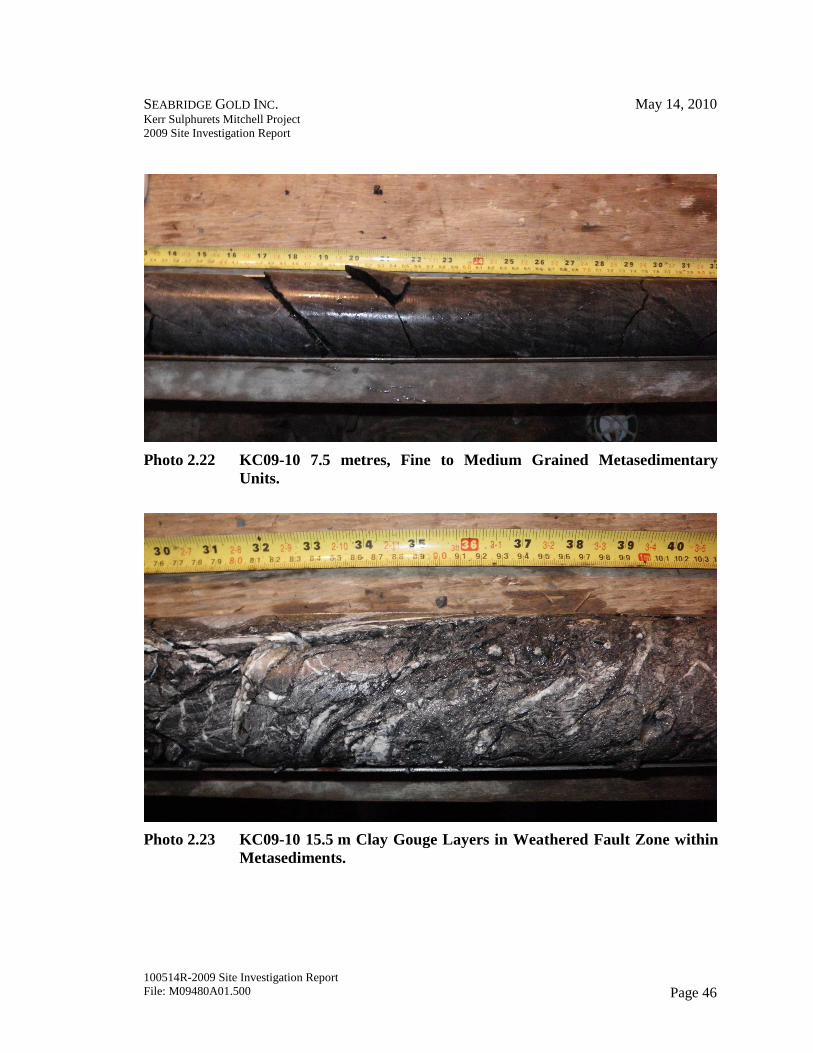
Photo 2.21 KC09-10 5.5 metres, Fine to Medium Grained Metasedimentary Units .. 45
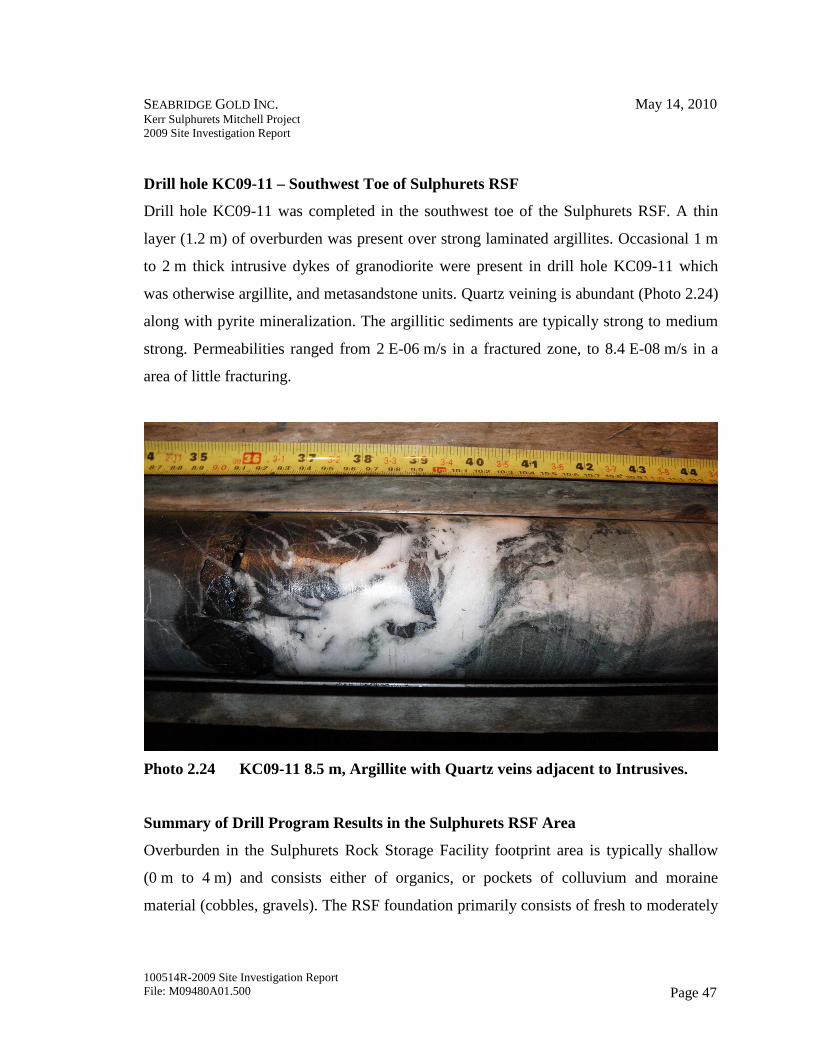
Photo 2.22 KC09-10 7.5 metres, Fine to Medium Grained Metasedimentary Units .. 46
Photo 2.23 KC09-10 15.5 m Clay Gouge Layers in Weathered Fault Zone within Metasediments .......................................................................................... 46
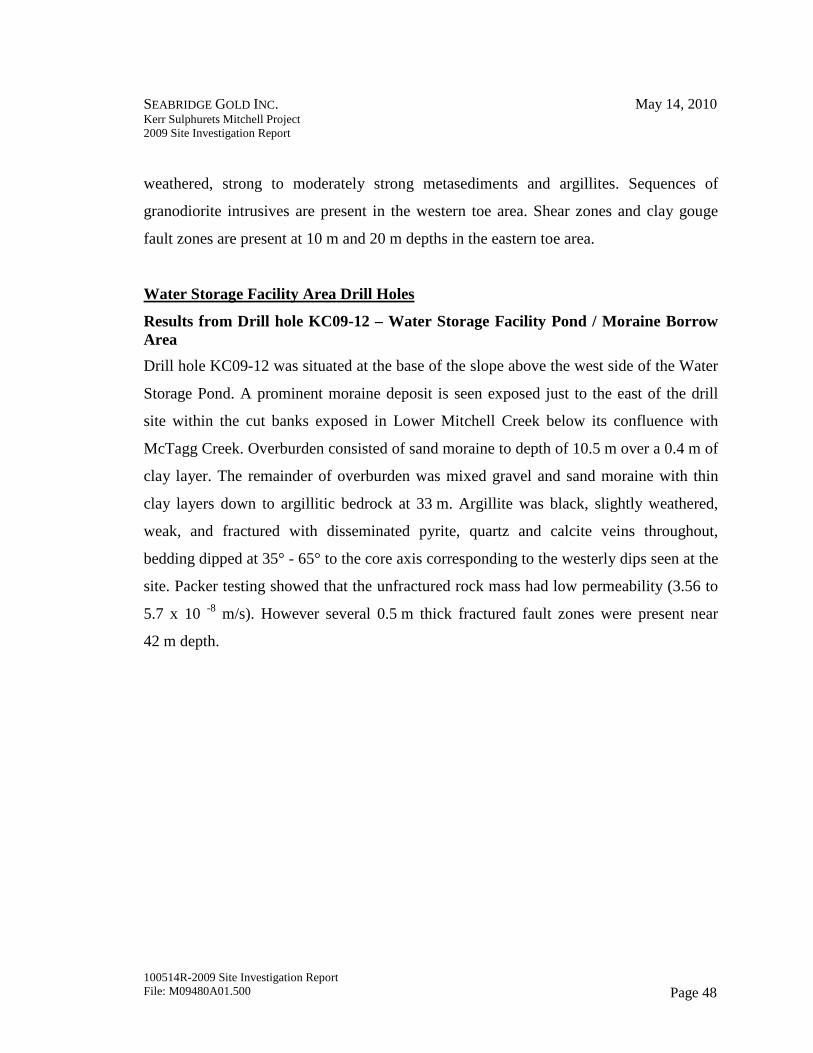
Photo 2.24 KC09-11 8.5 m, Argillite with Quartz veins adjacent to Intrusives ......... 47
Photo 2.25 Typical Core from KC09-12. Finely bedded siltstone with quartz veins and kink band deformational folding (47 m to 48.1 m) ............................ 49
Photo 2.26 Typical Core from KC09-13, bedded argillite with quartz veins (10.5 m to 11.0 m) ...................................................................................................... 50
DRAWINGS (END OF TEXT)
D-1001 Project Area Site Plan
D-1011 Mine Area Drill Hole Locations
D-1102 TMF Site Investigation Plan
D-1127 TMF Area Regional Surficial Geology and Bedrock Structural Features
D-1128 TMF Impoundment Area Surficial Geology and Bedrock Structural Geology
D-1202 Mine Site Investigation Plan
D-1203 Mine Area Lithology, Structural Geology and Overburden Thickness
D-1226 Mitchell Process Plant Overburden Thickness Plan Map
D-1227 Geological Profiles of Water Storage Pond Dam Site
SEABRIDGE GOLD INC. May 14, 2010 Kerr Sulphurets Mitchell Project 2009 Site Investigation Report
TABLE OF CONTENTS (continued)
100514R-2009 Site Investigation Report File: M09480A01.500 Page v
PHOTO PLATES (Appendix VI)
1. Mitchell Valley and Mitchell Glacier Looking North
2. Mitchell Valley and Lower Mitchell Looking South
3. Mitchell Glacier Near Peak Glacier Melt, July 2, 2008 ~ 50 m3/s
4. Collapse of Mitchell Glacier Toe, Sept 13, 2007
5. Aerial Photo, Mitchell Glacier June 26, 2008
6. Bedrock Exposed at Toe of Mitchell Glacier
7. Shallow sediments and rock exposed at Toe of Mitchell Glacier
8. Aerial Photo, Mitchell Glacier Toe, July 2, 2008
9. Mitchell Glacier Sub-Glacial Channel, Sept. 7, 2007
10. Massive altered volcanic bedrock, Mitchell Glacier toe area
11. Sediments exposed by retreat of glacier, South side, Mitchell Glacier
12. Mitchell Glacier toe on bedrock, South Side
13. Avalanche soil deposits to north, medial moraine in centre, Mitchell Glacier
14. McTagg Valley and RSF area, looking south at Stage 1 Diversion Inlet Area
15. Detail of McTagg Diversion Inlet area and West branch of McTagg Glacier
16. East McTagg Glacier and lateral moraine deposits, July 9, 2009
17. West McTagg Glacier toe and lateral moraine deposits, route of north diversion
18. Avalanche chute and moraine/till deposit, East side, mid McTagg valley
19. Mitchell and Sulphurets Valleys looking East from above WSP area
20. Eroded knife edge of moraine deposit above Mitchell creek at confluence with McTagg
21. Looking downstream in WSF impoundment at sedimentary bedding of Argillites, siltstones and sandstones
22. Sulphurets Lake and Ridge looking North
23. Sulphurets Lake and Valley looking Northeast
24. Sulphurets Glacier toe, valley and area of Mitchell Diversion outlet
SEABRIDGE GOLD INC. May 14, 2010 Kerr Sulphurets Mitchell Project 2009 Site Investigation Report
TABLE OF CONTENTS (continued)
100514R-2009 Site Investigation Report File: M09480A01.500 Page vi
25. Looking north at Mitchell glacier and route of Mitchell-Teigen tunnel from Sulphurets Ridge top
26. Looking north at Treaty valley and route of Mitchell-Teigen tunnel and Saddle Area
27. Aerial view of striations in sedimentary rock and small lakes at Teigen plantsite
28. TMF valley looking north from impoundment
29. TMF valley looking south from South dam site.
30. TMF valley, east wall, region to potential expansion dam site farther south
APPENDICES
Appendix I 2009 KCBL Geotechnical Borehole Logs and Core Photos
Appendix II Report on Seismic Refraction, MASW and Resistivity Sounding, Frontier Geosciences (2009)
Appendix III 2009 KSM Glacier Ice Radar Investigation Report
Appendix IV Borehole Hydrogeology Testing Results
Appendix V 2009/2010 KCBL and Levelton Laboratory Testing Results
Appendix VI Photo Plates
SEABRIDGE GOLD INC. May 14, 2010 Kerr Sulphurets Mitchell Project 2009 Site Investigation Report
100514R-2009 Site Investigation Report File: M09480A01.500 Page 1
1. INTRODUCTION
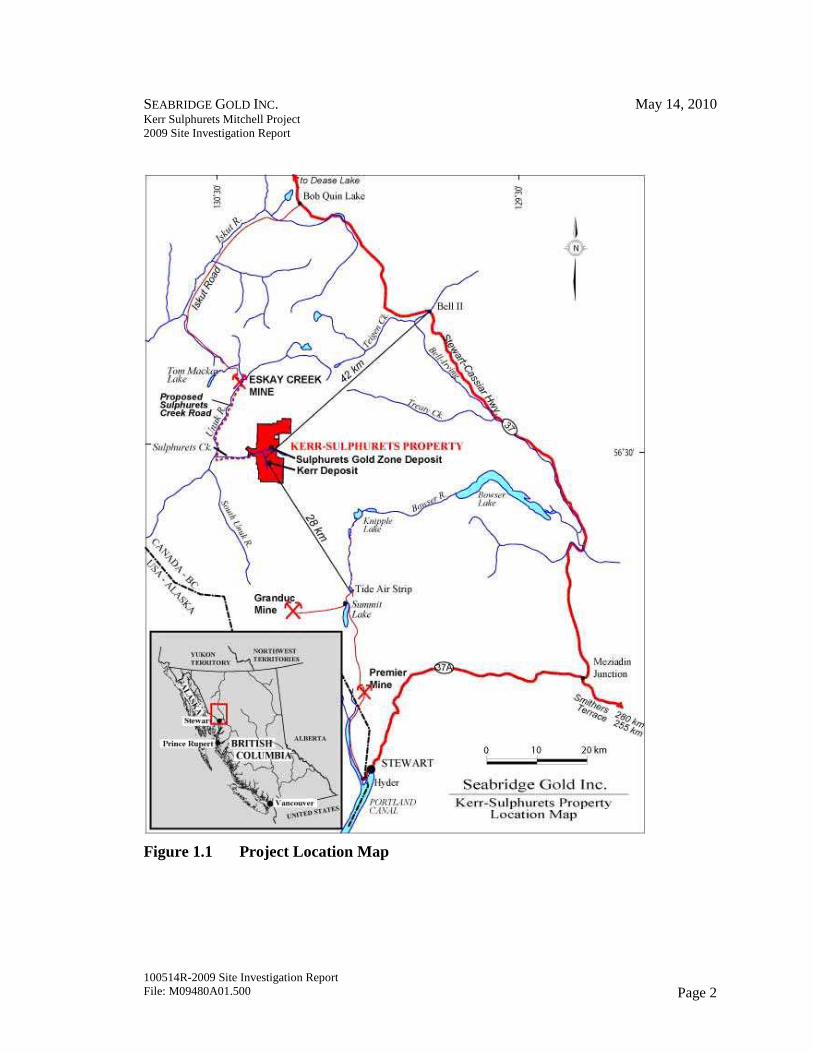
The Kerr-Sulphurets-Mitchell (KSM) property shown in Figure 1.1 is a very large
gold / copper project located in the mountainous terrain of northwest British Columbia at
latitude 56° 30’ N and longitude 130° 20’ W, approximately 1,545 km northwest of
Vancouver, B.C. and approximately 65 km northwest of Stewart, B.C. The project area
lies within the Coast Mountains, and is bounded to the north, south, and east by glaciers
and ice fields and to the west by the Unuk River Valley which drains into Alaskan
waters. To the east, the project area drains towards Canadian waters via the Treaty and
Bell-Irving rivers which ultimately drain to the Nass River system. The Alaska border is
approximately 30 km southwest of the mine site.
SEABRIDGE GOLD INC. May 14, 2010 Kerr Sulphurets Mitchell Project 2009 Site Investigation Report
100514R-2009 Site Investigation Report File: M09480A01.500 Page 2
Figure 1.1 Project Location Map
SEABRIDGE GOLD INC. May 14, 2010 Kerr Sulphurets Mitchell Project 2009 Site Investigation Report
100514R-2009 Site Investigation Report File: M09480A01.500 Page 3
During 2009, Klohn Crippen Berger Ltd. (KCBL) carried out three site investigation
programs for Seabridge Gold’s KSM Project. These programs expanded on previous site
investigations conducted in 2008 (Klohn, 2009) which consisted of mapping, sampling
and geotechnical drilling). The 2008 and 2009 site investigations together provided the
basis of information for a Pre-Feasibility Study (PFS) being conducted in 2010. The three
2009 field programs consisted of:
1. April-May 2009 Ice radar thickness and bedrock topography studies of the Mitchell Glacier and Johnstone Icefield.
2. June 2009 Mine area engineering geological mapping was completed. In addition, reviews of the mine area and TMF area were conducted as part of site foundation assessments. A sampling program was completed to characterize borrow and foundation materials. Till, moraine, alluvials and plastic materials were sampled for suitability testing for use as low permeability covers and dam core. In the Mitchell valley and the TMF area, a geophysical program was completed including; line cutting, seismic refraction overburden thickness profiling / surface wave seismic shear wave velocity sounding and resistivity soundings.
3. September 2009 Geotechnical drilling completed in the Mitchell valley, Water Storage Pond areas and at the Sulphurets Rock Storage Facility. Drilling consisted of overburden coring and STP testing along with bedrock coring and packer testing.
Objectives of the 2009 KCBL site investigation programs are described in general here.
Details of methods and findings are presented in following sections of the report.
The ice radar program was carried out to investigate the lower portion of Mitchell Glacier
in the area of the Mitchell Diversion Tunnel (MDT) and the Mitchell-Teigen Tunnel
(MTT) route under the Johnstone Icefield. The purpose of this work was to examine
thickness of ice and rock cover over the tunnels under the glaciers and to set the elevation
SEABRIDGE GOLD INC. May 14, 2010 Kerr Sulphurets Mitchell Project 2009 Site Investigation Report
100514R-2009 Site Investigation Report File: M09480A01.500 Page 4
and location of the Mitchell Diversion Tunnel inlet. This program is reported on in a
separate document (Klohn, 2009a) which is included as Appendix III of this report.
In June 2009, Graham Parkinson P. Geo. (KCBL Project Manager,) Harvey McLeod
P.Eng., P.Geo. (Senior Reviewer, KCBL) and Shane Warner E.I.T. (Geological Engineer,
KCBL) made a 5 day visit to site to extend existing mapping, examine foundation
conditions in more detail and outline site investigation work required for the Pre-
Feasibility Study, based on designs developed earlier for the 2009 Preliminary Economic
Analysis. The entire project area was reviewed to identify potential opportunities,
alternatives and challenges at each facility site.
Shane Warner stayed at site for the remainder of June and managed line cutting for a
refraction seismic and resistivity program carried out by Frontier Geoscience Inc. in
Mitchell valley and a seismic program in the TMF area in July 2009. Mr Warner was on
site to supervise line cutting, drill site location and pad construction as well as to conduct
surficial mapping and sampling.
In September 2009, Shane Warner and Ann Wen of KCBL completed a seven hole
geotechnical drilling program in the Mitchell Infrastructure Area, Mitchell Closure Dam,
Sulphurets Rock RSF (SRD) and Water Storage Dam (WSD) sites to assess Rock Storage
Facility and the Water Storage dam (WSD) foundation conditions in preparation for PFS
level design. In total 396 m of geotechnical drilling, SPT, packer testing and piezometer
well installations were completed.
This report was prepared by Klohn Crippen Berger Ltd. for the account of Seabridge
Gold Inc. The material in it reflects Klohn Crippen Berger’s best judgment in light of the
information available to it at the time of preparation. Any use which a third party makes
of this report, or any reliance on or decisions to be made based on it, are the
SEABRIDGE GOLD INC. May 14, 2010 Kerr Sulphurets Mitchell Project 2009 Site Investigation Report
100514R-2009 Site Investigation Report File: M09480A01.500 Page 5
responsibility of such third parties. Klohn Crippen Berger Ltd. accepts no responsibility
for damages, if any, suffered by any third party as a result of decisions made or actions
based on this report.
SEABRIDGE GOLD INC. May 14, 2010 Kerr Sulphurets Mitchell Project 2009 Site Investigation Report
100514R-2009 Site Investigation Report File: M09480A01.500 Page 6
2. 2009 SITE INVESTIGATION PROGRAMS
2.1 May 2009 Ice Radar Program
An Ice Radar program was conducted in early May 2009 when sufficient snow was
present to allow safe passage over crevasses, before the onset of significant melting and
water saturation which would impede the use of radar. A significant complication to
conducting the survey was the higher than expected avalanche activity. During the period
of the survey major avalanches began falling onto Mitchell Glacier from the slope on the
North Side of the valley. At the end of the survey avalanches were falling from the south
slopes. Photos of the avalanche paths are included in the Ice Radar Report (Appendix III).
The program was able to complete the objectives of the survey which were to delineate
the thickness of the ice and bedrock topography in the area of the proposed Mitchell
Diversion Tunnel inlet structures. A short summary or the Ice Radar Report is provided
in the following sections.
Contour plans of ice thickness (Appendix III, Figure 8) and bedrock elevation
(Appendix III, Figure 9) were drawn up using radar ice thickness data and elevation
information compiled from partial Lidar coverage in the area. BC TRIM contours were
used where Lidar was not available. TRIM data was used where bedrock was exposed,
but is outdated for the glacier surface area as the ice surface has changed significantly
since the 1995 TRIM data was created. In areas where mapped elevations were outdated,
GPS elevation measurements taken on the ice during the survey were used.
Ice thickness in the area of the ultimate Mitchell Glacier diversion inlet (Photo Plates 1 to
13 in this report and Appendix III, Figure 8, 424000E, 6265850N) was found to be
approximately 110 m, with bedrock interpreted to be present at approximately 860 m.
The bedrock channel was relatively narrow, and similar to the rock flanked, sediment
SEABRIDGE GOLD INC. May 14, 2010 Kerr Sulphurets Mitchell Project 2009 Site Investigation Report
100514R-2009 Site Investigation Report File: M09480A01.500 Page 7
based area exposed at the glacier mouth. The ice radar survey suggested that the sub
glacial channel is “U” shaped and on the order of 75 m wide at a height of 20 m from the
base and 40 m wide at a height of 10 m.
Radar data indicated that the gradient of the sub glacial channel in the first 500 m
upstream from the present glacier toe is 8%. In the next 500 m upstream from this point
the gradient was indicated to be 20%, this change in gradient is consistent with the
pattern of crevasses noted in the air photos, which suggest that the flow of ice is flexing
and opening tension cracks over this area of steepened bed topography.
The radar method indistinctly resolved features that were interpreted as a sediment layer
of up to 10 m in thickness situated beneath the glacier ice bottom.
Repeat measurements made during the survey using two separate radar systems of
different design and frequency suggested that the accuracy of the method was on the
order of 10% of the depth of the ice.
In the area of the proposed diversion inlet structure, access for the ice radar survey was
limited by safety concerns regarding working on the glacier and limited access available
to sections of the lines due to the avalanche risk experienced during May.
The primary technical limitations on the accuracy of rock elevations results from the
radar survey were uncertainties about ice elevation, and the effects of the observed steep
bedrock surface topography on the interpretation of the data (lateral bounce / wave
migration effect). The steep sided rock valley topography under the glacier also results in
a large sensitivity of the reported depth to location and the orientation and beam pattern
of the radar system used.
SEABRIDGE GOLD INC. May 14, 2010 Kerr Sulphurets Mitchell Project 2009 Site Investigation Report
100514R-2009 Site Investigation Report File: M09480A01.500 Page 8
Recommendations for further Mitchell glacier investigations include completion of
several boreholes in the diversion intake area to confirm ice radar survey results. In the
area of the intake, additional detail ice radar surveying would be useful to reduce drilling
costs required to precisely locate the rock channel. This work would best be scheduled
for either earlier, or later in the year than the month of May to avoid spring avalanche
risks.
A single line of ice radar surveying was also completed along the section of the
Johnstone Icefield thought to be the deepest section of ice over the Mitchell-Teigen
tunnel route. Ice thicknesses along the line surveyed in this area varied between 130 m
and 190 m, corresponding to bedrock elevations between 1620 m and 1560 m.
Appendix III presents details of the ice radar program.
2.2 June Geological Mapping and Geotechnical Site Assessments
2.2.1 Geotechnical Assessment of Water Storage Pond Dam Foundation Area
A major goal of the June 2009 KCBL mapping/geotechnical program was to characterize
the area of the Mitchell valley Water Storage Facility and the site of the Water Storage
Dam.
The valley bottom in this area was previously unmapped, likely due to difficult access
within the steep and narrow gorge that Mitchell Creek has eroded into the Upper Triassic
Stuhini Group sedimentary rocks. The Eastern facies of the Stuhini sediments exposed in
this area consist of the lower member of two sequences of laminated, turbiditic
argillaceous siltstone, sandstones and mudstone separated by pyroxene phyric
(porphyritic) flows, breccia and conglomerate seen at higher elevations (Bridge, 1990).
SEABRIDGE GOLD INC. May 14, 2010 Kerr Sulphurets Mitchell Project 2009 Site Investigation Report
100514R-2009 Site Investigation Report File: M09480A01.500 Page 9
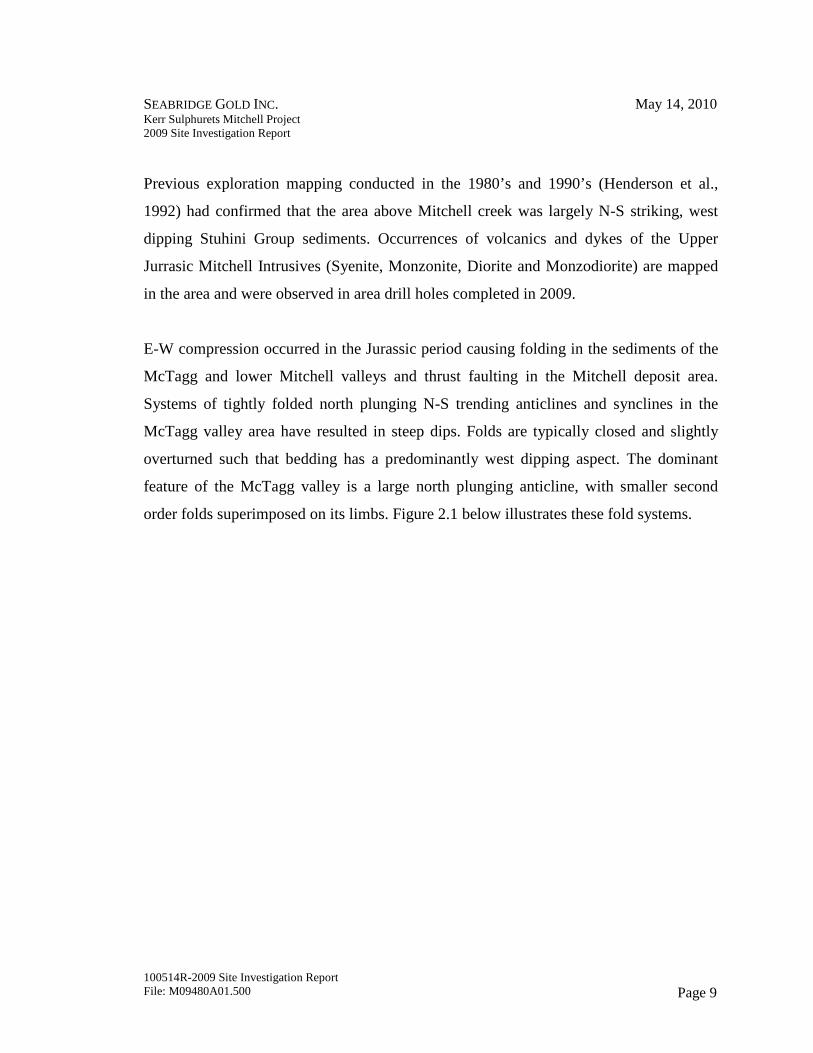
Previous exploration mapping conducted in the 1980’s and 1990’s (Henderson et al.,
1992) had confirmed that the area above Mitchell creek was largely N-S striking, west
dipping Stuhini Group sediments. Occurrences of volcanics and dykes of the Upper
Jurrasic Mitchell Intrusives (Syenite, Monzonite, Diorite and Monzodiorite) are mapped
in the area and were observed in area drill holes completed in 2009.
E-W compression occurred in the Jurassic period causing folding in the sediments of the
McTagg and lower Mitchell valleys and thrust faulting in the Mitchell deposit area.
Systems of tightly folded north plunging N-S trending anticlines and synclines in the
McTagg valley area have resulted in steep dips. Folds are typically closed and slightly
overturned such that bedding has a predominantly west dipping aspect. The dominant
feature of the McTagg valley is a large north plunging anticline, with smaller second
order folds superimposed on its limbs. Figure 2.1 below illustrates these fold systems.
SEABRIDGE GOLD INC. May 14, 2010 Kerr Sulphurets Mitchell Project 2009 Site Investigation Report
100514R-2009 Site Investigation Report File: M09480A01.500 Page 10
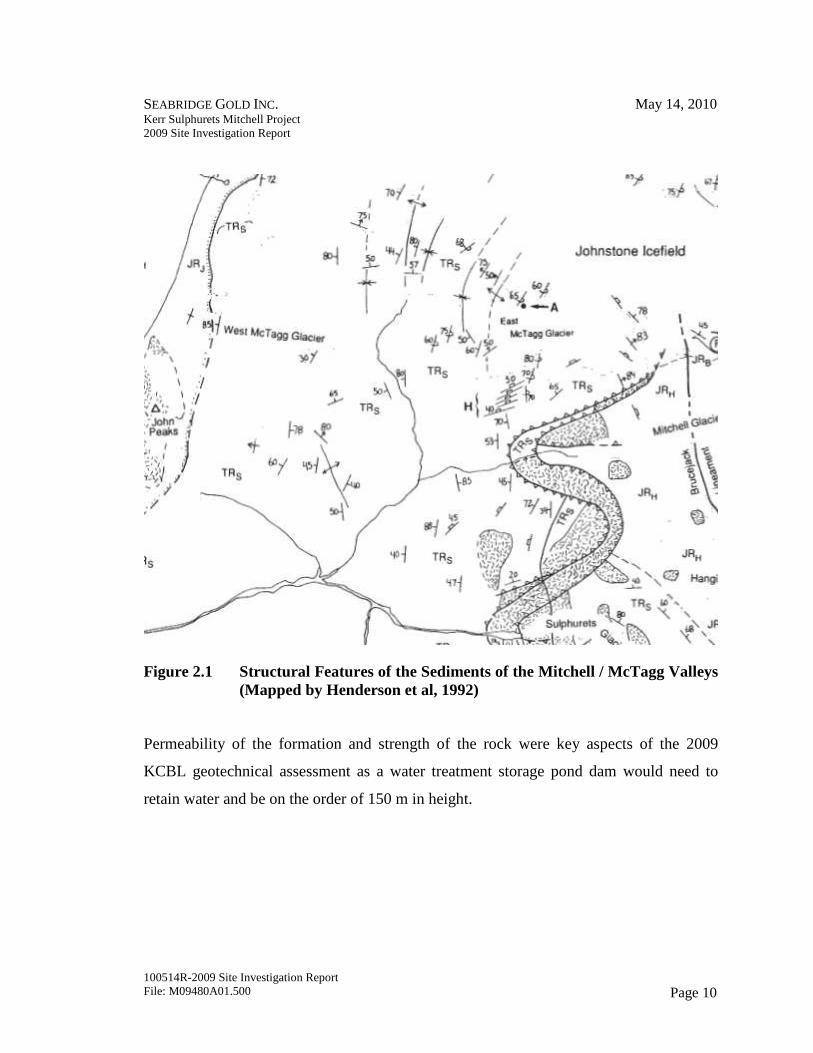
Figure 2.1 Structural Features of the Sediments of the Mitchell / McTagg Valleys (Mapped by Henderson et al, 1992)
Permeability of the formation and strength of the rock were key aspects of the 2009
KCBL geotechnical assessment as a water treatment storage pond dam would need to
retain water and be on the order of 150 m in height.
SEABRIDGE GOLD INC. May 14, 2010 Kerr Sulphurets Mitchell Project 2009 Site Investigation Report
100514R-2009 Site Investigation Report File: M09480A01.500 Page 11
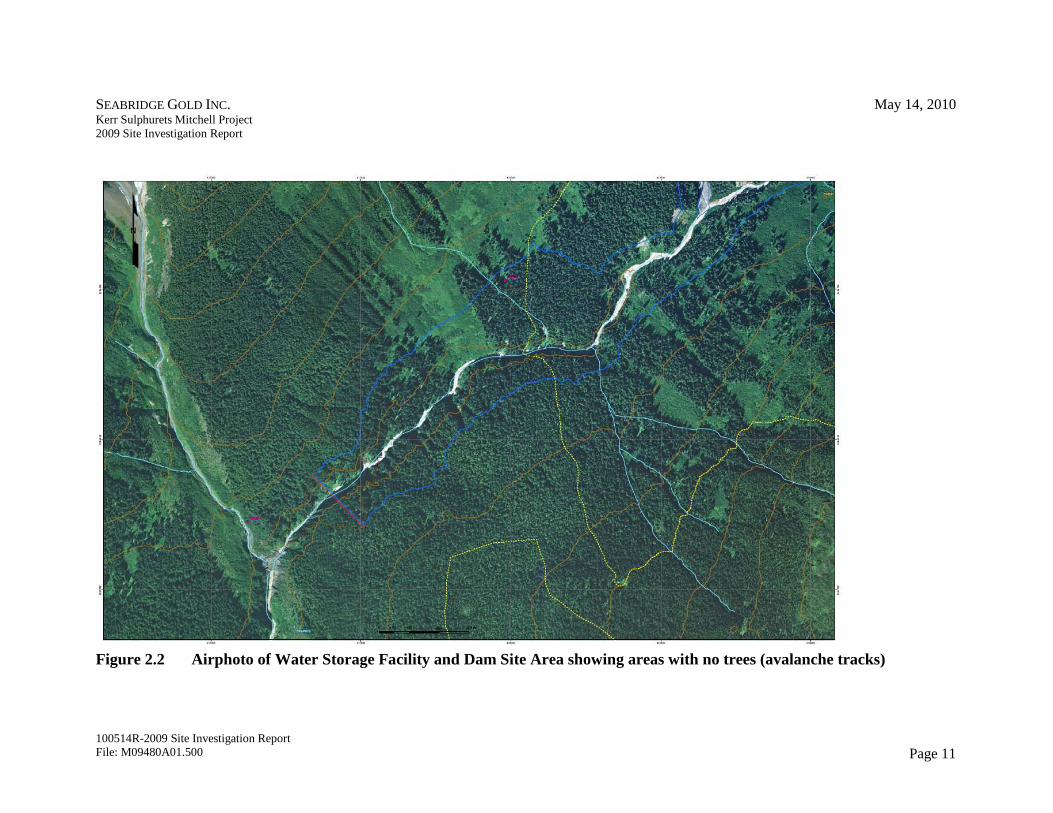
Figure 2.2 Airphoto of Water Storage Facility and Dam Site Area showing areas with no trees (avalanche tracks)
SEABRIDGE GOLD INC. May 14, 2010 Kerr Sulphurets Mitchell Project 2009 Site Investigation Report
100514R-2009 Site Investigation Report File: M09480A01.500 Page 12
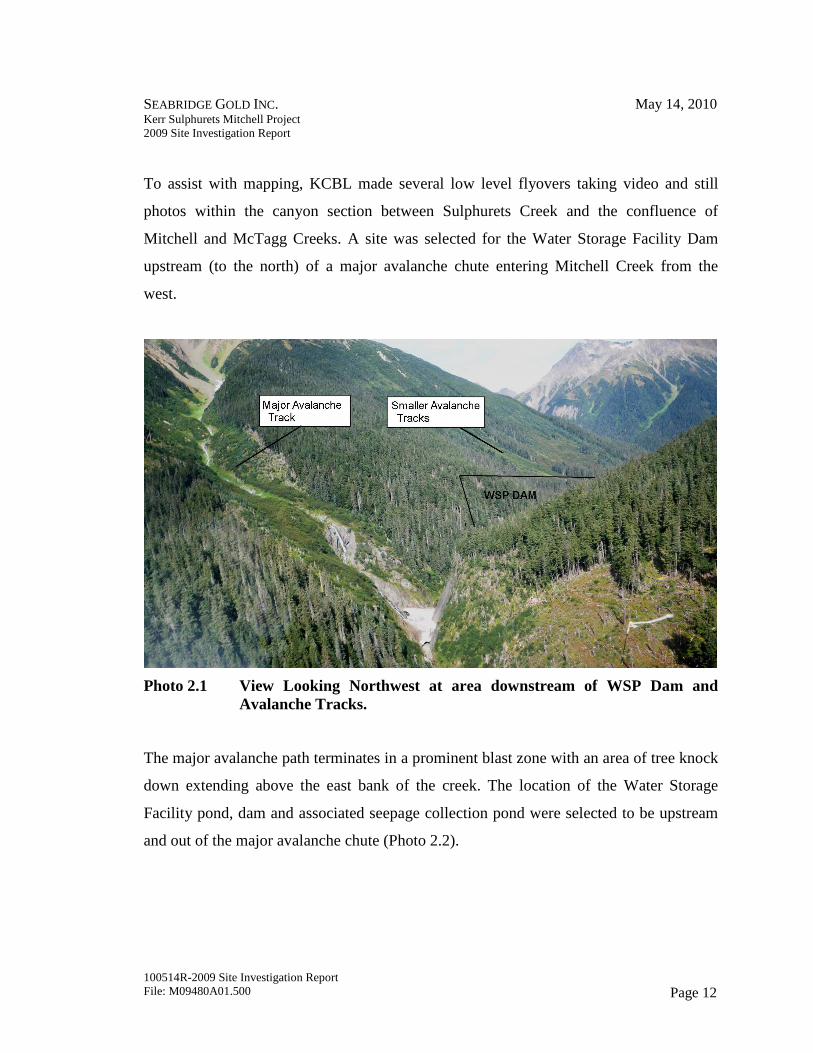
To assist with mapping, KCBL made several low level flyovers taking video and still
photos within the canyon section between Sulphurets Creek and the confluence of
Mitchell and McTagg Creeks. A site was selected for the Water Storage Facility Dam
upstream (to the north) of a major avalanche chute entering Mitchell Creek from the
west.
Photo 2.1 View Looking Northwest at area downstream of WSP Dam and Avalanche Tracks.
The major avalanche path terminates in a prominent blast zone with an area of tree knock
down extending above the east bank of the creek. The location of the Water Storage
Facility pond, dam and associated seepage collection pond were selected to be upstream
and out of the major avalanche chute (Photo 2.2).
SEABRIDGE GOLD INC. May 14, 2010 Kerr Sulphurets Mitchell Project 2009 Site Investigation Report
100514R-2009 Site Investigation Report File: M09480A01.500 Page 13
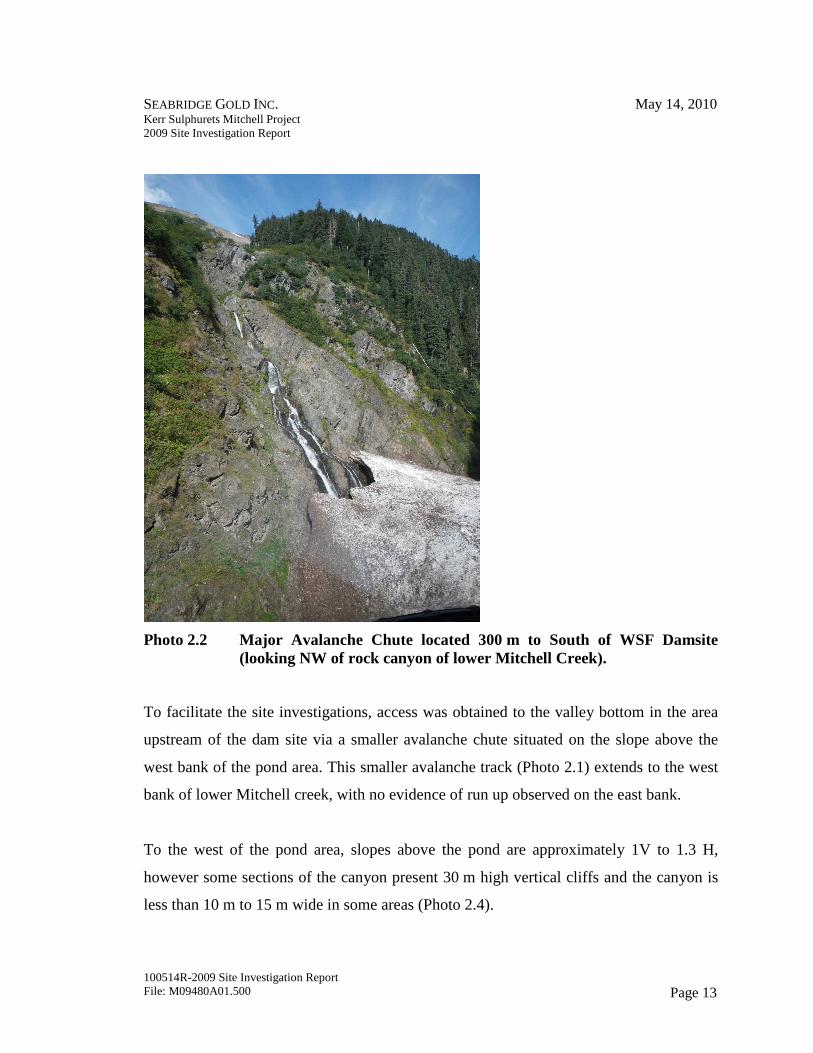
Photo 2.2 Major Avalanche Chute located 300 m to South of WSF Damsite (looking NW of rock canyon of lower Mitchell Creek).
To facilitate the site investigations, access was obtained to the valley bottom in the area
upstream of the dam site via a smaller avalanche chute situated on the slope above the
west bank of the pond area. This smaller avalanche track (Photo 2.1) extends to the west
bank of lower Mitchell creek, with no evidence of run up observed on the east bank.
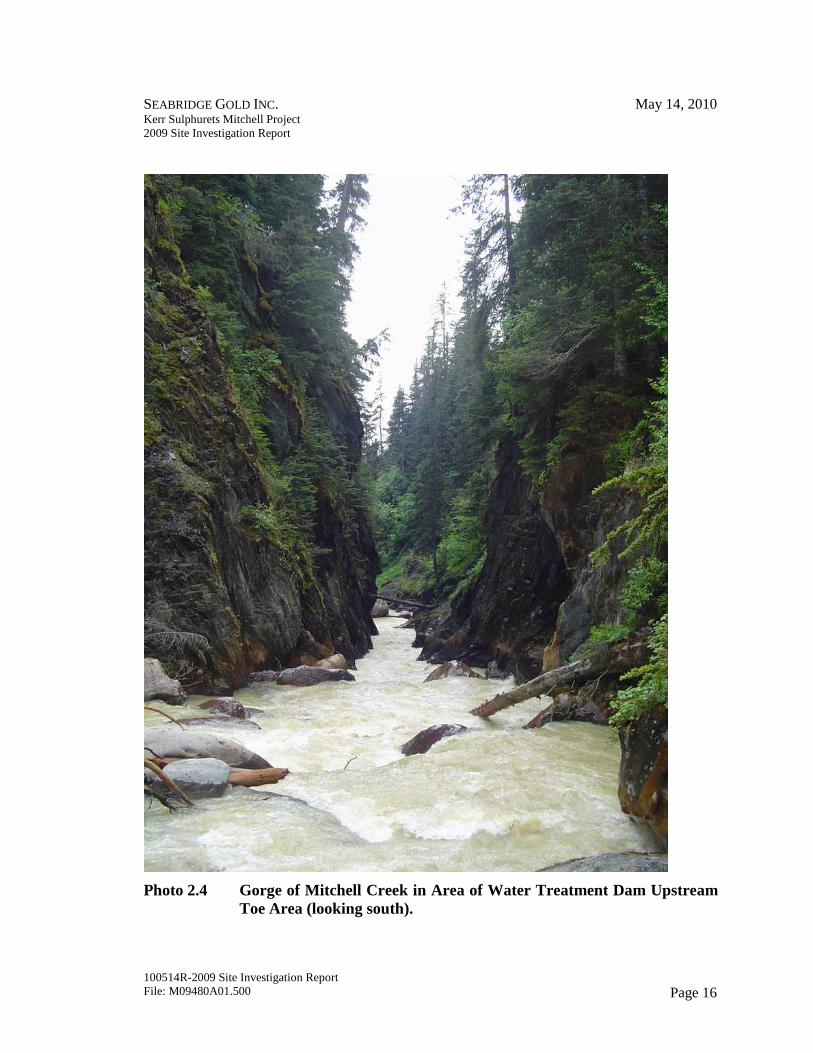
To the west of the pond area, slopes above the pond are approximately 1V to 1.3 H,
however some sections of the canyon present 30 m high vertical cliffs and the canyon is
less than 10 m to 15 m wide in some areas (Photo 2.4).
SEABRIDGE GOLD INC. May 14, 2010 Kerr Sulphurets Mitchell Project 2009 Site Investigation Report
100514R-2009 Site Investigation Report File: M09480A01.500 Page 14
Drawing D-1202 presents a Mine Area geology map which includes the area of the Water
Storage Facility.
Drawing 8 presents geology of the area of the Water Storage Facility as mapped by
KCBL. Drawing 8 consists of a series of profiles, photos and a plan view of the damsite
area.
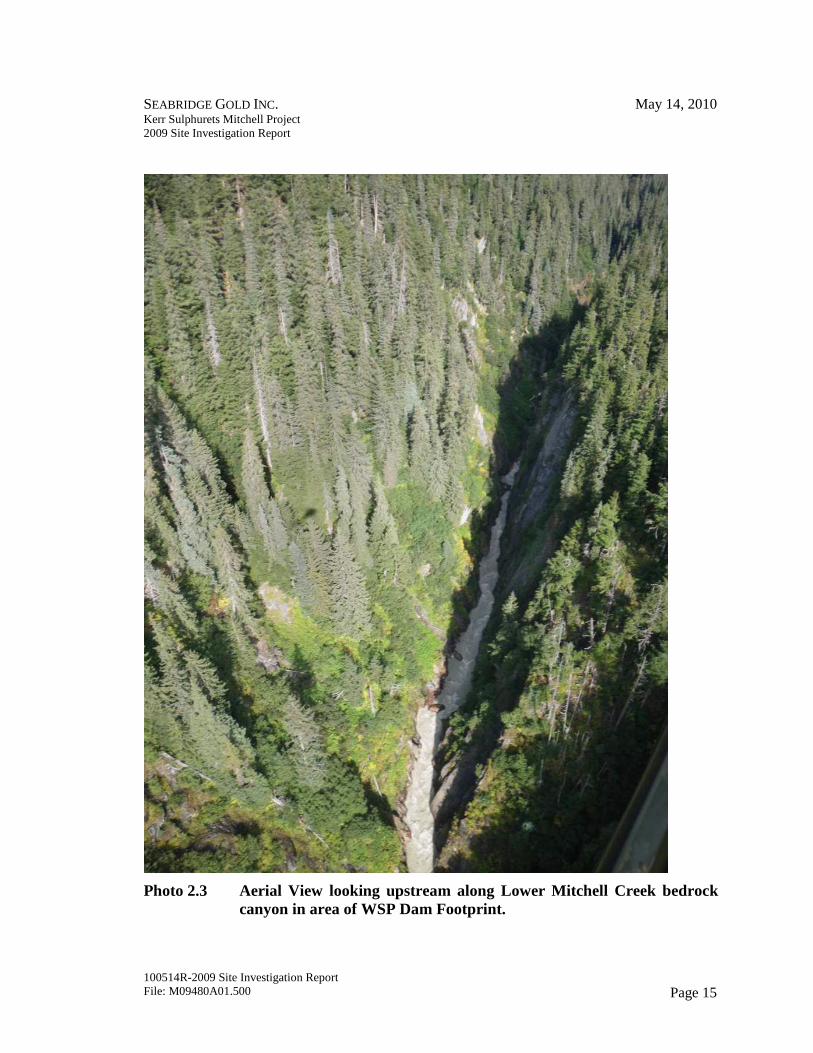
The in situ, unweathered rocks exposed by river erosion in the valley floor of Mitchell
Creek immediately upstream of the Water Storage Damsite are generally hard (R4 to R5)
and competent siltstones, sandstones and argillites.
SEABRIDGE GOLD INC. May 14, 2010 Kerr Sulphurets Mitchell Project 2009 Site Investigation Report
100514R-2009 Site Investigation Report File: M09480A01.500 Page 15
Photo 2.3 Aerial View looking upstream along Lower Mitchell Creek bedrock canyon in area of WSP Dam Footprint.
SEABRIDGE GOLD INC. May 14, 2010 Kerr Sulphurets Mitchell Project 2009 Site Investigation Report
100514R-2009 Site Investigation Report File: M09480A01.500 Page 16
Photo 2.4 Gorge of Mitchell Creek in Area of Water Treatment Dam Upstream Toe Area (looking south).
SEABRIDGE GOLD INC. May 14, 2010 Kerr Sulphurets Mitchell Project 2009 Site Investigation Report
100514R-2009 Site Investigation Report File: M09480A01.500 Page 17
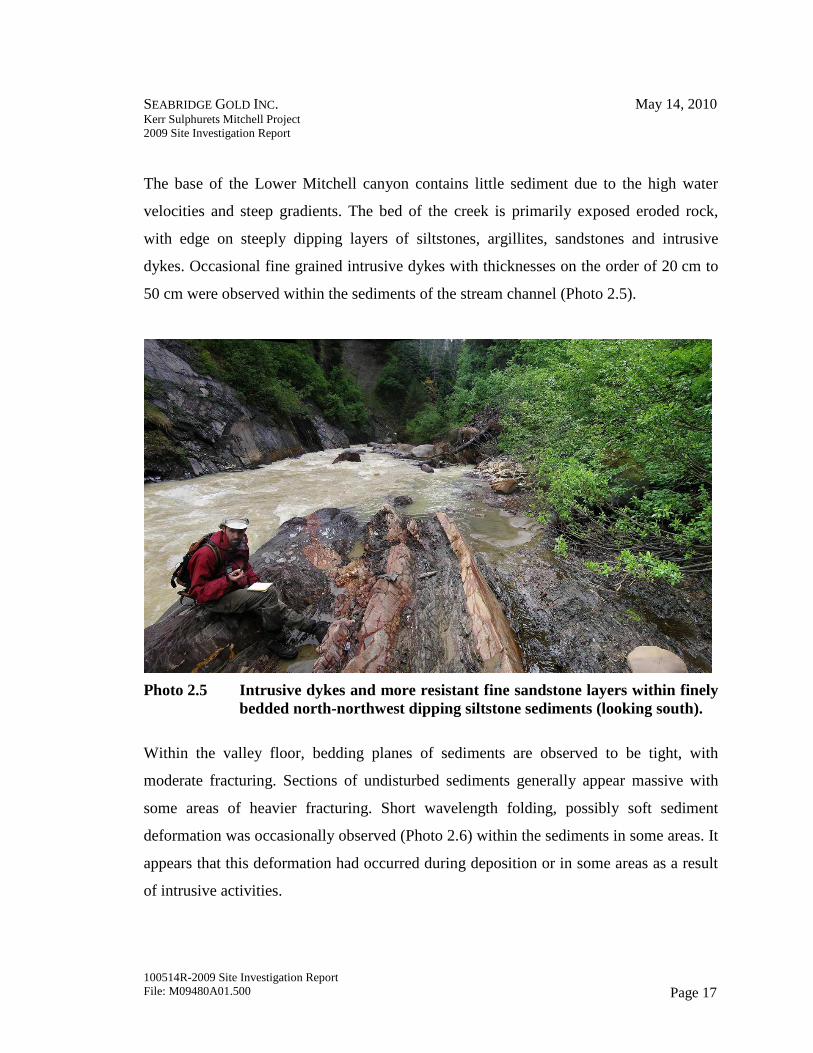
The base of the Lower Mitchell canyon contains little sediment due to the high water
velocities and steep gradients. The bed of the creek is primarily exposed eroded rock,
with edge on steeply dipping layers of siltstones, argillites, sandstones and intrusive
dykes. Occasional fine grained intrusive dykes with thicknesses on the order of 20 cm to
50 cm were observed within the sediments of the stream channel (Photo 2.5).
Photo 2.5 Intrusive dykes and more resistant fine sandstone layers within finely bedded north-northwest dipping siltstone sediments (looking south).
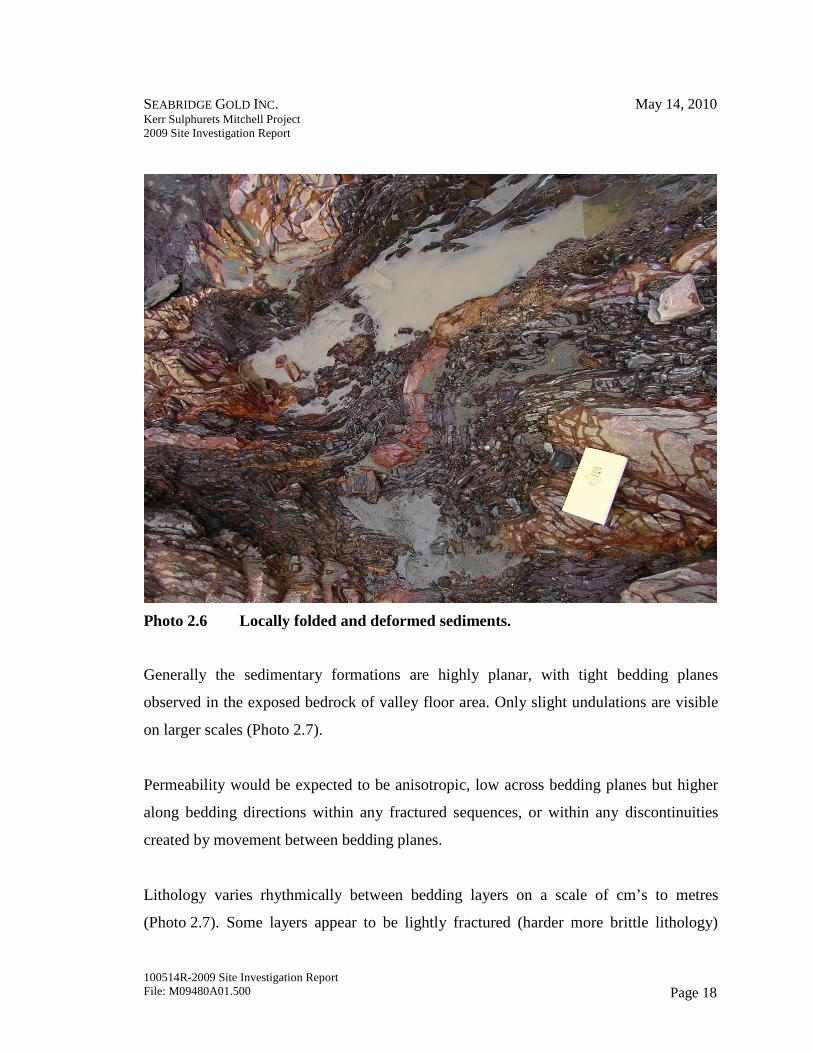
Within the valley floor, bedding planes of sediments are observed to be tight, with
moderate fracturing. Sections of undisturbed sediments generally appear massive with
some areas of heavier fracturing. Short wavelength folding, possibly soft sediment
deformation was occasionally observed (Photo 2.6) within the sediments in some areas. It
appears that this deformation had occurred during deposition or in some areas as a result
of intrusive activities.
SEABRIDGE GOLD INC. May 14, 2010 Kerr Sulphurets Mitchell Project 2009 Site Investigation Report
100514R-2009 Site Investigation Report File: M09480A01.500 Page 18
Photo 2.6 Locally folded and deformed sediments.
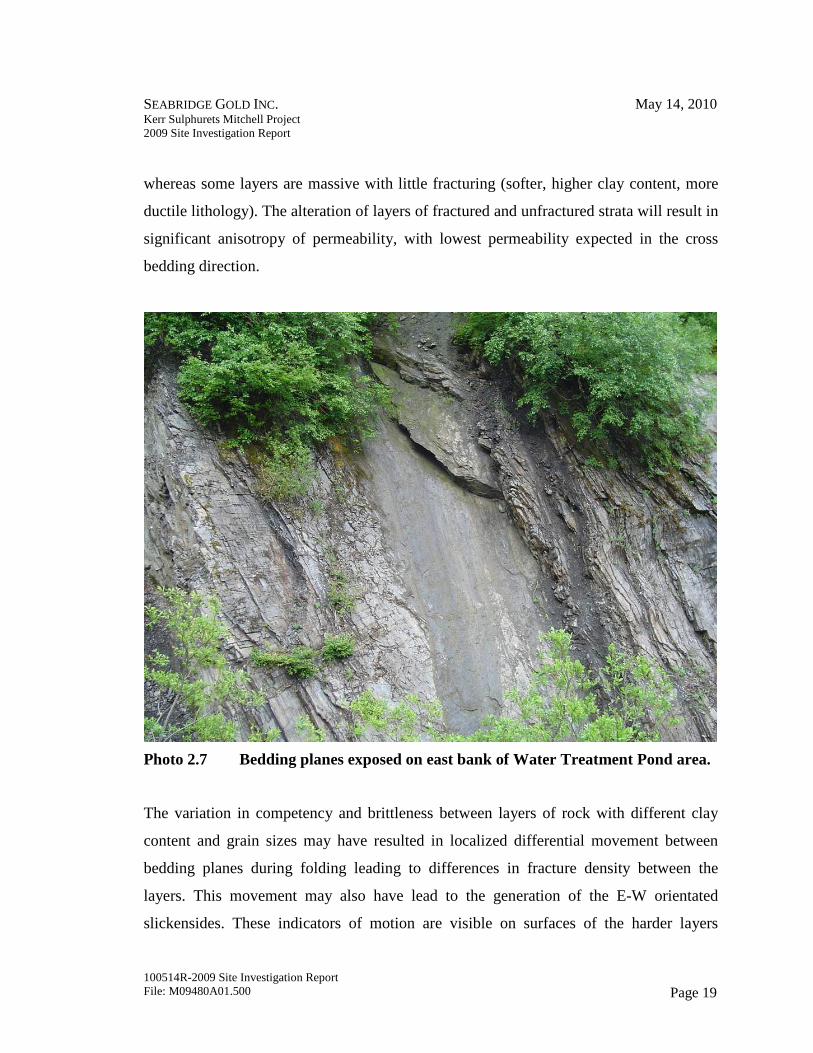
Generally the sedimentary formations are highly planar, with tight bedding planes
observed in the exposed bedrock of valley floor area. Only slight undulations are visible
on larger scales (Photo 2.7).
Permeability would be expected to be anisotropic, low across bedding planes but higher
along bedding directions within any fractured sequences, or within any discontinuities
created by movement between bedding planes.
Lithology varies rhythmically between bedding layers on a scale of cm’s to metres
(Photo 2.7). Some layers appear to be lightly fractured (harder more brittle lithology)
SEABRIDGE GOLD INC. May 14, 2010 Kerr Sulphurets Mitchell Project 2009 Site Investigation Report
100514R-2009 Site Investigation Report File: M09480A01.500 Page 19
whereas some layers are massive with little fracturing (softer, higher clay content, more
ductile lithology). The alteration of layers of fractured and unfractured strata will result in
significant anisotropy of permeability, with lowest permeability expected in the cross
bedding direction.
Photo 2.7 Bedding planes exposed on east bank of Water Treatment Pond area.
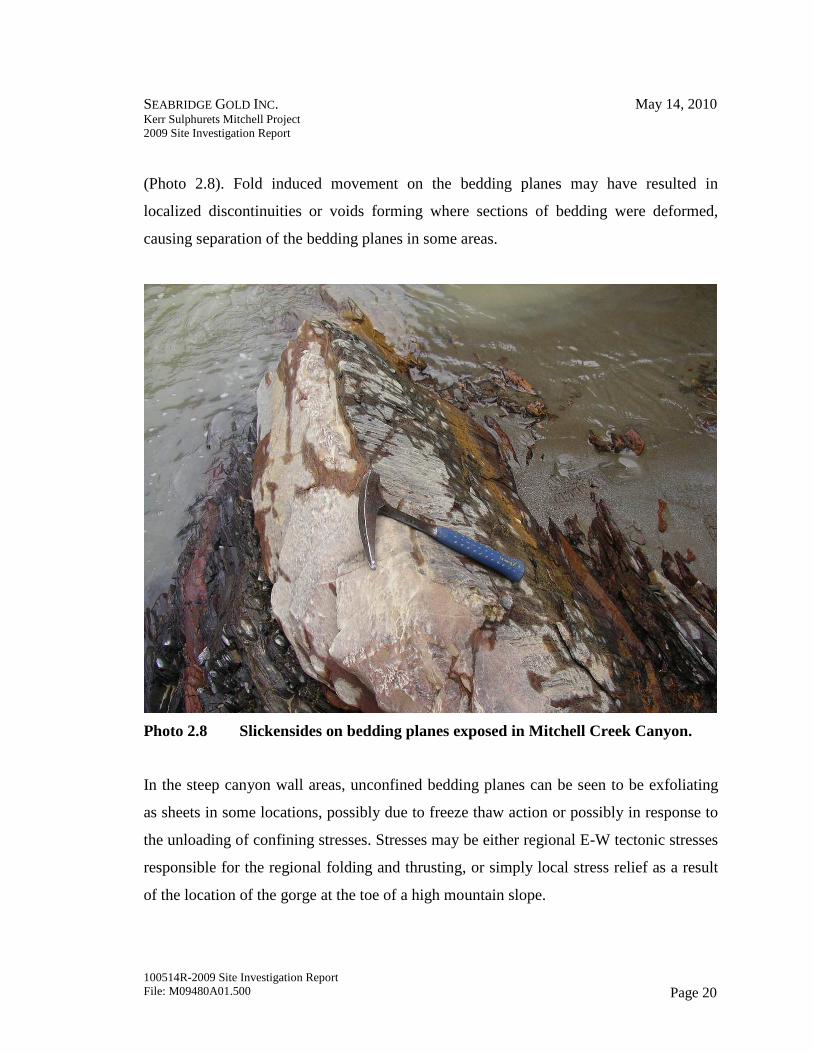
The variation in competency and brittleness between layers of rock with different clay
content and grain sizes may have resulted in localized differential movement between
bedding planes during folding leading to differences in fracture density between the
layers. This movement may also have lead to the generation of the E-W orientated
slickensides. These indicators of motion are visible on surfaces of the harder layers
SEABRIDGE GOLD INC. May 14, 2010 Kerr Sulphurets Mitchell Project 2009 Site Investigation Report
100514R-2009 Site Investigation Report File: M09480A01.500 Page 20
(Photo 2.8). Fold induced movement on the bedding planes may have resulted in
localized discontinuities or voids forming where sections of bedding were deformed,
causing separation of the bedding planes in some areas.
Photo 2.8 Slickensides on bedding planes exposed in Mitchell Creek Canyon.
In the steep canyon wall areas, unconfined bedding planes can be seen to be exfoliating
as sheets in some locations, possibly due to freeze thaw action or possibly in response to
the unloading of confining stresses. Stresses may be either regional E-W tectonic stresses
responsible for the regional folding and thrusting, or simply local stress relief as a result
of the location of the gorge at the toe of a high mountain slope.
SEABRIDGE GOLD INC. May 14, 2010 Kerr Sulphurets Mitchell Project 2009 Site Investigation Report
100514R-2009 Site Investigation Report File: M09480A01.500 Page 21
In the area of the proposed dam, orientation of the gorge trends approximately NE,
whereas the strike of the west dipping bedding is northerly. This results in the strike of
the bedding planes being situated at an angle of approximately 45 degrees to the axis of
the valley. This orientation of bedding planes is favourable as it would reduce daylighting
of seepage through the dam foundation along fractures within the bedding planes.
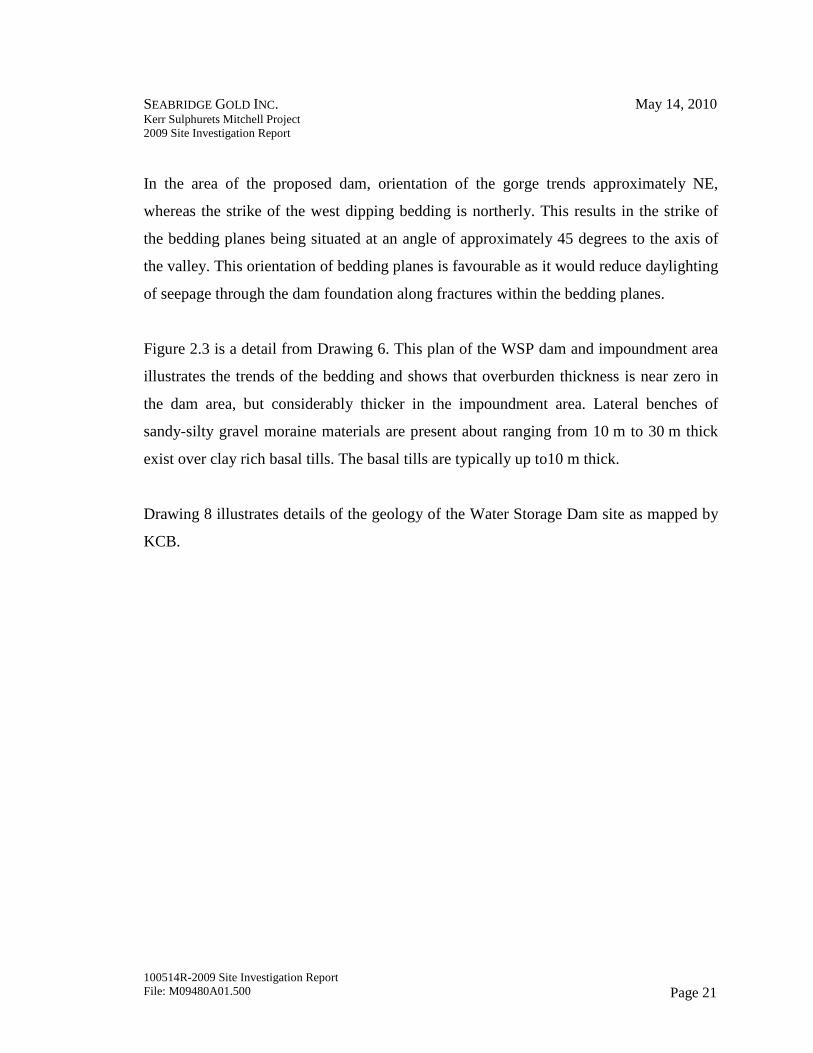
Figure 2.3 is a detail from Drawing 6. This plan of the WSP dam and impoundment area
illustrates the trends of the bedding and shows that overburden thickness is near zero in
the dam area, but considerably thicker in the impoundment area. Lateral benches of
sandy-silty gravel moraine materials are present about ranging from 10 m to 30 m thick
exist over clay rich basal tills. The basal tills are typically up to10 m thick.
Drawing 8 illustrates details of the geology of the Water Storage Dam site as mapped by
KCB.
SEABRIDGE GOLD INC. May 14, 2010 Kerr Sulphurets Mitchell Project 2009 Site Investigation Report
100514R-2009 Site Investigation Report File: M09480A01.500 Page 22
Figure 2.3 Water Storage Facility Area, Structural Trends and Overburden thickness contours (m)
2.2.2 Investigations of the Sulphurets Rock Storage Facility Area
KCBL conducted evaluations of the area of the Sulphurets Rock Storage Facility as part
of site characterization and selection of drill hole locations. The region of the Sulphurets
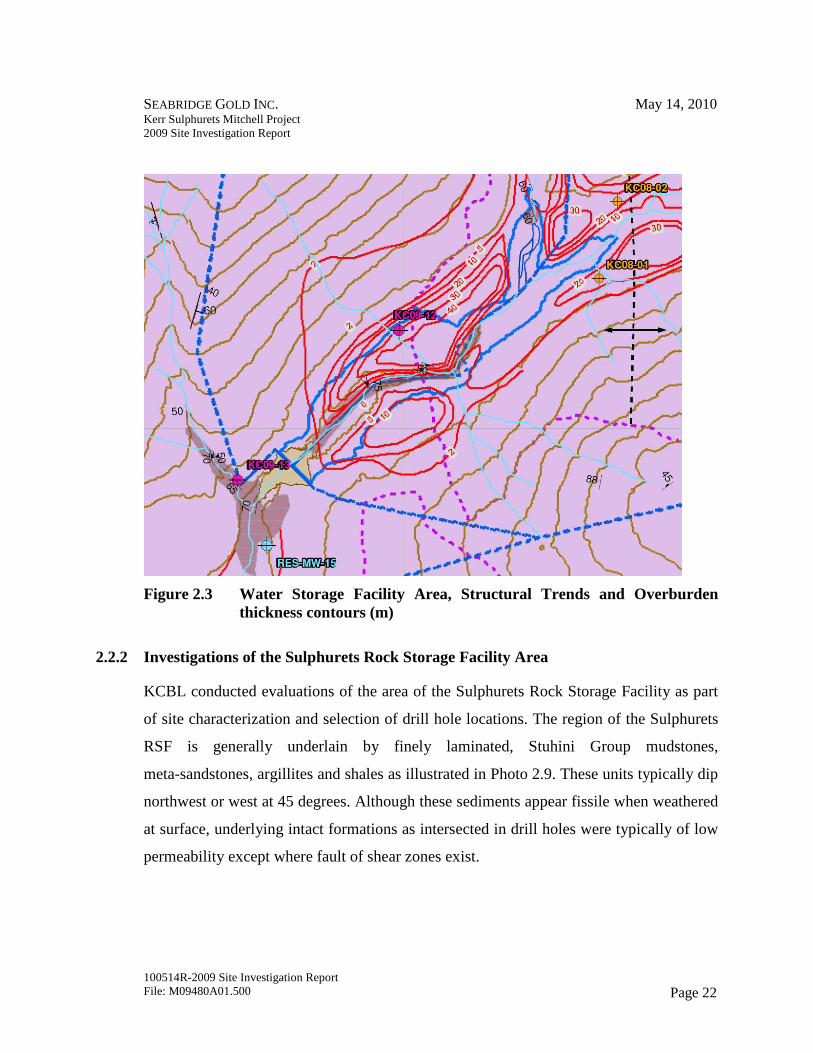
RSF is generally underlain by finely laminated, Stuhini Group mudstones,
meta-sandstones, argillites and shales as illustrated in Photo 2.9. These units typically dip
northwest or west at 45 degrees. Although these sediments appear fissile when weathered
at surface, underlying intact formations as intersected in drill holes were typically of low
permeability except where fault of shear zones exist.
SEABRIDGE GOLD INC. May 14, 2010 Kerr Sulphurets Mitchell Project 2009 Site Investigation Report
100514R-2009 Site Investigation Report File: M09480A01.500 Page 23
The low angle Sulphurets thrust fault is located within the southeastern toe of the
Sulphurets Rock Storage Facility (Figure 2.9 and Drawing D-1203). The proximity of
this tectonic feature may explain some of the slickensided shear zones noted in the core
from the area.
Photo 2.9 Finely Bedded, NW dipping Sediments in Sulphurets RSF Foundation.
The prominent ridge which forms a confining zone along the southwest edge of the RSF
and parts of the southern toe is partially composed of metasedimentary rock containing
clasts of volcanic rock. This rock is weaker than the argillites, and is typically classified
as weak or moderately weak. Vertical or steeply dipping graphitic joints are present. In
packer testing of this unit, permeabilities averaged 2 E-07 m/s. A swamp and boggy area
exists above the ridge in the suggesting that the underlying area has poor drainage.
SEABRIDGE GOLD INC. May 14, 2010 Kerr Sulphurets Mitchell Project 2009 Site Investigation Report
100514R-2009 Site Investigation Report File: M09480A01.500 Page 24
Granodioritic Mitchell Intrusives are also present in the area and may have partially
defined the ridge near the toe area.
2.3 July 2009 Moraine and Till Sampling Program, Mine and TMF Areas
In order to characterize availability of borrow materials for the Water Storage Dam and
for closure cover materials, KCB conducted an overburden thickness mapping and
overburden sampling program with an emphasis on locating fine grained materials
suitable for use as dam core and low permeability cover materials.
Surface deposits of sandy, silty, gravelly moraine deposits are abundant in the Mitchell
and McTagg creek areas. Surface deposits of materials with high fines content are less
abundant. Limited and isolated deposits of lacustrine silts or lacustrine clays are found as
lenses within the moraines suggesting that these materials correspond to deposits laid
down during damming events occurred due to landslide valley blockages. Most moraine
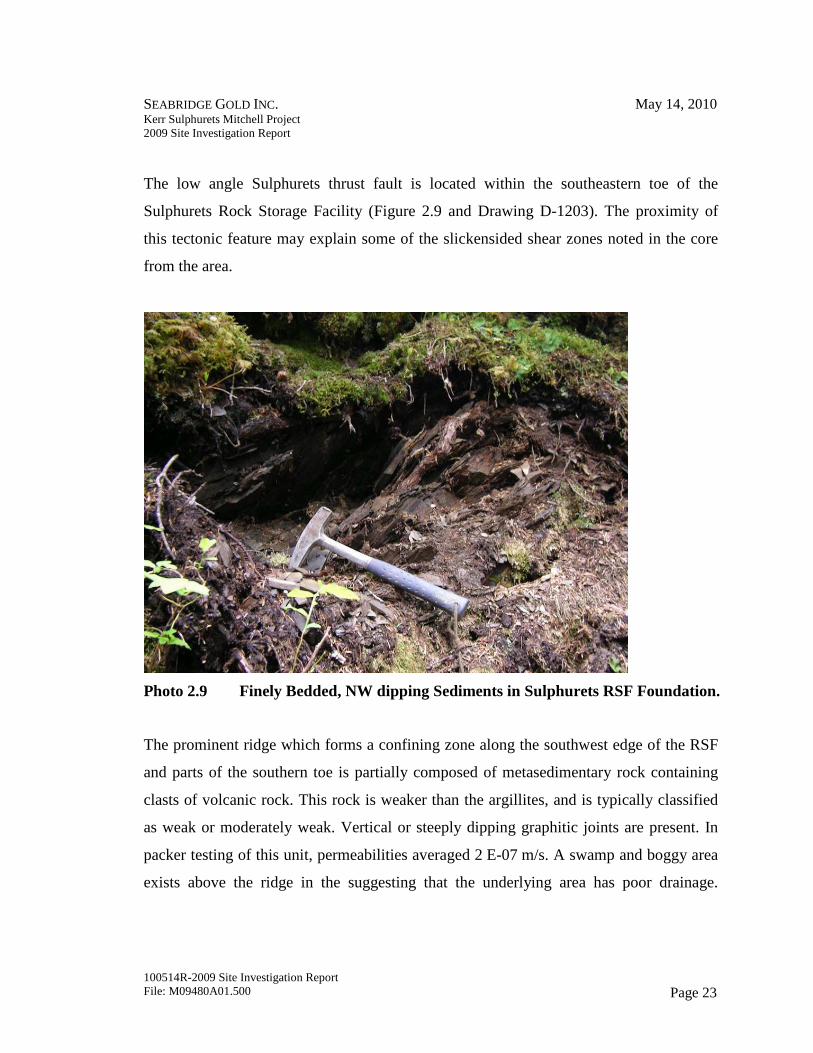
and lacustrine deposits of the Lower Mitchell valley are reactive to HCL. A sample of the
lacustrine silt deposit illustrated in Photo 2.12 was tested for Acid Base Accounting and
Sulphur content by ALS Chemex. This sample (sample 37 in the geotechnical sample test
summary included in Appendix V) had a calcium carbonate equivalent content of 4% and
reacted moderately to HCL in a visual acid test. The ABA test indicated a net neutralizing
ratio of 2.37. All 2009 samples taken by KCBL were also split and submitted to Rescan
for ABA testing, the results of which are tabulated in Appendix V. Geotechnical
suitability of these overburden samples for use as fill exposed to drainages discharging to
the environment are plotted on Drawing D-1202.
Larger volumes of alluvial and glacio-fluvial deposits of silty sands and gravels are
present along the flanks of the Sulphurets and Ted Morris drainages, likely as a result of
the larger catchments of these drainages.
SEABRIDGE GOLD INC. May 14, 2010 Kerr Sulphurets Mitchell Project 2009 Site Investigation Report
100514R-2009 Site Investigation Report File: M09480A01.500 Page 25
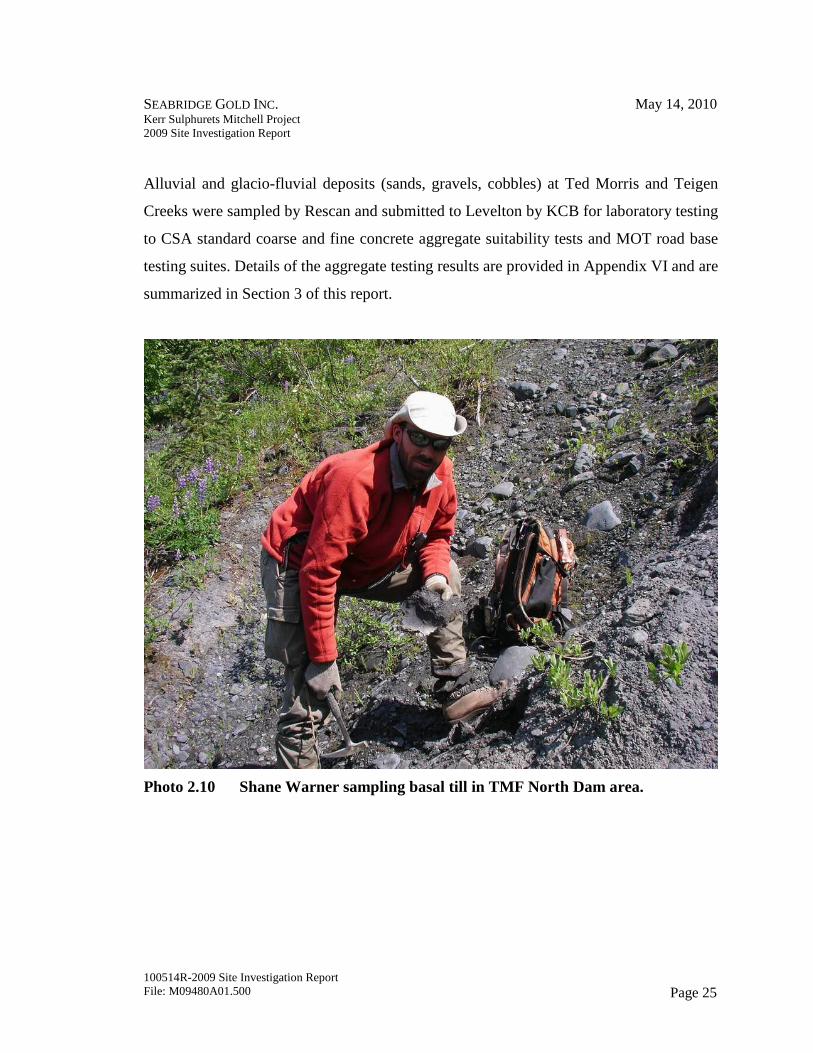
Alluvial and glacio-fluvial deposits (sands, gravels, cobbles) at Ted Morris and Teigen
Creeks were sampled by Rescan and submitted to Levelton by KCB for laboratory testing
to CSA standard coarse and fine concrete aggregate suitability tests and MOT road base
testing suites. Details of the aggregate testing results are provided in Appendix VI and are
summarized in Section 3 of this report.
Photo 2.10 Shane Warner sampling basal till in TMF North Dam area.
SEABRIDGE GOLD INC. May 14, 2010 Kerr Sulphurets Mitchell Project 2009 Site Investigation Report
100514R-2009 Site Investigation Report File: M09480A01.500 Page 26
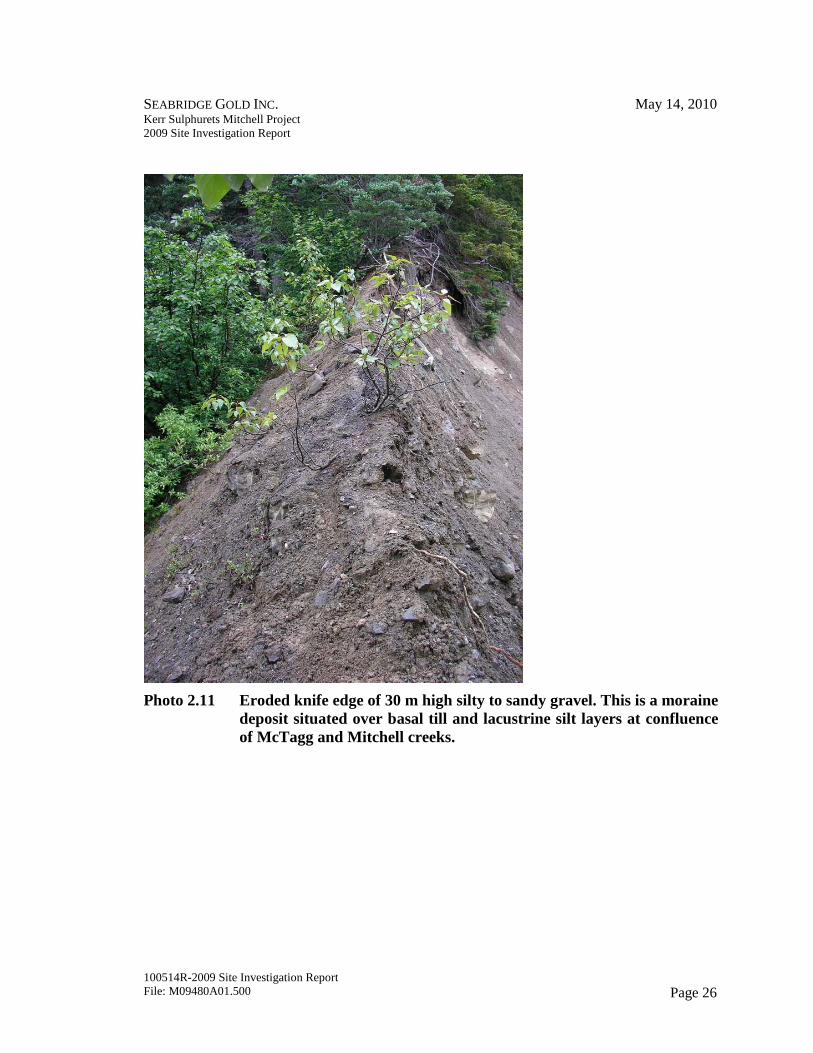
Photo 2.11 Eroded knife edge of 30 m high silty to sandy gravel. This is a moraine deposit situated over basal till and lacustrine silt layers at confluence of McTagg and Mitchell creeks.
SEABRIDGE GOLD INC. May 14, 2010 Kerr Sulphurets Mitchell Project 2009 Site Investigation Report
100514R-2009 Site Investigation Report File: M09480A01.500 Page 27
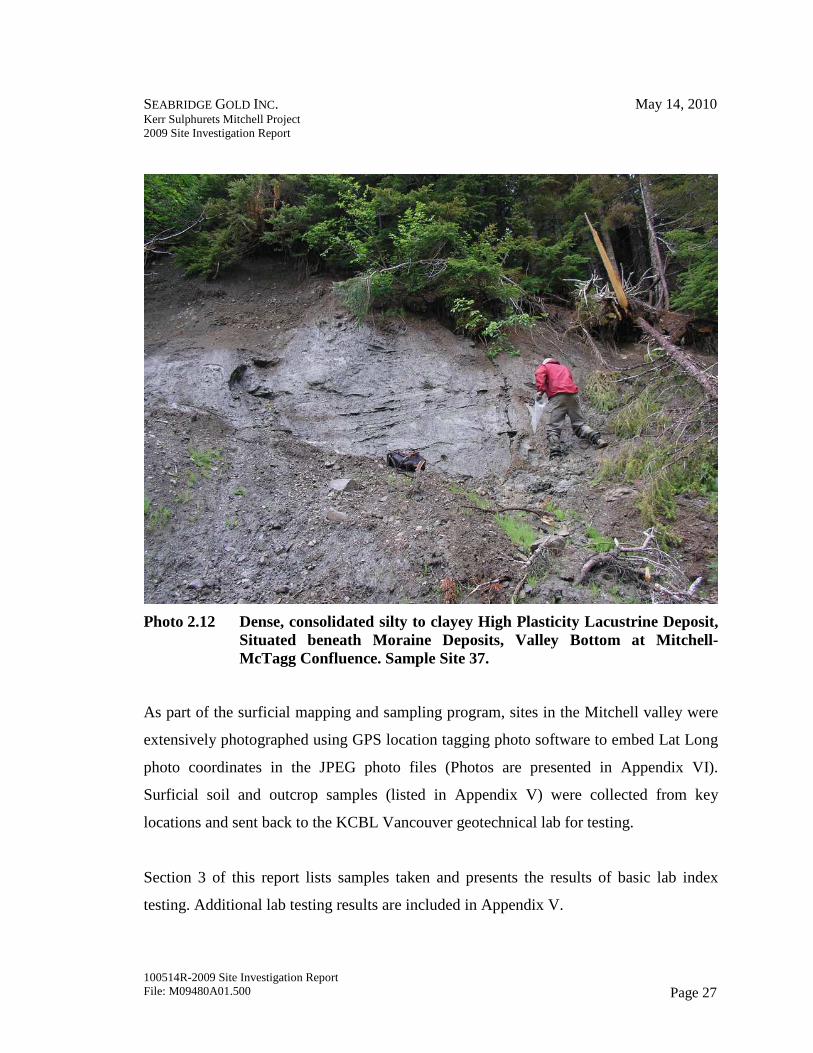
Photo 2.12 Dense, consolidated silty to clayey High Plasticity Lacustrine Deposit, Situated beneath Moraine Deposits, Valley Bottom at Mitchell-McTagg Confluence. Sample Site 37.
As part of the surficial mapping and sampling program, sites in the Mitchell valley were
extensively photographed using GPS location tagging photo software to embed Lat Long
photo coordinates in the JPEG photo files (Photos are presented in Appendix VI).
Surficial soil and outcrop samples (listed in Appendix V) were collected from key
locations and sent back to the KCBL Vancouver geotechnical lab for testing.
Section 3 of this report lists samples taken and presents the results of basic lab index
testing. Additional lab testing results are included in Appendix V.
SEABRIDGE GOLD INC. May 14, 2010 Kerr Sulphurets Mitchell Project 2009 Site Investigation Report
100514R-2009 Site Investigation Report File: M09480A01.500 Page 28
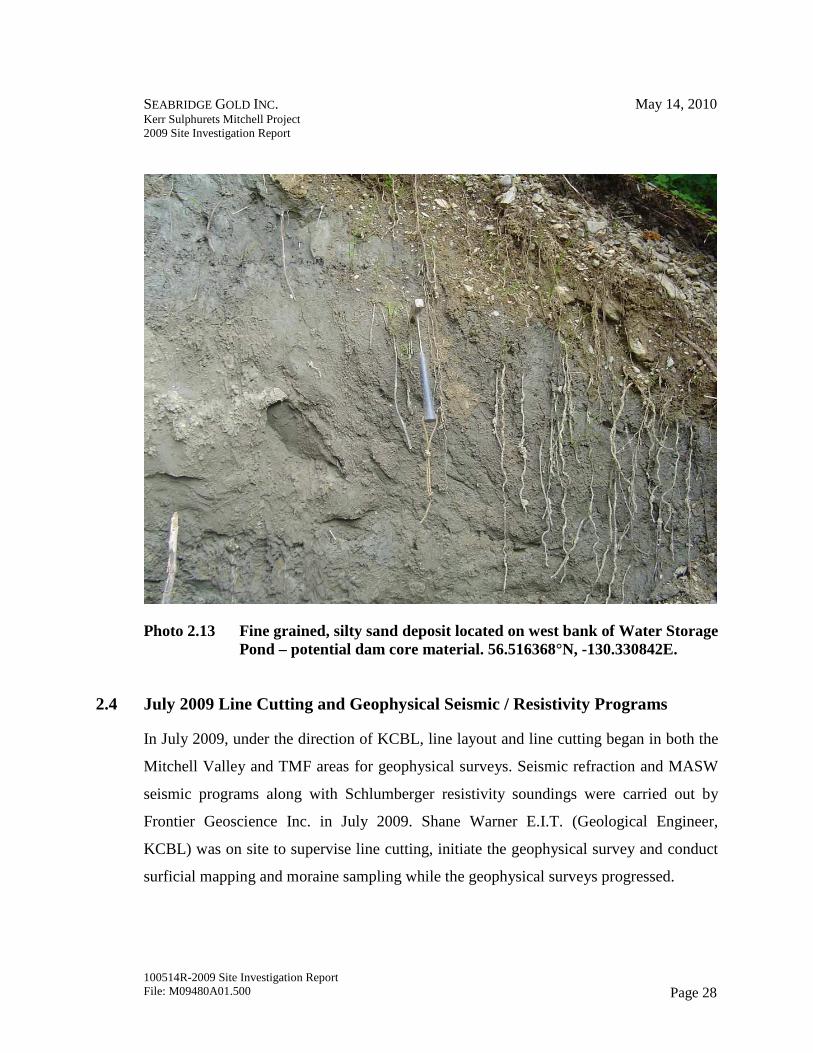
Photo 2.13 Fine grained, silty sand deposit located on west bank of Water Storage Pond – potential dam core material. 56.516368°N, -130.330842E.
2.4 July 2009 Line Cutting and Geophysical Seismic / Resistivity Programs
In July 2009, under the direction of KCBL, line layout and line cutting began in both the
Mitchell Valley and TMF areas for geophysical surveys. Seismic refraction and MASW
seismic programs along with Schlumberger resistivity soundings were carried out by
Frontier Geoscience Inc. in July 2009. Shane Warner E.I.T. (Geological Engineer,
KCBL) was on site to supervise line cutting, initiate the geophysical survey and conduct
surficial mapping and moraine sampling while the geophysical surveys progressed.
SEABRIDGE GOLD INC. May 14, 2010 Kerr Sulphurets Mitchell Project 2009 Site Investigation Report
100514R-2009 Site Investigation Report File: M09480A01.500 Page 29
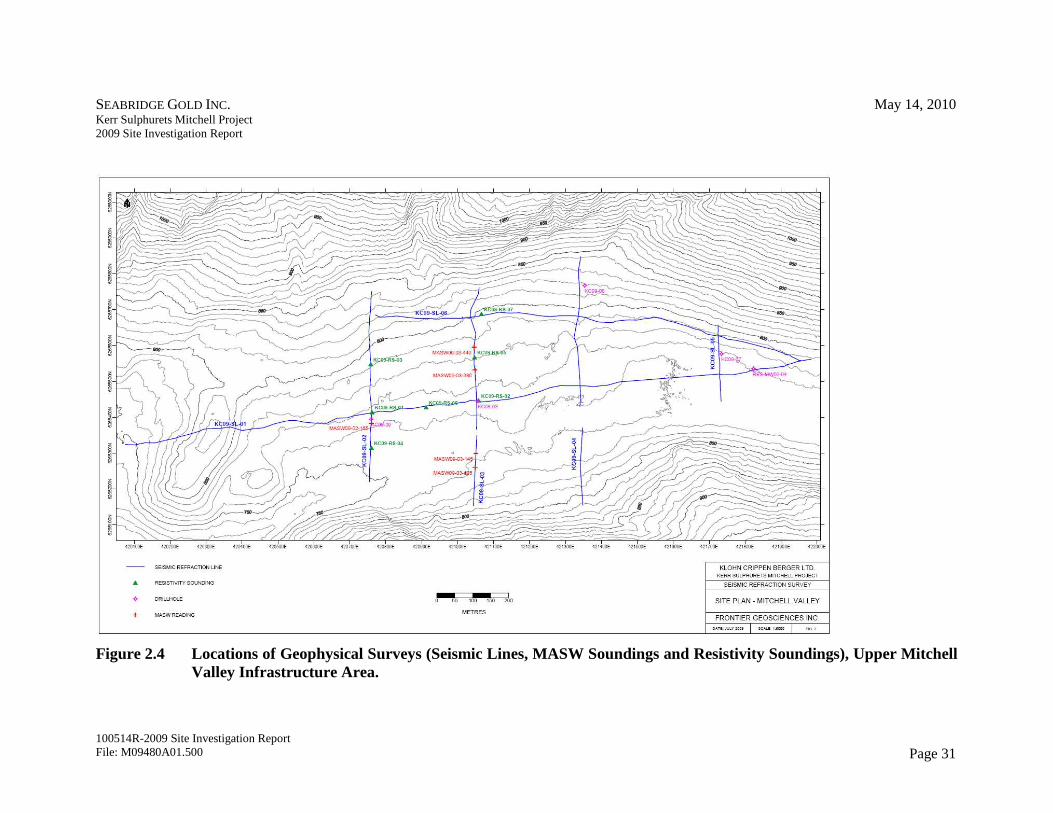
The purpose of the geophysical program was to determine overburden depths and
conditions for RSF foundation stability assessment and for suitability of sites for process
plant infrastructure and for the siting of the closure dam.
Line cutting for the geophysical surveys was conducted under sub-contract with KCBL
by a crew from the Skii Km Lax Ha First Nation who also assisted Frontier Geosciences
with the geophysical programs.
Appendix II presents the complete report text, figures and profiles for the results from the
2009 Geophysical Program. The following text summarizes these results for both the
Mitchell valley and the TMF areas.
2.4.1 Mitchell Valley Area Geophysical Investigations
Figure 2.4 illustrates the location of the Mitchell valley seismic lines, MASW shear wave
soundings and Schlumberger resistivity soundings.
Seismic velocities and layering seen in resistivity surveys completed in the Mitchell
valley were calibrated with depths to bedrock from 2008 and 2009 borehole logs. A plan
of overburden depths was created from this data for the Mitchell valley and Mine Area.
Contours of Mine Area overburden depths from the seismic refraction and drilling results
are presented on Drawing 6, Mine Area Surficial and Structural Geology.
Seismic depths to bedrock varied from around 2 m at the eastern limit of the geophysical
lines at the west rim of the pit to approximately 140 m depth under the overburden knoll
located in the centre of the Mitchell Valley. This depth suggests that the knoll is primarily
composed of colluvial material, possibly deposited in a series of major landslide events
SEABRIDGE GOLD INC. May 14, 2010 Kerr Sulphurets Mitchell Project 2009 Site Investigation Report
100514R-2009 Site Investigation Report File: M09480A01.500 Page 30
from an embayment area to the south of the valley, supplemented by debris from the
chutes to the north of the valley. Based on available drilling, the region of valley floor
between the pit and the knoll appears to consist of complex mixed layers of boulders,
moraine, outwash sediments, lacustrine clays, silts and sands, the layering of which is not
fully resolved by the seismic survey.
SEABRIDGE GOLD INC. May 14, 2010 Kerr Sulphurets Mitchell Project 2009 Site Investigation Report
100514R-2009 Site Investigation Report File: M09480A01.500 Page 31
Figure 2.4 Locations of Geophysical Surveys (Seismic Lines, MASW Soundings and Resistivity Soundings), Upper Mitchell Valley Infrastructure Area.
SEABRIDGE GOLD INC. May 14, 2010 Kerr Sulphurets Mitchell Project 2009 Site Investigation Report
100514R-2009 Site Investigation Report File: M09480A01.500 Page 32
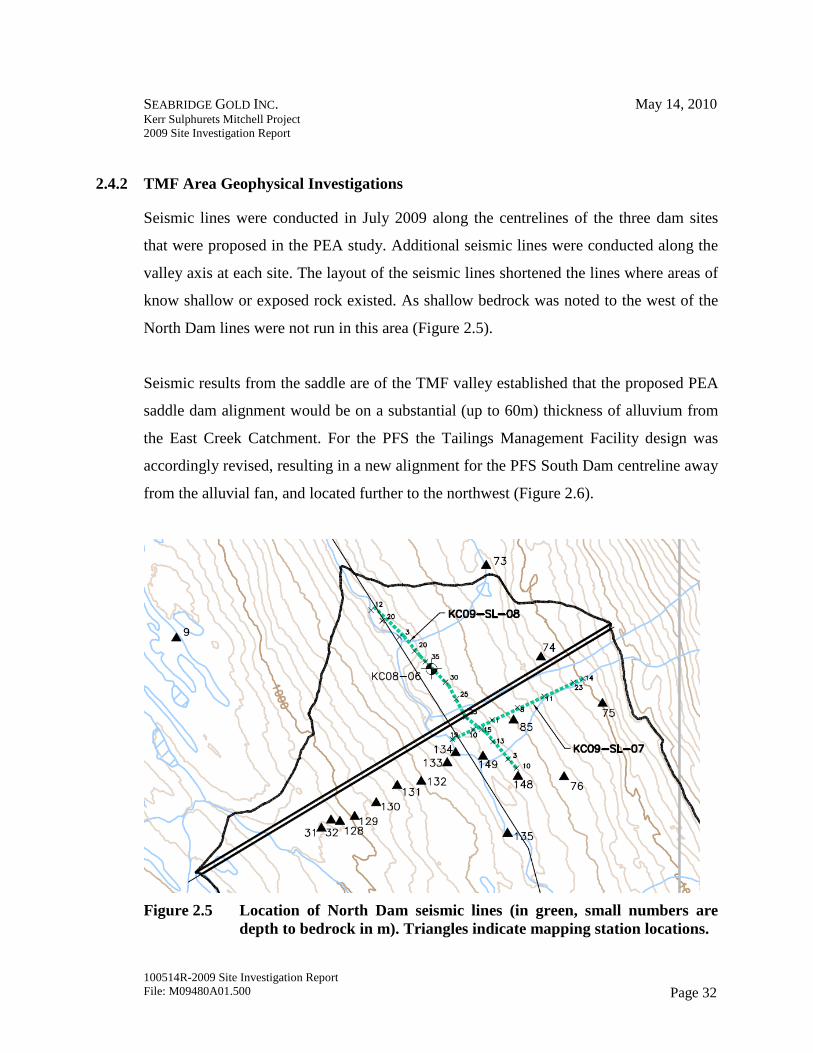
2.4.2 TMF Area Geophysical Investigations
Seismic lines were conducted in July 2009 along the centrelines of the three dam sites
that were proposed in the PEA study. Additional seismic lines were conducted along the
valley axis at each site. The layout of the seismic lines shortened the lines where areas of
know shallow or exposed rock existed. As shallow bedrock was noted to the west of the
North Dam lines were not run in this area (Figure 2.5).
Seismic results from the saddle are of the TMF valley established that the proposed PEA
saddle dam alignment would be on a substantial (up to 60m) thickness of alluvium from
the East Creek Catchment. For the PFS the Tailings Management Facility design was
accordingly revised, resulting in a new alignment for the PFS South Dam centreline away
from the alluvial fan, and located further to the northwest (Figure 2.6).
Figure 2.5 Location of North Dam seismic lines (in green, small numbers are depth to bedrock in m). Triangles indicate mapping station locations.
SEABRIDGE GOLD INC. May 14, 2010 Kerr Sulphurets Mitchell Project 2009 Site Investigation Report
100514R-2009 Site Investigation Report File: M09480A01.500 Page 33
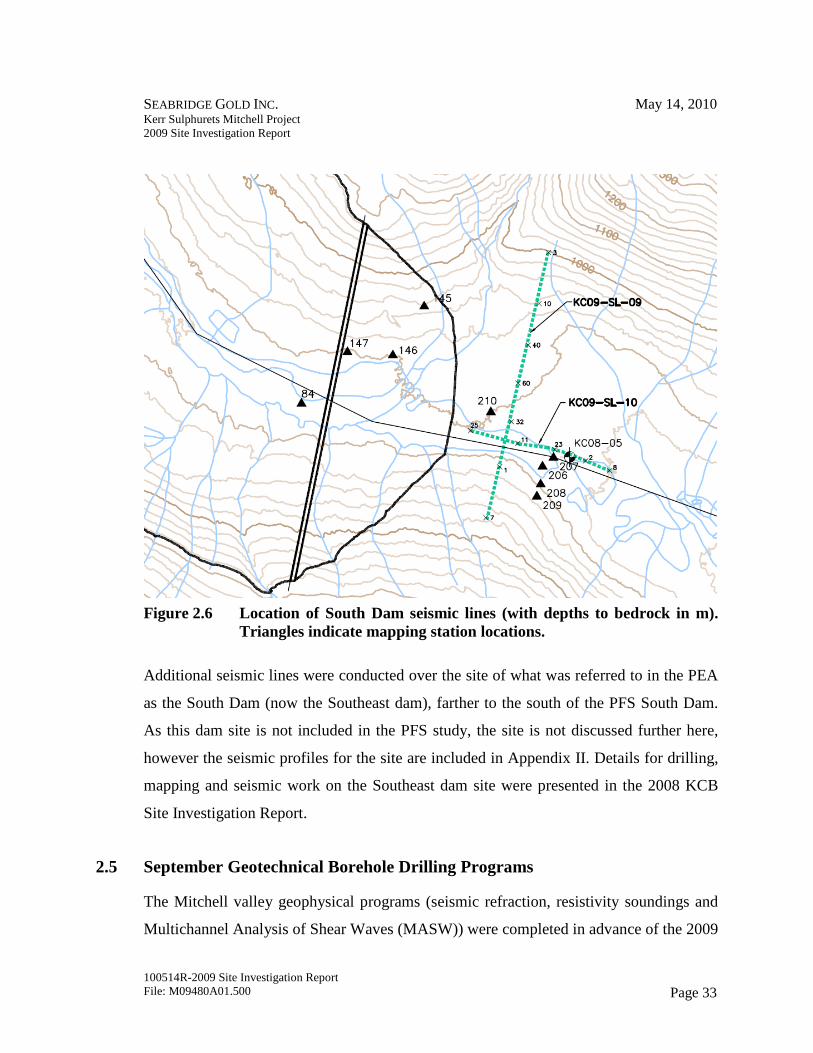
Figure 2.6 Location of South Dam seismic lines (with depths to bedrock in m).
Triangles indicate mapping station locations.
Additional seismic lines were conducted over the site of what was referred to in the PEA
as the South Dam (now the Southeast dam), farther to the south of the PFS South Dam.
As this dam site is not included in the PFS study, the site is not discussed further here,
however the seismic profiles for the site are included in Appendix II. Details for drilling,
mapping and seismic work on the Southeast dam site were presented in the 2008 KCB
Site Investigation Report.
2.5 September Geotechnical Borehole Drilling Programs
The Mitchell valley geophysical programs (seismic refraction, resistivity soundings and
Multichannel Analysis of Shear Waves (MASW)) were completed in advance of the 2009
SEABRIDGE GOLD INC. May 14, 2010 Kerr Sulphurets Mitchell Project 2009 Site Investigation Report
100514R-2009 Site Investigation Report File: M09480A01.500 Page 34
drilling program to guide the selection of drilling locations. In the TMF area, seismic
refraction and Multichannel Analysis of Shear Waves (MASW) was used to establish
variations in overburden thickness for pre-feasibility level design work, based on control
established in the area from 2008 drilling. As a result, no additional drilling was
conducted in the TMF area during 2009.
Based on the results of the July 2009 seismic program and gaps in site information
identified during the June 2009 site visit, seven mine area geotechnical drill holes were
completed by KCBL in the fall of 2009. These were sited to determine subsurface
materials and structure and assess the foundation conditions at the proposed Mitchell
Infrastructure Area, Mitchell Closure Dam, Sulphurets RSF and the Water Storage Dam
(WSD).
At the request of Seabridge, KCBL borehole numbering followed on sequentially from
2008, thus the first hole drilled by KCBL in 2009 was KC09-07 (KCBL 09-07 was
initially labelled 09-01, the label was changed to KC09-07 after the first hole).
Drilling of these holes was conducted over the period of Aug. 27 to Sept. 24, 2009. The
first six holes were drilled by Hy-Tech Drilling of Smithers B.C., while the final hole
KC09-13 was drilled by Cabo Drilling of Prince George, B.C. KCBL field engineers
Shane Warner and Ann Wen, E.I.T. (Geological Engineer) were onsite for the duration of
the program. Drilling was done 24/7 with two 12 hr shifts. Table 2.1 summarizes the
details of the drill holes. Detailed logs are presented in Appendix I, photos of the
recovered core are shown in Appendix V.
SEABRIDGE GOLD INC. May 14, 2010 Kerr Sulphurets Mitchell Project 2009 Site Investigation Report
100514R-2009 Site Investigation Report File: M09480A01.500 Page 35
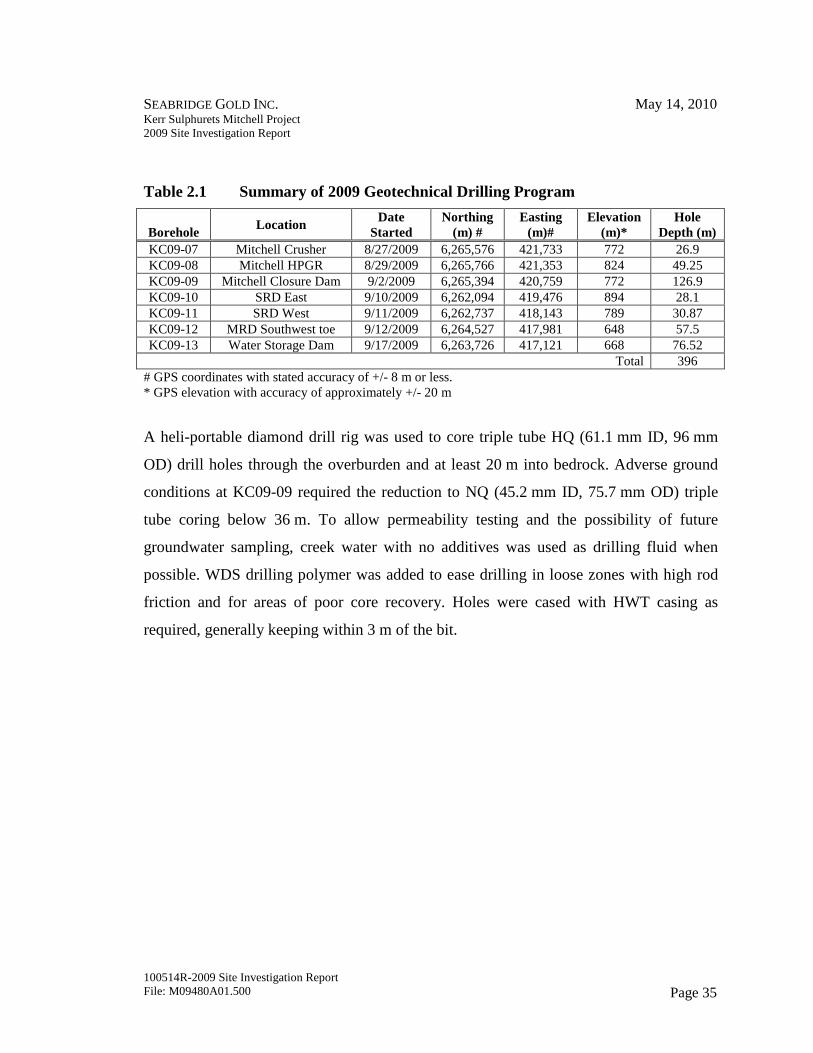
Table 2.1 Summary of 2009 Geotechnical Drilling Program
Borehole Location
Date Started
Northing (m) #
Easting (m)#
Elevation (m)*
Hole Depth (m)
KC09-07 Mitchell Crusher 8/27/2009 6,265,576 421,733 772 26.9 KC09-08 Mitchell HPGR 8/29/2009 6,265,766 421,353 824 49.25 KC09-09 Mitchell Closure Dam 9/2/2009 6,265,394 420,759 772 126.9 KC09-10 SRD East 9/10/2009 6,262,094 419,476 894 28.1 KC09-11 SRD West 9/11/2009 6,262,737 418,143 789 30.87 KC09-12 MRD Southwest toe 9/12/2009 6,264,527 417,981 648 57.5 KC09-13 Water Storage Dam 9/17/2009 6,263,726 417,121 668 76.52
Total 396 # GPS coordinates with stated accuracy of +/- 8 m or less. * GPS elevation with accuracy of approximately +/- 20 m
A heli-portable diamond drill rig was used to core triple tube HQ (61.1 mm ID, 96 mm
OD) drill holes through the overburden and at least 20 m into bedrock. Adverse ground
conditions at KC09-09 required the reduction to NQ (45.2 mm ID, 75.7 mm OD) triple
tube coring below 36 m. To allow permeability testing and the possibility of future
groundwater sampling, creek water with no additives was used as drilling fluid when
possible. WDS drilling polymer was added to ease drilling in loose zones with high rod
friction and for areas of poor core recovery. Holes were cased with HWT casing as
required, generally keeping within 3 m of the bit.
SEABRIDGE GOLD INC. May 14, 2010 Kerr Sulphurets Mitchell Project 2009 Site Investigation Report
100514R-2009 Site Investigation Report File: M09480A01.500 Page 36
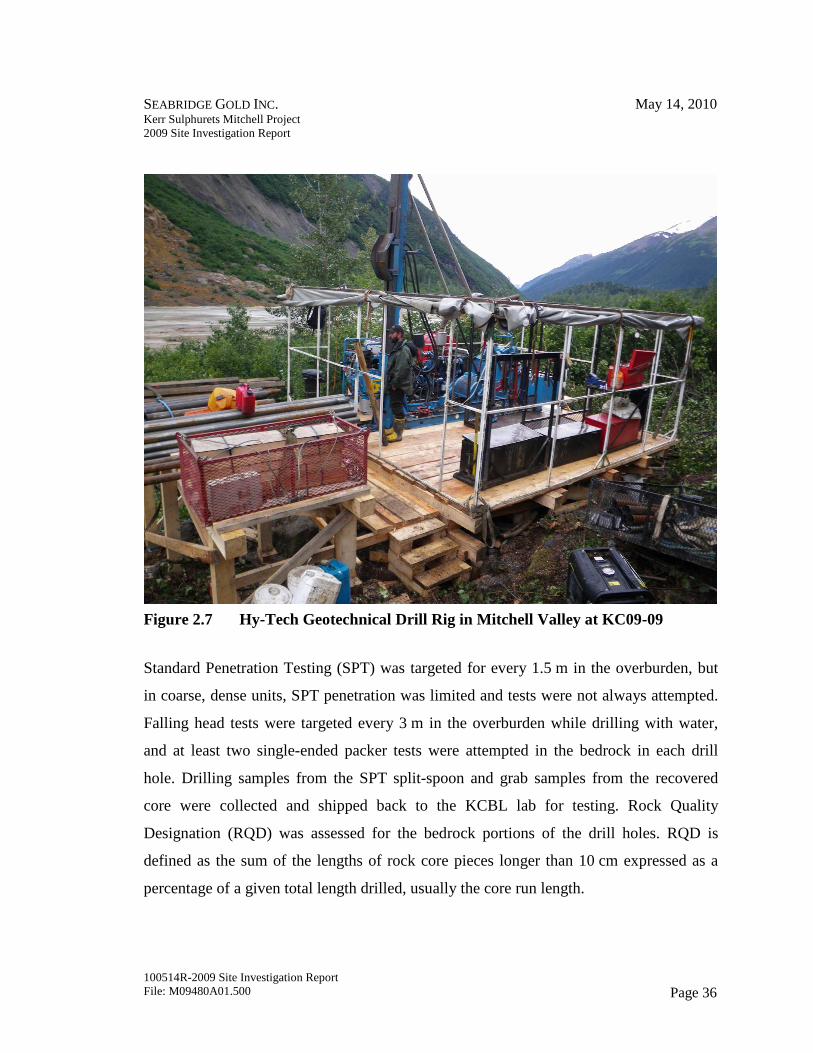
Figure 2.7 Hy-Tech Geotechnical Drill Rig in Mitchell Valley at KC09-09
Standard Penetration Testing (SPT) was targeted for every 1.5 m in the overburden, but
in coarse, dense units, SPT penetration was limited and tests were not always attempted.
Falling head tests were targeted every 3 m in the overburden while drilling with water,
and at least two single-ended packer tests were attempted in the bedrock in each drill
hole. Drilling samples from the SPT split-spoon and grab samples from the recovered
core were collected and shipped back to the KCBL lab for testing. Rock Quality
Designation (RQD) was assessed for the bedrock portions of the drill holes. RQD is
defined as the sum of the lengths of rock core pieces longer than 10 cm expressed as a
percentage of a given total length drilled, usually the core run length.
SEABRIDGE GOLD INC. May 14, 2010 Kerr Sulphurets Mitchell Project 2009 Site Investigation Report
100514R-2009 Site Investigation Report File: M09480A01.500 Page 37
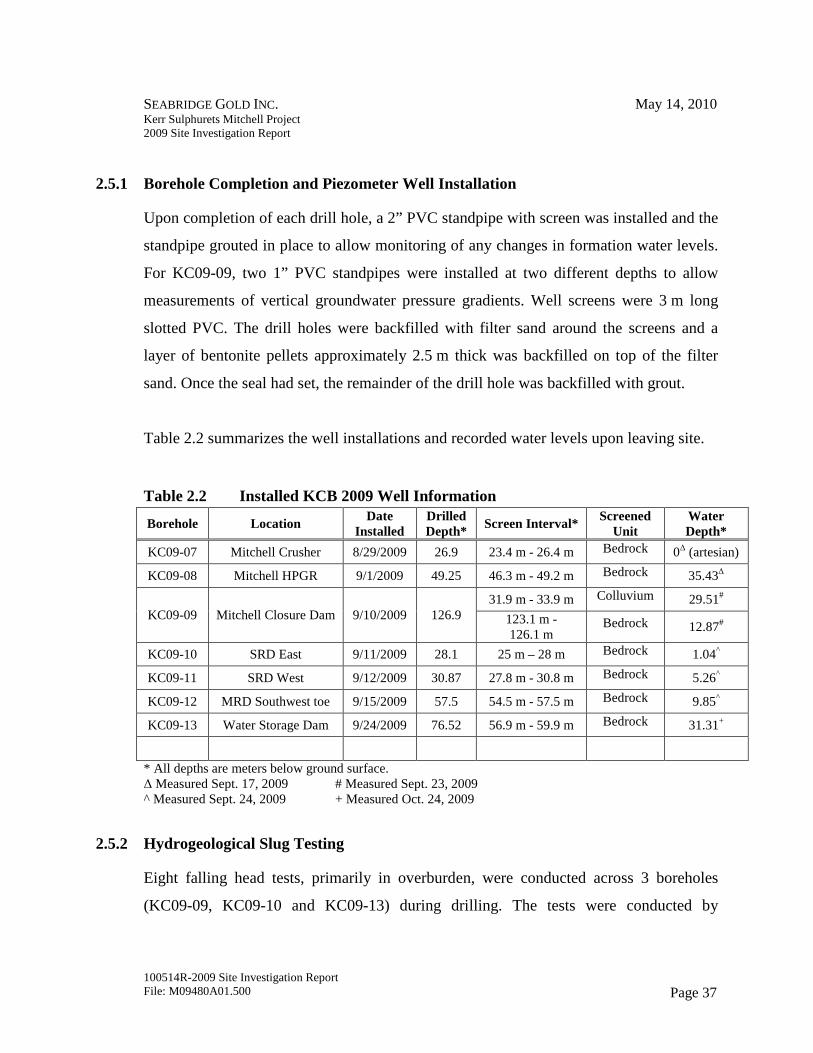
2.5.1 Borehole Completion and Piezometer Well Installation
Upon completion of each drill hole, a 2” PVC standpipe with screen was installed and the
standpipe grouted in place to allow monitoring of any changes in formation water levels.
For KC09-09, two 1” PVC standpipes were installed at two different depths to allow
measurements of vertical groundwater pressure gradients. Well screens were 3 m long
slotted PVC. The drill holes were backfilled with filter sand around the screens and a
layer of bentonite pellets approximately 2.5 m thick was backfilled on top of the filter
sand. Once the seal had set, the remainder of the drill hole was backfilled with grout.
Table 2.2 summarizes the well installations and recorded water levels upon leaving site.
Table 2.2 Installed KCB 2009 Well Information
Borehole Location Date
Installed Drilled Depth*
Screen Interval* Screened
Unit Water Depth*
KC09-07 Mitchell Crusher 8/29/2009 26.9 23.4 m - 26.4 m Bedrock 0∆ (artesian)
KC09-08 Mitchell HPGR 9/1/2009 49.25 46.3 m - 49.2 m Bedrock 35.43∆
KC09-09 Mitchell Closure Dam 9/10/2009 126.9 31.9 m - 33.9 m Colluvium 29.51#
123.1 m - 126.1 m
Bedrock 12.87#
KC09-10 SRD East 9/11/2009 28.1 25 m – 28 m Bedrock 1.04^
KC09-11 SRD West 9/12/2009 30.87 27.8 m - 30.8 m Bedrock 5.26^
KC09-12 MRD Southwest toe 9/15/2009 57.5 54.5 m - 57.5 m Bedrock 9.85^
KC09-13 Water Storage Dam 9/24/2009 76.52 56.9 m - 59.9 m Bedrock 31.31+
* All depths are meters below ground surface. ∆ Measured Sept. 17, 2009 # Measured Sept. 23, 2009 ^ Measured Sept. 24, 2009 + Measured Oct. 24, 2009
2.5.2 Hydrogeological Slug Testing
Eight falling head tests, primarily in overburden, were conducted across 3 boreholes
(KC09-09, KC09-10 and KC09-13) during drilling. The tests were conducted by
SEABRIDGE GOLD INC. May 14, 2010 Kerr Sulphurets Mitchell Project 2009 Site Investigation Report
100514R-2009 Site Investigation Report File: M09480A01.500 Page 38
removing the core barrel and filling the drill rods with water. Water levels were recorded
using a Solinst Levelogger model 30 M data logging pressure transducer with an
accuracy of +/- 1.5 cm, set to record water levels every 2 seconds. The permeability of
the material at the bottom of the borehole was estimated using the Horslev method with
an assumed intake length of 5 m. Details of the individual falling head tests results are
presented in Appendix III. Additional slug tests were performed by Rescan after drilling
and are reported on elsewhere.
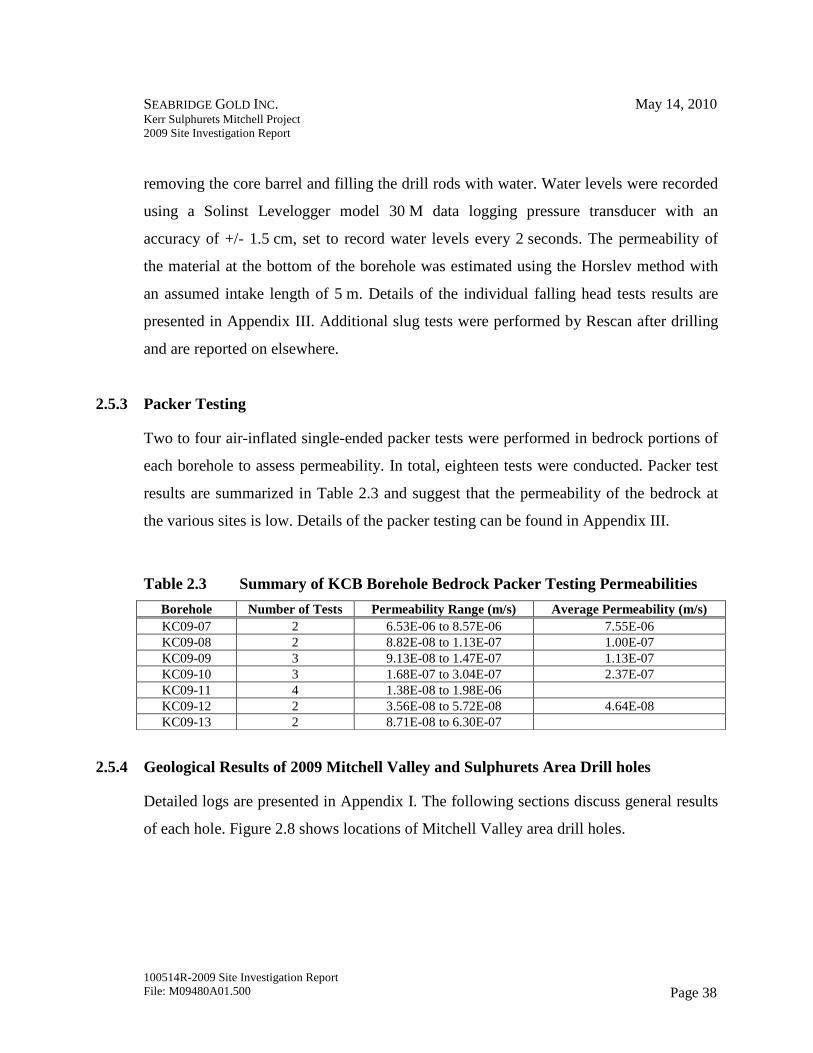
2.5.3 Packer Testing
Two to four air-inflated single-ended packer tests were performed in bedrock portions of
each borehole to assess permeability. In total, eighteen tests were conducted. Packer test
results are summarized in Table 2.3 and suggest that the permeability of the bedrock at
the various sites is low. Details of the packer testing can be found in Appendix III.
Table 2.3 Summary of KCB Borehole Bedrock Packer Testing Permeabilities
Borehole Number of Tests Permeability Range (m/s) Average Permeability (m/s) KC09-07 2 6.53E-06 to 8.57E-06 7.55E-06 KC09-08 2 8.82E-08 to 1.13E-07 1.00E-07 KC09-09 3 9.13E-08 to 1.47E-07 1.13E-07 KC09-10 3 1.68E-07 to 3.04E-07 2.37E-07 KC09-11 4 1.38E-08 to 1.98E-06 KC09-12 2 3.56E-08 to 5.72E-08 4.64E-08 KC09-13 2 8.71E-08 to 6.30E-07
2.5.4 Geological Results of 2009 Mitchell Valley and Sulphurets Area Drill holes
Detailed logs are presented in Appendix I. The following sections discuss general results
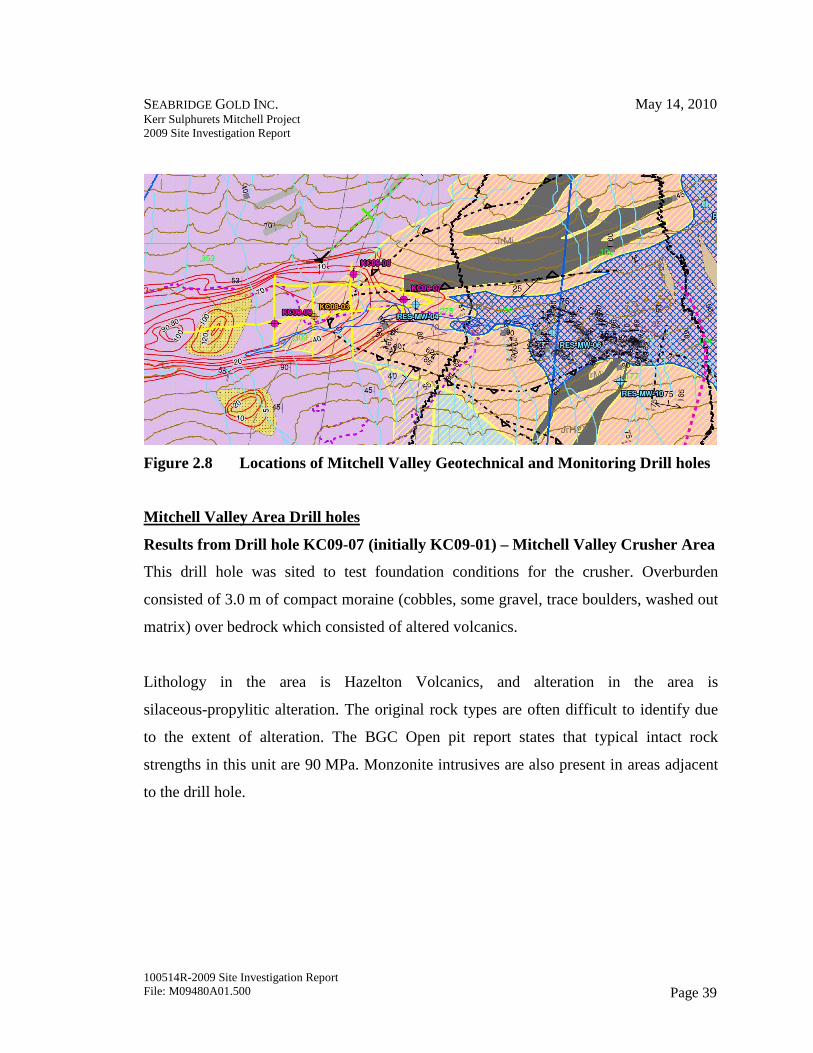
of each hole. Figure 2.8 shows locations of Mitchell Valley area drill holes.
SEABRIDGE GOLD INC. May 14, 2010 Kerr Sulphurets Mitchell Project 2009 Site Investigation Report
100514R-2009 Site Investigation Report File: M09480A01.500 Page 39
Figure 2.8 Locations of Mitchell Valley Geotechnical and Monitoring Drill holes
Mitchell Valley Area Drill holes
Results from Drill hole KC09-07 (initially KC09-01) – Mitchell Valley Crusher Area
This drill hole was sited to test foundation conditions for the crusher. Overburden
consisted of 3.0 m of compact moraine (cobbles, some gravel, trace boulders, washed out
matrix) over bedrock which consisted of altered volcanics.
Lithology in the area is Hazelton Volcanics, and alteration in the area is
silaceous-propylitic alteration. The original rock types are often difficult to identify due
to the extent of alteration. The BGC Open pit report states that typical intact rock
strengths in this unit are 90 MPa. Monzonite intrusives are also present in areas adjacent
to the drill hole.
SEABRIDGE GOLD INC. May 14, 2010 Kerr Sulphurets Mitchell Project 2009 Site Investigation Report
100514R-2009 Site Investigation Report File: M09480A01.500 Page 40
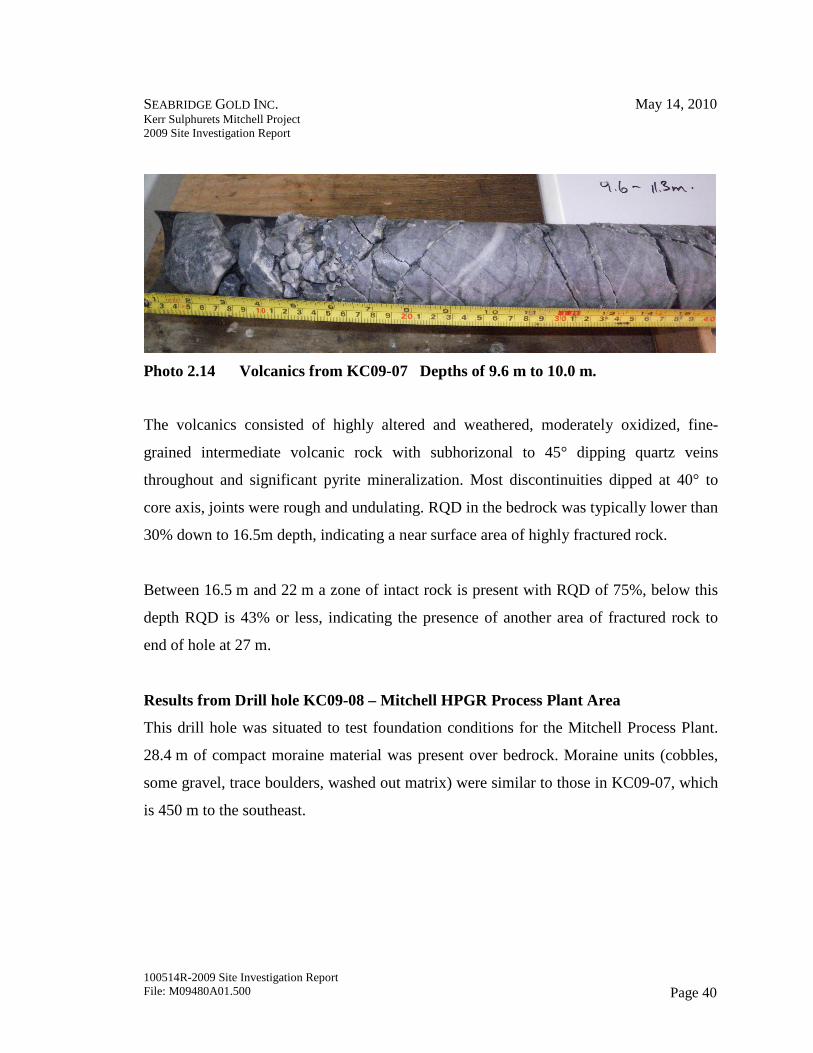
Photo 2.14 Volcanics from KC09-07 Depths of 9.6 m to 10.0 m.
The volcanics consisted of highly altered and weathered, moderately oxidized, fine-
grained intermediate volcanic rock with subhorizonal to 45° dipping quartz veins
throughout and significant pyrite mineralization. Most discontinuities dipped at 40° to
core axis, joints were rough and undulating. RQD in the bedrock was typically lower than
30% down to 16.5m depth, indicating a near surface area of highly fractured rock.
Between 16.5 m and 22 m a zone of intact rock is present with RQD of 75%, below this
depth RQD is 43% or less, indicating the presence of another area of fractured rock to
end of hole at 27 m.
Results from Drill hole KC09-08 – Mitchell HPGR Process Plant Area
This drill hole was situated to test foundation conditions for the Mitchell Process Plant.
28.4 m of compact moraine material was present over bedrock. Moraine units (cobbles,
some gravel, trace boulders, washed out matrix) were similar to those in KC09-07, which
is 450 m to the southeast.
SEABRIDGE GOLD INC. May 14, 2010 Kerr Sulphurets Mitchell Project 2009 Site Investigation Report
100514R-2009 Site Investigation Report File: M09480A01.500 Page 41
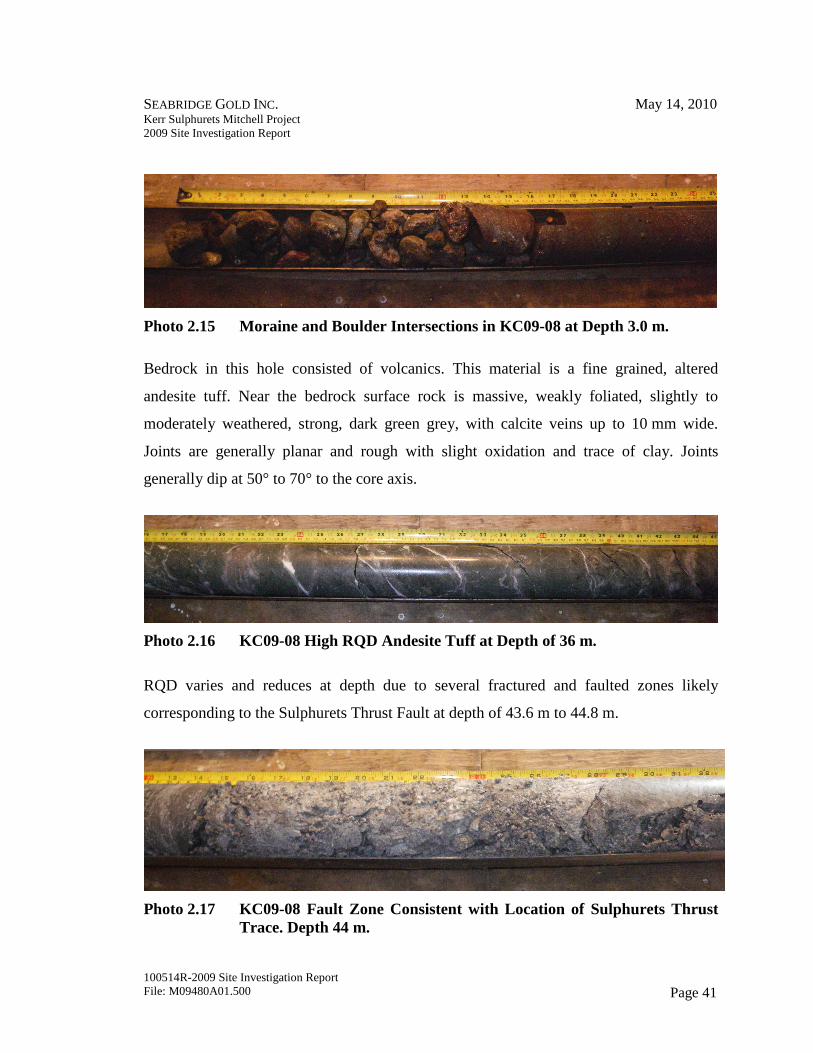
Photo 2.15 Moraine and Boulder Intersections in KC09-08 at Depth 3.0 m.
Bedrock in this hole consisted of volcanics. This material is a fine grained, altered
andesite tuff. Near the bedrock surface rock is massive, weakly foliated, slightly to
moderately weathered, strong, dark green grey, with calcite veins up to 10 mm wide.
Joints are generally planar and rough with slight oxidation and trace of clay. Joints
generally dip at 50° to 70° to the core axis.
Photo 2.16 KC09-08 High RQD Andesite Tuff at Depth of 36 m.
RQD varies and reduces at depth due to several fractured and faulted zones likely
corresponding to the Sulphurets Thrust Fault at depth of 43.6 m to 44.8 m.
Photo 2.17 KC09-08 Fault Zone Consistent with Location of Sulphurets Thrust Trace. Depth 44 m.
SEABRIDGE GOLD INC. May 14, 2010 Kerr Sulphurets Mitchell Project 2009 Site Investigation Report
100514R-2009 Site Investigation Report File: M09480A01.500 Page 42
The moraine material would provide an easily excavatable platform for buildings but
would not be a suitable foundation for heavy vibrating machinery which would likely be
need to be placed on an excavation into rock.
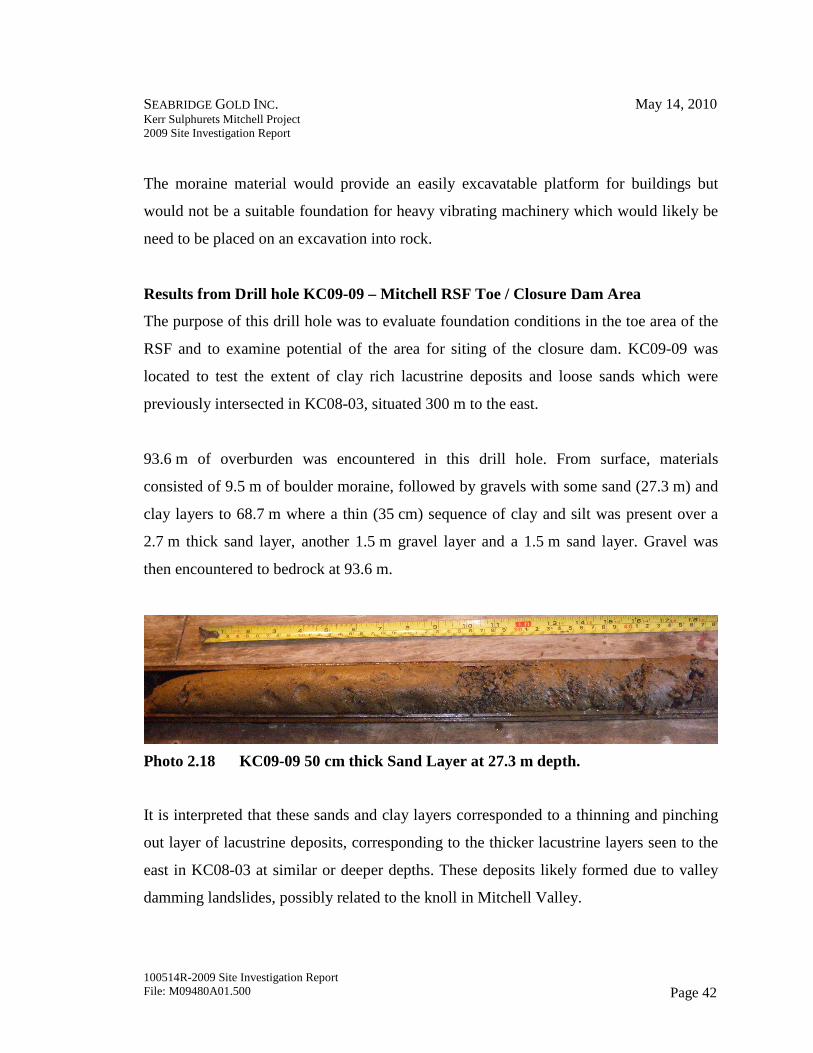
Results from Drill hole KC09-09 – Mitchell RSF Toe / Closure Dam Area
The purpose of this drill hole was to evaluate foundation conditions in the toe area of the
RSF and to examine potential of the area for siting of the closure dam. KC09-09 was
located to test the extent of clay rich lacustrine deposits and loose sands which were
previously intersected in KC08-03, situated 300 m to the east.
93.6 m of overburden was encountered in this drill hole. From surface, materials
consisted of 9.5 m of boulder moraine, followed by gravels with some sand (27.3 m) and
clay layers to 68.7 m where a thin (35 cm) sequence of clay and silt was present over a
2.7 m thick sand layer, another 1.5 m gravel layer and a 1.5 m sand layer. Gravel was
then encountered to bedrock at 93.6 m.
Photo 2.18 KC09-09 50 cm thick Sand Layer at 27.3 m depth.
It is interpreted that these sands and clay layers corresponded to a thinning and pinching
out layer of lacustrine deposits, corresponding to the thicker lacustrine layers seen to the
east in KC08-03 at similar or deeper depths. These deposits likely formed due to valley
damming landslides, possibly related to the knoll in Mitchell Valley.
SEABRIDGE GOLD INC. May 14, 2010 Kerr Sulphurets Mitchell Project 2009 Site Investigation Report
100514R-2009 Site Investigation Report File: M09480A01.500 Page 43
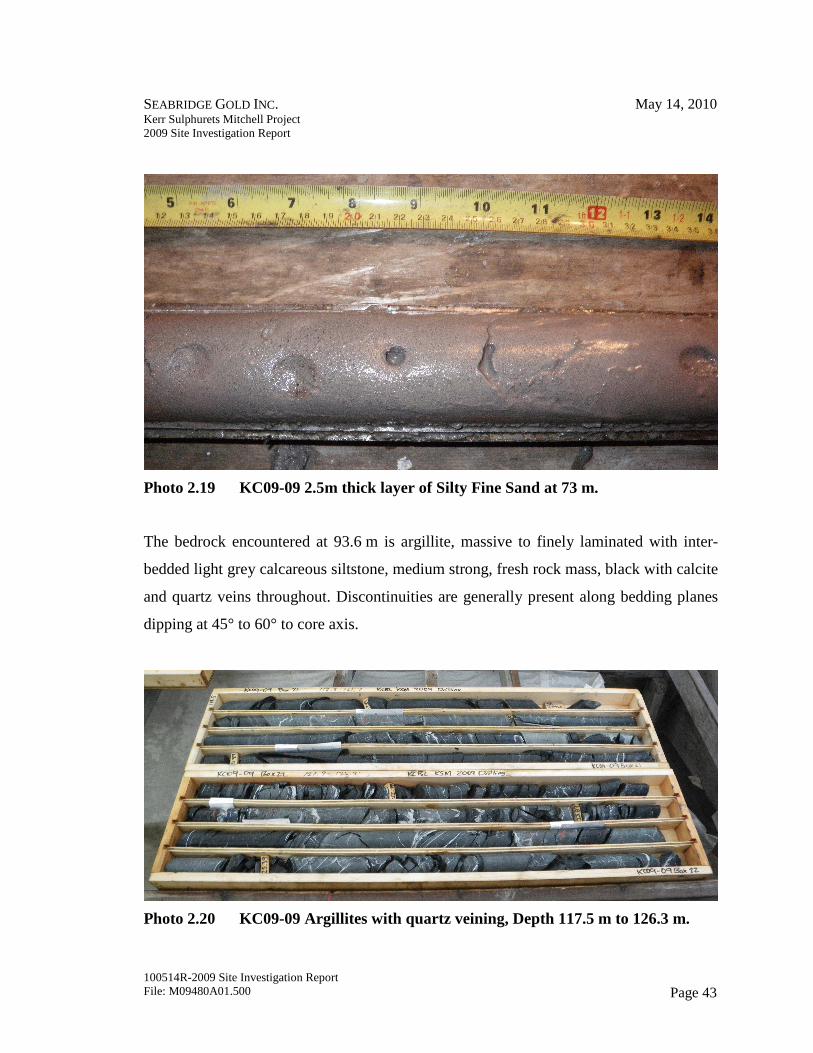
Photo 2.19 KC09-09 2.5m thick layer of Silty Fine Sand at 73 m.
The bedrock encountered at 93.6 m is argillite, massive to finely laminated with inter-
bedded light grey calcareous siltstone, medium strong, fresh rock mass, black with calcite
and quartz veins throughout. Discontinuities are generally present along bedding planes
dipping at 45° to 60° to core axis.
Photo 2.20 KC09-09 Argillites with quartz veining, Depth 117.5 m to 126.3 m.
SEABRIDGE GOLD INC. May 14, 2010 Kerr Sulphurets Mitchell Project 2009 Site Investigation Report
100514R-2009 Site Investigation Report File: M09480A01.500 Page 44
A 2.2 m thick sheared fault zone is intersected at 107.7 m, possibly again the Sulphurets
Thrust Fault. The hole continues in argillite with several small felsic intrusives and fault
zones and terminates at 126 m.
Sulphurets Rock Storage Facility Area Drill Holes
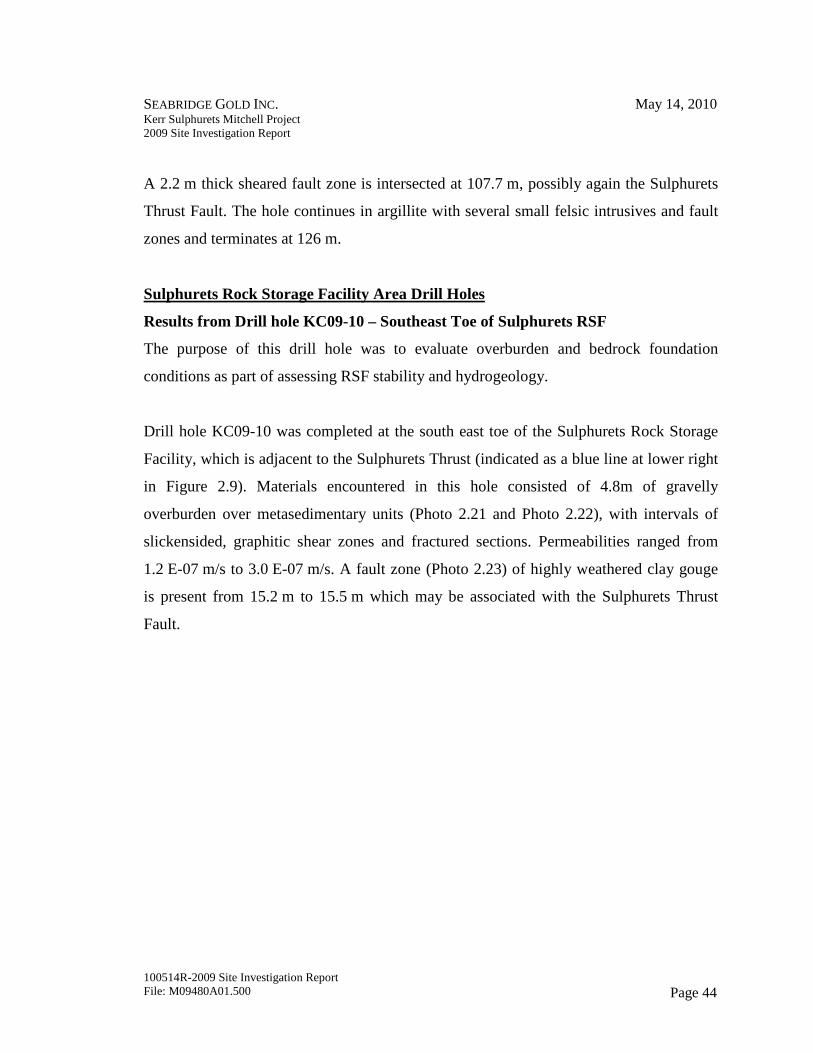
Results from Drill hole KC09-10 – Southeast Toe of Sulphurets RSF
The purpose of this drill hole was to evaluate overburden and bedrock foundation
conditions as part of assessing RSF stability and hydrogeology.
Drill hole KC09-10 was completed at the south east toe of the Sulphurets Rock Storage
Facility, which is adjacent to the Sulphurets Thrust (indicated as a blue line at lower right
in Figure 2.9). Materials encountered in this hole consisted of 4.8m of gravelly
overburden over metasedimentary units (Photo 2.21 and Photo 2.22), with intervals of
slickensided, graphitic shear zones and fractured sections. Permeabilities ranged from
1.2 E-07 m/s to 3.0 E-07 m/s. A fault zone (Photo 2.23) of highly weathered clay gouge
is present from 15.2 m to 15.5 m which may be associated with the Sulphurets Thrust
Fault.
SEABRIDGE GOLD INC. May 14, 2010 Kerr Sulphurets Mitchell Project 2009 Site Investigation Report
100514R-2009 Site Investigation Report File: M09480A01.500 Page 45
Figure 2.9 Sulphurets Rock Storage Facility and Selected Locations for KCBL
foundation area Geotechnical Drill holes and Rescan Monitoring wells.
Photo 2.21 KC09-10 5.5 metres, Fine to Medium Grained Metasedimentary
Units.
SEABRIDGE GOLD INC. May 14, 2010 Kerr Sulphurets Mitchell Project 2009 Site Investigation Report
100514R-2009 Site Investigation Report File: M09480A01.500 Page 46
Photo 2.22 KC09-10 7.5 metres, Fine to Medium Grained Metasedimentary Units.
Photo 2.23 KC09-10 15.5 m Clay Gouge Layers in Weathered Fault Zone within Metasediments.
SEABRIDGE GOLD INC. May 14, 2010 Kerr Sulphurets Mitchell Project 2009 Site Investigation Report
100514R-2009 Site Investigation Report File: M09480A01.500 Page 47
Drill hole KC09-11 – Southwest Toe of Sulphurets RSF
Drill hole KC09-11 was completed in the southwest toe of the Sulphurets RSF. A thin
layer (1.2 m) of overburden was present over strong laminated argillites. Occasional 1 m
to 2 m thick intrusive dykes of granodiorite were present in drill hole KC09-11 which
was otherwise argillite, and metasandstone units. Quartz veining is abundant (Photo 2.24)
along with pyrite mineralization. The argillitic sediments are typically strong to medium
strong. Permeabilities ranged from 2 E-06 m/s in a fractured zone, to 8.4 E-08 m/s in a
area of little fracturing.
Photo 2.24 KC09-11 8.5 m, Argillite with Quartz veins adjacent to Intrusives.
Summary of Drill Program Results in the Sulphurets RSF Area
Overburden in the Sulphurets Rock Storage Facility footprint area is typically shallow
(0 m to 4 m) and consists either of organics, or pockets of colluvium and moraine
material (cobbles, gravels). The RSF foundation primarily consists of fresh to moderately
SEABRIDGE GOLD INC. May 14, 2010 Kerr Sulphurets Mitchell Project 2009 Site Investigation Report
100514R-2009 Site Investigation Report File: M09480A01.500 Page 48
weathered, strong to moderately strong metasediments and argillites. Sequences of
granodiorite intrusives are present in the western toe area. Shear zones and clay gouge
fault zones are present at 10 m and 20 m depths in the eastern toe area.
Water Storage Facility Area Drill Holes
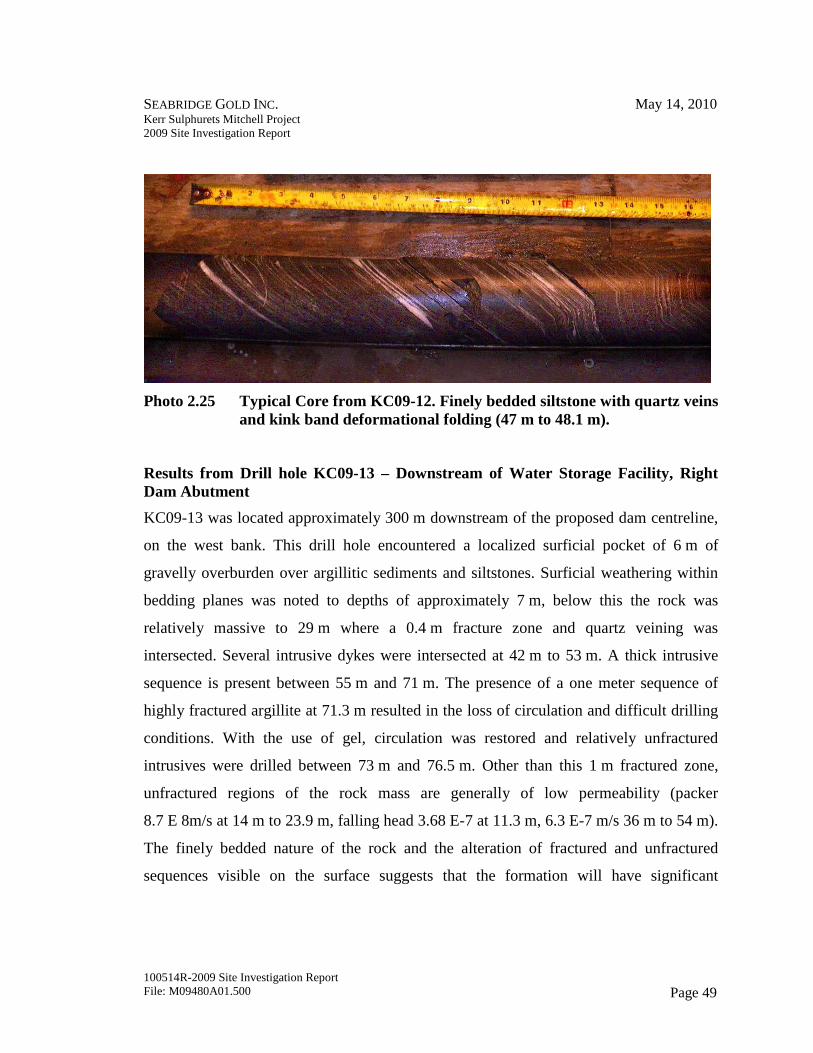
Results from Drill hole KC09-12 – Water Storage Facility Pond / Moraine Borrow Area
Drill hole KC09-12 was situated at the base of the slope above the west side of the Water
Storage Pond. A prominent moraine deposit is seen exposed just to the east of the drill
site within the cut banks exposed in Lower Mitchell Creek below its confluence with
McTagg Creek. Overburden consisted of sand moraine to depth of 10.5 m over a 0.4 m of
clay layer. The remainder of overburden was mixed gravel and sand moraine with thin
clay layers down to argillitic bedrock at 33 m. Argillite was black, slightly weathered,
weak, and fractured with disseminated pyrite, quartz and calcite veins throughout,
bedding dipped at 35° - 65° to the core axis corresponding to the westerly dips seen at the
site. Packer testing showed that the unfractured rock mass had low permeability (3.56 to
5.7 x 10 -8 m/s). However several 0.5 m thick fractured fault zones were present near
42 m depth.
SEABRIDGE GOLD INC. May 14, 2010 Kerr Sulphurets Mitchell Project 2009 Site Investigation Report
100514R-2009 Site Investigation Report File: M09480A01.500 Page 49
Photo 2.25 Typical Core from KC09-12. Finely bedded siltstone with quartz veins and kink band deformational folding (47 m to 48.1 m).
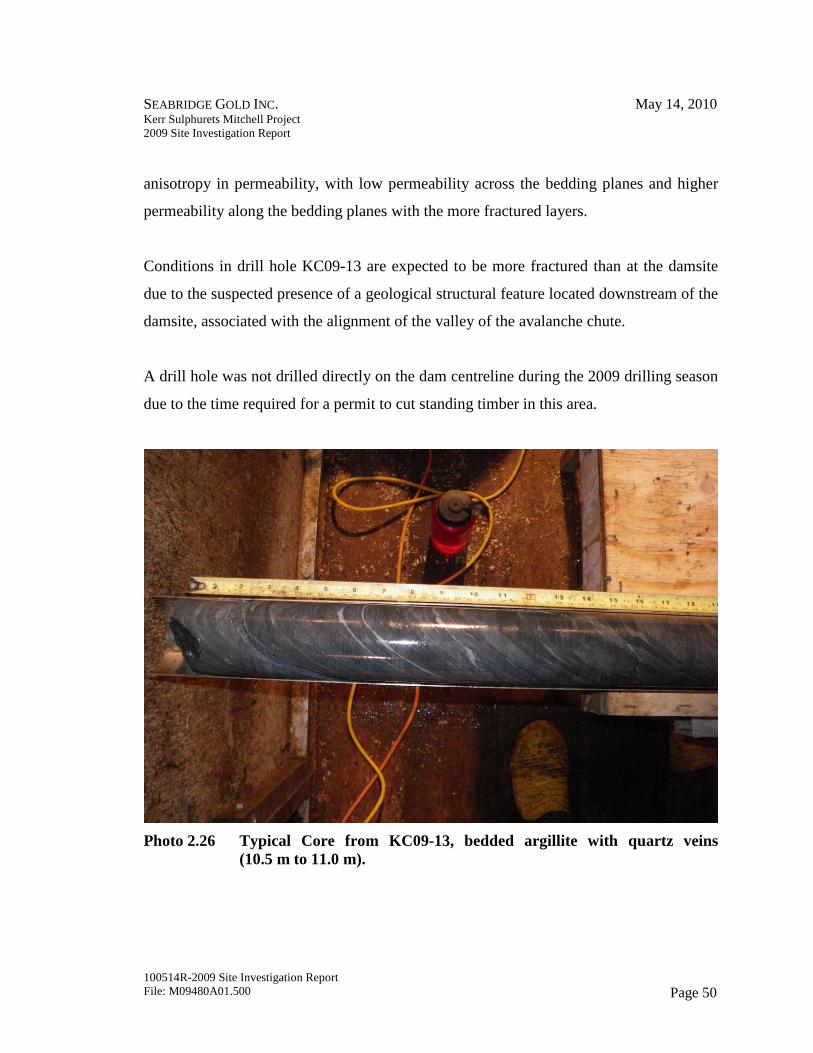
Results from Drill hole KC09-13 – Downstream of Water Storage Facility, Right Dam Abutment
KC09-13 was located approximately 300 m downstream of the proposed dam centreline,
on the west bank. This drill hole encountered a localized surficial pocket of 6 m of
gravelly overburden over argillitic sediments and siltstones. Surficial weathering within
bedding planes was noted to depths of approximately 7 m, below this the rock was
relatively massive to 29 m where a 0.4 m fracture zone and quartz veining was
intersected. Several intrusive dykes were intersected at 42 m to 53 m. A thick intrusive
sequence is present between 55 m and 71 m. The presence of a one meter sequence of
highly fractured argillite at 71.3 m resulted in the loss of circulation and difficult drilling
conditions. With the use of gel, circulation was restored and relatively unfractured
intrusives were drilled between 73 m and 76.5 m. Other than this 1 m fractured zone,
unfractured regions of the rock mass are generally of low permeability (packer
8.7 E 8m/s at 14 m to 23.9 m, falling head 3.68 E-7 at 11.3 m, 6.3 E-7 m/s 36 m to 54 m).
The finely bedded nature of the rock and the alteration of fractured and unfractured
sequences visible on the surface suggests that the formation will have significant
SEABRIDGE GOLD INC. May 14, 2010 Kerr Sulphurets Mitchell Project 2009 Site Investigation Report
100514R-2009 Site Investigation Report File: M09480A01.500 Page 50
anisotropy in permeability, with low permeability across the bedding planes and higher
permeability along the bedding planes with the more fractured layers.
Conditions in drill hole KC09-13 are expected to be more fractured than at the damsite
due to the suspected presence of a geological structural feature located downstream of the
damsite, associated with the alignment of the valley of the avalanche chute.
A drill hole was not drilled directly on the dam centreline during the 2009 drilling season
due to the time required for a permit to cut standing timber in this area.
Photo 2.26 Typical Core from KC09-13, bedded argillite with quartz veins (10.5 m to 11.0 m).
SEABRIDGE GOLD INC. May 14, 2010 Kerr Sulphurets Mitchell Project 2009 Site Investigation Report
100514R-2009 Site Investigation Report File: M09480A01.500 Page 51
Results of Drill hole RES-MW-15 Water Storage Dam Area (Downstream of Left Abutment) A summary of results from an adjacent monitoring well, RES-MW-15 drilled by Rescan
is included here for reference. This hole was located on the east bank of Mitchell Creek,
450 m downstream of the proposed dam centreline. For ease of reference, the log of this
Rescan drill hole is included in Appendix I, along with the KCB drill hole logs.
Several sheared zones of lower permeability were intersected in RES-MW-15. Shallower
sections (to 26 m depth) intersected by this well consist of siltstones and argillite. Below
this depth, the well primarily intersected sequences of granodioritic intrusive, with some
argillite sequences. Rock quality (RQD) was variable, with numerous zones of broken
core. Packer tests ranged from 7.9 E-9 m/s in regions of intact intrusives at depth (73 m
to 100 m) to 1.34 E-7 m/s in near surface (7 m to 18 m) argillites.
SEABRIDGE GOLD INC. May 14, 2010 Kerr Sulphurets Mitchell Project 2009 Site Investigation Report
100514R-2009 Site Investigation Report File: M09480A01.500 Page 52
3. 2009 LABORATORY TESTING PROGRAM
3.1 KCB Testing on Soils
Selected soil samples collected during site investigation in July and September 2010 were
tested in KCB’s laboratory in Vancouver. The testing program included:
• Visual classification including reaction with hydrochloric acid;
• Index tests:
• Moisture content;
• Grain size distribution (including hydrometer test); and
• Atterberg limits.
• Direct shear and consolidated undrained triaxial test(including permeability testing);
• Compaction test (standard proctor);
• Constant head permeability test;
• Temp cell permeability test (permeability vs. %saturation); and
• ABA (acid-base accounting - % sulphur and calcium carbonate equivalent).
The reports of these test results are presented in Appendix V, KCB Lab Testing, of this
report. The test results are also summarized and interpreted in Section 3 of the
Pre-feasibility Study Report of the project. The number of tests conducted in 2009 is
shown in Table 3.1. These do not include the number of tests conducted for 2008 site
investigations.
SEABRIDGE GOLD INC. May 14, 2010 Kerr Sulphurets Mitchell Project 2009 Site Investigation Report
100514R-2009 Site Investigation Report File: M09480A01.500 Page 53
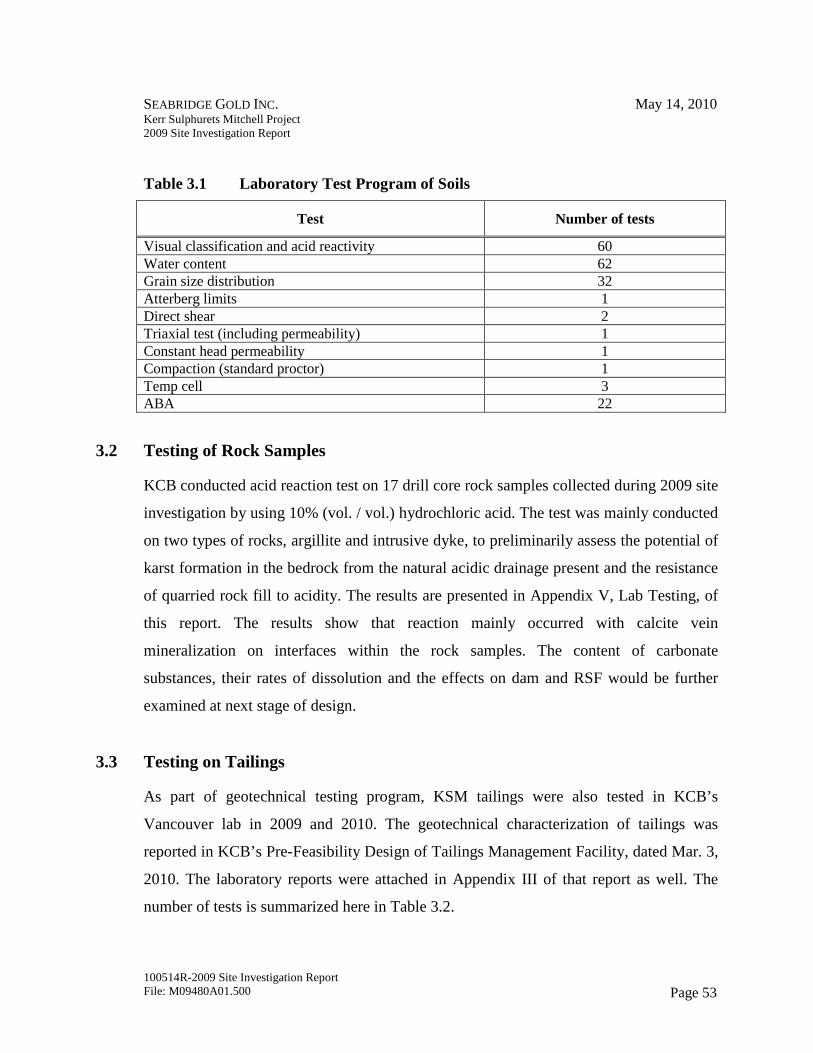
Table 3.1 Laboratory Test Program of Soils
Test Number of tests
Visual classification and acid reactivity 60 Water content 62 Grain size distribution 32 Atterberg limits 1 Direct shear 2 Triaxial test (including permeability) 1 Constant head permeability 1 Compaction (standard proctor) 1 Temp cell 3 ABA 22
3.2 Testing of Rock Samples
KCB conducted acid reaction test on 17 drill core rock samples collected during 2009 site
investigation by using 10% (vol. / vol.) hydrochloric acid. The test was mainly conducted
on two types of rocks, argillite and intrusive dyke, to preliminarily assess the potential of
karst formation in the bedrock from the natural acidic drainage present and the resistance
of quarried rock fill to acidity. The results are presented in Appendix V, Lab Testing, of
this report. The results show that reaction mainly occurred with calcite vein
mineralization on interfaces within the rock samples. The content of carbonate
substances, their rates of dissolution and the effects on dam and RSF would be further
examined at next stage of design.
3.3 Testing on Tailings
As part of geotechnical testing program, KSM tailings were also tested in KCB’s
Vancouver lab in 2009 and 2010. The geotechnical characterization of tailings was
reported in KCB’s Pre-Feasibility Design of Tailings Management Facility, dated Mar. 3,
2010. The laboratory reports were attached in Appendix III of that report as well. The
number of tests is summarized here in Table 3.2.
SEABRIDGE GOLD INC. May 14, 2010 Kerr Sulphurets Mitchell Project 2009 Site Investigation Report
100514R-2009 Site Investigation Report File: M09480A01.500 Page 54
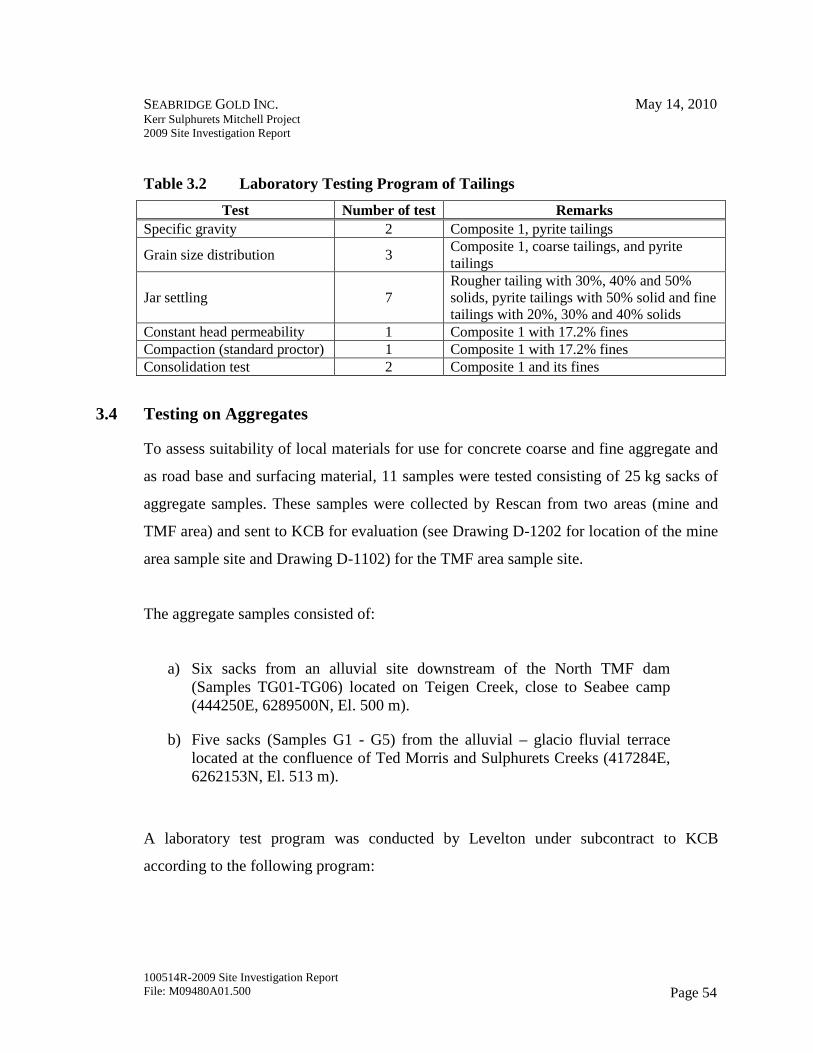
Table 3.2 Laboratory Testing Program of Tailings
Test Number of test Remarks Specific gravity 2 Composite 1, pyrite tailings
Grain size distribution 3 Composite 1, coarse tailings, and pyrite tailings
Jar settling 7 Rougher tailing with 30%, 40% and 50% solids, pyrite tailings with 50% solid and fine tailings with 20%, 30% and 40% solids
Constant head permeability 1 Composite 1 with 17.2% fines Compaction (standard proctor) 1 Composite 1 with 17.2% fines Consolidation test 2 Composite 1 and its fines
3.4 Testing on Aggregates
To assess suitability of local materials for use for concrete coarse and fine aggregate and
as road base and surfacing material, 11 samples were tested consisting of 25 kg sacks of
aggregate samples. These samples were collected by Rescan from two areas (mine and
TMF area) and sent to KCB for evaluation (see Drawing D-1202 for location of the mine
area sample site and Drawing D-1102) for the TMF area sample site.
The aggregate samples consisted of:
a) Six sacks from an alluvial site downstream of the North TMF dam (Samples TG01-TG06) located on Teigen Creek, close to Seabee camp (444250E, 6289500N, El. 500 m).
b) Five sacks (Samples G1 - G5) from the alluvial – glacio fluvial terrace located at the confluence of Ted Morris and Sulphurets Creeks (417284E, 6262153N, El. 513 m).
A laboratory test program was conducted by Levelton under subcontract to KCB
according to the following program:
SEABRIDGE GOLD INC. May 14, 2010 Kerr Sulphurets Mitchell Project 2009 Site Investigation Report
100514R-2009 Site Investigation Report File: M09480A01.500 Page 55
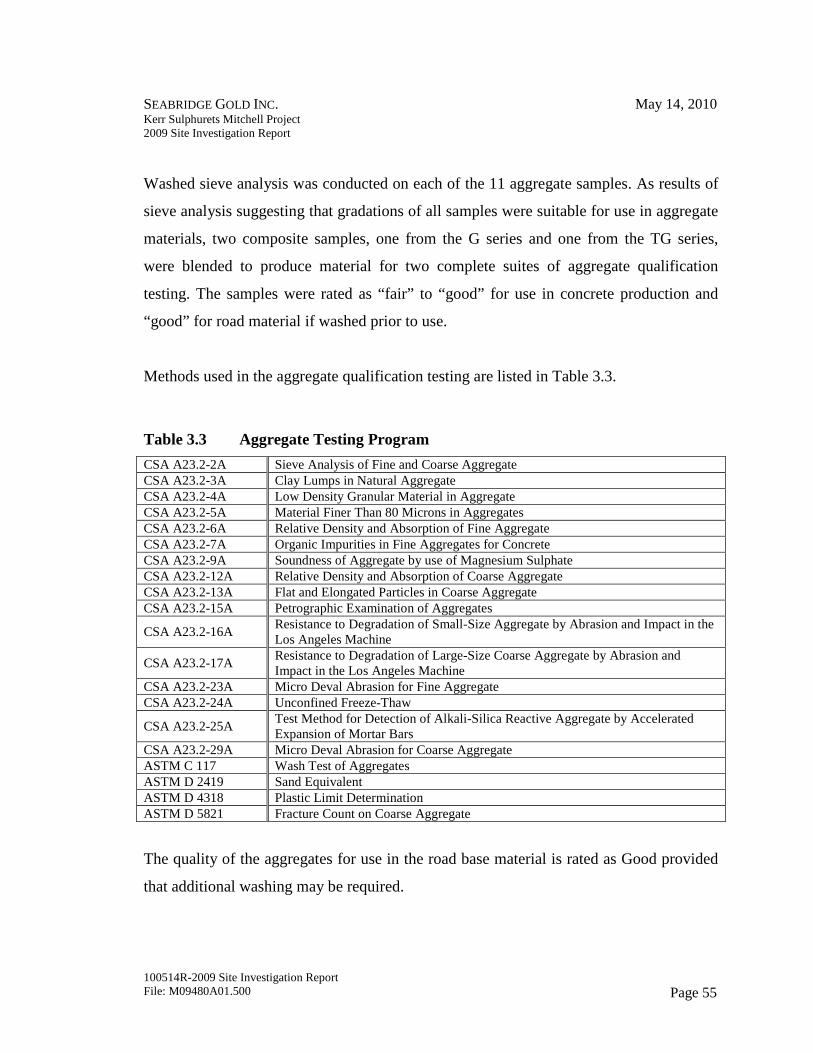
Washed sieve analysis was conducted on each of the 11 aggregate samples. As results of
sieve analysis suggesting that gradations of all samples were suitable for use in aggregate
materials, two composite samples, one from the G series and one from the TG series,
were blended to produce material for two complete suites of aggregate qualification
testing. The samples were rated as “fair” to “good” for use in concrete production and
“good” for road material if washed prior to use.
Methods used in the aggregate qualification testing are listed in Table 3.3.
Table 3.3 Aggregate Testing Program
CSA A23.2-2A Sieve Analysis of Fine and Coarse Aggregate CSA A23.2-3A Clay Lumps in Natural Aggregate CSA A23.2-4A Low Density Granular Material in Aggregate CSA A23.2-5A Material Finer Than 80 Microns in Aggregates CSA A23.2-6A Relative Density and Absorption of Fine Aggregate CSA A23.2-7A Organic Impurities in Fine Aggregates for Concrete CSA A23.2-9A Soundness of Aggregate by use of Magnesium Sulphate CSA A23.2-12A Relative Density and Absorption of Coarse Aggregate CSA A23.2-13A Flat and Elongated Particles in Coarse Aggregate CSA A23.2-15A Petrographic Examination of Aggregates
CSA A23.2-16A Resistance to Degradation of Small-Size Aggregate by Abrasion and Impact in the Los Angeles Machine
CSA A23.2-17A Resistance to Degradation of Large-Size Coarse Aggregate by Abrasion and Impact in the Los Angeles Machine
CSA A23.2-23A Micro Deval Abrasion for Fine Aggregate CSA A23.2-24A Unconfined Freeze-Thaw
CSA A23.2-25A Test Method for Detection of Alkali-Silica Reactive Aggregate by Accelerated Expansion of Mortar Bars
CSA A23.2-29A Micro Deval Abrasion for Coarse Aggregate ASTM C 117 Wash Test of Aggregates ASTM D 2419 Sand Equivalent ASTM D 4318 Plastic Limit Determination ASTM D 5821 Fracture Count on Coarse Aggregate
The quality of the aggregates for use in the road base material is rated as Good provided
that additional washing may be required.

SEABRIDGE GOLD INC. May 14, 2010 Kerr Sulphurets Mitchell Project 2009 Site Investigation Report
100514R-2009 Site Investigation Report File: M09480A01.500 Page 56
The quality of the aggregate for use in concrete is rated as Fair to Good, but long term
alkali aggregate reactivity and some potential effects for strength and durability issues
should be tested.
See Appendix VI for the complete aggregate laboratory report prepared by Levelton
Consultants Ltd.

SEABRIDGE GOLD INC. May 14, 2010 Kerr Sulphurets Mitchell Project 2009 Site Investigation Report
100514R-2009 Site Investigation Report File: M09480A01.500 Page 57
4. SUMMARY OF RESULTS OF 2009 SITE INVESTIGATIONS
4.1 Results of Investigations in Water Storage Facility Area
A key aspect of the strategy for leachate containment from the Rock Storage Facility
(RSF) is the construction of a water retaining dam in the lower Mitchell canyon area to
form the Water Storage Facility.
The strong, typically lightly fractured, favourably oriented bedrock exposed in the narrow
valley this area suggests that geological containment can be achieved for leachate from
RSFs located further upstream in the Mitchell and McTagg valleys. The presence of only
minimal weathered rock or overburden at the Water Storage Dam site suggests that a
water retaining dam is feasible at the site. Grouting of the damsite would likely be
required due to the presence of erratic fractures between bedding planes. Figure 9
illustrates the geology of the Water Storage Pond Area.
Borrow material for dam core, drain and filter zones has been identified in the area 1 km
to 2 km upstream of the dam. Rock suitable for quarrying for dam fill is located adjacent
to the dam site.
4.2 Results of Site Investigations in Areas of Rock Storage Facilities
4.2.1 Results for Mitchell – McTagg Rock Storage Facility Area
Drilling in 2009 accompanied by geophysical surveys and further mapping established
foundation conditions in the footprint area of the Mitchell Valley Rock Storage Facility.
Drill hole KC09-09 established that the lacustrine clays identified in 2008 at KC08-03 do
not extend as far west as the site of KC09-09. These clay layers likely pinch out between
the drill holes. Figure 2.4 indicates the interpreted extent of the lacustrine material in the
SEABRIDGE GOLD INC. May 14, 2010 Kerr Sulphurets Mitchell Project 2009 Site Investigation Report
100514R-2009 Site Investigation Report File: M09480A01.500 Page 58
Mitchell Process Plant area. Layers of sand (Photo 2.19), likely proximal to the lacustrine
deposits, were intersected by KC09-09. These were similar to the sand layers seen in
KC08-03.
Surface mapping in the area of the McTagg-Mitchell confluence showed that additional
lenses of sands and lacustrine silt are present in this area. These lenses are interbedded
within moraine, fluvial and colluvial deposits in the valley bottom areas, suggesting that
intermittent landslide damming has occurred at several times, in several areas of the
valley. These landslide events are likely related to failures along the over-steepened
valley walls, or collapses of lateral moraine deposits upon the recent retreat of the
glaciers.
Investigations in upper McTagg Valley identified deposits of lateral moraine material in
the McTagg headwater areas which were sampled for materials testing. Photo Plate VI-14
illustrates features of the McTagg dump headwaters area, including the location of the
Stage I inlet portal location and the locations of moraine deposits.
4.3 Results for Mitchell Process Plant Area
The seismic survey was used to establish depths to bedrock within the Mitchell Valley
and was also used to site plantsite components and direct drill testing of the sites.
Drawing D-1227 presents depths along the seismic lines and detailed overburden seismic
depth contours for the Mitchell Plant area. Drawing D-1203 includes generalized
overburden depth contours for the entire Mine Area based on drilling and airphoto
analysis
In the area near the crusher site, drill hole KC09-07, located 150 m to the southwest of
the site shows that weathered volcanic rock is shallow (3 m) and that bedrock foundations
SEABRIDGE GOLD INC. May 14, 2010 Kerr Sulphurets Mitchell Project 2009 Site Investigation Report
100514R-2009 Site Investigation Report File: M09480A01.500 Page 59
will likely be available for the crusher. Depth to bedrock in the Rescan monitoring well
RES-MW09-04 located 150 m south of the crusher was also shallow (2.4 m depth).
The HPGR site is located 75 m off SL-06, between SL-05 and SL-04. In this area of the
seismic line seismic depths are approximately 10 m to 7 m. Bedrock depths are likely
shallower at the HPGR site, as the site is higher up on the valley wall where the cover
composed of talus, colluvial material and moraine gravels to cobbles is thinner.
The grinding building is proposed to be situated at the north end of SL-03 where seismic
depths to bedrock are indicated to be 10 m or less. KC-09-08 was located in a gully
slightly to the south east of this area and intersected 28.4m of moraine overburden over
volcanic in an area where seismically indicated depths were similar.
The secondary crusher site is proposed to be situated in an area lower down in Mitchell
Valley, along SL-01, where seismically indicated depths are 14 m to 18 m.
4.3.1 Results for Sulphurets Ridge Rock Storage Facility
Drilling in this area showed that the southeastern toe of the Sulpurets RSF is founded in
an area of fractured rock, likely associated with the Sulphurets Thrust fault. Rock in the
area of the RSF is generally sedimentary (argillites) but is intruded by the Mitchell
Intrusives (granodiorites). Some foundation rocks contain graphite on bedding planes
however the orientations of the west dipping planes are favourable for slope stability,
except at the extreme western limit of the Sulphurets RSF.
SEABRIDGE GOLD INC. May 14, 2010 Kerr Sulphurets Mitchell Project 2009 Site Investigation Report
100514R-2009 Site Investigation Report File: M09480A01.500 Page 60
4.4 Mine Area Borrow Materials and Surficial Moraine and Till Deposits
Surficial till deposits in the Mitchell, McTagg and Ted Morris valleys were mapped and
sampled during 2009 to assess the suitability of using these materials as low-permeability
liner or cap material for PAG Rock Storage Facilities.
Drawing D-1203 shows the estimated extent of overburden (primarily moraine / till
deposits) in this region, based on limited drilling, field traverses and aerial flyovers.
Washed sieve testing of till samples from Mitchell and McTagg Valleys showed that
these materials are typically gravelly sand with some fines (moraine). Testing of the
material (Appendix V) gave permeability values on the order of 1x10⁻⁶ m/s. Additional
samples should be collected to verify these permeability results, which are high for a till,
but consistent with a sandy moraine. Permeability testing (Appendix V) indicates that
these materials would likely not be highly effective as a low permeability cover for the
Rock Storage Facilities, but would be suitable for use as a reclamation cover.
Some low permeability materials are present, but only as lenses and layers of lacustine
silts and clays in deposits of limited volumes. These materials may be suitable for dam
core construction. Most overburden materials in the Mitchell-McTagg area are reactive
with HCL, as a consequence of their origin from marine sedimentary rocks.
Approximately 50% of the KCB overburden samples tested by Rescan for Acid Base
Accounting (%sulphide) and metal leaching properties may be susceptible to either ARD
or ML.
Based on the mapping presented in Drawing 6, and assuming that there is 3 m of
recoverable till in thin sections and 15 m in thick sections, we estimate that there is
approximately 45 Mm3 of moraine material available in the Mitchell/McTagg area, and
an additional 35 Mm3 of moraine / alluvial materials in the Sulphurets Valley/Ted Morris
SEABRIDGE GOLD INC. May 14, 2010 Kerr Sulphurets Mitchell Project 2009 Site Investigation Report
100514R-2009 Site Investigation Report File: M09480A01.500 Page 61
Valley areas. A 0.5 m reclamation cover over the surface of the RSFs would require
approximately 6 Mm3 of material.
Several extensive areas of alluvials (sands and well rounded gravels/cobbles) are present
as terraces near the Ted Morris – Sulphurets creek confluence. Alluvial gravels from
these areas can be used to produce filter zone fill for the WSP dam.
4.5 TMF Area Site Investigation Results
The seismic survey resulted in profiles of overburden thicknesses in the TMF dam
footprint area (Appendix II).
Within the north dam footprint, overburden thickness varied from 3 m to 35 m. This
information was used for geotechnical stability assessment and was input into modelling
software for assessment of seepage flows under the TMF dam structures.
Seismic lines were run at the original site of the South dam but overburden thickness was
found to be up to 60 m deep, as a result the alignment of the south dam was shifted to the
west. It is recommended that the new alignment of the South dam be surveyed in 2010
with additional seismic lines to verify conditions within the dam footprint.
Seismic data obtained in 2009 included Multi Channel Analysis Shear Wave (MASW)
soundings of shear wave velocity versus depth. These were used by KCB to assess
liquefaction potential for the south dam foundation area. The TMF Geotechnical Design
Report (KCB 2010) presents results of this data. Other than some shallow alluvial soils
which would be removed, the site was not susceptible to liquefaction.
SEABRIDGE GOLD INC. May 14, 2010 Kerr Sulphurets Mitchell Project 2009 Site Investigation Report
100514R-2009 Site Investigation Report File: M09480A01.500 Page 62
During 2009 water levels and piezometer slug test were recorded by Rescan from drill
holes drilled by KCB and Rescan in the TMF area.
SEABRIDGE GOLD INC. May 14, 2010 Kerr Sulphurets Mitchell Project 2009 Site Investigation Report
100514R-2009 Site Investigation Report File: M09480A01.500 Page 63
5. RECOMMENDATIONS
The following site investigations are recommended for summer 2010 in order to support
feasibility level designs and an EIA permit application:
1. Detailed geotechnical drilling program of TSF Dam Foundation Areas. This program will consist of four overburden (sampling, SPT tests, falling head permeabilities) and four bedrock (diamond coring, packer testing) drill holes at each dam site. The drill pattern would consist of two holes on the abutments to depth of 150 m and one hole at the downstream toe and one hole at the centreline to 250 m. Each seepage dam will require a drill hole to 50 m. Total metres for each dam is thus estimated to be 850 m for a total of 1900 m of drilling for both dams. Two additional seismic lines should be conducted in the area of the south dam footprint as the dam has been shifted from the previous alignment.
2. Since access to and across the site is not available for excavating equipment to sample TMF area borrow materials by test pitting, geotechnical investigations can be advanced using geophysical methods (seismic, resistivity) to determine depth of available borrow materials and light heliportable auger rigs to sample material properties. It is recommended that 4 km of seismic and/or resistivity coverage be used to map borrow area thicknesses and that 12 overburden sampling holes be completed to sample borrow materials.
3. Four 25 m deep diamond core holes will be required to sample the Teigen process plant area bedrock for strength testing for plant foundation design and to establish permeabilities of bedrock in the area.
4. Each of the ten tunnel portal areas included in the project will require geotechnical mapping and a drill hole to establish rock mass quality to for rock support and geotechnical designs required for portal protection. Each drill hole would typically be 30 m deep, for a total of 300 m of geotechnical drilling.
5. Drilling along the Water Storage Facility Dam alignment will be required to design the grouting program and to confirm geotechnical properties of the foundation. Four diamond core drill holes to depths from 150 m to 200 m will be required for a total of 700 m of geotechnical foundation
SEABRIDGE GOLD INC. May 14, 2010 Kerr Sulphurets Mitchell Project 2009 Site Investigation Report
100514R-2009 Site Investigation Report File: M09480A01.500 Page 64
drilling. An additional 200 m of overburden drill sampling in four borrow sites near the dam will also be required.
6. The area of the Mitchell Glacier subglacial intake will require drilling through the 100 m ice cover and 30 m into bedrock. The objective of the program is to establish rock elevations and rock mass quality to finalize locations for the intake to intercept the water channel and to guide construction methods and support design for the intake structures. It is expected that six drill holes for a total of 780 m of drilling will ultimately be required for detail design, however three holes would be sufficient to establish feasibility of the concept. Additional ice radar surveying in the Mitchell Inlet area would be useful if conducted before and would detail the exact area of the intake and reduce drilling requirements.
KLOHN CRIPPEN BERGER LTD.
Graham Parkinson, P.Geo. Project Manager
SEABRIDGE GOLD INC. May 14, 2010 Kerr Sulphurets Mitchell Project 2009 Site Investigation Report
100514R-2009 Site Investigation Report File: M09480A01.500 Page 65
REFERENCES
Bridge, D.J. (1990), The Deformed Jurassic Kerr Copper-Gold Porphyry Deposit, Sulphurets Gold Camp, NW. BC. M. Sc. Thesis, UBC.
Henderson, J. R. Kirkham, R.V. Henderson, M.N., Payne, J. G., Wright, T.O., Wright
R.L., (1992). Stratigraphy and structure of the Sulphurets area, British Columbia; in Current Research, Par A, Geological Survey of Canada, Paper 92-1A, pp 323-332.
KCB 2008 KSM Site Investigation Report, April 14,2009.
SEABRIDGE GOLD INC. Kerr Sulphurets Mitchell Project 2009 Site Investigation Report
DRAWINGS (END OF TEXT)
D-1001 Project Area Site Plan
D-1011 Mine Area Drill Hole Locations
D-1102 TMF Site Investigation Plan
D-1127 TMF Area Regional Surficial Geology and Bedrock Structural Features
D-1128 TMF Impoundment Area Surficial Geology and Bedrock Structural Geology
D-1202 Mine Site Investigation Plan
D-1203 Mine Area Lithology, Structural Geology and Overburden Thickness
D-1226 Mitchell Process Plant Overburden Thickness Plan Map
D-1227 Geological Profiles of Water Storage Pond Dam Site
SEABRIDGE GOLD INC. Kerr Sulphurets Mitchell Project 2009 Site Investigation Report
APPENDIX I
2009 KCBL Geotechnical Borehole Logs and Core Photos
SEABRIDGE GOLD INC. Kerr Sulphurets Mitchell Project 2009 Site Investigation Report
APPENDIX II
Report on Seismic Refraction, MASW and Resistivity Sounding, Frontier Geosciences (2009)
SEABRIDGE GOLD INC. Kerr Sulphurets Mitchell Project 2009 Site Investigation Report
APPENDIX III
2009 KSM Glacier Investigation Report
SEABRIDGE GOLD INC. Kerr Sulphurets Mitchell Project 2009 Site Investigation Report
APPENDIX IV
Borehole Hydrogeology Testing Results
SEABRIDGE GOLD INC. Kerr Sulphurets Mitchell Project 2009 Site Investigation Report
APPENDIX V
2009/2010 KCBL Laboratory Testing Results

SEABRIDGE GOLD INC. Kerr Sulphurets Mitchell Project 2009 Site Investigation Report
Visual Classification

SEABRIDGE GOLD INC. Kerr Sulphurets Mitchell Project 2009 Site Investigation Report
Water Content

SEABRIDGE GOLD INC. Kerr Sulphurets Mitchell Project 2009 Site Investigation Report
Gradation

SEABRIDGE GOLD INC. Kerr Sulphurets Mitchell Project 2009 Site Investigation Report
Atterberg Limits

SEABRIDGE GOLD INC. Kerr Sulphurets Mitchell Project 2009 Site Investigation Report
Direct Shear

SEABRIDGE GOLD INC. Kerr Sulphurets Mitchell Project 2009 Site Investigation Report
Triaxial Test
SEABRIDGE GOLD INC. Kerr Sulphurets Mitchell Project 2009 Site Investigation Report
Constant Head Permeability

SEABRIDGE GOLD INC. Kerr Sulphurets Mitchell Project 2009 Site Investigation Report
Proctor
SEABRIDGE GOLD INC. Kerr Sulphurets Mitchell Project 2009 Site Investigation Report
Temp Cell

SEABRIDGE GOLD INC. Kerr Sulphurets Mitchell Project 2009 Site Investigation Report
ABA of Soil Sample

SEABRIDGE GOLD INC. Kerr Sulphurets Mitchell Project 2009 Site Investigation Report
Aggregates

SEABRIDGE GOLD INC. Kerr Sulphurets Mitchell Project 2009 Site Investigation Report
Rock HCI Reaction
SEABRIDGE GOLD INC. Kerr Sulphurets Mitchell Project 2009 Site Investigation Report
APPENDIX VI
Site Photos