Embed Size (px)
Citation preview
February 15, 2010 ASX & TSX: WSA
APPENDIX 4D - HALF YEAR ENDED 31 DECEMBER 2009
Reporting Period The reporting period is the half year ended 31 December 2009. The previous corresponding period is 31 December 2008. Results for announcement to the market
% Change Amount $’000
Revenue from ordinary activities Up 209% To 85,531
Profit/(loss) from ordinary activities after tax attributable to members of Western Areas NL
Up 186% To 10,675
Net profit/(loss) after tax attributable to members of Western Areas NL Up 186% To 10,675
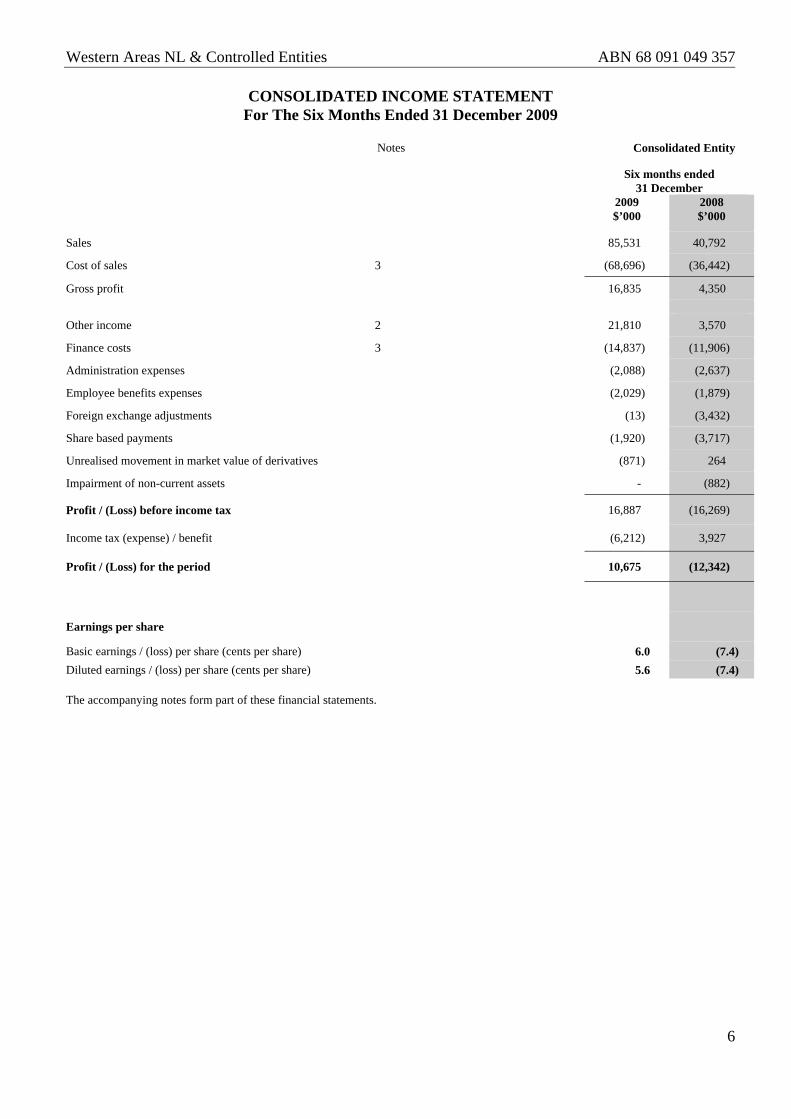
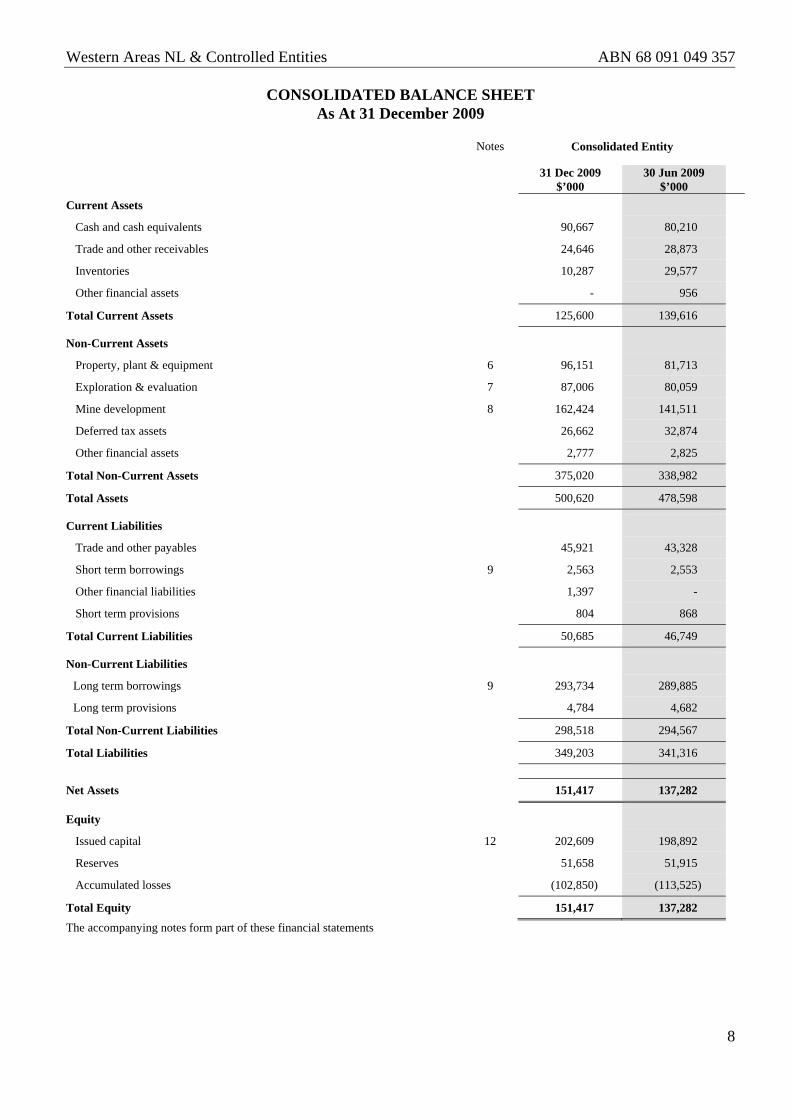
No dividend was paid or declared during the half year ended 31 December 2009. An announcement will follow with regards to dividends for the 31 December 2009 period. The Company had gross profit from operations of $16.8m (2008 $4.3m). The Group Net Profit after Tax was $10.7m (2008 negative $12.3m). Nickel Sales revenue was significantly higher at $85.5m due to the continuing ramp up of production from the Flying Fox mine and a more favorable average nickel price. Net Tangible Asset Backing The net tangible assets per security for the half year end 31 December 2009 was $0.63. (31 December 2008 $0.54) Investments in Controlled Entities During the period the Company did not lose control over any entities and gained control over one entity, Pacific Ore Australia Pty Ltd. Wholly Owned Subsidiaries of Western Areas NL:
Western Platinum NL Australian Nickel Investment Pty Ltd Pacific Ore Australia Pty Ltd
Investments in Associates & Joint Ventures Associates of Western Areas NL did not contribute to the result of the consolidated group for the half year ended 31 December 2009. Associates of Western Areas NL:
Mustang Minerals Inc. 18.15% (Canadian Entity) Polar Gold Pty Ltd 78% (Australian Entity)
Western Areas NL does not have an interest in any Joint Venture Entities. Audit Review & Accounting Standards This report is based on Consolidated Financial Statements that have been subject to a full Audit by the Companies Auditor. All entities incorporated into the Consolidated Group’s result were prepared under AIFRS Date: 15 February 2010 Craig Oliver
Finance Director & Company Secretary
ABN 68 091 049 357
AUDITED INTERIM FINANCIAL REPORT
FOR THE SIX MONTHS ENDED 31 DECEMBER 2009
2
TABLE OF CONTENTS Page CORPORATE DIRECTORY 3
DIRECTORS’ REPORT 4
CONSOLIDATED INCOME STATEMENT 6
CONSOLIDATED STATEMENT OF COMPREHENSIVE INCOME 7
CONSOLIDATED BALANCE SHEET 8
CONSOLIDATED STATEMENT OF CHANGES IN EQUITY 9
CONSOLIDATED CASH FLOW STATEMENT 10
NOTES TO AND FORMING PART OF THE FINANCIAL STATEMENTS 11
AUDITORS INDEPENDENCE DECLARATION 18
INDEPENDENT AUDITOR’S REPORT TO THE MEMBERS 19
DIRECTORS’ DECLARATION 20
MANAGEMENT DISCUSSION & ANALYSIS 21
3
CORPORATE DIRECTORY Directors Terry Streeter (Chairman) David Cooper Robin Dunbar Julian Hanna Craig Oliver Daniel Lougher Richard Yates Joint Company Secretaries Craig Oliver Joseph Belladonna Auditors WHK Horwath 256 St Georges Terrace Perth WA 6000 Bankers ANZ Banking Group Limited 77 St Georges Terrace Perth WA 6000 Share Registry Australia Computer Share Investor Services Pty Ltd Level 2, 45 St Georges Terrace Perth WA 6000 Canada Computer Share Investor Services INC 100 University Ave, Suite 800 Toronto Ontario M5J 2Y1 Stock Exchange Australian Stock Exchange Limited & Toronto Stock Exchange Group Code : WSA Solicitors Allion Legal Level 2, 50 Kings Park Road West Perth WA 6005
Registered Office Suite 3, Level 1 11 Ventnor Avenue West Perth WA 6005 Phone (08) 9334 7777 Fax (08) 9486 7866 Branch Office 65 Queen Street West Suite 1105 Toronto Ontario M5H 2M5 Treasury Advisers Oakvale Capital Ltd Level 3, 50 Colin Street West Perth WA 6005
Western Areas NL & Controlled Entities ABN 68 091 049 357
4
INTERIM FINANCIAL REPORT DIRECTORS’ REPORT The directors submit the financial report of the consolidated entity for the six months ended 31 December 2009. The consolidated financial statements are a general purpose financial report prepared in accordance with the Corporations Act 2001, AASB 134 “Interim Financial Reporting”, Australian Accounting Interpretations and other authoritative pronouncements of the Australian Accounting Standards Board. The report does not include full disclosures of the type normally included in an annual report. It is recommended that this financial report be read in conjunction with the 30 June 2009 annual financial report and any other public announcements made by Western Areas NL during the year in accordance with continuous disclosure requirements arising under the Corporations Act 2001. The financial report covers Western Areas NL and its controlled entities (the “Consolidated Entity”). Western Areas NL is a listed public company, incorporated and domiciled in Australia. The accounting policies adopted are consistent with those of the previous financial year. The effective date of this report is 15 February 2010. All amounts in this discussion are expressed in Australian dollars unless otherwise identified. Forward Looking Statements The following Directors report may contain forward-looking statements that involve numerous risks and uncertainties. Actual results of the Company could differ materially from those discussed in such forward-looking statements as a result of the risks and uncertainties inherent in the business. The Company disclaims any intention or obligation to update or revise the forward looking statements whether as a result of new information or change in business circumstance. Directors The names of the company’s directors in office during the six months ended and until the date of this report are as below. Unless noted, directors were in office for this entire period. Terence Streeter Non Executive Chairman David Cooper Non Executive Director Robin Dunbar Non Executive Director Richard J Yeates Non Executive Director (Appointed 1 October 2009) Julian Hanna Managing Director and Chief Executive Officer Craig Oliver Finance Director Dan Lougher Director of Operations Company Secretaries Craig Oliver, Joseph Belladonna Review of Operations Major mine development was completed at Flying Fox to enable Western Areas to meet the rapid production ramp up scheduled over the next six months. With the focus on development during December quarter, ore tonnes and grade were marginally lower than the September quarter which is reflected in increased cash costs. However numerous high grade ore sources are now accessible at the T1, T4 and T5 deposits which is expected to result in cash costs returning to the target $2.50/lb nickel by mid 2010. In addition, the Flying Fox mine decline has reached the top of the large T5 deposit where the first ore drive is already producing significant volumes of high grade ore. Production from Flying Fox is expected to increase from the target average 730t nickel per month in March quarter 2010 to 1,000t nickel per month in June quarter 2010 which will provide a platform for higher nickel production going forward. Nickel sales were also strong in the half year and the majority of the backlog of concentrate stockpiles has now been sold to BHP Billiton. At the Spotted Quoll mine, the Tim King pit is ahead of forecast with approximately 1.5 million bcm of waste removed since mining commenced in the December quarter. First high grade ore is expected to be intersected in the open pit in April with a scheduled average production rate of 400t nickel per month in June quarter 2010 increasing to 1,100 per month in September quarter 2010. There were very encouraging exploration results up to the date of this report not only at Forrestania but also from other joint venture projects in Western Australia and Finland.
Western Areas NL & Controlled Entities ABN 68 091 049 357
5
OPERATIONAL HIGHLIGHTS
1. 5,874 tonnes nickel in concentrate sold at average price of US$7.71/lb nickel. Cash production costs were US$3.06/lb nickel before smelting and refining costs with a rolling 12 month average cash production cost of US$2.54 in concentrate.
2. Production was in line with guidance at 125,049 tonnes processed at 3.4% Ni with 90% recovery. Contained nickel in stockpiles comprised approximately 770 tonnes nickel at the end of the half.
3. Mine development has now reached the Lewinsky Lode at the top of the T5 orebody which has a current Probable Ore Reserve of >1.0Mt @ 5.6% nickel.
4. Record drill hole intersection of 78.0m @ 9.3% nickel within the T5 ore body at Flying Fox demonstrates the exceptional continuity of the massive sulphide.
5. Mine development of the Tim King Pit at Spotted Quoll is ahead of schedule. The open pit contains 19,900 tonnes nickel at an average grade of 5.1% Ni.
6. The ore reserve and feasibility study for the proposed 10 year underground mine at Spotted Quoll is targeted for completion in mid 2010.
7. Drilling 400m below the current Spotted Quoll underground resource (2.0Mt @ 6.2% Ni for 125,500t Ni) intersected 3.5m @ 6.4% Ni confirming potential for significant extensions.
8. Stage Two upgrade at Cosmic Boy nickel concentrator is expected to improve metallurgical recoveries and double the capacity of the plant by June 2010.
9. Widely spaced RC drilling at the Sandstone joint venture 450km north of Forrestania intersected anomalous nickel sulphides over several intervals.
10. Initial drilling at the R1 target at Rautavaara in the Finland joint venture has intersected wide zones (up to 109m) of sulphide mineralisation.
11. High safety and environmental standards maintained on the Forrestania site. One LTI (Lost Time Injury) was reported at Forrestania during the half.
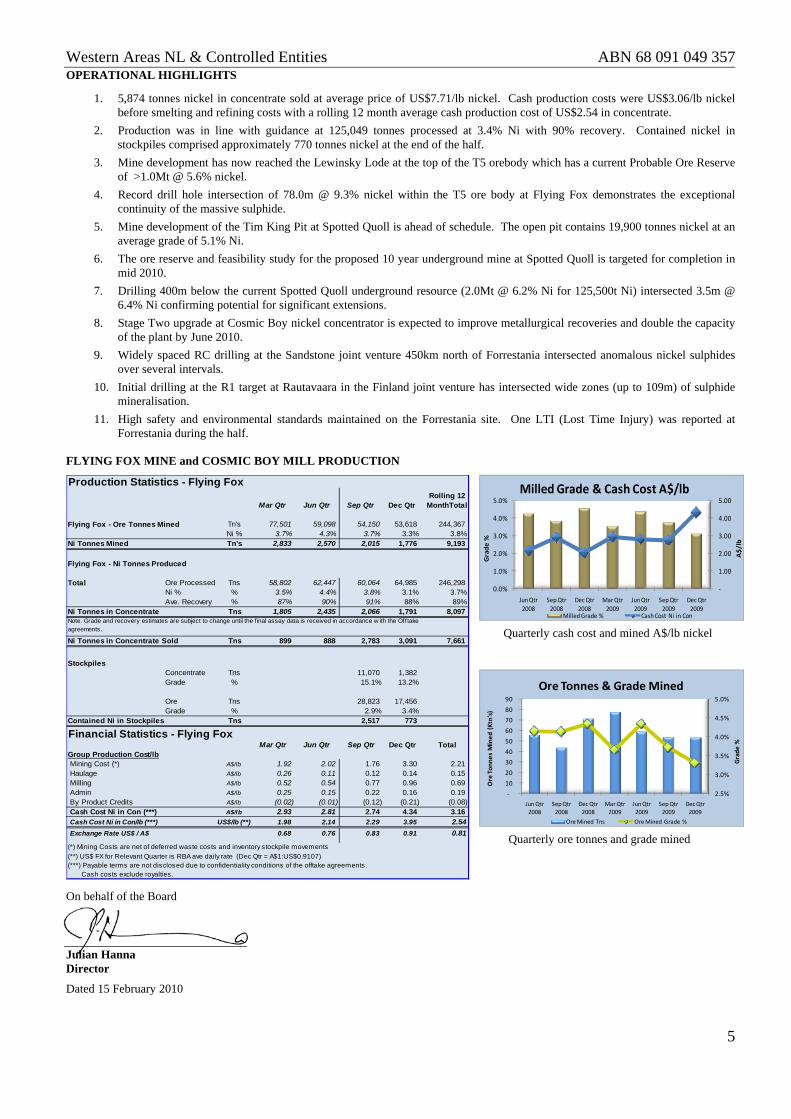
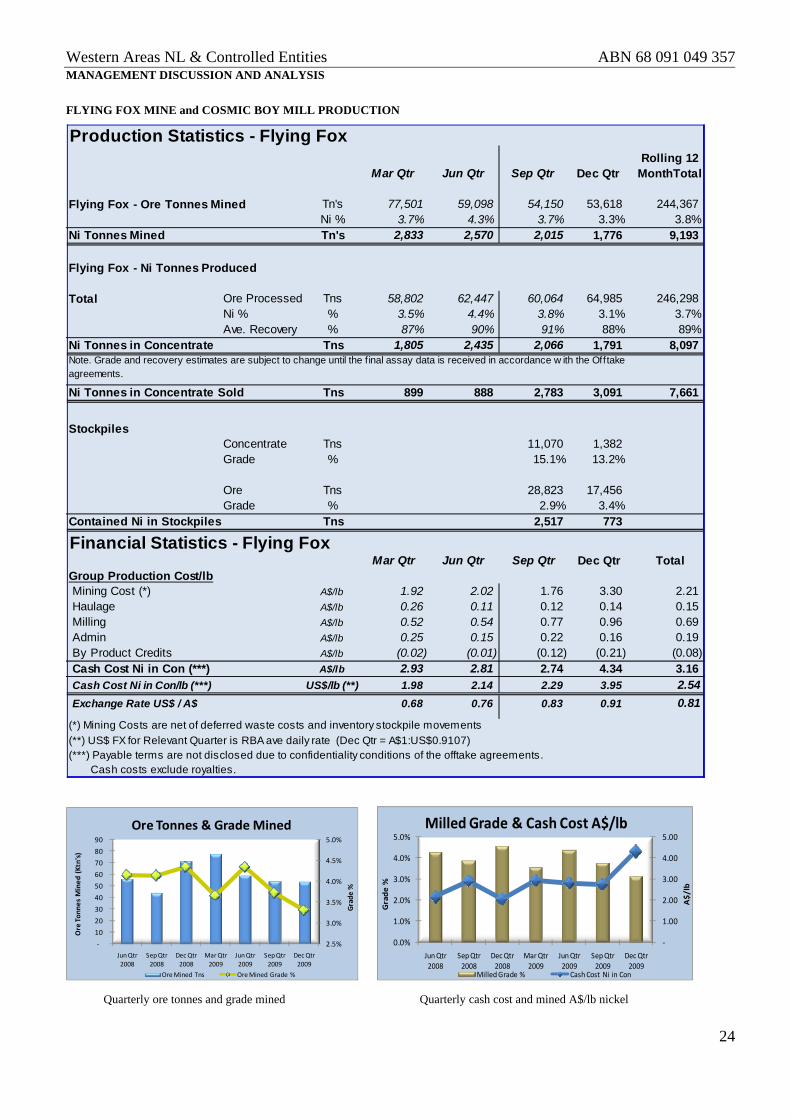
FLYING FOX MINE and COSMIC BOY MILL PRODUCTION
Production Statistics - Flying Fox
Mar Qtr Jun Qtr Sep Qtr Dec QtrRolling 12
MonthTotal
Flying Fox - Ore Tonnes Mined Tn's 77,501 59,098 54,150 53,618 244,367 Ni % 3.7% 4.3% 3.7% 3.3% 3.8%
Ni Tonnes Mined Tn's 2,833 2,570 2,015 1,776 9,193
Flying Fox - Ni Tonnes Produced
Total Ore Processed Tns 58,802 62,447 60,064 64,985 246,298 Ni % % 3.5% 4.4% 3.8% 3.1% 3.7%Ave. Recovery % 87% 90% 91% 88% 89%
Ni Tonnes in Concentrate Tns 1,805 2,435 2,066 1,791 8,097
Ni Tonnes in Concentrate Sold Tns 899 888 2,783 3,091 7,661
StockpilesConcentrate Tns 11,070 1,382 Grade % 15.1% 13.2%
Ore Tns 28,823 17,456 Grade % 2.9% 3.4%
Contained Ni in Stockpiles Tns 2,517 773
Financial Statistics - Flying FoxMar Qtr Jun Qtr Sep Qtr Dec Qtr Total
Group Production Cost/lbMining Cost (*) A$/lb 1.92 2.02 1.76 3.30 2.21 Haulage A$/lb 0.26 0.11 0.12 0.14 0.15 Milling A$/lb 0.52 0.54 0.77 0.96 0.69 Admin A$/lb 0.25 0.15 0.22 0.16 0.19 By Product Credits A$/lb (0.02) (0.01) (0.12) (0.21) (0.08) Cash Cost Ni in Con (***) A$/lb 2.93 2.81 2.74 4.34 3.16 Cash Cost Ni in Con/lb (***) US$/lb (**) 1.98 2.14 2.29 3.95 2.54Exchange Rate US$ / A$ 0.68 0.76 0.83 0.91 0.81
Note. Grade and recovery estimates are subject to change until the f inal assay data is received in accordance w ith the Offtake agreements.
(*) Mining Costs are net of deferred waste costs and inventory stockpile movements
(**) US$ FX for Relevant Quarter is RBA ave daily rate (Dec Qtr = A$1:US$0.9107)(***) Payable terms are not disclosed due to confidentiality conditions of the offtake agreements. Cash costs exclude royalties.
On behalf of the Board Julian Hanna Director
Dated 15 February 2010
Quarterly ore tonnes and grade mined
Quarterly cash cost and mined A$/lb nickel
2.5%
3.0%
3.5%
4.0%
4.5%
5.0%
‐
10
20
30
40
50
60
70
80
90
Jun Qtr 2008
Sep Qtr 2008
Dec Qtr 2008
Mar Qtr 2009
Jun Qtr 2009
Sep Qtr 2009
Dec Qtr 2009
Ore Ton
nes Mined
(Ktn's)
Grade
%
Ore Tonnes & Grade Mined
Ore Mined Tns Ore Mined Grade %
‐
1.00
2.00
3.00
4.00
5.00
0.0%
1.0%
2.0%
3.0%
4.0%
5.0%
Jun Qtr 2008
Sep Qtr 2008
Dec Qtr 2008
Mar Qtr 2009
Jun Qtr 2009
Sep Qtr 2009
Dec Qtr 2009
A$/lb
Grade %
Milled Grade & Cash Cost A$/lb
Milled Grade % Cash Cost Ni in Con
Western Areas NL & Controlled Entities ABN 68 091 049 357
6
CONSOLIDATED INCOME STATEMENT
For The Six Months Ended 31 December 2009 Notes Consolidated Entity
Three months ended 31 December
Six months ended 31 December
2008 $’000
2007 $’000
2009 $’000
2008 $’000
Sales 996 85,531 40,792
Cost of sales 3 (858) (68,696) (36,442)
Gross profit 138 16,835 4,350
Other income 2 597 21,810 3,570
Finance costs 3 (43) (14,837) (11,906)
Administration expenses (343) (2,088) (2,637)
Employee benefits expenses (919) (2,029) (1,879)
Foreign exchange adjustments (13) (3,432)
Share based payments (1,920) (3,717)
Unrealised movement in market value of derivatives (871) 264
Impairment of non-current assets - (882)
Profit / (Loss) before income tax 16,887 (16,269)
Income tax (expense) / benefit (12,089) (6,212) 3,927
Profit / (Loss) for the period 4,192 10,675 (12,342)
Earnings per share
Basic earnings / (loss) per share (cents per share) 6.0 (7.4) Diluted earnings / (loss) per share (cents per share) 5.6 (7.4) The accompanying notes form part of these financial statements.
Western Areas NL & Controlled Entities ABN 68 091 049 357
7
CONSOLIDATED STATEMENT OF COMPREHENSIVE INCOME For The Six Months Ended 31 December 2009
Notes Consolidated Entity
Three months ended 31 December
Six months ended 31 December
2008 $’000
2007 $’000
2009 $’000
2008 $’000
Profit / (Loss) for the period 996 10,675 (12,342)
Other comprehensive income (858)
Net loss on mark to market valuation of hedging instruments 138 (1,560) -
Net loss on revaluation of investments (617) (5,329)
Convertible note reserve - (440)
Total comprehensive income / (loss) for the period 4,192 8,498 (18,111)
Western Areas NL & Controlled Entities ABN 68 091 049 357
8
CONSOLIDATED BALANCE SHEET
As At 31 December 2009
Notes Consolidated Entity
31 Dec 2009 $’000
30 Jun 2009 $’000
Current Assets
Cash and cash equivalents 90,667 80,210
Trade and other receivables 24,646 28,873
Inventories 10,287 29,577
Other financial assets - 956
Total Current Assets 125,600 139,616
Non-Current Assets
Property, plant & equipment 6 96,151 81,713
Exploration & evaluation 7 87,006 80,059
Mine development 8 162,424 141,511
Deferred tax assets 26,662 32,874
Other financial assets 2,777 2,825
Total Non-Current Assets 375,020 338,982
Total Assets 500,620 478,598
Current Liabilities
Trade and other payables 45,921 43,328
Short term borrowings 9 2,563 2,553
Other financial liabilities 1,397 -
Short term provisions 804 868
Total Current Liabilities 50,685 46,749
Non-Current Liabilities
Long term borrowings 9 293,734 289,885
Long term provisions 4,784 4,682
Total Non-Current Liabilities 298,518 294,567
Total Liabilities 349,203 341,316
Net Assets 151,417 137,282
Equity
Issued capital 12 202,609 198,892
Reserves 51,658 51,915
Accumulated losses (102,850) (113,525)
Total Equity 151,417 137,282
The accompanying notes form part of these financial statements
Western Areas NL & Controlled Entities ABN 68 091 049 357
9
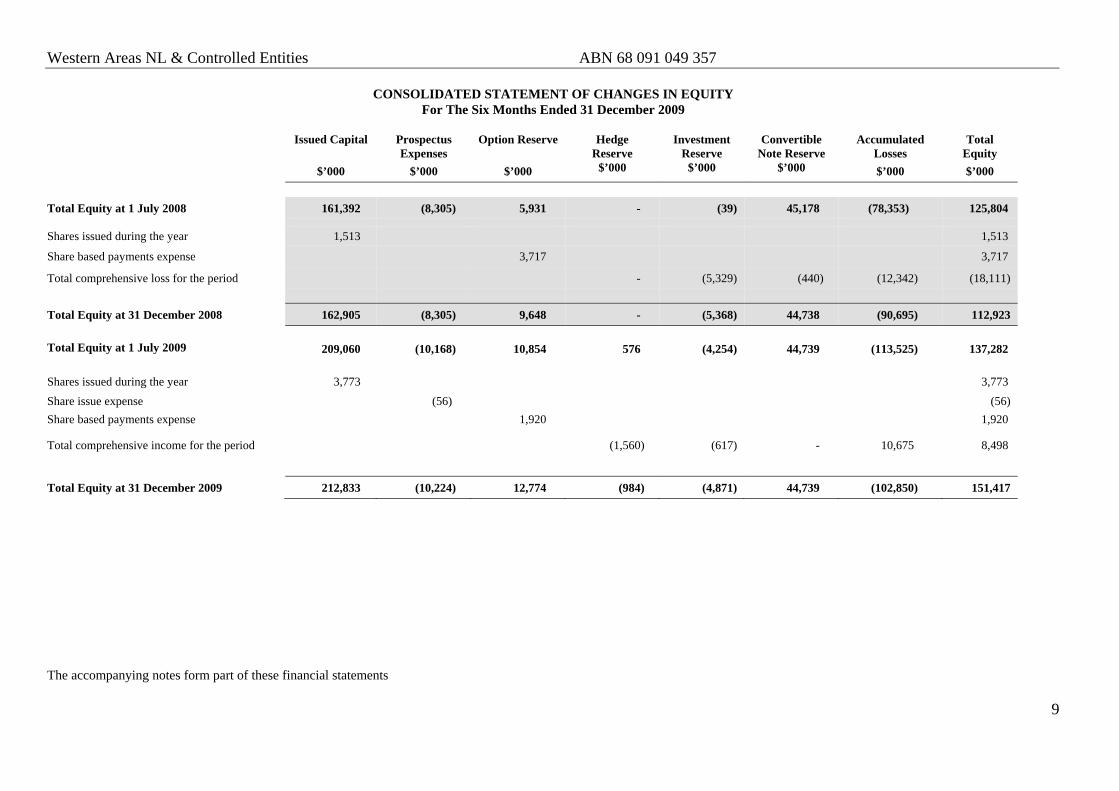
CONSOLIDATED STATEMENT OF CHANGES IN EQUITY
For The Six Months Ended 31 December 2009
The accompanying notes form part of these financial statements
Issued Capital Prospectus Expenses
Option Reserve Hedge Reserve
Investment Reserve
Convertible Note Reserve
Accumulated Losses
Total Equity
$’000 $’000 $’000 $’000 $’000 $’000 $’000 $’000
Total Equity at 1 July 2008 161,392 (8,305) 5,931 - (39) 45,178 (78,353) 125,804
Shares issued during the year 1,513 1,513
Share based payments expense 3,717 3,717
Total comprehensive loss for the period - (5,329) (440) (12,342) (18,111)
Total Equity at 31 December 2008 162,905 (8,305) 9,648 - (5,368) 44,738 (90,695) 112,923 Total Equity at 1 July 2009 209,060 (10,168) 10,854 576 (4,254) 44,739 (113,525) 137,282 Shares issued during the year 3,773 3,773
Share issue expense (56) (56)
Share based payments expense 1,920 1,920
Total comprehensive income for the period (1,560) (617) - 10,675 8,498
Total Equity at 31 December 2009 212,833 (10,224) 12,774 (984) (4,871) 44,739 (102,850) 151,417
Western Areas NL & Controlled Entities ABN 68 091 049 357
10
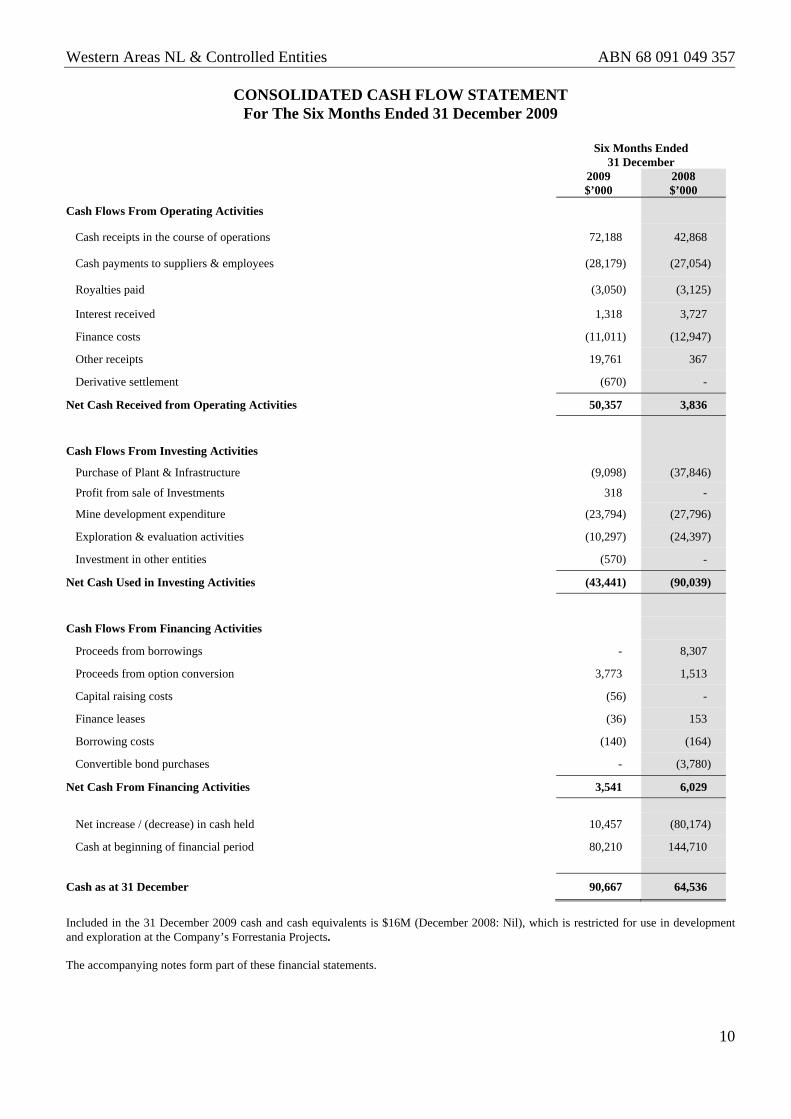
CONSOLIDATED CASH FLOW STATEMENT
For The Six Months Ended 31 December 2009
Three Months Ended 31 December
Six Months Ended 31 December
2008 $’000
2007 $’000
2009 $’000
2008 $’000
Cash Flows From Operating Activities
Cash receipts in the course of operations 5,787 203 72,188 42,868
Cash payments to suppliers & employees (7,616) (11,432) (28,179) (27,054)
Royalties paid (499) - (3,050) (3,125)
Interest received 4,255 351 1,318 3,727
Finance costs (10,322) (1,439) (11,011) (12,947)
Other receipts 260 - 19,761 367
Derivative settlement (15,961) - (670) -
Net Cash Received from Operating Activities (24,096) (12,317) 50,357 3,836
Cash Flows From Investing Activities
Purchase of Plant & Infrastructure (2,328) (6,724) (9,098) (37,846)
Profit from sale of Investments 318 -
Mine development expenditure (5,568) (12,448) (23,794) (27,796)
Exploration & evaluation activities (3,413) 383 (10,297) (24,397)
Investment in other entities - (3,209) (570) -
Net Cash Used in Investing Activities (11,309) (19,786) (43,441) (90,039)
Cash Flows From Financing Activities
Proceeds from borrowings - 59,312 - 8,307
Proceeds from option conversion 328 - 3,773 1,513
Capital raising costs - 69,331 (56) -
Finance leases (45) (24) (36) 153
Borrowing costs (158) (1,383) (140) (164)
Convertible bond purchases - (2,954) - (3,780)
Net Cash From Financing Activities 125 50,600 3,541 6,029
Net increase / (decrease) in cash held (35,280) 18,497 10,457 (80,174)
Cash at beginning of financial period 212,643 4,153 80,210 144,710
Cash as at 31 December 177,363 22,650 90,667 64,536
Included in the 31 December 2009 cash and cash equivalents is $16M (December 2008: Nil), which is restricted for use in development and exploration at the Company’s Forrestania Projects. The accompanying notes form part of these financial statements.
Western Areas NL & Controlled Entities ABN 68 091 049 357
11
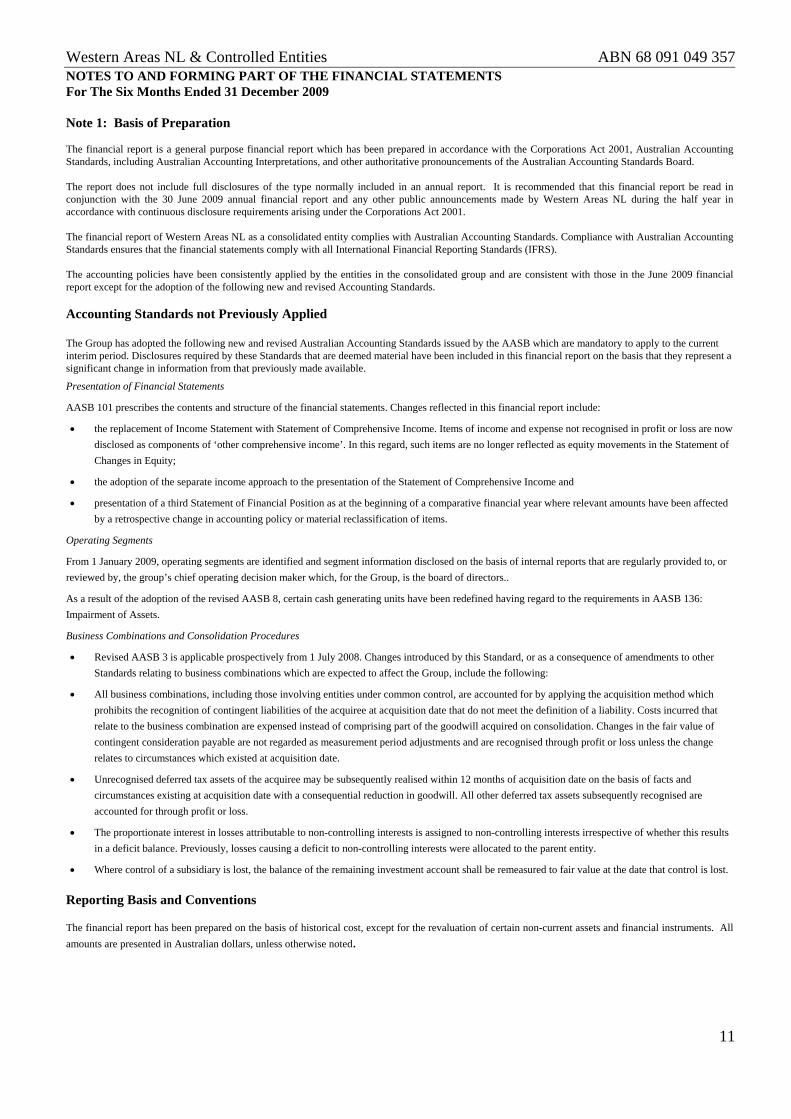
NOTES TO AND FORMING PART OF THE FINANCIAL STATEMENTS For The Six Months Ended 31 December 2009 Note 1: Basis of Preparation The financial report is a general purpose financial report which has been prepared in accordance with the Corporations Act 2001, Australian Accounting Standards, including Australian Accounting Interpretations, and other authoritative pronouncements of the Australian Accounting Standards Board. The report does not include full disclosures of the type normally included in an annual report. It is recommended that this financial report be read in conjunction with the 30 June 2009 annual financial report and any other public announcements made by Western Areas NL during the half year in accordance with continuous disclosure requirements arising under the Corporations Act 2001. The financial report of Western Areas NL as a consolidated entity complies with Australian Accounting Standards. Compliance with Australian Accounting Standards ensures that the financial statements comply with all International Financial Reporting Standards (IFRS). The accounting policies have been consistently applied by the entities in the consolidated group and are consistent with those in the June 2009 financial report except for the adoption of the following new and revised Accounting Standards.
Accounting Standards not Previously Applied The Group has adopted the following new and revised Australian Accounting Standards issued by the AASB which are mandatory to apply to the current interim period. Disclosures required by these Standards that are deemed material have been included in this financial report on the basis that they represent a significant change in information from that previously made available.
Presentation of Financial Statements
AASB 101 prescribes the contents and structure of the financial statements. Changes reflected in this financial report include:
• the replacement of Income Statement with Statement of Comprehensive Income. Items of income and expense not recognised in profit or loss are now
disclosed as components of ‘other comprehensive income’. In this regard, such items are no longer reflected as equity movements in the Statement of
Changes in Equity;
• the adoption of the separate income approach to the presentation of the Statement of Comprehensive Income and
• presentation of a third Statement of Financial Position as at the beginning of a comparative financial year where relevant amounts have been affected
by a retrospective change in accounting policy or material reclassification of items.
Operating Segments
From 1 January 2009, operating segments are identified and segment information disclosed on the basis of internal reports that are regularly provided to, or
reviewed by, the group’s chief operating decision maker which, for the Group, is the board of directors..
As a result of the adoption of the revised AASB 8, certain cash generating units have been redefined having regard to the requirements in AASB 136:
Impairment of Assets.
Business Combinations and Consolidation Procedures
• Revised AASB 3 is applicable prospectively from 1 July 2008. Changes introduced by this Standard, or as a consequence of amendments to other
Standards relating to business combinations which are expected to affect the Group, include the following:
• All business combinations, including those involving entities under common control, are accounted for by applying the acquisition method which
prohibits the recognition of contingent liabilities of the acquiree at acquisition date that do not meet the definition of a liability. Costs incurred that
relate to the business combination are expensed instead of comprising part of the goodwill acquired on consolidation. Changes in the fair value of
contingent consideration payable are not regarded as measurement period adjustments and are recognised through profit or loss unless the change
relates to circumstances which existed at acquisition date.
• Unrecognised deferred tax assets of the acquiree may be subsequently realised within 12 months of acquisition date on the basis of facts and
circumstances existing at acquisition date with a consequential reduction in goodwill. All other deferred tax assets subsequently recognised are
accounted for through profit or loss.
• The proportionate interest in losses attributable to non-controlling interests is assigned to non-controlling interests irrespective of whether this results
in a deficit balance. Previously, losses causing a deficit to non-controlling interests were allocated to the parent entity.
• Where control of a subsidiary is lost, the balance of the remaining investment account shall be remeasured to fair value at the date that control is lost.
Reporting Basis and Conventions The financial report has been prepared on the basis of historical cost, except for the revaluation of certain non-current assets and financial instruments. All
amounts are presented in Australian dollars, unless otherwise noted.
Western Areas NL & Controlled Entities ABN 68 091 049 357
12
Consolidated Entity
31 Dec 2009
$’000 31 Dec 2008
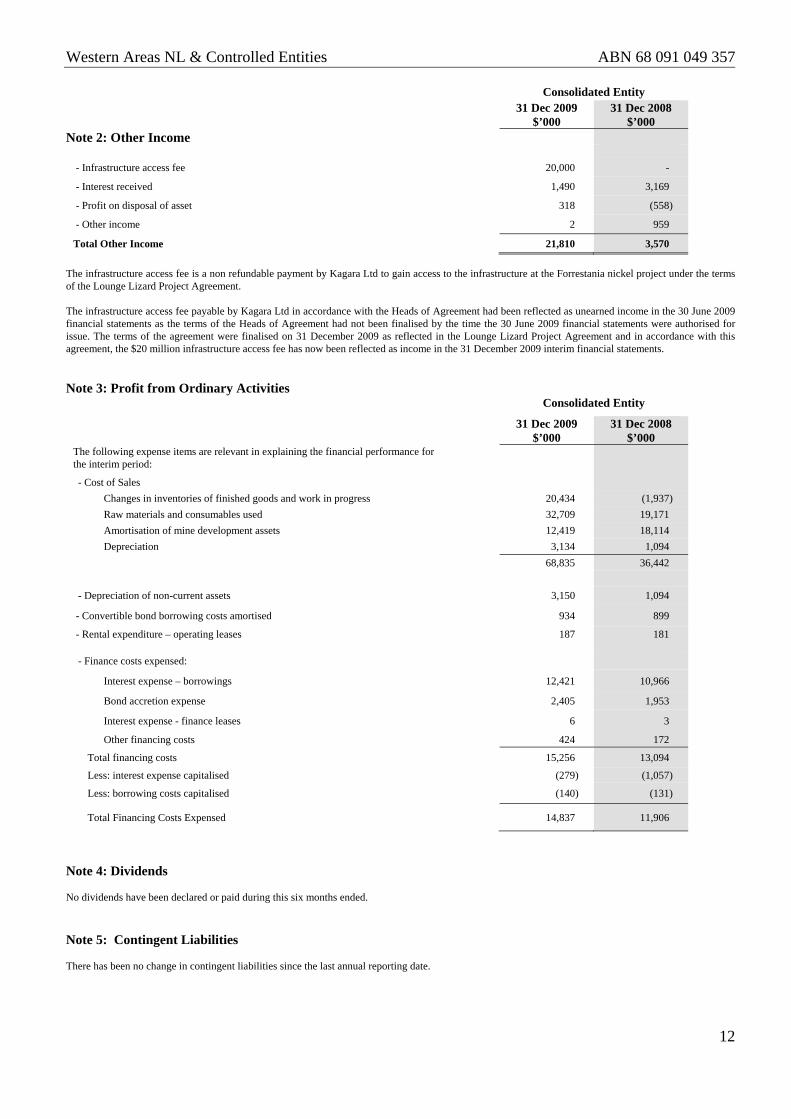
$’000 Note 2: Other Income
- Infrastructure access fee 20,000 -
- Interest received 1,490 3,169
- Profit on disposal of asset 318 (558)
- Other income 2 959
Total Other Income 21,810 3,570 The infrastructure access fee is a non refundable payment by Kagara Ltd to gain access to the infrastructure at the Forrestania nickel project under the terms of the Lounge Lizard Project Agreement. The infrastructure access fee payable by Kagara Ltd in accordance with the Heads of Agreement had been reflected as unearned income in the 30 June 2009 financial statements as the terms of the Heads of Agreement had not been finalised by the time the 30 June 2009 financial statements were authorised for issue. The terms of the agreement were finalised on 31 December 2009 as reflected in the Lounge Lizard Project Agreement and in accordance with this agreement, the $20 million infrastructure access fee has now been reflected as income in the 31 December 2009 interim financial statements. Note 3: Profit from Ordinary Activities Consolidated Entity
31 Dec 2009 $’000
31 Dec 2008 $’000
The following expense items are relevant in explaining the financial performance for the interim period:
- Cost of Sales
Changes in inventories of finished goods and work in progress 20,434 (1,937)
Raw materials and consumables used 32,709 19,171
Amortisation of mine development assets 12,419 18,114
Depreciation 3,134 1,094
68,835 36,442
- Depreciation of non-current assets 3,150 1,094
- Convertible bond borrowing costs amortised 934 899
- Rental expenditure – operating leases 187 181 - Finance costs expensed:
Interest expense – borrowings 12,421 10,966
Bond accretion expense 2,405 1,953
Interest expense - finance leases 6 3
Other financing costs 424 172
Total financing costs 15,256 13,094
Less: interest expense capitalised (279) (1,057)
Less: borrowing costs capitalised (140) (131)
Total Financing Costs Expensed 14,837 11,906
Note 4: Dividends No dividends have been declared or paid during this six months ended.
Note 5: Contingent Liabilities There has been no change in contingent liabilities since the last annual reporting date.
Western Areas NL & Controlled Entities ABN 68 091 049 357
13
NOTES TO AND FORMING PART OF THE FINANCIAL STATEMENTS For The Six Months Ended 31 December 2009 Consolidated Entity
31 Dec 2009
$’000 30 Jun 2009
$’000
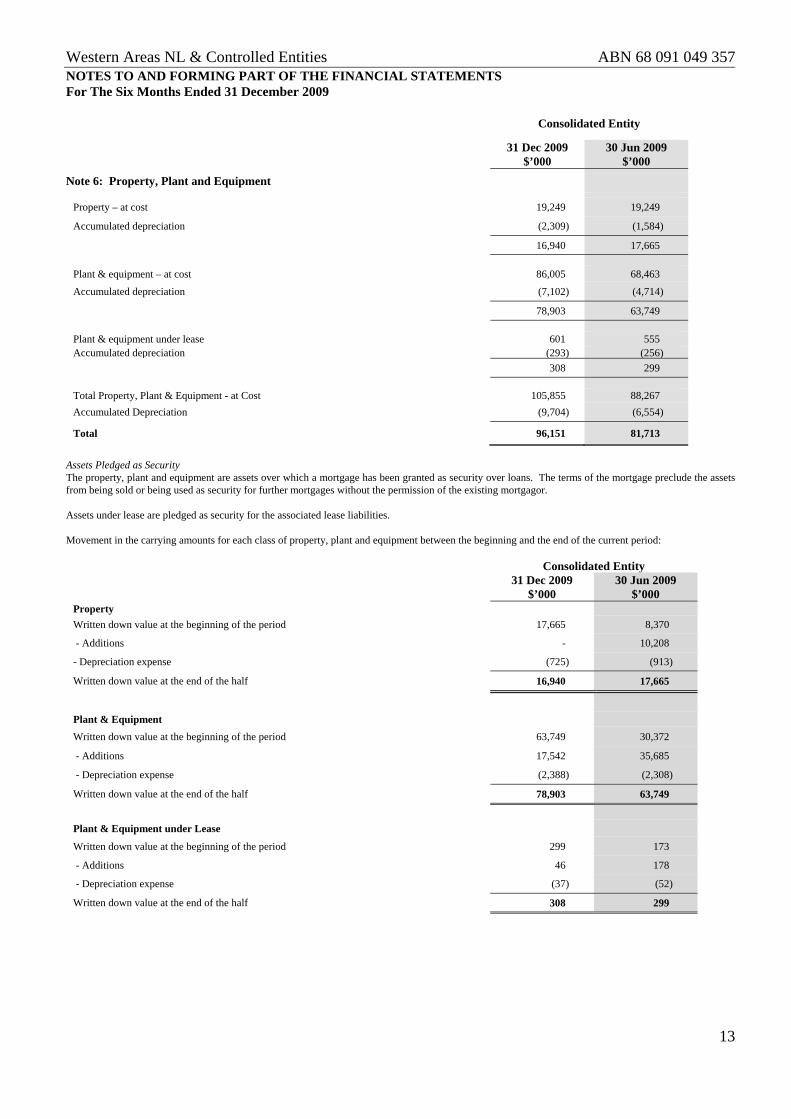
Note 6: Property, Plant and Equipment
Property – at cost 19,249 19,249
Accumulated depreciation (2,309) (1,584)
16,940 17,665
Plant & equipment – at cost 86,005 68,463
Accumulated depreciation (7,102) (4,714)
78,903 63,749
Plant & equipment under lease 601 555 Accumulated depreciation (293) (256)
308 299
Total Property, Plant & Equipment - at Cost 105,855 88,267
Accumulated Depreciation (9,704) (6,554)
Total 96,151 81,713
Assets Pledged as Security The property, plant and equipment are assets over which a mortgage has been granted as security over loans. The terms of the mortgage preclude the assets from being sold or being used as security for further mortgages without the permission of the existing mortgagor. Assets under lease are pledged as security for the associated lease liabilities. Movement in the carrying amounts for each class of property, plant and equipment between the beginning and the end of the current period:
Consolidated Entity 31 Dec 2009
$’000 30 Jun 2009
$’000 Property
Written down value at the beginning of the period 17,665 8,370
- Additions - 10,208
- Depreciation expense (725) (913)
Written down value at the end of the half 16,940 17,665
Plant & Equipment
Written down value at the beginning of the period 63,749 30,372
- Additions 17,542 35,685
- Depreciation expense (2,388) (2,308)
Written down value at the end of the half 78,903 63,749
Plant & Equipment under Lease
Written down value at the beginning of the period 299 173
- Additions 46 178
- Depreciation expense (37) (52)
Written down value at the end of the half 308 299
Western Areas NL & Controlled Entities ABN 68 091 049 357
14
NOTES TO AND FORMING PART OF THE FINANCIAL STATEMENTS For The Six Months Ended 31 December 2009
Consolidated Entity 31 Dec 2009
$’000 30 Jun 2009
$’000
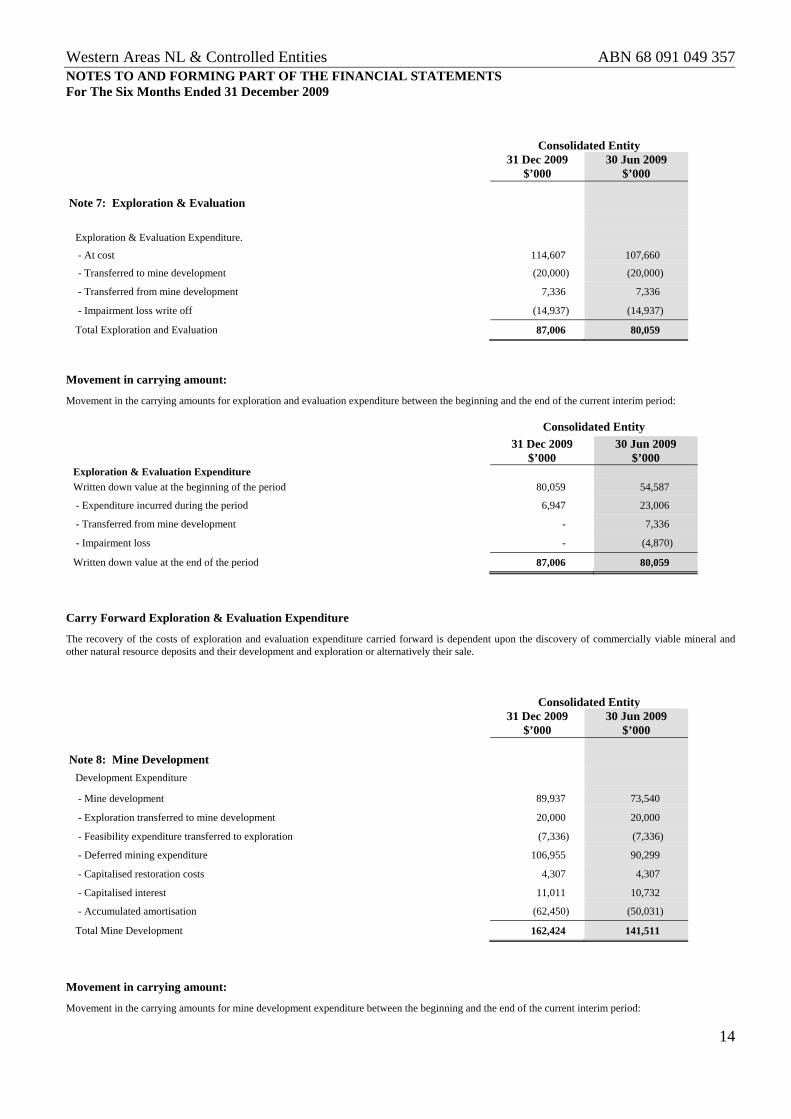
Note 7: Exploration & Evaluation
Exploration & Evaluation Expenditure.
- At cost 114,607 107,660
- Transferred to mine development (20,000) (20,000)
- Transferred from mine development 7,336 7,336
- Impairment loss write off (14,937) (14,937)
Total Exploration and Evaluation 87,006 80,059
Movement in carrying amount:
Movement in the carrying amounts for exploration and evaluation expenditure between the beginning and the end of the current interim period:
Consolidated Entity
31 Dec 2009 $’000
30 Jun 2009 $’000
Exploration & Evaluation Expenditure
Written down value at the beginning of the period 80,059 54,587
- Expenditure incurred during the period 6,947 23,006
- Transferred from mine development - 7,336
- Impairment loss - (4,870)
Written down value at the end of the period 87,006 80,059
Carry Forward Exploration & Evaluation Expenditure
The recovery of the costs of exploration and evaluation expenditure carried forward is dependent upon the discovery of commercially viable mineral and other natural resource deposits and their development and exploration or alternatively their sale.
Consolidated Entity 31 Dec 2009
$’000 30 Jun 2009
$’000
Note 8: Mine Development
Development Expenditure
- Mine development 89,937 73,540
- Exploration transferred to mine development 20,000 20,000
- Feasibility expenditure transferred to exploration (7,336) (7,336)
- Deferred mining expenditure 106,955 90,299
- Capitalised restoration costs 4,307 4,307
- Capitalised interest 11,011 10,732
- Accumulated amortisation (62,450) (50,031)
Total Mine Development 162,424 141,511
Movement in carrying amount:
Movement in the carrying amounts for mine development expenditure between the beginning and the end of the current interim period:
Western Areas NL & Controlled Entities ABN 68 091 049 357
15
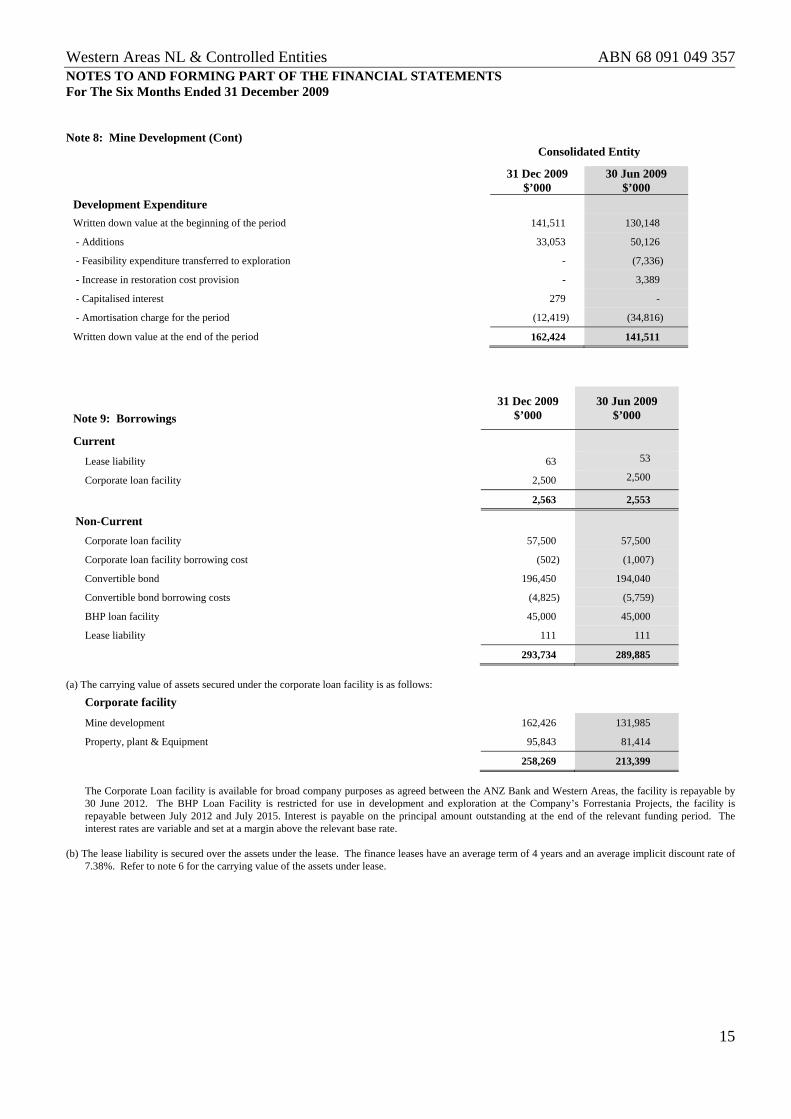
NOTES TO AND FORMING PART OF THE FINANCIAL STATEMENTS For The Six Months Ended 31 December 2009 Note 8: Mine Development (Cont) Consolidated Entity 31 Dec 2009
$’000 30 Jun 2009
$’000
Development Expenditure
Written down value at the beginning of the period 141,511 130,148
- Additions 33,053 50,126
- Feasibility expenditure transferred to exploration - (7,336)
- Increase in restoration cost provision - 3,389
- Capitalised interest 279 -
- Amortisation charge for the period (12,419) (34,816)
Written down value at the end of the period 162,424 141,511
31 Dec 2009 $’000
30 Jun 2009 $’000 Note 9: Borrowings
Current
Lease liability 63 53
Corporate loan facility 2,500 2,500
2,563 2,553
Non-Current Corporate loan facility 57,500 57,500
Corporate loan facility borrowing cost (502) (1,007)
Convertible bond 196,450 194,040
Convertible bond borrowing costs (4,825) (5,759)
BHP loan facility 45,000 45,000
Lease liability 111 111
293,734 289,885 (a) The carrying value of assets secured under the corporate loan facility is as follows:
Corporate facility
Mine development 162,426 131,985
Property, plant & Equipment 95,843 81,414
258,269 213,399 The Corporate Loan facility is available for broad company purposes as agreed between the ANZ Bank and Western Areas, the facility is repayable by 30 June 2012. The BHP Loan Facility is restricted for use in development and exploration at the Company’s Forrestania Projects, the facility is repayable between July 2012 and July 2015. Interest is payable on the principal amount outstanding at the end of the relevant funding period. The interest rates are variable and set at a margin above the relevant base rate.
(b) The lease liability is secured over the assets under the lease. The finance leases have an average term of 4 years and an average implicit discount rate of
7.38%. Refer to note 6 for the carrying value of the assets under lease.
Western Areas NL & Controlled Entities ABN 68 091 049 357
16
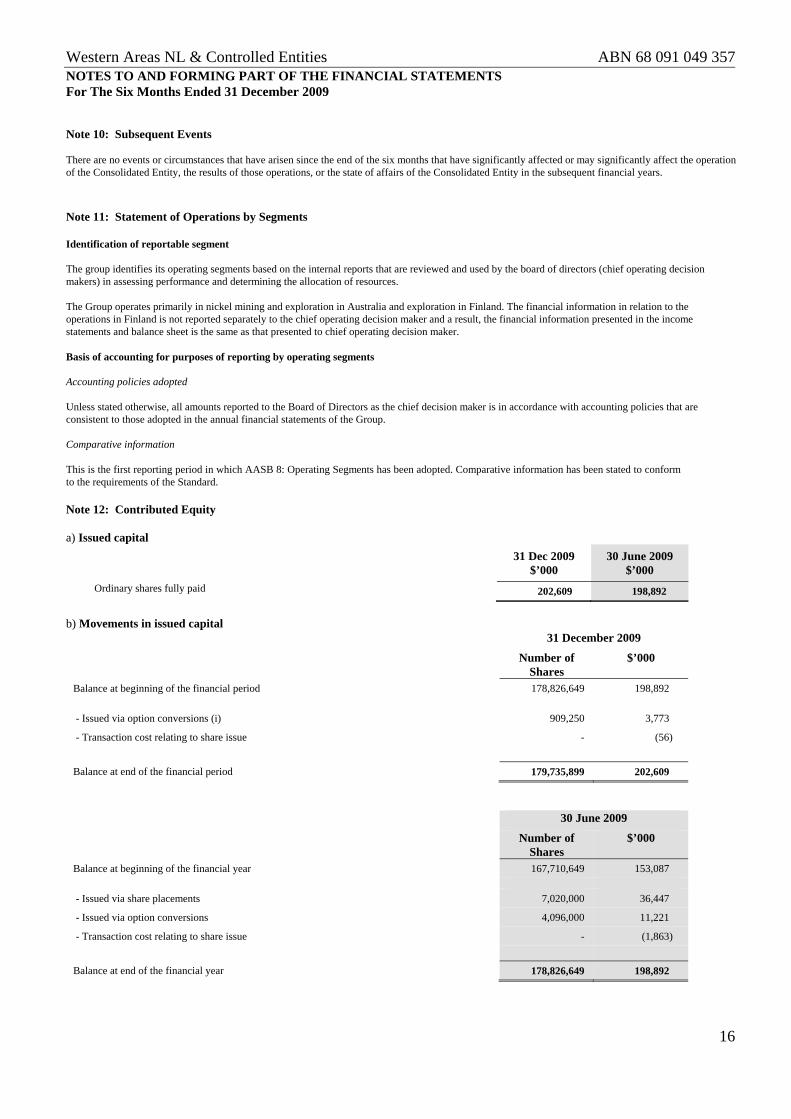
NOTES TO AND FORMING PART OF THE FINANCIAL STATEMENTS For The Six Months Ended 31 December 2009 Note 10: Subsequent Events There are no events or circumstances that have arisen since the end of the six months that have significantly affected or may significantly affect the operation of the Consolidated Entity, the results of those operations, or the state of affairs of the Consolidated Entity in the subsequent financial years.
Note 11: Statement of Operations by Segments Identification of reportable segment The group identifies its operating segments based on the internal reports that are reviewed and used by the board of directors (chief operating decision makers) in assessing performance and determining the allocation of resources. The Group operates primarily in nickel mining and exploration in Australia and exploration in Finland. The financial information in relation to the operations in Finland is not reported separately to the chief operating decision maker and a result, the financial information presented in the income statements and balance sheet is the same as that presented to chief operating decision maker. Basis of accounting for purposes of reporting by operating segments Accounting policies adopted Unless stated otherwise, all amounts reported to the Board of Directors as the chief decision maker is in accordance with accounting policies that are consistent to those adopted in the annual financial statements of the Group. Comparative information This is the first reporting period in which AASB 8: Operating Segments has been adopted. Comparative information has been stated to conform to the requirements of the Standard. Note 12: Contributed Equity a) Issued capital
31 Dec 2009 $’000
30 June 2009 $’000
Ordinary shares fully paid 202,609 198,892
b) Movements in issued capital
31 December 2009
Number of Shares
$’000
Balance at beginning of the financial period 178,826,649 198,892
- Issued via option conversions (i) 909,250 3,773
- Transaction cost relating to share issue - (56)
Balance at end of the financial period 179,735,899 202,609
30 June 2009
Number of Shares
$’000
Balance at beginning of the financial year 167,710,649 153,087
- Issued via share placements 7,020,000 36,447
- Issued via option conversions 4,096,000 11,221
- Transaction cost relating to share issue - (1,863)
Balance at end of the financial year 178,826,649 198,892
Western Areas NL & Controlled Entities ABN 68 091 049 357
17
NOTES TO AND FORMING PART OF THE FINANCIAL STATEMENTS
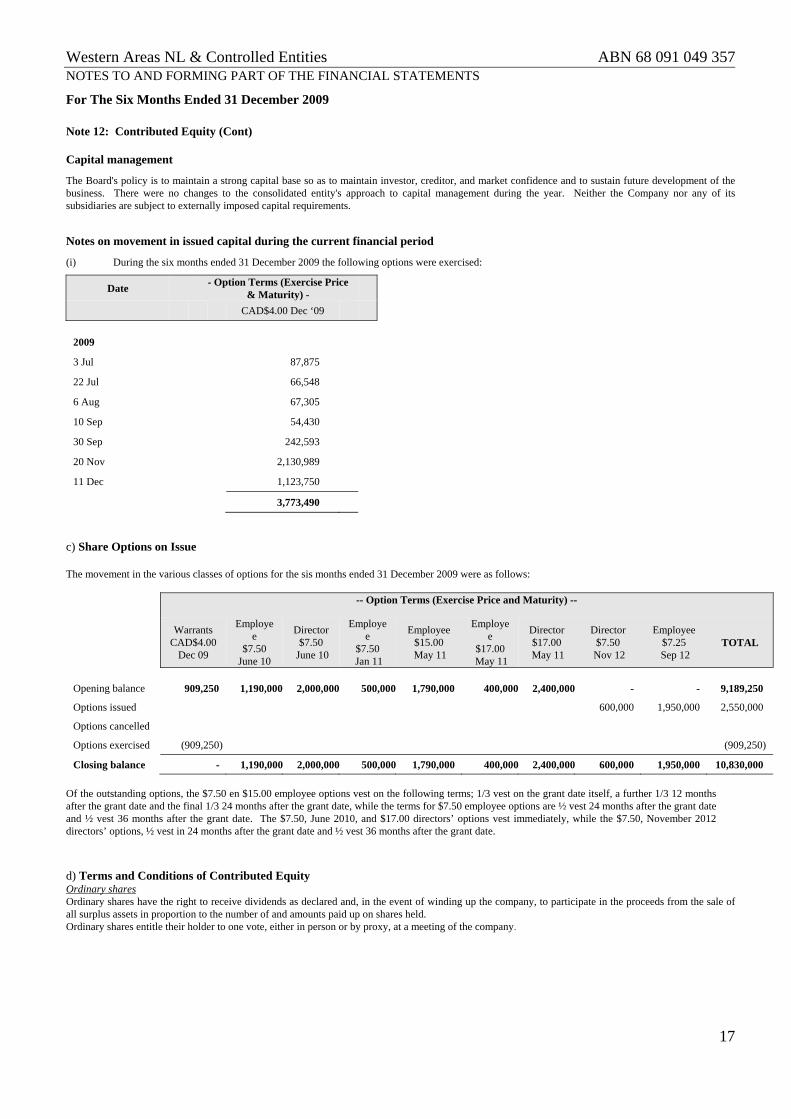
For The Six Months Ended 31 December 2009 Note 12: Contributed Equity (Cont) Capital management
The Board's policy is to maintain a strong capital base so as to maintain investor, creditor, and market confidence and to sustain future development of the business. There were no changes to the consolidated entity's approach to capital management during the year. Neither the Company nor any of its subsidiaries are subject to externally imposed capital requirements.
Notes on movement in issued capital during the current financial period
(i) During the six months ended 31 December 2009 the following options were exercised:
Date - Option Terms (Exercise Price & Maturity) -
CAD$4.00 Dec ‘09
2009
3 Jul 87,875
22 Jul 66,548
6 Aug 67,305
10 Sep 54,430
30 Sep 242,593
20 Nov 2,130,989
11 Dec 1,123,750
3,773,490 c) Share Options on Issue The movement in the various classes of options for the sis months ended 31 December 2009 were as follows:
-- Option Terms (Exercise Price and Maturity) --
Warrants
CAD$4.00 Dec 09
Employee
$7.50 June 10
Director $7.50
June 10
Employee
$7.50 Jan 11
Employee $15.00
May 11
Employee
$17.00 May 11
Director $17.00
May 11
Director $7.50
Nov 12
Employee $7.25
Sep 12 TOTAL
Opening balance 909,250 1,190,000 2,000,000 500,000 1,790,000 400,000 2,400,000 - - 9,189,250
Options issued 600,000 1,950,000 2,550,000
Options cancelled
Options exercised (909,250) (909,250)
Closing balance - 1,190,000 2,000,000 500,000 1,790,000 400,000 2,400,000 600,000 1,950,000 10,830,000 Of the outstanding options, the $7.50 en $15.00 employee options vest on the following terms; 1/3 vest on the grant date itself, a further 1/3 12 months after the grant date and the final 1/3 24 months after the grant date, while the terms for $7.50 employee options are ½ vest 24 months after the grant date and ½ vest 36 months after the grant date. The $7.50, June 2010, and $17.00 directors’ options vest immediately, while the $7.50, November 2012 directors’ options, ½ vest in 24 months after the grant date and ½ vest 36 months after the grant date.
d) Terms and Conditions of Contributed Equity Ordinary shares Ordinary shares have the right to receive dividends as declared and, in the event of winding up the company, to participate in the proceeds from the sale of all surplus assets in proportion to the number of and amounts paid up on shares held. Ordinary shares entitle their holder to one vote, either in person or by proxy, at a meeting of the company.
Western Areas NL & Controlled Entities ABN 68 091 049 357
18
AUDITORS INDEPENDENCE DECLARATION
Western Areas NL & Controlled Entities ABN 68 091 049 357
19
INDEPENDENT AUDITOR’S REPORT TO THE MEMBERS
Western Areas NL & Controlled Entities ABN 68 091 049 357
20
DIRECTORS’ DECLARATION The directors of the company declare that:
1) The financial statements and notes, as set out on pages 6 to 17:
(i) give a true and fair view of the economic entity’s financial position as at 31 December 2009 and of its performance for the half year ended on that date; and
(ii) comply with Accounting Standard AASB 134 “Interim Financial Reporting” and Corporations Regulations 2001;
2) In the directors’ opinion there are reasonable grounds to believe that the company will be able to pay its debts as and when they become due and payable.
This declaration is made in accordance with a resolution of the Board of Directors. On behalf of the Board Julian Hanna Director Dated 15 February 2010
Western Areas NL & Controlled Entities ABN 68 091 049 357
21
ABN 68 091 049 357
MANAGEMENT DISCUSSION & ANALYSIS
31 DECEMBER 2009
Western Areas NL & Controlled Entities ABN 68 091 049 357
22
MANAGEMENT DISCUSSION AND ANALYSIS The following Management Discussion and Analysis of the Financial Condition and Results of Operations (“MD&A”) should be read in conjunction with the historical consolidated financial statements and press releases of WSA. The consolidated financial statements are a general purpose financial report prepared in accordance with the Corporations Act 2001, AASB 134 “Interim Financial Reporting”, Australian Accounting Interpretations and other authoritative pronouncements of the Australian Accounting Standards Board. The report does not include full disclosures of the type normally included in an annual report. It is recommended that this financial report be read in conjunction with the 30 June 2009 annual financial report and any other public announcements made by Western Areas NL during the year in accordance with continuous disclosure requirements arising under the Corporations Act 2001. The financial report covers Western Areas NL and its controlled entities (the “Consolidated Entity”). Western Areas NL is a listed public company, incorporated and domiciled in Australia. The accounting policies adopted are consistent with those of the previous financial year. In addition to these Australian requirements further information has been included in the interim consolidated financial statements for the six months ended 31 December 2009 in order to comply with applicable Canadian security law, as the company is listed on the Toronto Stock Exchange. The effective date of this report is 15 February 2010. All amounts in this discussion are expressed in Australian dollars unless otherwise identified. Forward Looking Statements The following MD&A discussion may contain forward-looking statements that involve numerous risks and uncertainties. Actual results of the Company could differ materially from those discussed in such forward-looking statements as a result of the risks and uncertainties inherent in the business. The Company disclaims any intention or obligation to update or revise the forward looking statements whether as a result of new information or change in business circumstance. Background Western Areas is an Australian-based nickel sulphide explorer and producer listed on the ASX and TSX. The main asset is the 100% owned Forrestania Nickel Project, 400km east of Perth. Western Areas is targeting combined annual production from the Flying Fox and Spotted Quoll mines of 25,000t nickel by 2011. Western Areas is a very active nickel explorer with advanced projects in Western Australia, Canada and Finland. Mining is in progress at the Flying Fox T1 and T4 ore bodies where mine production for the 12 months to 30 June 2009 exceeded the target of 10,000 tpa nickel. Production is scheduled to ramp up to 14,000 tpa nickel in 2011. Development of a second nickel mine at Spotted Quoll 6km south of Flying Fox has commenced. Total Mineral Resources comprise 2.0Mt at an average grade of 6.2% nickel containing approx. 125,460t nickel. First production is targeted in April 2010. Deeper drilling has intersected high grade nickel up to 400m below the mineral resource at Spotted Quoll. Flying Fox and Spotted Quoll are expected to be two of the lowest cost nickel mines in the world. In addition, preliminary surface development work has been completed on the planned Cosmic Boy and Diggers South mines. The Cosmic Boy nickel concentrator in the centre of the Forrestania project was officially opened on 24 March 2009 by the Western Australian Minister for Mines and Petroleum. The Stage One plant is fully operational and a Stage Two expansion to double the capacity of the plant to 550,000 tonnes per annum ore by end June quarter 2010 is in progress.
Western Areas NL & Controlled Entities ABN 68 091 049 357
23
MANAGEMENT DISCUSSION AND ANALYSIS REVIEW OF OPERATIONS
Major mine development was completed at Flying Fox to enable Western Areas to meet the rapid production ramp up scheduled over the next six months. With the focus on development during the December quarter, ore tonnes and grade were marginally lower than the September quarter which is reflected in increased cash costs. However numerous high grade ore sources are now accessible at the T1, T4 and T5 deposits which is expected to result in cash costs returning to the target $2.50/lb nickel by mid 2010. In addition, the Flying Fox mine decline has reached the top of the large T5 deposit where the first ore drive is already producing significant volumes of high grade ore. Production from Flying Fox is expected to increase from the target average 730t nickel per month in March quarter 2010 to 1,000t nickel per month in June quarter 2010 which will provide a platform for higher nickel production going forward. Nickel sales were also strong in the half year and the majority of the backlog of concentrate stockpiles has now been sold to BHP Billiton. At the Spotted Quoll mine, the Tim King pit is ahead of forecast with approximately 1.5 million bcm of waste removed since mining commenced in the December quarter. First high grade ore is expected to be intersected in the open pit in April with a scheduled average production rate of 400t nickel per month in June quarter 2010 increasing to 1,100 per month in September quarter 2010. There were very encouraging exploration results up to the date of this report not only at Forrestania but also from other joint venture projects in Western Australia and Finland. Highlights
1. 5,874 tonnes nickel in concentrate sold at average price of US$7.71/lb nickel. Cash production costs were US$3.06/lb nickel before smelting and refining costs with a rolling 12 month average cash production cost of US$2.54 in conc.
2. Production was in line with guidance at 125,049 tonnes processed at 3.4% Ni with 90% recovery. Contained nickel in stockpiles comprised approximately 770 tonnes nickel at the end of the half.
3. Mine development has now reached the Lewinsky Lode at the top of the T5 orebody which has a current Probable Ore Reserve of >1.0Mt @ 5.6% nickel.
4. Record drill hole intersection of 78.0m @ 9.3% nickel within the T5 ore body at Flying Fox demonstrates the exceptional continuity of the massive sulphide.
5. Mine development of the Tim King Pit at Spotted Quoll is ahead of schedule. The open pit contains 19,900 tonnes nickel at an average grade of 5.1% Ni.
6. The ore reserve and feasibility study for the proposed 10 year underground mine at Spotted Quoll is targeted for completion in mid 2010.
7. Drilling 400m below the current Spotted Quoll underground resource (2.0Mt @ 6.2% Ni for 125,500t Ni) intersected 3.5m @ 6.4% Ni confirming potential for significant extensions.
8. Stage Two upgrade at Cosmic Boy nickel concentrator is expected to improve metallurgical recoveries and double the capacity of the plant by June 2010.
9. Widely spaced RC drilling at the Sandstone joint venture 450km north of Forrestania intersected anomalous nickel sulphides over several intervals.
10. Initial drilling at the R1 target at Rautavaara in the Finland joint venture has intersected wide zones (up to 129m) of sulphide mineralisation.
11. High safety and environmental standards maintained on Forrestania site. One LTI (Lost Time Injury) was reported at Forrestania during the half.
Western Areas NL & Controlled Entities ABN 68 091 049 357
24
MANAGEMENT DISCUSSION AND ANALYSIS
FLYING FOX MINE and COSMIC BOY MILL PRODUCTION
Production Statistics - Flying Fox
Mar Qtr Jun Qtr Sep Qtr Dec QtrRolling 12
MonthTotal
Flying Fox - Ore Tonnes Mined Tn's 77,501 59,098 54,150 53,618 244,367 Ni % 3.7% 4.3% 3.7% 3.3% 3.8%
Ni Tonnes Mined Tn's 2,833 2,570 2,015 1,776 9,193
Flying Fox - Ni Tonnes Produced
Total Ore Processed Tns 58,802 62,447 60,064 64,985 246,298 Ni % % 3.5% 4.4% 3.8% 3.1% 3.7%Ave. Recovery % 87% 90% 91% 88% 89%
Ni Tonnes in Concentrate Tns 1,805 2,435 2,066 1,791 8,097
Ni Tonnes in Concentrate Sold Tns 899 888 2,783 3,091 7,661
StockpilesConcentrate Tns 11,070 1,382 Grade % 15.1% 13.2%
Ore Tns 28,823 17,456 Grade % 2.9% 3.4%
Contained Ni in Stockpiles Tns 2,517 773
Financial Statistics - Flying FoxMar Qtr Jun Qtr Sep Qtr Dec Qtr Total
Group Production Cost/lbMining Cost (*) A$/lb 1.92 2.02 1.76 3.30 2.21 Haulage A$/lb 0.26 0.11 0.12 0.14 0.15 Milling A$/lb 0.52 0.54 0.77 0.96 0.69 Admin A$/lb 0.25 0.15 0.22 0.16 0.19 By Product Credits A$/lb (0.02) (0.01) (0.12) (0.21) (0.08) Cash Cost Ni in Con (***) A$/lb 2.93 2.81 2.74 4.34 3.16 Cash Cost Ni in Con/lb (***) US$/lb (**) 1.98 2.14 2.29 3.95 2.54Exchange Rate US$ / A$ 0.68 0.76 0.83 0.91 0.81
Note. Grade and recovery estimates are subject to change until the final assay data is received in accordance w ith the Offtake agreements.
(*) Mining Costs are net of deferred waste costs and inventory stockpile movements
(**) US$ FX for Relevant Quarter is RBA ave daily rate (Dec Qtr = A$1:US$0.9107)(***) Payable terms are not disclosed due to confidentiality conditions of the offtake agreements. Cash costs exclude royalties.
2.5%
3.0%
3.5%
4.0%
4.5%
5.0%
‐
10
20
30
40
50
60
70
80
90
Jun Qtr 2008
Sep Qtr 2008
Dec Qtr 2008
Mar Qtr 2009
Jun Qtr 2009
Sep Qtr 2009
Dec Qtr 2009
Ore Ton
nes Mined
(Ktn's)
Grade
%
Ore Tonnes & Grade Mined
Ore Mined Tns Ore Mined Grade %
‐
1.00
2.00
3.00
4.00
5.00
0.0%
1.0%
2.0%
3.0%
4.0%
5.0%
Jun Qtr 2008
Sep Qtr 2008
Dec Qtr 2008
Mar Qtr 2009
Jun Qtr 2009
Sep Qtr 2009
Dec Qtr 2009
A$/lb
Grade %
Milled Grade & Cash Cost A$/lb
Milled Grade % Cash Cost Ni in Con
Quarterly ore tonnes and grade mined Quarterly cash cost and mined A$/lb nickel
Western Areas NL & Controlled Entities ABN 68 091 049 357
25
CORPORATE AND FINANCING
Income Statement Three Months Ended
31 December Six Months Ended
31 December 2009
$’000 2008 $’000
2009 $’000
2008 $’000
Sales 43,798 21,169 85,531 40,792
Cost of sales (39,562) (20,231) (68,696) (36,442)
Gross (Loss)/Profit 4,236 938 16,835 4,350
Other income 21,167 647 21,810 3,570
Finance costs (7,927) (4,417) (14,837) (9,953)
Administration expenses (1,429) (1,583) (2,088) (4,590)
Employee benefit expenses (1,013) (850) (2,029) (1,879)
Foreign exchange gains / (losses) 1,095 (3,432) (13) (3,432)
Share Based Payments (1,339) (607) (1,920) (3,717)
Derivative loss (871) 264 (871) 264
Impairment loss on Non-current Assets - (882) - (882)
Profit / (Loss) before income tax 13,919 (9,922) 16,887 (16,269)
Income tax (expense) / benefit (4,872) 1,660 (6,212) 3,927
Profit / (Loss) for the period 9,047 (8,262) 10,675 (12,342)
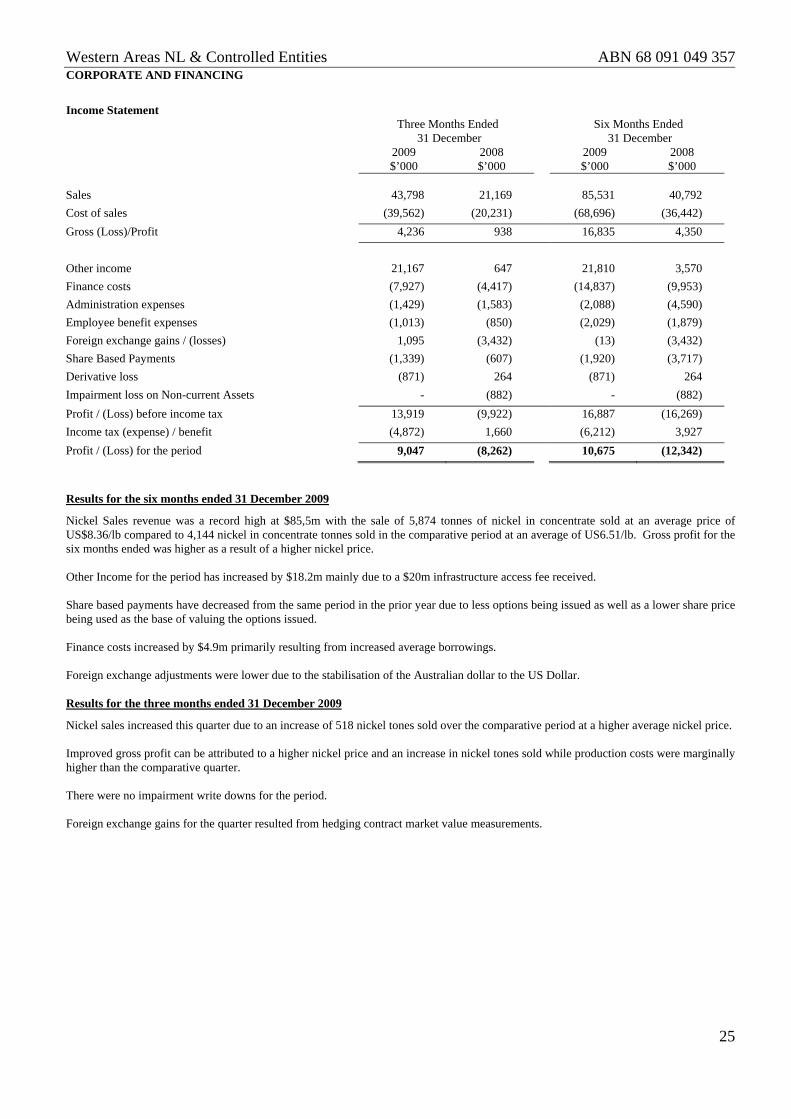
Results for the six months ended 31 December 2009
Nickel Sales revenue was a record high at $85,5m with the sale of 5,874 tonnes of nickel in concentrate sold at an average price of US$8.36/lb compared to 4,144 nickel in concentrate tonnes sold in the comparative period at an average of US6.51/lb. Gross profit for the six months ended was higher as a result of a higher nickel price. Other Income for the period has increased by $18.2m mainly due to a $20m infrastructure access fee received. Share based payments have decreased from the same period in the prior year due to less options being issued as well as a lower share price being used as the base of valuing the options issued. Finance costs increased by $4.9m primarily resulting from increased average borrowings. Foreign exchange adjustments were lower due to the stabilisation of the Australian dollar to the US Dollar. Results for the three months ended 31 December 2009
Nickel sales increased this quarter due to an increase of 518 nickel tones sold over the comparative period at a higher average nickel price. Improved gross profit can be attributed to a higher nickel price and an increase in nickel tones sold while production costs were marginally higher than the comparative quarter. There were no impairment write downs for the period. Foreign exchange gains for the quarter resulted from hedging contract market value measurements.
Western Areas NL & Controlled Entities ABN 68 091 049 357
26
Balance Sheet 31 December 2009
$’000 30 June 2009
$’000 Assets
Current Assets 125,600 139,616
Non Current Assets 375,020 338,982
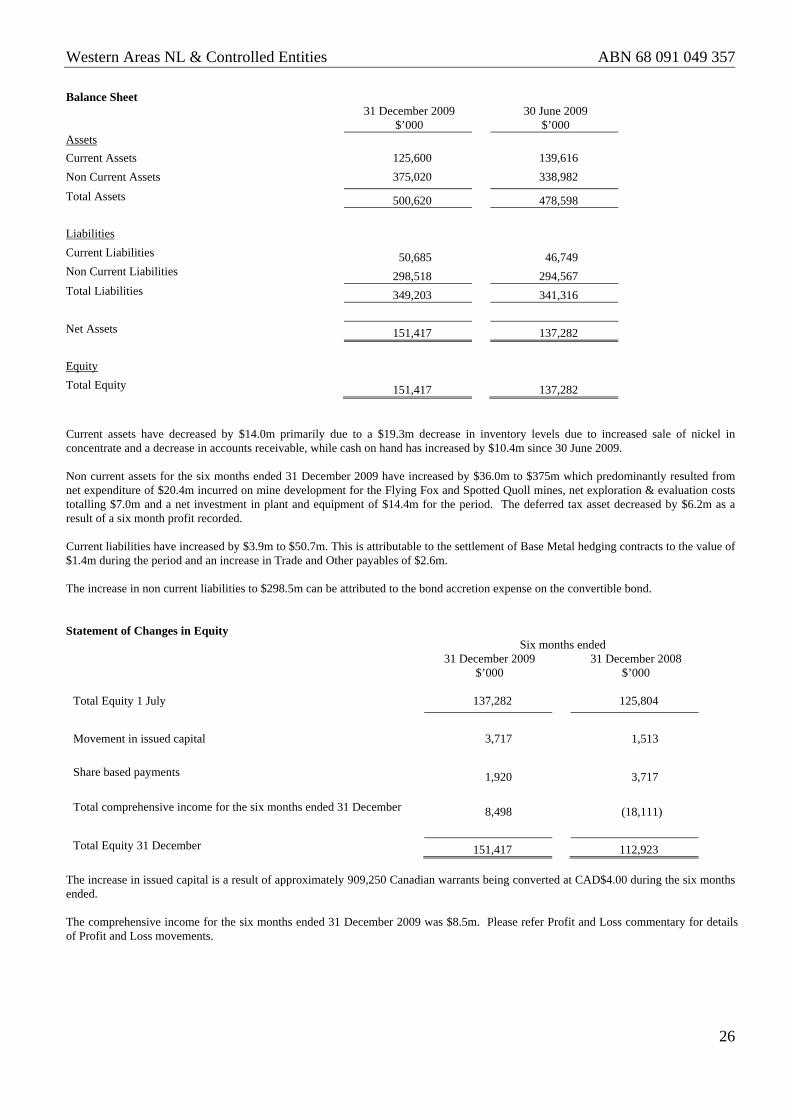
Total Assets 500,620 478,598 Liabilities Current Liabilities 50,685 46,749 Non Current Liabilities 298,518 294,567 Total Liabilities 349,203 341,316 Net Assets 151,417 137,282 Equity Total Equity 151,417 137,282 Current assets have decreased by $14.0m primarily due to a $19.3m decrease in inventory levels due to increased sale of nickel in concentrate and a decrease in accounts receivable, while cash on hand has increased by $10.4m since 30 June 2009. Non current assets for the six months ended 31 December 2009 have increased by $36.0m to $375m which predominantly resulted from net expenditure of $20.4m incurred on mine development for the Flying Fox and Spotted Quoll mines, net exploration & evaluation costs totalling $7.0m and a net investment in plant and equipment of $14.4m for the period. The deferred tax asset decreased by $6.2m as a result of a six month profit recorded. Current liabilities have increased by $3.9m to $50.7m. This is attributable to the settlement of Base Metal hedging contracts to the value of $1.4m during the period and an increase in Trade and Other payables of $2.6m. The increase in non current liabilities to $298.5m can be attributed to the bond accretion expense on the convertible bond. Statement of Changes in Equity
Six months ended 31 December 2009
$’000 31 December 2008
$’000 Total Equity 1 July 137,282 125,804
Movement in issued capital 3,717 1,513
Share based payments 1,920 3,717 Total comprehensive income for the six months ended 31 December 8,498 (18,111) Total Equity 31 December 151,417 112,923
The increase in issued capital is a result of approximately 909,250 Canadian warrants being converted at CAD$4.00 during the six months ended. The comprehensive income for the six months ended 31 December 2009 was $8.5m. Please refer Profit and Loss commentary for details of Profit and Loss movements.
Western Areas NL & Controlled Entities ABN 68 091 049 357
27
Cashflow Statement
Three Months Ended 31 Dec Six Months Ended 31 Dec 2009
$’000 2008 $’000
2009 $’000
2008 $’000
Net Cashflow from Operating Activities 26,842 7,335 50,357 3,836
Net Cashflow from Investing Activities (29,371) (49,362) (43,441) (90,039)
Net Cashflow from Financing Activities 3,265 7,588 3,541 6,029
Net Cashflow 736 (34,439) 10,457 (80,174)
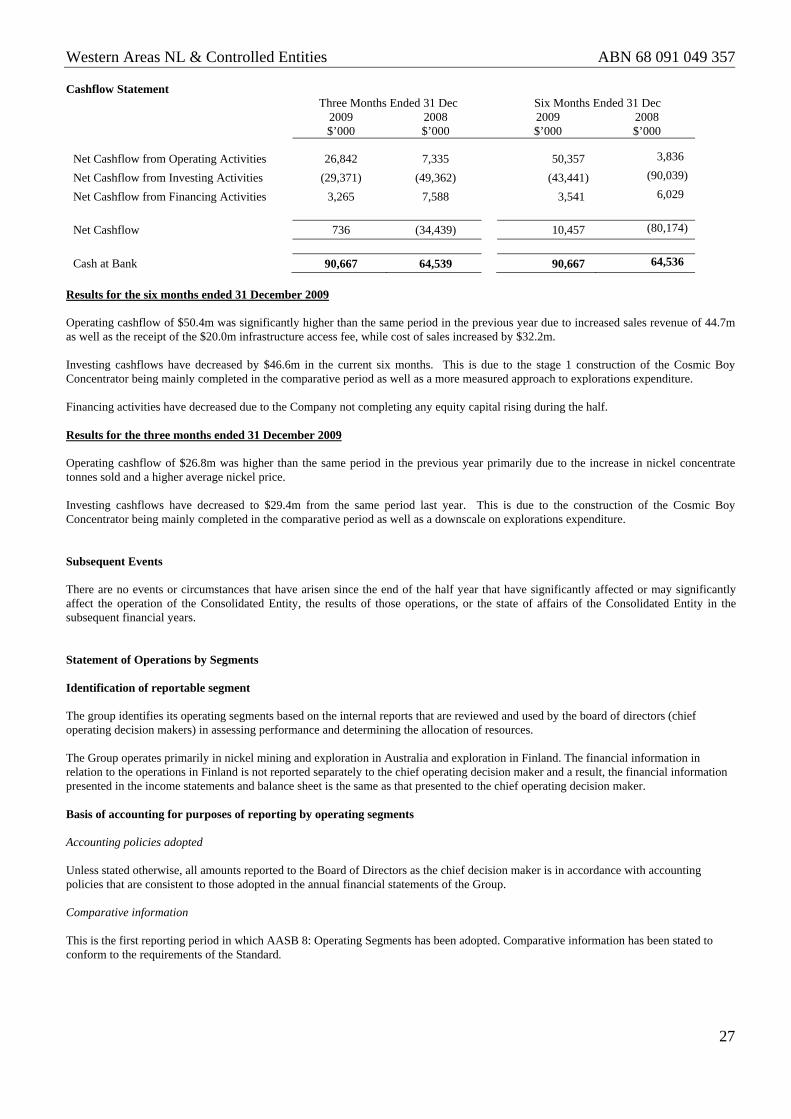
Cash at Bank 90,667 64,539 90,667 64,536 Results for the six months ended 31 December 2009 Operating cashflow of $50.4m was significantly higher than the same period in the previous year due to increased sales revenue of 44.7m as well as the receipt of the $20.0m infrastructure access fee, while cost of sales increased by $32.2m. Investing cashflows have decreased by $46.6m in the current six months. This is due to the stage 1 construction of the Cosmic Boy Concentrator being mainly completed in the comparative period as well as a more measured approach to explorations expenditure. Financing activities have decreased due to the Company not completing any equity capital rising during the half. Results for the three months ended 31 December 2009 Operating cashflow of $26.8m was higher than the same period in the previous year primarily due to the increase in nickel concentrate tonnes sold and a higher average nickel price. Investing cashflows have decreased to $29.4m from the same period last year. This is due to the construction of the Cosmic Boy Concentrator being mainly completed in the comparative period as well as a downscale on explorations expenditure. Subsequent Events There are no events or circumstances that have arisen since the end of the half year that have significantly affected or may significantly affect the operation of the Consolidated Entity, the results of those operations, or the state of affairs of the Consolidated Entity in the subsequent financial years. Statement of Operations by Segments Identification of reportable segment The group identifies its operating segments based on the internal reports that are reviewed and used by the board of directors (chief operating decision makers) in assessing performance and determining the allocation of resources. The Group operates primarily in nickel mining and exploration in Australia and exploration in Finland. The financial information in relation to the operations in Finland is not reported separately to the chief operating decision maker and a result, the financial information presented in the income statements and balance sheet is the same as that presented to the chief operating decision maker. Basis of accounting for purposes of reporting by operating segments Accounting policies adopted Unless stated otherwise, all amounts reported to the Board of Directors as the chief decision maker is in accordance with accounting policies that are consistent to those adopted in the annual financial statements of the Group. Comparative information This is the first reporting period in which AASB 8: Operating Segments has been adopted. Comparative information has been stated to conform to the requirements of the Standard.
Western Areas NL & Controlled Entities ABN 68 091 049 357
28
Share Capital
As at 15 February 2010
Outstanding Shares 179,735,899
Options issued but unexercised 10,830,000
Total 190,565,899
All the unexercised options are unlisted. Finance Activities, Liquidity and Capital Resources The Company has the following financing facilities available to it:
Amount available under the
Facility ($ millions)
Undrawn Portion of Facility ($ millions)
- Cash advance facility - ANZ 80.0 20.0
- Cash advance facility - BHP 45.0 0.0
- Security bond facility - ANZ 10.0 5.8
TOTAL 135.0 25.8
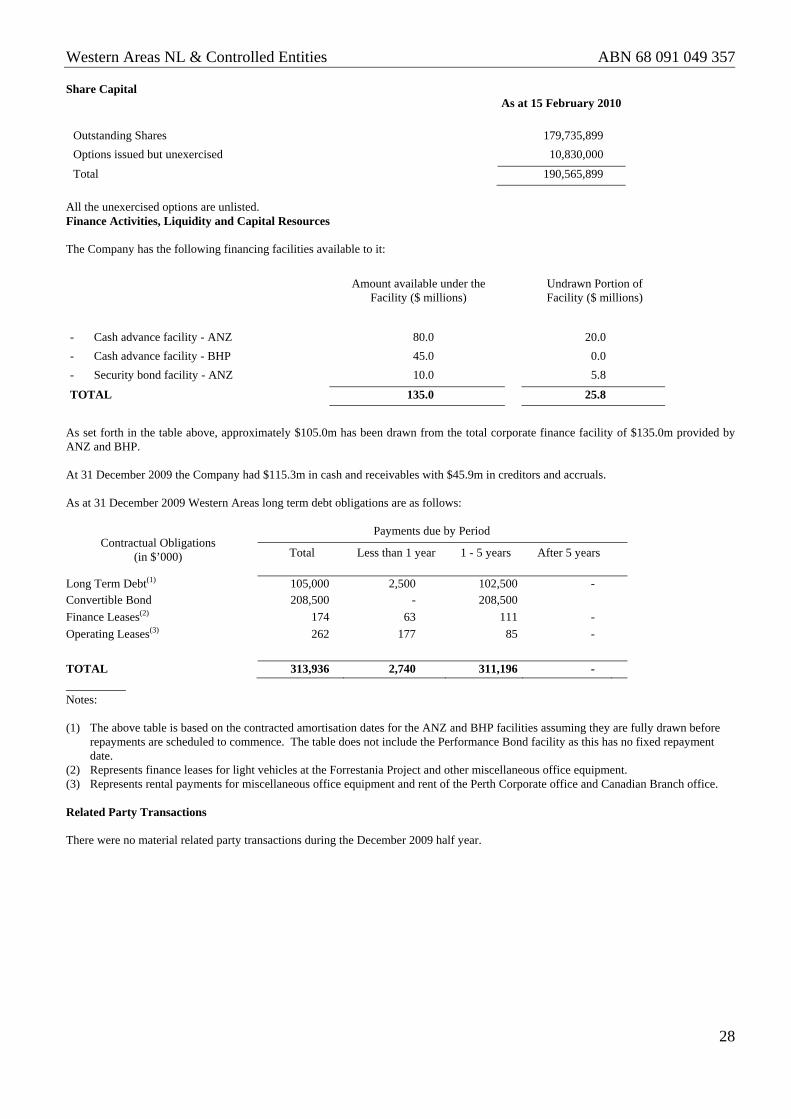
As set forth in the table above, approximately $105.0m has been drawn from the total corporate finance facility of $135.0m provided by ANZ and BHP. At 31 December 2009 the Company had $115.3m in cash and receivables with $45.9m in creditors and accruals. As at 31 December 2009 Western Areas long term debt obligations are as follows:
Contractual Obligations (in $’000)
Payments due by Period
Total Less than 1 year 1 - 5 years After 5 years
Long Term Debt(1) 105,000 2,500 102,500 - Convertible Bond 208,500 - 208,500
Finance Leases(2) 174 63 111 -
Operating Leases(3) 262 177 85 -
TOTAL 313,936 2,740 311,196 - __________ Notes: (1) The above table is based on the contracted amortisation dates for the ANZ and BHP facilities assuming they are fully drawn before
repayments are scheduled to commence. The table does not include the Performance Bond facility as this has no fixed repayment date.
(2) Represents finance leases for light vehicles at the Forrestania Project and other miscellaneous office equipment. (3) Represents rental payments for miscellaneous office equipment and rent of the Perth Corporate office and Canadian Branch office. Related Party Transactions There were no material related party transactions during the December 2009 half year.
Western Areas NL & Controlled Entities ABN 68 091 049 357
29
Critical Accounting Estimates and Balances The directors evaluate estimates and judgements incorporated into the financial report based on historical knowledge and best available current information. Estimates assume a reasonable expectation of future events and are based on current trends and economic data, obtained both externally and within the group. Key estimates
(i). Impairment The Group assesses impairment at each reporting date by evaluating conditions and events specific to the Group that may be indicative of impairment triggers. Recoverable amounts for the mine development asset is reassessed using the value-in-use calculations which incorporate various assumptions and estimates.
Key judgements
(i). Exploration and evaluation expenditure The Group capitalised expenditure relating to exploration and evaluation where it is considered likely to be recoverable or where the activities have not reached a stage which permits a reasonable assessment of the existence of reserves. While there are certain areas of interest from which no reserves have been extracted, the directors are of the continued belief that such expenditure should not be written off since exploration, evaluation and feasibility studies in such areas are ongoing. Such capitalised expenditure is carried at reporting date at $87.0m
Internal Controls The company has made no change to its internal controls over financial reporting since 30 June 2009 that have materially affected, or are reasonably likely to materially affect, the company’s internal control over financial reporting. Debt Facilities, Cash Balance and Working Capital At 31 December 2009 Western Areas had A$90.7m in cash plus receivables valued at A$24.6m from nickel sales (cash plus debtors A$115.3m). The A$80.0m ANZ loan Facility remains drawn to A$60.0m and the BHP facility fully drawn to A$45.0m. With record nickel sales for the six months, the working capital in stockpiles of both ore and concentrate has decreased by A$20.4m to A$8.2m. Hedging As at balance sheet date, Western Areas had foreign exchange put options for US$10.0m (US$5.0m for 31 March and US$2.5m for 30 June and 30 September 2010 quarters) with an average strike price of $0.9040. and US$7.5m in Option Collars with a $0.8290 floor and $0.9000 cap. Base metal hedging consists of 800tns of Nickel at an average of US$7.94, for delivery during January through March 2010. Western Areas continues to secure further short dated (3-6 months) currency and nickel price hedging representing less than 25% of forecast revenue. Bond and Share Buyback On 2 July 2007 Western Areas issued a A$225.0m, 8%, 5 Year Convertible Bond at a 45% premium due in July 2012. The Bonds are quoted on the Singapore Stock Exchange. Please refer to the Western Areas release dated 29 June 2007 for the Bond Conditions. The Company has in the past purchased and cancelled Bonds on market. During the half no Bonds were purchased. There remain 838 Bonds outstanding with the principal amount of A$208.5m. The Board continues to monitor and assess capital management strategies to add value for shareholders.