Embed Size (px)
Citation preview
10/17/07 1
Read: Ch. 15, GSF
Comparing Ecological Communities
Part Two: Ordination
10/17/07 2
Ordination vs. classification• The main purpose of both
multivariate methods is to interpret patterns in species composition
• Complementary approaches• Classification is used for grouping
ecological communities. • Ordination (from German, ordnung)
is used for arranging data along gradients. A.k.a. multivariate gradient analysis.
10/17/07 3
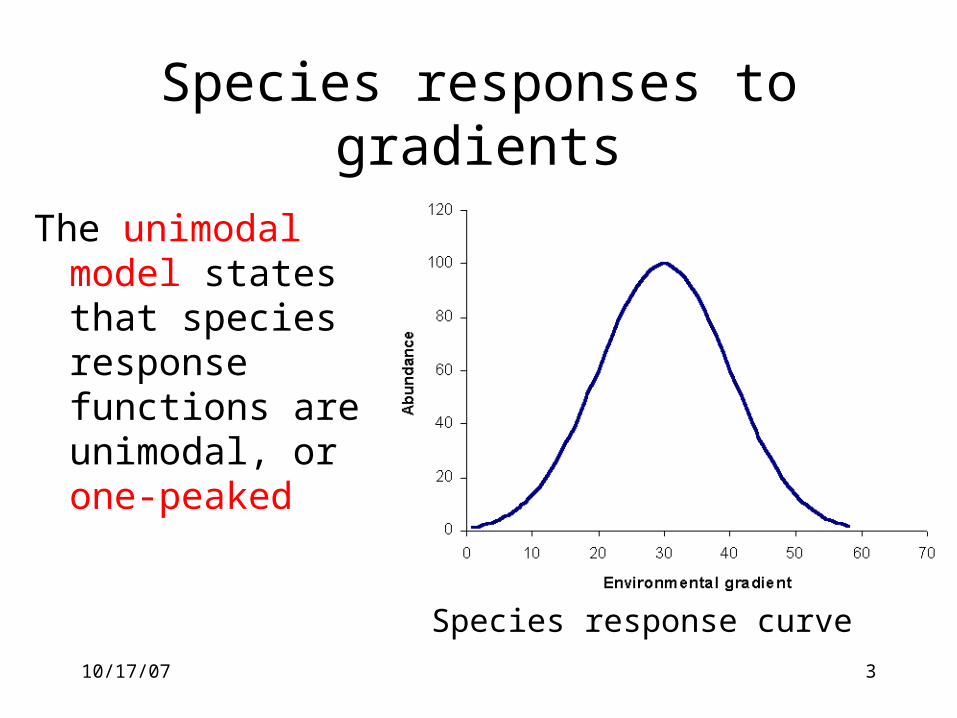
Species responses to gradients
The unimodal model states that species response functions are unimodal, or one-peaked
Species response curve
10/17/07 4
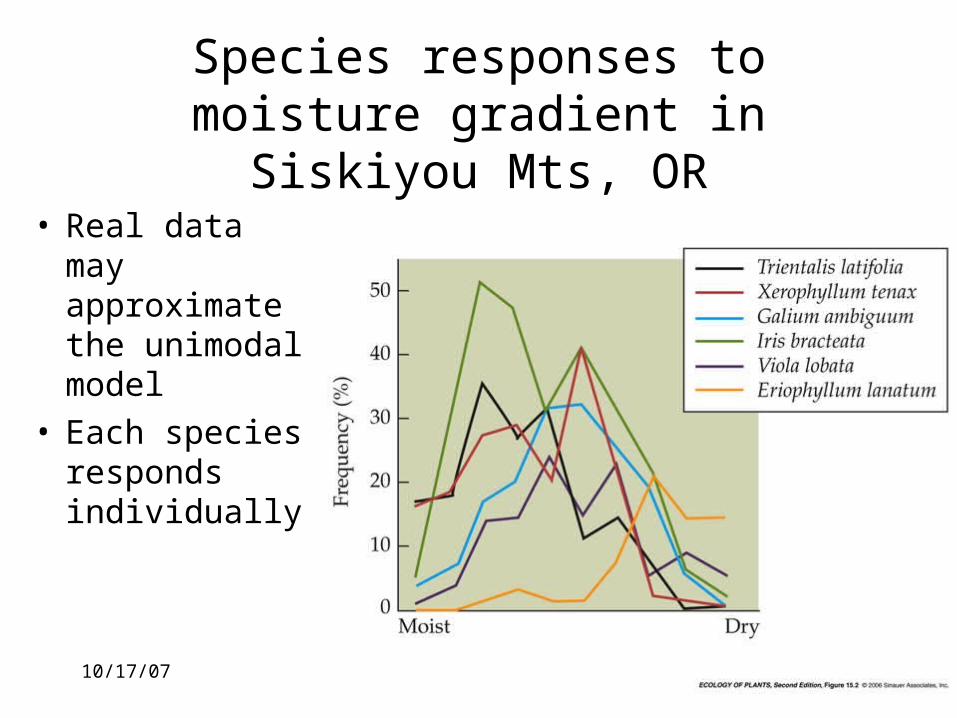
Species responses to moisture gradient in Siskiyou Mts, OR
• Real data may approximate the unimodal model
• Each species responds individually
10/17/07 5
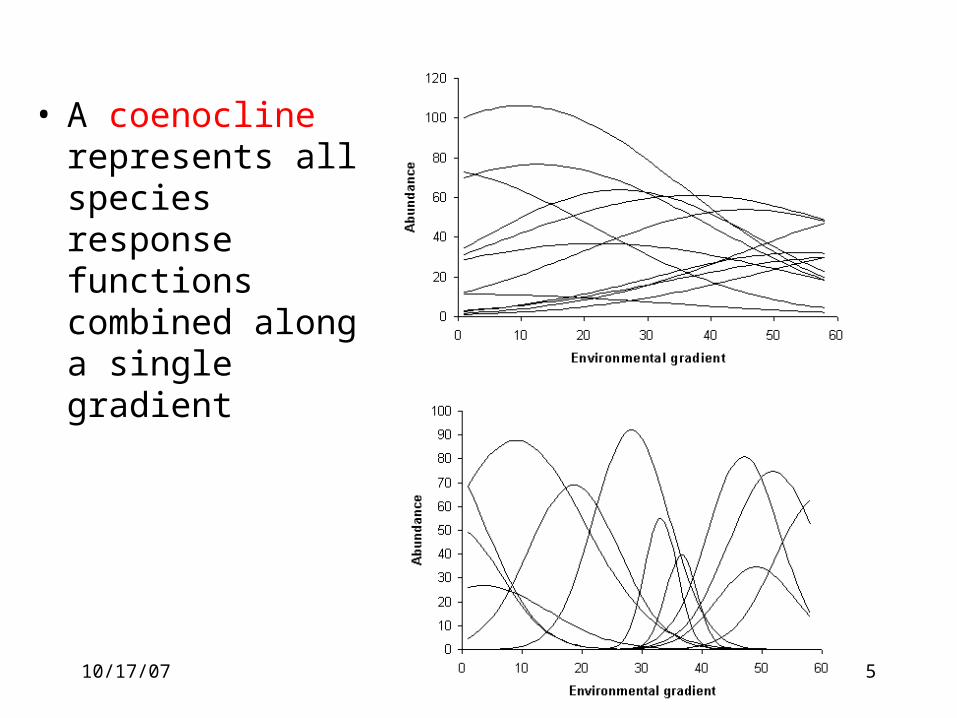
• A coenocline represents all species response functions combined along a single gradient
10/17/07 6
• Given the continuous nature of communities, ordination may be a more realistic approach than classification
• Classification results can become unstable in areas of intermediate species composition (e.g., for ecotones).
• Ordination itself can assist with subjective classifications (Peet 1980); TWINSPAN is a derivative of ordination (Hill 1979).
Ordination vs. classification
10/17/07 7
Properties of community data (1)• Ordination methods are operations on a
community data matrix (or species by sample matrix).
• A community data matrix has taxa (usually species) as rows and samples as columns or vice versa.
• In most studies of vegetation, the sample is a quadrat, relevé, or transect – though it may consist of a number of subsamples. (Samples in animal ecology may consist of traps, seine sweeps, or survey routes.)
10/17/07 8
Properties of community data (2)
• The elements in community data matrices are abundances of the species.
• ‘Abundance’ is a general term that can refer to density, biomass, cover, or even incidence (presence/absence) of species.
• The choice of an abundance measure will depend on the taxa and the questions under consideration.
• Species composition is frequently expressed in terms of relative abundance.
10/17/07 9
Properties of community data (3)
• Most species are infrequent. • The number of factors influencing species
composition is potentially very large. • The number of important factors is
typically few. • There is much noise. (why?)• There is much redundant information:
species often share similar distributions. It is this property of redundancy that allows us to make sense of compositional data.
10/17/07 10
Why ordination?1) It is impossible to visualize multiple
dimensions simultaneously. 2) A single multivariate analysis saves
time, in contrast to a separate univariate analysis for each species.
3) Statistical power is enhanced when species are considered in aggregate, because of redundancy
4) By focusing on ‘important dimensions’, we avoid interpreting (and misinterpreting) noise. Thus, ordination is a ‘noise reduction technique’.
10/17/07 11
Why ordination?5) The graphical results from most
techniques often lead to intuitive interpretations of species-environment relationships.
6) Ordination is most often used for pattern detection and hypothesis generation
10/17/07 12
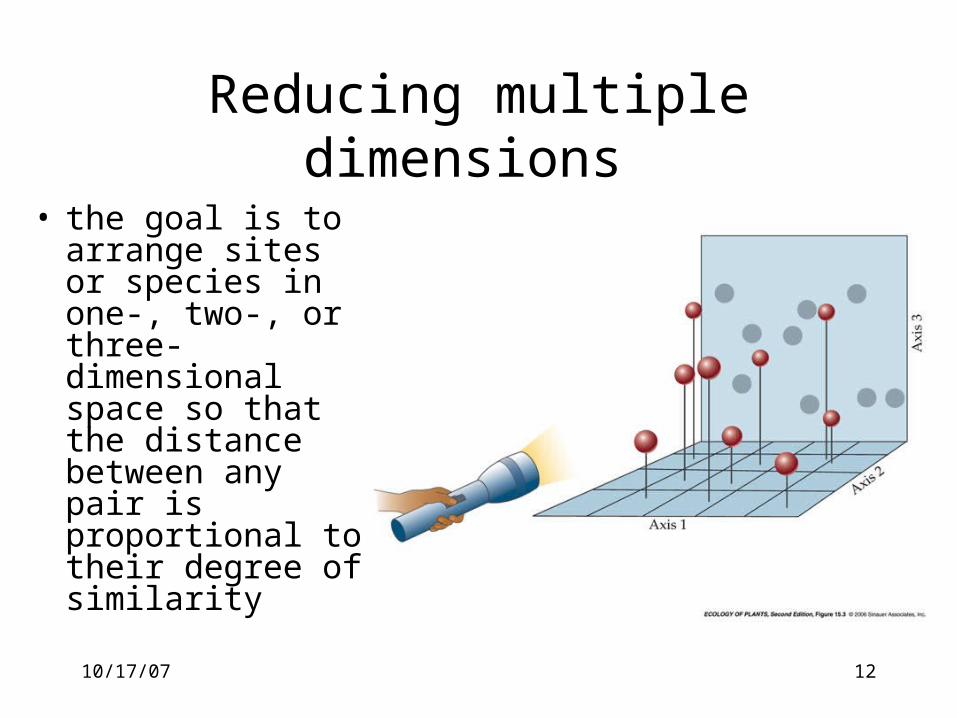
Reducing multiple dimensions
• the goal is to arrange sites or species in one-, two-, or three-dimensional space so that the distance between any pair is proportional to their degree of similarity
10/17/07 13
Indirect vs. direct gradient analysis• Indirect gradient ordinations are based
only on similarity matrices calculated from the species abundances
• Environmental variables associated with each stand can be overlaid onto the ordination plot
• The ordination itself is not influenced by input of environmental data, which might or might not be relevant to the species distributions.
10/17/07 14
Indirect vs. direct gradient analysis
• Direct gradient analysis does not use similarity indices, rather the ordination is based on the raw data matrix.
• Environmental variables associated with each stand are input into the ordination procedure, and influence the outcome of the plot
• Limitation: if an important environmental variable is overlooked or unknown, direct gradient analysis may not fully explain the variability observed in species distributions
10/17/07 15
A few types of ordination
• Polar ordination (PO)• Principle components analysis (PCA)• Detrended correspondence analysis
(DCA)• Canonical correspondence analysis
(CCA)• Nonmetric multidimensional scaling
(NMS or NMDS)
10/17/07 16
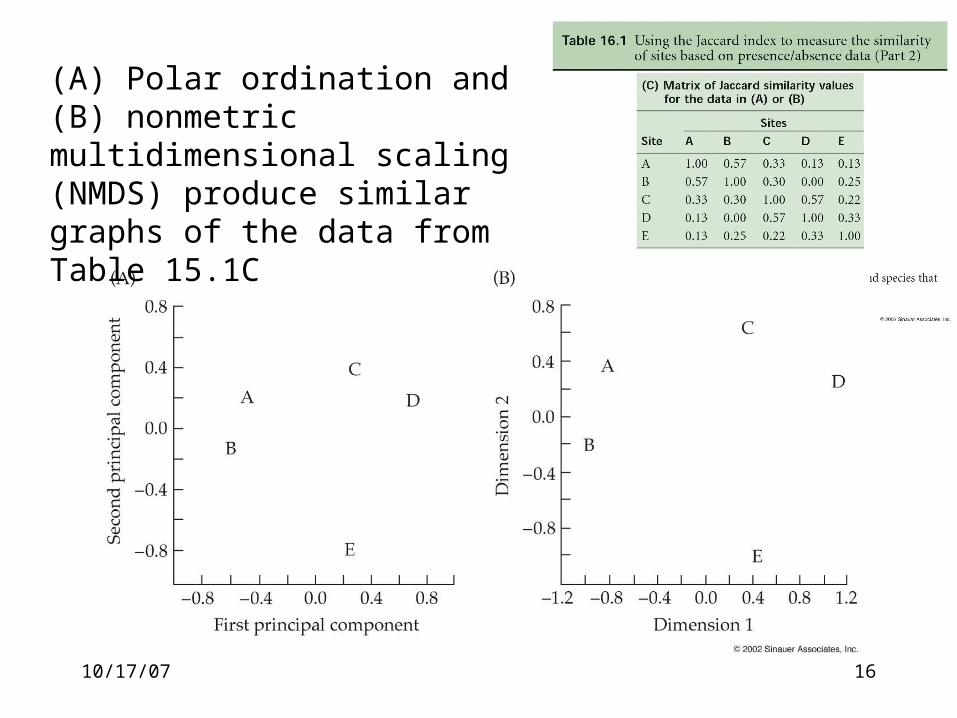
(A) Polar ordination and (B) nonmetric multidimensional scaling (NMDS) produce similar graphs of the data from Table 15.1C
10/17/07 17
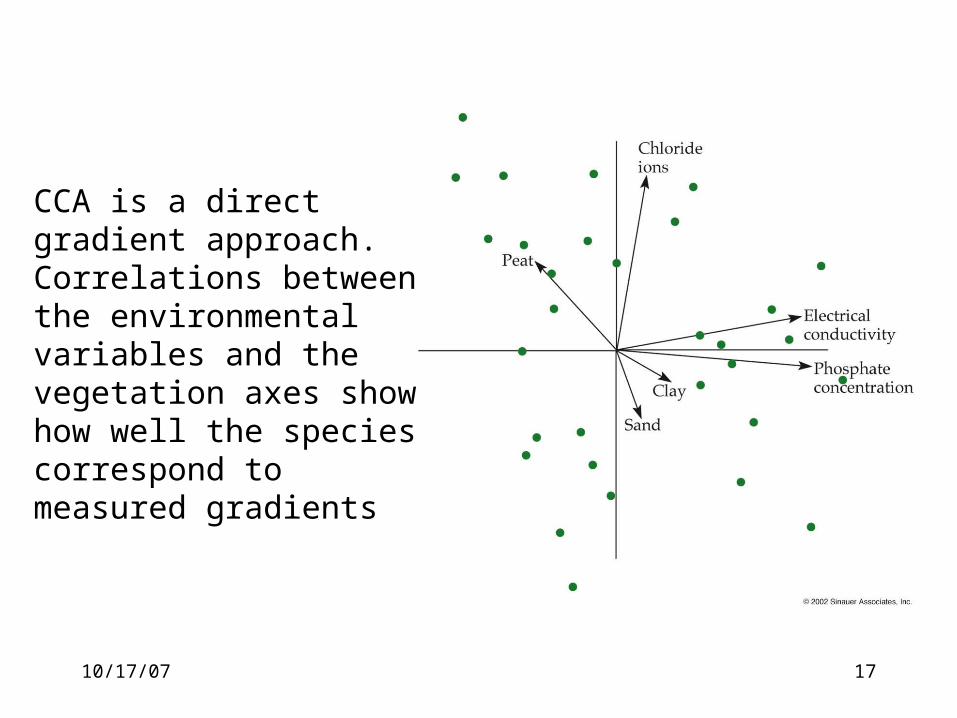
CCA is a direct gradient approach.Correlations between the environmental variables and the vegetation axes show how well the species correspond to measured gradients
10/17/07 18
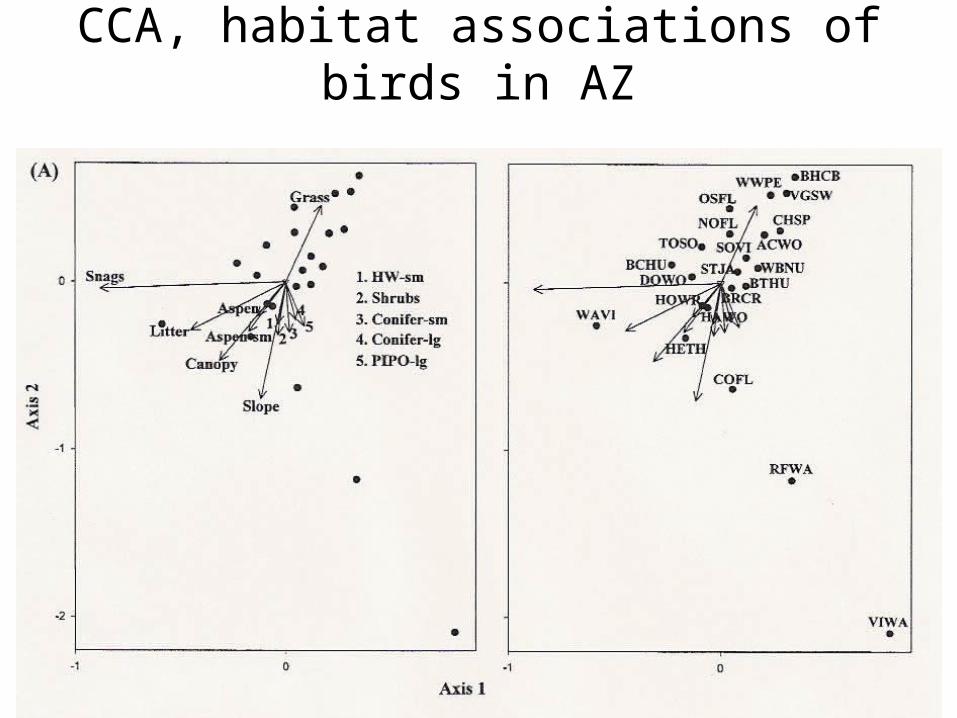
CCA, habitat associations of birds in AZ
10/17/07 19
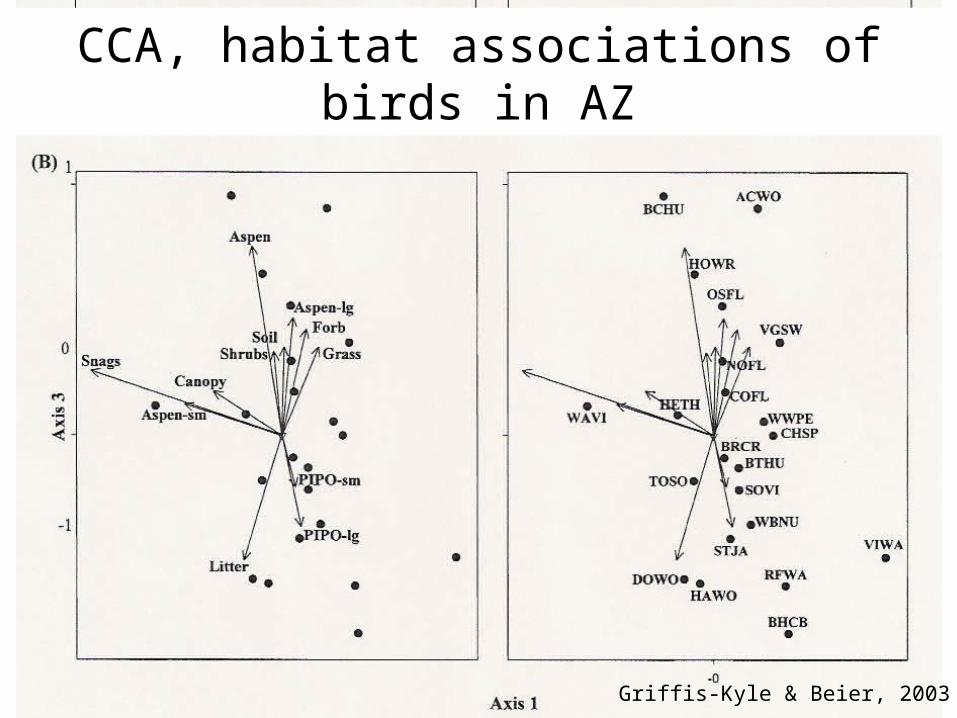
CCA, habitat associations of birds in AZ
Griffis-Kyle & Beier, 2003
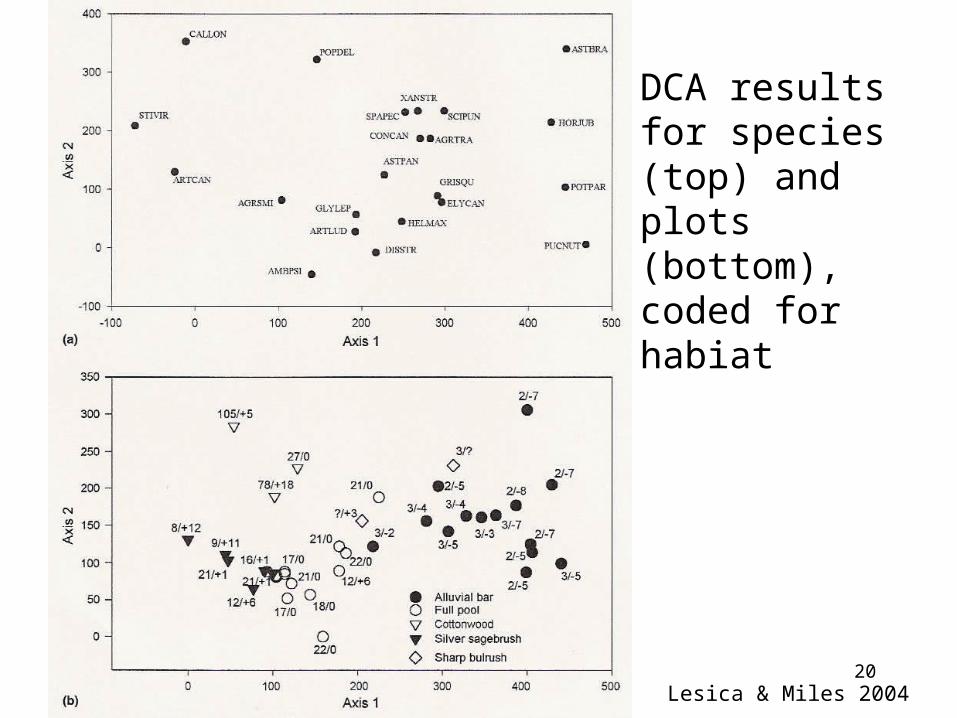
10/17/07 20
DCA results for species (top) and plots (bottom), coded for habiat
Lesica & Miles 2004

10/17/07 21
Combine classification (cluster analysis) and ordination (NMDS)
Clarke 2003

10/17/07 22
To learn more…
• See example papers on the web site:
• http://www.uwyo.edu/vegecology • Papers are linked under Data and
Examples• Ask your instructors for help• Use the help function in PC Ord