Embed Size (px)
Citation preview
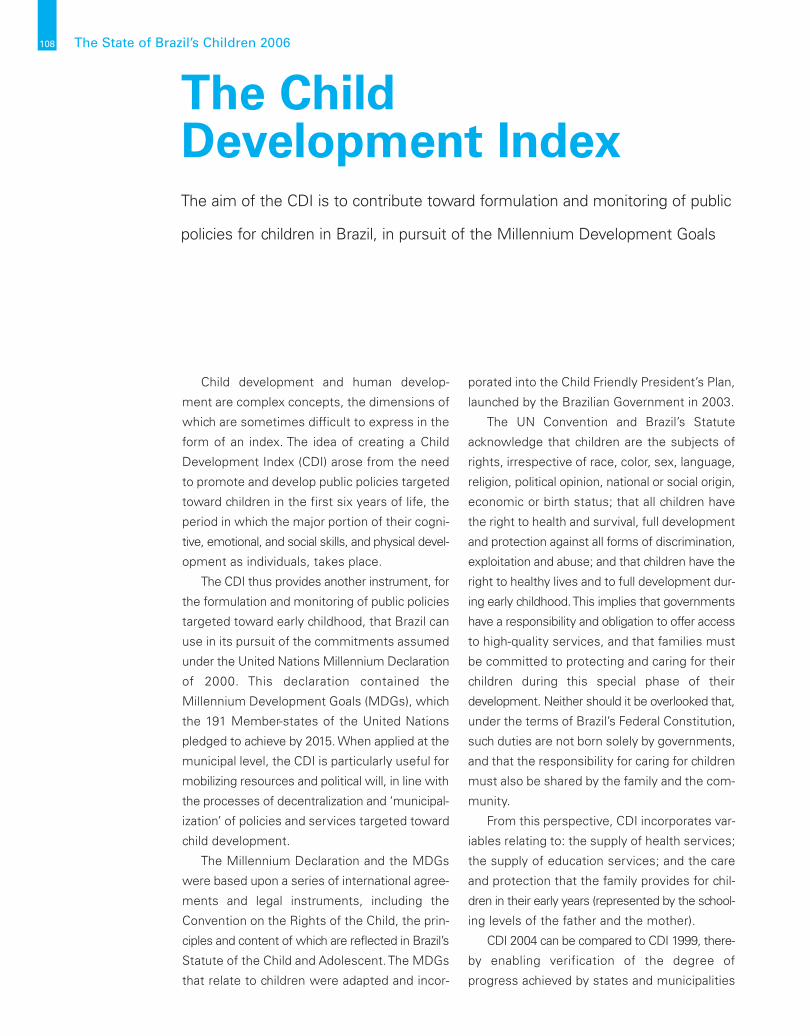
108 The State of Brazil’s Children 2006
Child development and human develop-
ment are complex concepts, the dimensions of
which are sometimes difficult to express in the
form of an index. The idea of creating a Child
Development Index (CDI) arose from the need
to promote and develop public policies targeted
toward children in the first six years of life, the
period in which the major portion of their cogni-
tive, emotional, and social skills, and physical devel-
opment as individuals, takes place.
The CDI thus provides another instrument, for
the formulation and monitoring of public policies
targeted toward early childhood, that Brazil can
use in its pursuit of the commitments assumed
under the United Nations Millennium Declaration
of 2000. This declaration contained the
Millennium Development Goals (MDGs), which
the 191 Member-states of the United Nations
pledged to achieve by 2015. When applied at the
municipal level, the CDI is particularly useful for
mobilizing resources and political will, in line with
the processes of decentralization and ‘municipal-
ization’ of policies and services targeted toward
child development.
The Millennium Declaration and the MDGs
were based upon a series of international agree-
ments and legal instruments, including the
Convention on the Rights of the Child, the prin-
ciples and content of which are reflected in Brazil’s
Statute of the Child and Adolescent. The MDGs
that relate to children were adapted and incor-
porated into the Child Friendly President’s Plan,
launched by the Brazilian Government in 2003.
The UN Convention and Brazil’s Statute
acknowledge that children are the subjects of
rights, irrespective of race, color, sex, language,
religion, political opinion, national or social origin,
economic or birth status; that all children have
the right to health and survival, full development
and protection against all forms of discrimination,
exploitation and abuse; and that children have the
right to healthy lives and to full development dur-
ing early childhood. This implies that governments
have a responsibility and obligation to offer access
to high-quality services, and that families must
be committed to protecting and caring for their
children during this special phase of their
development. Neither should it be overlooked that,
under the terms of Brazil’s Federal Constitution,
such duties are not born solely by governments,
and that the responsibility for caring for children
must also be shared by the family and the com-
munity.
From this perspective, CDI incorporates var-
iables relating to: the supply of health services;
the supply of education services; and the care
and protection that the family provides for chil-
dren in their early years (represented by the school-
ing levels of the father and the mother).
CDI 2004 can be compared to CDI 1999, there-
by enabling verification of the degree of
progress achieved by states and municipalities
The Child Development IndexThe aim of the CDI is to contribute toward formulation and monitoring of public
policies for children in Brazil, in pursuit of the Millennium Development Goals
The Child Development Index 109
over the period. Aside from presenting the rat-
ing of each municipality on statewide and nation-
al scales, it enables the identification of those that
have made the greatest strides, and verification
of best practices for public policies associated
with such advances.
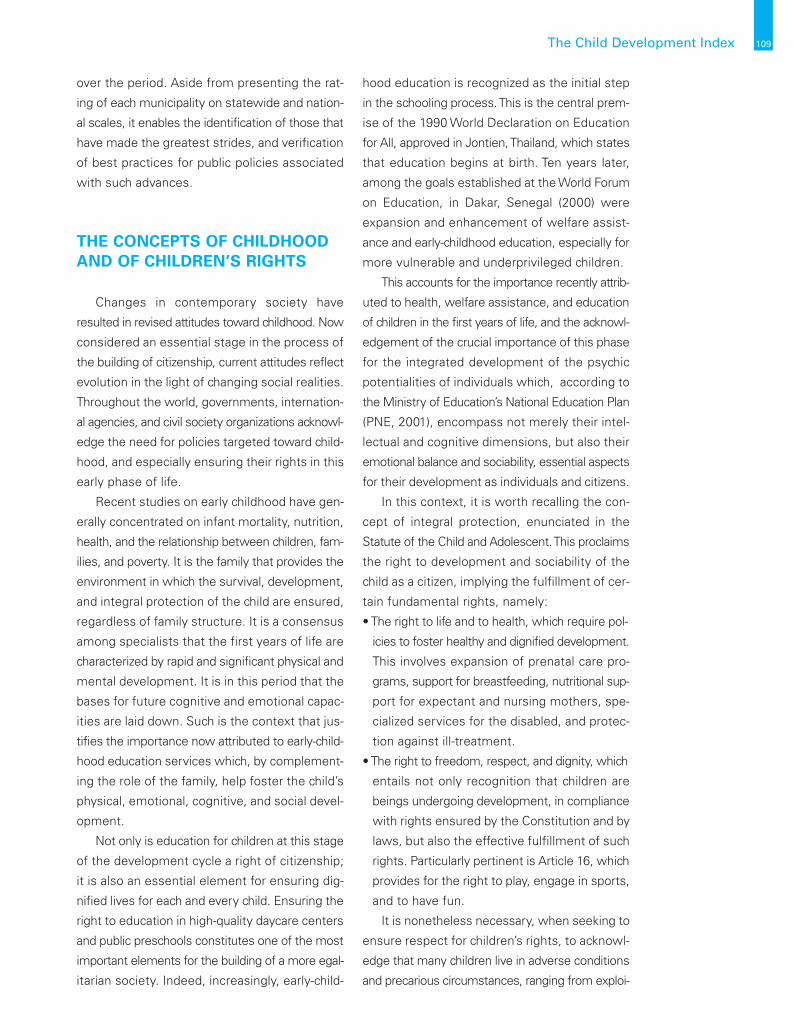
THE CONCEPTS OF CHILDHOODAND OF CHILDREN’S RIGHTS
Changes in contemporary society have
resulted in revised attitudes toward childhood. Now
considered an essential stage in the process of
the building of citizenship, current attitudes reflect
evolution in the light of changing social realities.
Throughout the world, governments, internation-
al agencies, and civil society organizations acknowl-
edge the need for policies targeted toward child-
hood, and especially ensuring their rights in this
early phase of life.
Recent studies on early childhood have gen-
erally concentrated on infant mortality, nutrition,
health, and the relationship between children, fam-
ilies, and poverty. It is the family that provides the
environment in which the survival, development,
and integral protection of the child are ensured,
regardless of family structure. It is a consensus
among specialists that the first years of life are
characterized by rapid and significant physical and
mental development. It is in this period that the
bases for future cognitive and emotional capac-
ities are laid down. Such is the context that jus-
tifies the importance now attributed to early-child-
hood education services which, by complement-
ing the role of the family, help foster the child’s
physical, emotional, cognitive, and social devel-
opment.
Not only is education for children at this stage
of the development cycle a right of citizenship;
it is also an essential element for ensuring dig-
nified lives for each and every child. Ensuring the
right to education in high-quality daycare centers
and public preschools constitutes one of the most
important elements for the building of a more egal-
itarian society. Indeed, increasingly, early-child-
hood education is recognized as the initial step
in the schooling process. This is the central prem-
ise of the 1990 World Declaration on Education
for All, approved in Jontien, Thailand, which states
that education begins at birth. Ten years later,
among the goals established at the World Forum
on Education, in Dakar, Senegal (2000) were
expansion and enhancement of welfare assist-
ance and early-childhood education, especially for
more vulnerable and underprivileged children.
This accounts for the importance recently attrib-
uted to health, welfare assistance, and education
of children in the first years of life, and the acknowl-
edgement of the crucial importance of this phase
for the integrated development of the psychic
potentialities of individuals which, according to
the Ministry of Education’s National Education Plan
(PNE, 2001), encompass not merely their intel-
lectual and cognitive dimensions, but also their
emotional balance and sociability, essential aspects
for their development as individuals and citizens.
In this context, it is worth recalling the con-
cept of integral protection, enunciated in the
Statute of the Child and Adolescent. This proclaims
the right to development and sociability of the
child as a citizen, implying the fulfillment of cer-
tain fundamental rights, namely:
• The right to life and to health, which require pol-
icies to foster healthy and dignified development.
This involves expansion of prenatal care pro-
grams, support for breastfeeding, nutritional sup-
port for expectant and nursing mothers, spe-
cialized services for the disabled, and protec-
tion against ill-treatment.
• The right to freedom, respect, and dignity, which
entails not only recognition that children are
beings undergoing development, in compliance
with rights ensured by the Constitution and by
laws, but also the effective fulfillment of such
rights. Particularly pertinent is Article 16, which
provides for the right to play, engage in sports,
and to have fun.
It is nonetheless necessary, when seeking to
ensure respect for children’s rights, to acknowl-
edge that many children live in adverse conditions
and precarious circumstances, ranging from exploi-
110 The State of Brazil’s Children 2006
tation as child labor, to abuse and sexual exploi-
tation by adults. Another issue that must be
addressed is the dearth of services for children
with special needs.
ANALYSIS OF THE RESULTS
Prior to embarking upon an analysis of the
results revealed by the CDI, some thought should
be devoted to the medium and long-range plan-
ning of policy goals for children, taking into account
the demographic structure of the Brazilian pop-
ulation. To this end, initially, the proportion of the
Brazilian population comprised of children up to
the age of 6 years needs to be determined.
Children up to the age of 6 years as aproportion of the Brazilian population
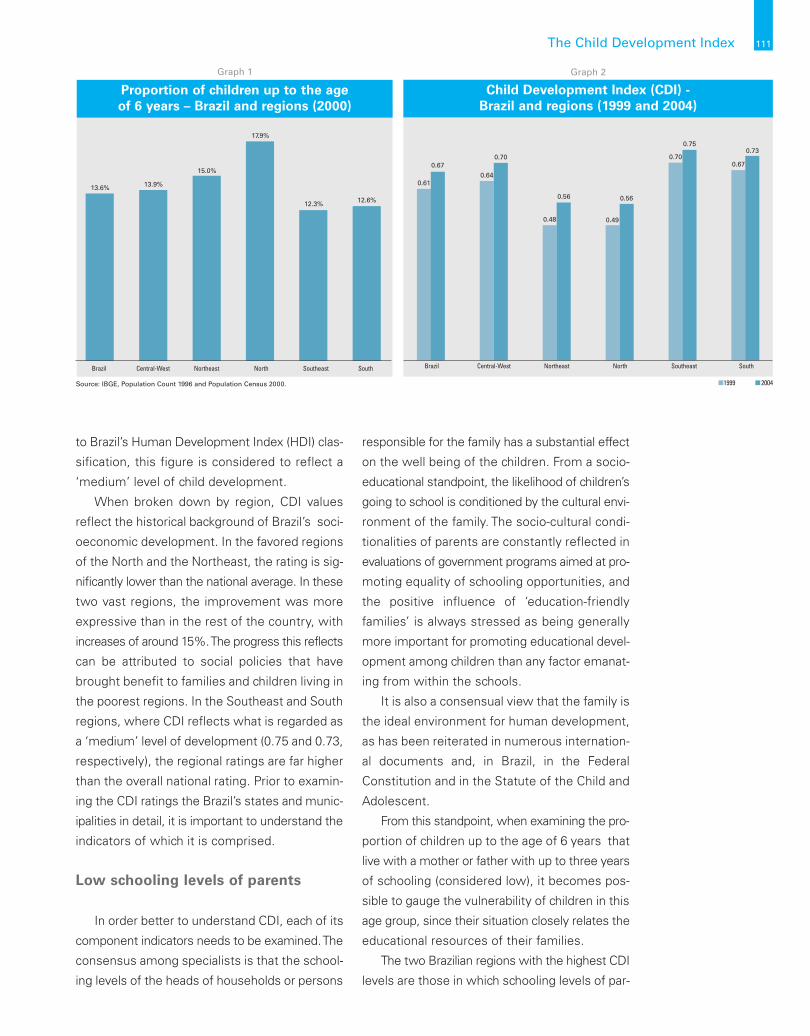
Recent statistics reflect change underway in
the age structure of the Brazilian population. The
two most evident trends are a decline in the share
of children and youths; and an increase in the pro-
portion of elderly people. According to IBGE, in
1980 children below the age of 6 years account-
ed for 18.9% of the population; in 1991 this share
had declined to 15.9%; and by 2000 to a mere
13.6%. This process can be attributed to a series
of interrelated factors, including intense urban-
ization, plummeting fertility rates, technological
advances in the communications media, and a
massive increase in the numbers of women on
the labor market which, in turn, has spurred bur-
geoning demand for early-childhood care servi-
ces.
In Brazil, there are a total of 23 million chil-
dren in the 0-to-6-year age bracket. As a propor-
tion of the entire population, the share of this age
group is higher in the North and Northeast than
in other regions. In the States of Amapá, Roraima,
Acre and Amazonas, in the least developed region
of the country, children in this age group account
for roughly one fifth of the total population. This
indicates a need on the part of governmental
organizations to pay especial attention to states
in the North region. Indeed, historically, fertility
rates in the North region have always been high-
er than in other parts of Brazil.
Comparison between CDI 1999 and CDI 2004
A comparison of CDI ratings referent to 1999
with those of 2004 shows that, in the interven-
ing period, conditions have improved significant-
ly, since the value leapt from 0.61 to 0.67, an
increase of almost 10%. Nonetheless, similarly
Discrepancies were detected in the val-
ues and data-validation used and disclosed
in 2001. It was thus decided that CDI 1999
should be recalculated to enable com-
parison with the 2004 ratings.
Furthermore, a change was effected in the
formula for calculating the Ministry of
Education/INEP indicators for ‘percentage
of children up to the age of 3 years enrolled
in daycare’, and the Ministry of Health’s
indicator for ‘percentage of children vac-
cinated against measles’. The percentage
of 4-to-6 year-old children in preschools was
maintained; whereas the measles indicator
was dropped in favor of the percentage
of children vaccinated with DTP (1999) and
tetramune (2004) which then became part
of the CDI calculation in response to a rec-
ommendation from the Ministry of
Health, in view of its greater represen-
tativeness. The data was sent specially to
UNICEF by Ministry of Health.
It should be observed that indicators
relating to low schooling levels of parents
were recalculated for 1996, since it was
not possible to validate the calculations
disclosed for the CDI 1999.
Summary of procedures for calculation and processing CDIReview of CDI indicators
The Child Development Index 111
to Brazil’s Human Development Index (HDI) clas-
sification, this figure is considered to reflect a
‘medium’ level of child development.
When broken down by region, CDI values
reflect the historical background of Brazil’s soci-
oeconomic development. In the favored regions
of the North and the Northeast, the rating is sig-
nificantly lower than the national average. In these
two vast regions, the improvement was more
expressive than in the rest of the country, with
increases of around 15%. The progress this reflects
can be attributed to social policies that have
brought benefit to families and children living in
the poorest regions. In the Southeast and South
regions, where CDI reflects what is regarded as
a ‘medium’ level of development (0.75 and 0.73,
respectively), the regional ratings are far higher
than the overall national rating. Prior to examin-
ing the CDI ratings the Brazil’s states and munic-
ipalities in detail, it is important to understand the
indicators of which it is comprised.
Low schooling levels of parents
In order better to understand CDI, each of its
component indicators needs to be examined. The
consensus among specialists is that the school-
ing levels of the heads of households or persons
responsible for the family has a substantial effect
on the well being of the children. From a socio-
educational standpoint, the likelihood of children’s
going to school is conditioned by the cultural envi-
ronment of the family. The socio-cultural condi-
tionalities of parents are constantly reflected in
evaluations of government programs aimed at pro-
moting equality of schooling opportunities, and
the positive influence of ‘education-friendly
families’ is always stressed as being generally
more important for promoting educational devel-
opment among children than any factor emanat-
ing from within the schools.
It is also a consensual view that the family is
the ideal environment for human development,
as has been reiterated in numerous internation-
al documents and, in Brazil, in the Federal
Constitution and in the Statute of the Child and
Adolescent.
From this standpoint, when examining the pro-
portion of children up to the age of 6 years that
live with a mother or father with up to three years
of schooling (considered low), it becomes pos-
sible to gauge the vulnerability of children in this
age group, since their situation closely relates the
educational resources of their families.
The two Brazilian regions with the highest CDI
levels are those in which schooling levels of par-
Proportion of children up to the age of 6 years – Brazil and regions (2000)
Brazil Central-West Northeast North Southeast South
15.0%
12.6%12.3%
13.9%
17.9%
13.6%
Graph 1
Child Development Index (CDI) - Brazil and regions (1999 and 2004)
Brazil Central-West Northeast North Southeast South
1999 2004
0.61
0.490.48
0.56
0.70
0.75
0.67
0.73
0.64
0.70
0.56
0.67
Graph 2
Source: IBGE, Population Count 1996 and Population Census 2000.
112 The State of Brazil’s Children 2006
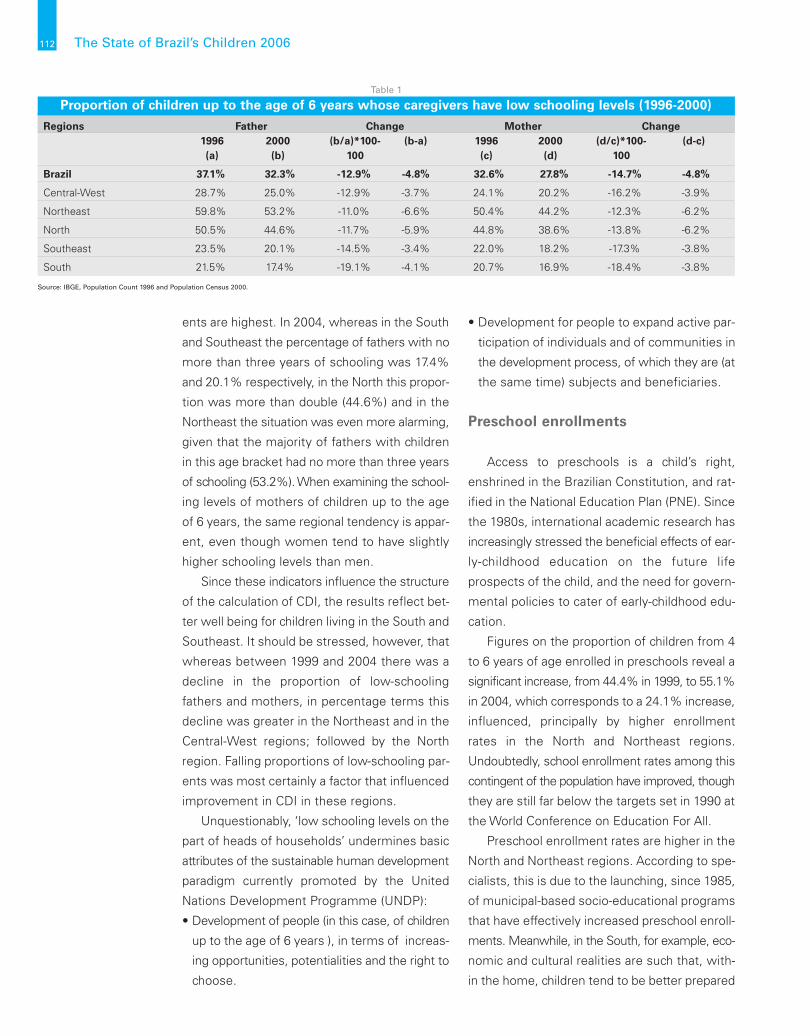
ents are highest. In 2004, whereas in the South
and Southeast the percentage of fathers with no
more than three years of schooling was 17.4%
and 20.1% respectively, in the North this propor-
tion was more than double (44.6%) and in the
Northeast the situation was even more alarming,
given that the majority of fathers with children
in this age bracket had no more than three years
of schooling (53.2%). When examining the school-
ing levels of mothers of children up to the age
of 6 years, the same regional tendency is appar-
ent, even though women tend to have slightly
higher schooling levels than men.
Since these indicators influence the structure
of the calculation of CDI, the results reflect bet-
ter well being for children living in the South and
Southeast. It should be stressed, however, that
whereas between 1999 and 2004 there was a
decline in the proportion of low-schooling
fathers and mothers, in percentage terms this
decline was greater in the Northeast and in the
Central-West regions; followed by the North
region. Falling proportions of low-schooling par-
ents was most certainly a factor that influenced
improvement in CDI in these regions.
Unquestionably, ‘low schooling levels on the
part of heads of households’ undermines basic
attributes of the sustainable human development
paradigm currently promoted by the United
Nations Development Programme (UNDP):
• Development of people (in this case, of children
up to the age of 6 years ), in terms of increas-
ing opportunities, potentialities and the right to
choose.
• Development for people to expand active par-
ticipation of individuals and of communities in
the development process, of which they are (at
the same time) subjects and beneficiaries.
Preschool enrollments
Access to preschools is a child’s right,
enshrined in the Brazilian Constitution, and rat-
ified in the National Education Plan (PNE). Since
the 1980s, international academic research has
increasingly stressed the beneficial effects of ear-
ly-childhood education on the future life
prospects of the child, and the need for govern-
mental policies to cater of early-childhood edu-
cation.
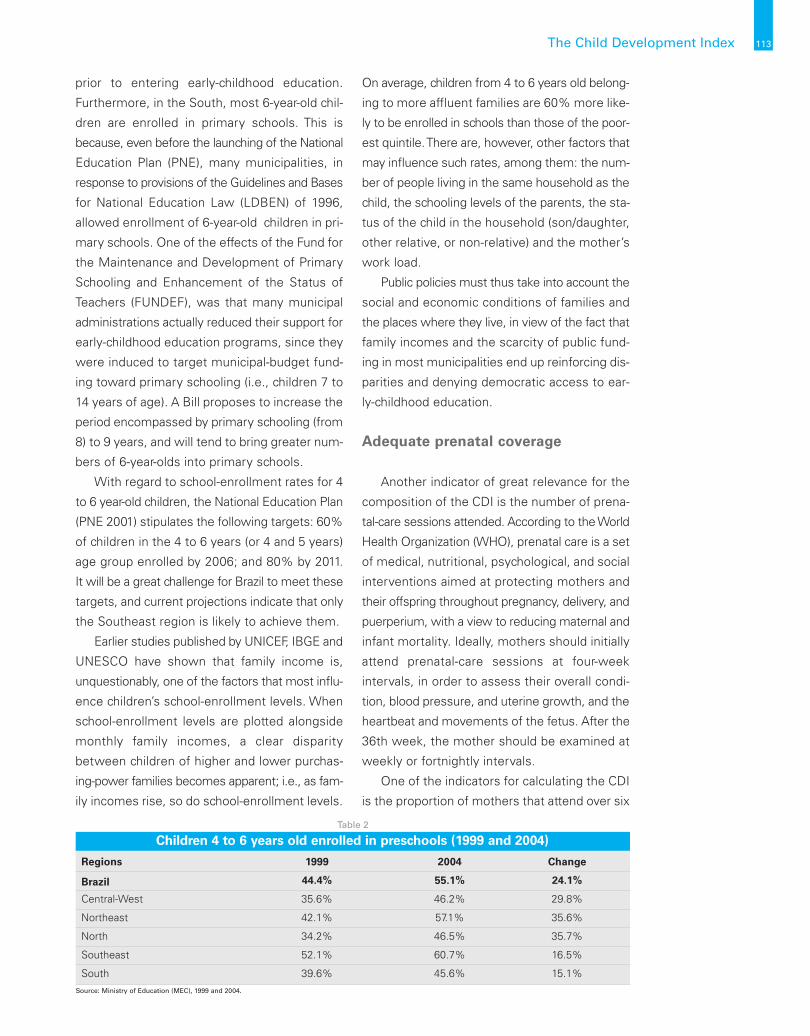
Figures on the proportion of children from 4
to 6 years of age enrolled in preschools reveal a
significant increase, from 44.4% in 1999, to 55.1%
in 2004, which corresponds to a 24.1% increase,
influenced, principally by higher enrollment
rates in the North and Northeast regions.
Undoubtedly, school enrollment rates among this
contingent of the population have improved, though
they are still far below the targets set in 1990 at
the World Conference on Education For All.
Preschool enrollment rates are higher in the
North and Northeast regions. According to spe-
cialists, this is due to the launching, since 1985,
of municipal-based socio-educational programs
that have effectively increased preschool enroll-
ments. Meanwhile, in the South, for example, eco-
nomic and cultural realities are such that, with-
in the home, children tend to be better prepared
Regions Father Change Mother Change1996 2000 (b/a)*100- (b-a) 1996 2000 (d/c)*100- (d-c)(a) (b) 100 (c) (d) 100
Brazil 37.1% 32.3% -12.9% -4.8% 32.6% 27.8% -14.7% -4.8%
Central-West 28.7% 25.0% -12.9% -3.7% 24.1% 20.2% -16.2% -3.9%
Northeast 59.8% 53.2% -11.0% -6.6% 50.4% 44.2% -12.3% -6.2%
North 50.5% 44.6% -11.7% -5.9% 44.8% 38.6% -13.8% -6.2%
Southeast 23.5% 20.1% -14.5% -3.4% 22.0% 18.2% -17.3% -3.8%
South 21.5% 17.4% -19.1% -4.1% 20.7% 16.9% -18.4% -3.8%
Source: IBGE, Population Count 1996 and Population Census 2000.
Table 1
Proportion of children up to the age of 6 years whose caregivers have low schooling levels (1996-2000)
The Child Development Index 113
prior to entering early-childhood education.
Furthermore, in the South, most 6-year-old chil-
dren are enrolled in primary schools. This is
because, even before the launching of the National
Education Plan (PNE), many municipalities, in
response to provisions of the Guidelines and Bases
for National Education Law (LDBEN) of 1996,
allowed enrollment of 6-year-old children in pri-
mary schools. One of the effects of the Fund for
the Maintenance and Development of Primary
Schooling and Enhancement of the Status of
Teachers (FUNDEF), was that many municipal
administrations actually reduced their support for
early-childhood education programs, since they
were induced to target municipal-budget fund-
ing toward primary schooling (i.e., children 7 to
14 years of age). A Bill proposes to increase the
period encompassed by primary schooling (from
8) to 9 years, and will tend to bring greater num-
bers of 6-year-olds into primary schools.
With regard to school-enrollment rates for 4
to 6 year-old children, the National Education Plan
(PNE 2001) stipulates the following targets: 60%
of children in the 4 to 6 years (or 4 and 5 years)
age group enrolled by 2006; and 80% by 2011.
It will be a great challenge for Brazil to meet these
targets, and current projections indicate that only
the Southeast region is likely to achieve them.
Earlier studies published by UNICEF, IBGE and
UNESCO have shown that family income is,
unquestionably, one of the factors that most influ-
ence children’s school-enrollment levels. When
school-enrollment levels are plotted alongside
monthly family incomes, a clear disparity
between children of higher and lower purchas-
ing-power families becomes apparent; i.e., as fam-
ily incomes rise, so do school-enrollment levels.
On average, children from 4 to 6 years old belong-
ing to more affluent families are 60% more like-
ly to be enrolled in schools than those of the poor-
est quintile. There are, however, other factors that
may influence such rates, among them: the num-
ber of people living in the same household as the
child, the schooling levels of the parents, the sta-
tus of the child in the household (son/daughter,
other relative, or non-relative) and the mother’s
work load.
Public policies must thus take into account the
social and economic conditions of families and
the places where they live, in view of the fact that
family incomes and the scarcity of public fund-
ing in most municipalities end up reinforcing dis-
parities and denying democratic access to ear-
ly-childhood education.
Adequate prenatal coverage
Another indicator of great relevance for the
composition of the CDI is the number of prena-
tal-care sessions attended. According to the World
Health Organization (WHO), prenatal care is a set
of medical, nutritional, psychological, and social
interventions aimed at protecting mothers and
their offspring throughout pregnancy, delivery, and
puerperium, with a view to reducing maternal and
infant mortality. Ideally, mothers should initially
attend prenatal-care sessions at four-week
intervals, in order to assess their overall condi-
tion, blood pressure, and uterine growth, and the
heartbeat and movements of the fetus. After the
36th week, the mother should be examined at
weekly or fortnightly intervals.
One of the indicators for calculating the CDI
is the proportion of mothers that attend over six
Regions 1999 2004 Change
Brazil 44.4% 55.1% 24.1%
Central-West 35.6% 46.2% 29.8%
Northeast 42.1% 57.1% 35.6%
North 34.2% 46.5% 35.7%
Southeast 52.1% 60.7% 16.5%
South 39.6% 45.6% 15.1%Source: Ministry of Education (MEC), 1999 and 2004.
Table 2
Children 4 to 6 years old enrolled in preschools (1999 and 2004)
114 The State of Brazil’s Children 2006
prenatal care sessions. This was the benchmark
set by the Pan-American Health Organization
(PAHO) and the Ministry of Health, with the aim
of ensuring that expectant mothers are submit-
ted to the necessary (blood and urine) tests to
detect and treat any infections, and of immuniz-
ing the fetus against such diseases as neonatal
tetanus. In view of the importance of prenatal care
in avoiding perinatal mortality (which accounts for
practically half of infant deaths in Brazil) and mater-
nal deaths, this indicator, alongside vaccination
coverage, is regarded as being of extreme rele-
vance for ensuring the survival of children in their
first year of life.
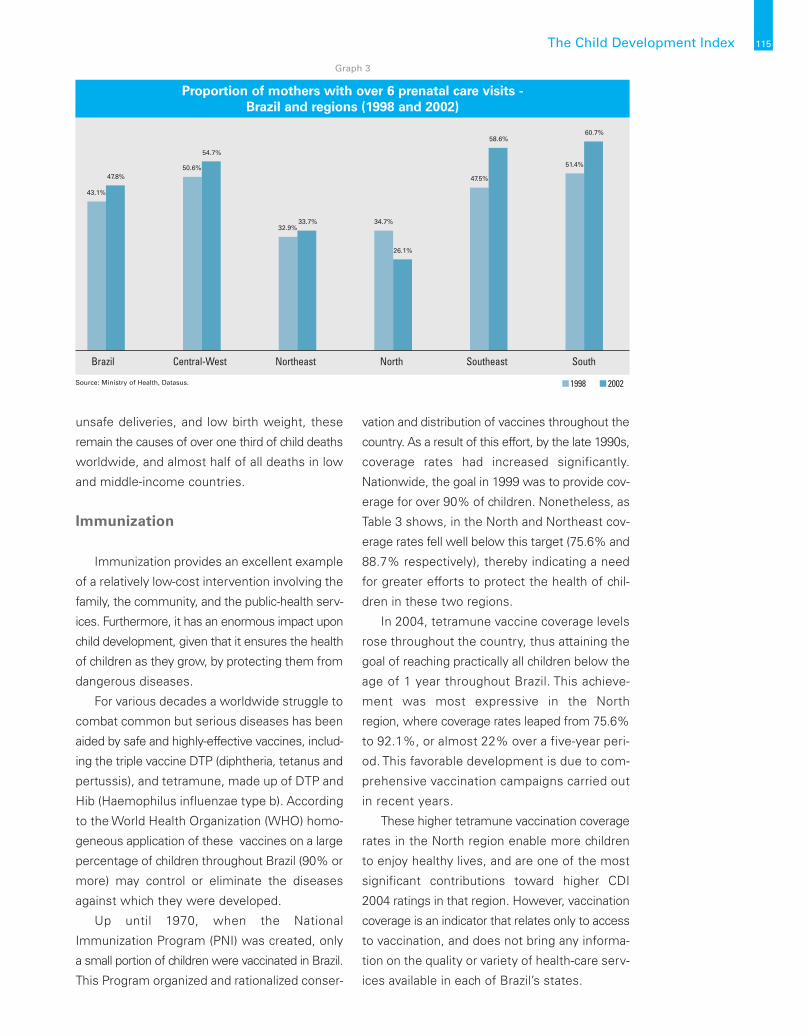
For Brazil as a whole, the percentage of expect-
ant mothers that receive adequate prenatal care
increased by 5.7 percentage points between 1998
and 2002, rising from 43.1% to 47.8%. The great-
est advances were recorded in the Southeast,
South and Central-West regions, whereas in the
Northeast the rate remained practically constant.
The most outstanding advances in prenatal care
coverage took place in the Southeast region,
where the increase was practically double that
observed in all other regions of Brazil over the
same period. In the North region, by contrast, there
was a substantial (8.6 percentage-point) decline
in services for expectant mothers.
It is probable that the decline in coverage in
the North and the failure to advance in the
Northeast can be attributed to weaknesses in the
provision of public-health services in these two
regions. The greater supply of public-health serv-
ices in the Southeast, South and Central-West,
where families with small children enjoy better
socioeconomic conditions and can, in many cas-
es, afford to seek prenatal care in private health
facilities, helps explain why prenatal coverage for
pregnant women in these regions is comparative-
ly better.
Unquestionably, a woman’s schooling level is
one of the factors that determines the likelihood
of her receiving adequate prenatal care. The more
years of schooling, the greater her awareness of
the health services to which she has a right (name-
ly: over six prenatal care sessions with a doctor
during the course of the pregnancy; all the nec-
essary tests; and access to all relevant informa-
tion) to ensure a tranquil pregnancy, delivery, and
postpartum.
Recent studies indicate that healthy child devel-
opment is intimately linked to the forming of a
strong bond between the mother and the child,
beginning during pregnancy and especially dur-
ing the first year of life. According to Winnicott
(1978), a baby does not exist alone, but is essen-
tially part of a relationship established early on,
during pregnancy. In the light of the perception
that formation of this bond is the key to devel-
opment of the individual, and in view of the knowl-
edge that such bonding begins during pregnan-
cy, proper prenatal care for mothers takes on
increasing importance.
Pregnancy comprises a period of physical
and psychological preparation that is often
accompanied by an array of sentiments that
imbue the mother with the strength needed
to adjust to her new role. Aside from aspects
of physical health, emotions are determining
factors for the well being of the expectant moth-
er. Pregnancy is a propitious period for conduct-
ing interventions aimed at preparing the
mother for delivery, for breastfeeding, for car-
ing for the child, as well as prevention and ear-
ly detection of problems.
To this end, it is important that the mother have
the necessary emotional strength and enjoy ready
support of the family, and of social-welfare, hos-
pital, and community-based services. Such a sup-
port network, targeted at protecting the moth-
er and providing a protective environment in which
to prepare for the baby’s arrival, needs to be iden-
tified, assessed, and enhanced. It is thus
important that more effective public-health pol-
icies be implemented in the North and Northeast,
since only a third of all mothers in these regions
attend the minimum recommended 6 prenatal
care visits.
Maternal and child health are still fraught by
serious and avoidable problems. Despite
progress achieved in combating such threats as
infectious childhood diseases, malnutrition,
The Child Development Index 115
unsafe deliveries, and low birth weight, these
remain the causes of over one third of child deaths
worldwide, and almost half of all deaths in low
and middle-income countries.
Immunization
Immunization provides an excellent example
of a relatively low-cost intervention involving the
family, the community, and the public-health serv-
ices. Furthermore, it has an enormous impact upon
child development, given that it ensures the health
of children as they grow, by protecting them from
dangerous diseases.
For various decades a worldwide struggle to
combat common but serious diseases has been
aided by safe and highly-effective vaccines, includ-
ing the triple vaccine DTP (diphtheria, tetanus and
pertussis), and tetramune, made up of DTP and
Hib (Haemophilus influenzae type b). According
to the World Health Organization (WHO) homo-
geneous application of these vaccines on a large
percentage of children throughout Brazil (90% or
more) may control or eliminate the diseases
against which they were developed.
Up until 1970, when the National
Immunization Program (PNI) was created, only
a small portion of children were vaccinated in Brazil.
This Program organized and rationalized conser-
vation and distribution of vaccines throughout the
country. As a result of this effort, by the late 1990s,
coverage rates had increased significantly.
Nationwide, the goal in 1999 was to provide cov-
erage for over 90% of children. Nonetheless, as
Table 3 shows, in the North and Northeast cov-
erage rates fell well below this target (75.6% and
88.7% respectively), thereby indicating a need
for greater efforts to protect the health of chil-
dren in these two regions.
In 2004, tetramune vaccine coverage levels
rose throughout the country, thus attaining the
goal of reaching practically all children below the
age of 1 year throughout Brazil. This achieve-
ment was most expressive in the North
region, where coverage rates leaped from 75.6%
to 92.1%, or almost 22% over a five-year peri-
od. This favorable development is due to com-
prehensive vaccination campaigns carried out
in recent years.
These higher tetramune vaccination coverage
rates in the North region enable more children
to enjoy healthy lives, and are one of the most
significant contributions toward higher CDI
2004 ratings in that region. However, vaccination
coverage is an indicator that relates only to access
to vaccination, and does not bring any informa-
tion on the quality or variety of health-care serv-
ices available in each of Brazil’s states.
Proportion of mothers with over 6 prenatal care visits - Brazil and regions (1998 and 2002)
Brazil Central-West Northeast North Southeast South
1998 2002Source: Ministry of Health, Datasus.
43.1%
34.7%32.9%
33.7%
47.5%
58.6%
51.4%
60.7%
50.6%
54.7%
26.1%
47.8%
Graph 3
CDI IN THE STATES
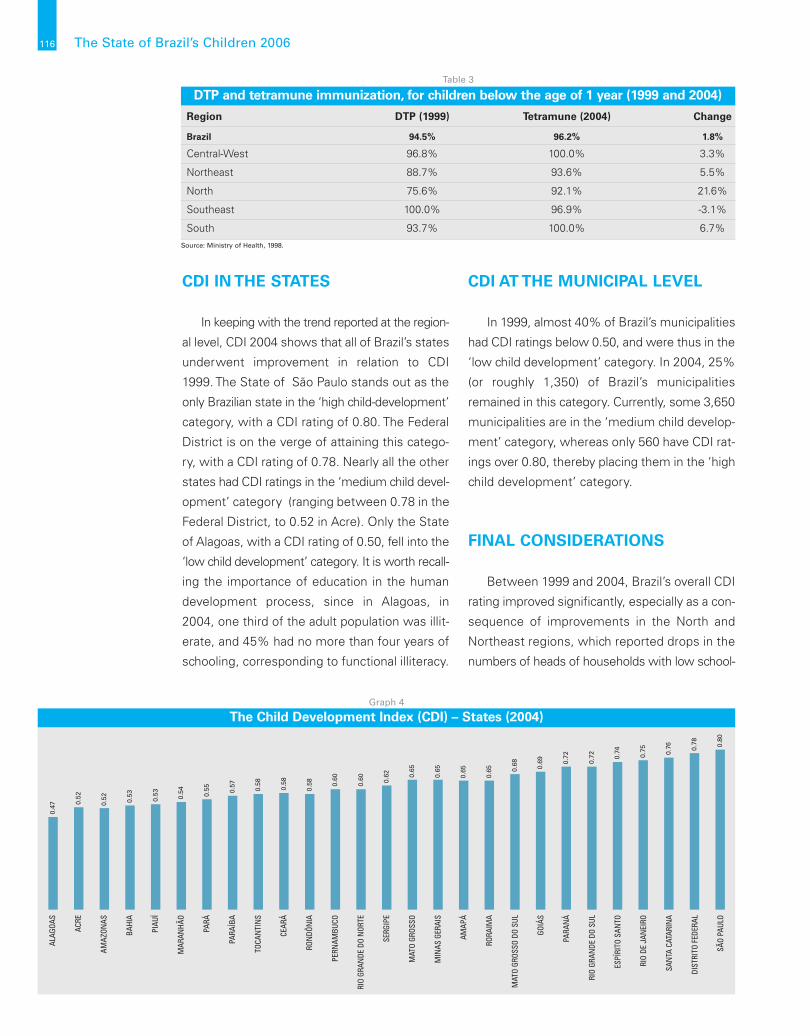
In keeping with the trend reported at the region-
al level, CDI 2004 shows that all of Brazil’s states
underwent improvement in relation to CDI
1999. The State of São Paulo stands out as the
only Brazilian state in the ‘high child-development’
category, with a CDI rating of 0.80. The Federal
District is on the verge of attaining this catego-
ry, with a CDI rating of 0.78. Nearly all the other
states had CDI ratings in the ‘medium child devel-
opment’ category (ranging between 0.78 in the
Federal District, to 0.52 in Acre). Only the State
of Alagoas, with a CDI rating of 0.50, fell into the
‘low child development’ category. It is worth recall-
ing the importance of education in the human
development process, since in Alagoas, in
2004, one third of the adult population was illit-
erate, and 45% had no more than four years of
schooling, corresponding to functional illiteracy.
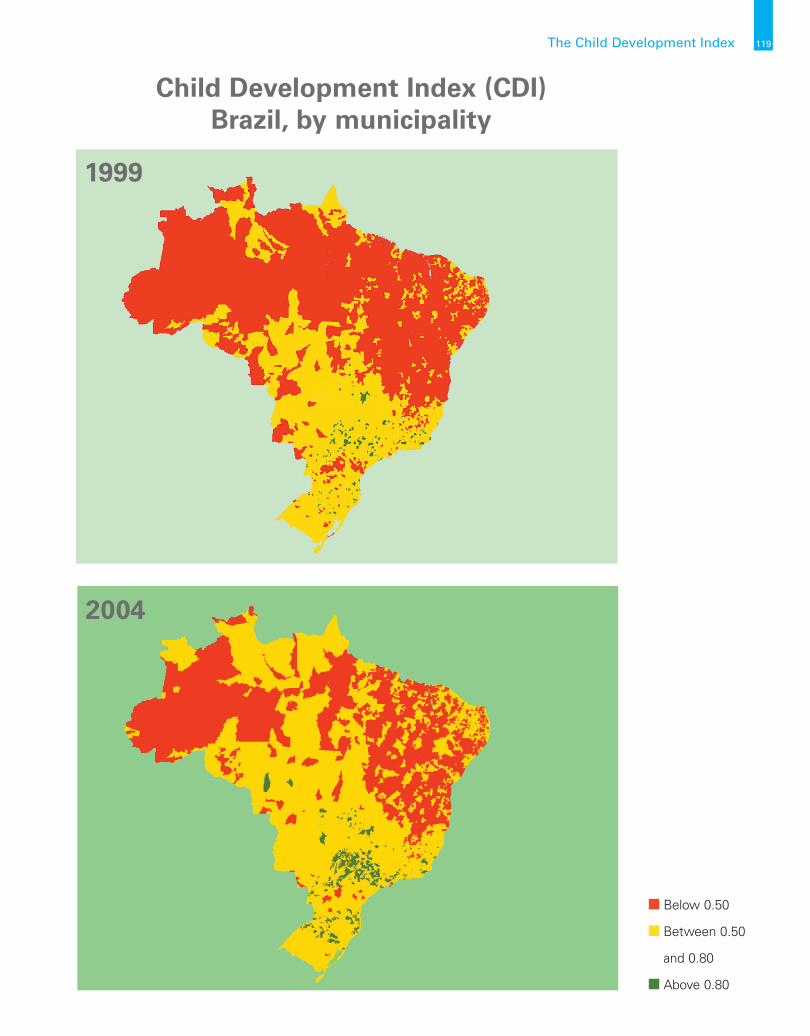
CDI AT THE MUNICIPAL LEVEL
In 1999, almost 40% of Brazil’s municipalities
had CDI ratings below 0.50, and were thus in the
‘low child development’ category. In 2004, 25%
(or roughly 1,350) of Brazil’s municipalities
remained in this category. Currently, some 3,650
municipalities are in the ‘medium child develop-
ment’ category, whereas only 560 have CDI rat-
ings over 0.80, thereby placing them in the ‘high
child development’ category.
FINAL CONSIDERATIONS
Between 1999 and 2004, Brazil’s overall CDI
rating improved significantly, especially as a con-
sequence of improvements in the North and
Northeast regions, which reported drops in the
numbers of heads of households with low school-
116 The State of Brazil’s Children 2006
Region DTP (1999) Tetramune (2004) Change
Brazil 94.5% 96.2% 1.8%
Central-West 96.8% 100.0% 3.3%
Northeast 88.7% 93.6% 5.5%
North 75.6% 92.1% 21.6%
Southeast 100.0% 96.9% -3.1%
South 93.7% 100.0% 6.7%Source: Ministry of Health, 1998.
Table 3
DTP and tetramune immunization, for children below the age of 1 year (1999 and 2004)
The Child Development Index (CDI) – States (2004)
ALAG
OAS
ACRE
AMAZ
ONAS
BAHI
A
PIAU
Í
MAR
ANHÃ
O
PARÁ
PARA
ÍBA
TOCA
NTI
NS
CEAR
Á
RON
DÔN
IA
PERN
AMBU
CO
RIO
GRAN
DE D
O N
ORTE
SERG
IPE
MAT
O GR
OSSO
MIN
AS G
ERAI
S
AMAP
Á
RORA
IMA
MAT
O GR
OSSO
DO
SUL
GOIÁ
S
PARA
NÁ
RIO
GRAN
DE D
O SU
L
ESPÍ
RITO
SAN
TO
RIO
DE J
ANEI
RO
SAN
TA C
ATAR
INA
DIST
RITO
FED
ERAL
SÃO
PAUL
O
0.47
0.52
0.52 0.53
0.53 0.54 0.55 0.57 0.58
0.58
0.58 0.
60
0.60 0.62 0.
65
0.65
0.65
0.65 0.
68 0.69 0.
72
0.72 0.
74
0.75 0.76 0.
78 0.80
Graph 4
ing levels, and increased tetramune vaccination
coverage.
Despite advances in the legal framework over
recent years, in the North and Northeast
regions, great challenges remain to be overcome.
Coverage of social-welfare and education serv-
ices for children up to the age of 6 years is far from
adequate for meeting the standards required by
Brazilian society.
The degree of well being and of vulnerabili-
ty of children is closely related to the schooling
levels of their parents, and to family purchasing
power. Thus, an analysis of the situation of chil-
dren must entail a socioeconomic assessment
of the situation of Brazilian families and of the
weaknesses of governmental initiatives aimed at
expanding the supply of places in schools and
improving healthcare services, especially in the
less developed regions, and for the children of the
poorest families..
The Child Development Index 117
118 The State of Brazil’s Children 2006
REFERENCES
BRASIL. Congresso Nacional. Constituição, 1988.
_____. Lei de Diretrizes e Bases da Educação Nacional. Lei nº 9.394/96. Diário Oficial [da República Federativa
do Brasil], Brasília, DF, v. 134, nº 248, Dec. 23rd, 1996.
_____. Ministério da Educação. Conselho Nacional de Educação. Câmara de Educação Básica. Report
nº 20, Dec. 2nd, 1998. http:// www.mec.gov.br/cne/pdf/CEB20_1998.pdf.
_____. Plano Nacional de Educação. Presented by Ivan Valente. Rio de Janeiro, DP&A, 2001.
DIDONET, Vital. “As crianças pré-escolares no Fundo”. PÁTIO: Revista Pedagógica, Educação Infantil,
nº 7, Porto Alegre, Artes Médicas Sul, Nov. 1998-Jan. 1999.
_____. A LDB e a Política da Educação Infantil. Brasília, DF, Assessoria Legislativa/Câmara dos Deputados,
July 1997.
IBGE. Pesquisa Nacional por Amostra de Domicílios, 1999 and 2004. Microdata.
IBGE. Síntese de Indicadores Sociais, 2004. Rio de Janeiro, IBGE, 2005.
KAPPEL, M. Dolores Bombardelli & CARVALHO, José Carmello Brás de. A Educação Fundamental:
O Censo Domiciliar de 1996 como Parâmetro para o Plano Nacional de Educação 1998-2007. Anais
da 21ª Reunião da Anped, Caxambu, Sept. 1998.
_____. As crianças de 0 a 6 anos nas estatísticas nacionais. Infância – Educação Infantil. Anais do Seminário
Internacional da Omep (Organização Mundial para Educação Pré-Escolar), Rio de Janeiro, Ravil Editora,
2000.
_____. As crianças de 0 a 6 anos no contexto sociodemográfico nacional. Onde Tudo Começa: a Criança
de 0 a 6 Anos. Anais do Pré-Congresso 2003 da Asbrei, Rio de Janeiro, Sept. 2003.
_____; AQUINO, Ligia M. Leitão de; VASCONCELLOS, Vera Maria R. de. Infância e Políticas de Educação
Infantil: Início do Século XXI. In: VASCONCELLOS, Vera Maria R. de (ed.). Educação da Infância: História
e Política. Rio de Janeiro, DP&A, 2005.
KRAMER, Sonia & KAPPEL, M. Dolores Bombardelli. Educação da Criança de 0 a 6 Anos. Pesquisa
sobre Padrões de Vida – 1996-1997: Primeira Infância, Rio de Janeiro, IBGE, 2000.
MEC/INEP/SEEC. Censo Escolar, 1999 and 2004.
NUNES, Deise G. Reconhecimento Social da Infância no Brasil: Da Menoridade à Cidadania. In: VAS-
CONCELLOS, Vera Maria R. de (ed.). Educação da Infância: História e Política. Rio de Janeiro, DP&A,
2005.
OMS/UNICEF. Proteção, Promoção e Apoio ao Aleitamento Materno: O Papel Especial dos Serviços
Materno-Infantis, 1989.
UNESCO. Educação e Cuidado na Primeira Infância: Grandes Desafios. Translated by Guilherme João
de Freitas Teixeira. Brasília, Unesco Brasil/OECD/Ministério da Saúde, 2002. 314 p.
UNICEF. Situação da Infância Brasileira, 2001.
WINNICOTT, D. W. Da Pediatria à Psicanálise: Textos Escolhidos. Rio de Janeiro, Francisco Alves, 1978.
The Child Development Index 119
Child Development Index (CDI)Brazil, by municipality
2004
1999
n Below 0.50
n Between 0.50
and 0.80
n Above 0.80
120 The State of Brazil’s Children 2006
• Percentage of children below the age of
6 years living with mothers that have low
schooling levels (ICMEP): defined as mothers with
less than four years of schooling, below which
level they are regarded as functionally illiterate.
Thus, the higher the percentage of children below
the age of 6 years whose mothers have low
schooling levels, the worse the classification of
the municipality in terms of child development.
Data were obtained from the Population Count
of 1996, and from the Population Census 2000,
both conducted by IBGE.
• Percentage of children below the age of
6 years whose fathers have low schooling lev-
els (ICPEP): although the schooling level of the
father is relatively less important than that of the
mother, in terms of care-giving and development
in the child’s early years, it is nonetheless a fac-
tor of extreme relevance. Since the years of school-
ing of the head of household determine, to a great
extent, the wage level and thus the family income,
by taking into account the schooling levels of both
parents, the CDI encompasses levels of consump-
tion of material goods available to the child with-
in the family environment. Data were obtained
from the Population Count of 1996, and from the
Population Census 2000, both conducted by IBGE.
• Vaccination coverage among children
below 1 year of age – DTP (1999) and tetramune
(2004) (ITetra, Idtp): these two indicators meas-
ure the percentage of children below 1 year of
age immunized against diphtheria, pertussis and
tetanus (DTP or triplex), against diphtheria, per-
tussis, tetanus, meningitis, and against other infec-
tions caused by Haemophilus influenzae type b
(tetramune or DTP+Hib). Vaccination coverage is
determined by dividing the number of children
below 1 year of age that were immunized, by the
total number of children in the same age group
over a given period of time. Aside from indicat-
ing lower or higher morbimortality as a conse-
quence of these diseases, vaccination coverage
also indirectly reflects access to other maternal
and child healthcare services. Obviously, since
this is a typical indicator of access and limited to
vaccination, it is not possible to draw inferences
as to the quality or variety of services available
in the municipality for this age group. Data on DTP
(1999) and tetramune (2004) coverage was pro-
vided by the Ministry of Health. In some cases
vaccination coverage is over 100%, because the
information relates to the numbers of doses, rath-
er than the number of children vaccinated. In cas-
es where the number of doses was greater than
100% of the estimated number of children, for
the purposes of calculating the index, 100% cov-
erage levels were considered.
• Percentage of mothers with adequate pre-
natal coverage (IPrenatal): measures the percent-
age of live births to mothers who underwent over
6 prenatal care sessions, from the time they
became aware that they were pregnant up until
delivery. This measure was set by the Pan-
American Health Organization (PAHO) and by the
Ministry of Health, with a view to ensuring that
mothers undergo the necessary testing (blood
and urine) to assess their condition and that of
the child, and to detect infections and immunize
the fetus against such diseases as neonatal tet-
anus. In view of the importance of prenatal care
for avoiding perinatal mortality (which accounts
for practically half of all infant mortality in Brazil)
and maternal deaths, this indicator, alongside vac-
cination coverage rates, is regarded as being of
extreme relevance for assessing the chances of
survival of children in their first year of life. This
percentage is obtained by taking the total num-
ber of live births to mothers that underwent over
6 prenatal care sessions, divided by the total num-
ber of live births over the period. This information,
obtained from the Department of Information and
Informatics of the Unified Health System
(Datasus), relates to 1998 and 2004.
• Gross preschool enrollment rates
(IPreschool): this indicator measures the percent-
age of children enrolled in (public or private) pre-
schools, regardless of age. It provides a good
approximation of the right of access of children
Composition of the CDI
The Child Development Index 121
to this level of schooling. By indicating wheth-
er the supply of places is sufficient to attend to
demand from the corresponding age group, this
rate makes it possible to assess how many stu-
dents are enrolled in schools that are inappro-
priate to their age. It is obtained by dividing the
number of students enrolled in preschools, by
the total number of children between the ages
of 4 and 6 years. Ideally, the index would con-
template net preschool enrollment rates, which
encompass only children in the age group for
which such schools are officially targeted, how-
ever, this information is not available for the munic-
ipal level. Like overall immunization coverage,
gross enrollment rates do not enable assessment
of the quality of education or of teaching prac-
tices. The figures relate to 1999 and 2004, and
were provided by the Education Statistics System
(Edudatabrasil) of the Anísio Teixeira National
Institute for Education Studies and Research
(INEP/MEC). It is important to note that this rate
does not include students in literacy programs,
since this modality of teaching is not regarded
as part of the regular schooling system. It is tar-
geted at children whose age should place them
in primary schooling, but who have not as yet
learned to read or write. Not including literacy
classes in the CDI is an incentive for reducing
this modality of teaching in favor of expanded
preschool coverage.
To combine the selected indicators into a sin-
gle unified index, it was necessary to express them
in comparable units. To this end, the values for each
indicator were normalized on a 0 to 1 scale, where
1 corresponds to the best condition of child devel-
opment, and 0 to the worst. For the purposes of
comparison and interpretation, this is the same
scale used to calculate the Human Development
Index (HDI).
• Percentage of children whose mothers
have low schooling levels: the most desirable
percentage is 0 (i.e., no child below the age of 6
years should have a mother with a low schooling
level). Municipalities that score or come close to
scoring this value will have an index equal or close
to 1. The minimum percentage is when 100% of
children have mothers with low schooling levels.
Municipalities in or close to this situation will have
an index equal or close to 0.
• Percentage of children whose fathers have
low schooling levels: the most desirable percent-
age is 0 (i.e., no child below the age of 6 years
should have a father with a low schooling level).
Municipalities that score or come close to scor-
ing this value will have an index equal or close to
1. The minimum percentage is when 100% of chil-
dren have fathers with low schooling levels.
Municipalities in or close to this situation will have
an index equal or close to 0.
• Vaccination coverage (DTP and DTP+Hib):
the most desirable percentage is 100 (i.e., all chil-
dren should be vaccinated with DTP and DTP+Hib).
Municipalities that score or come close to scoring
this value will have an index equal or close to 1. The
minimum percentage is when 0% of children are
vaccinated. Municipalities in or close to this situ-
ation will have an index equal or close to 0.
• Percentage of mothers with adequate pre-
natal care coverage: the most desirable percent-
age is 100 (i.e., all expectant mothers attend more
than six prenatal care sessions). The minimum per-
centage is when 0% of expectant mothers attend
more than six prenatal care sessions. The closer the
municipality is to the maximum or minimum score,
the closer to 1 or to 0 its classification on the CDI.
• Gross preschool enrollment rates: for this
indicator, the maximum or desired value is 100%
of children between the ages of 4 to 6 years enrolled
in this level of schooling. Thus, as in other cases,
the minimum level is 0%. The closer the munici-
pality is to the maximum or minimum value, the
closer either to 1 or to 0 its CDI rating will be.
Construction of the CDI
122 The State of Brazil’s Children 2006
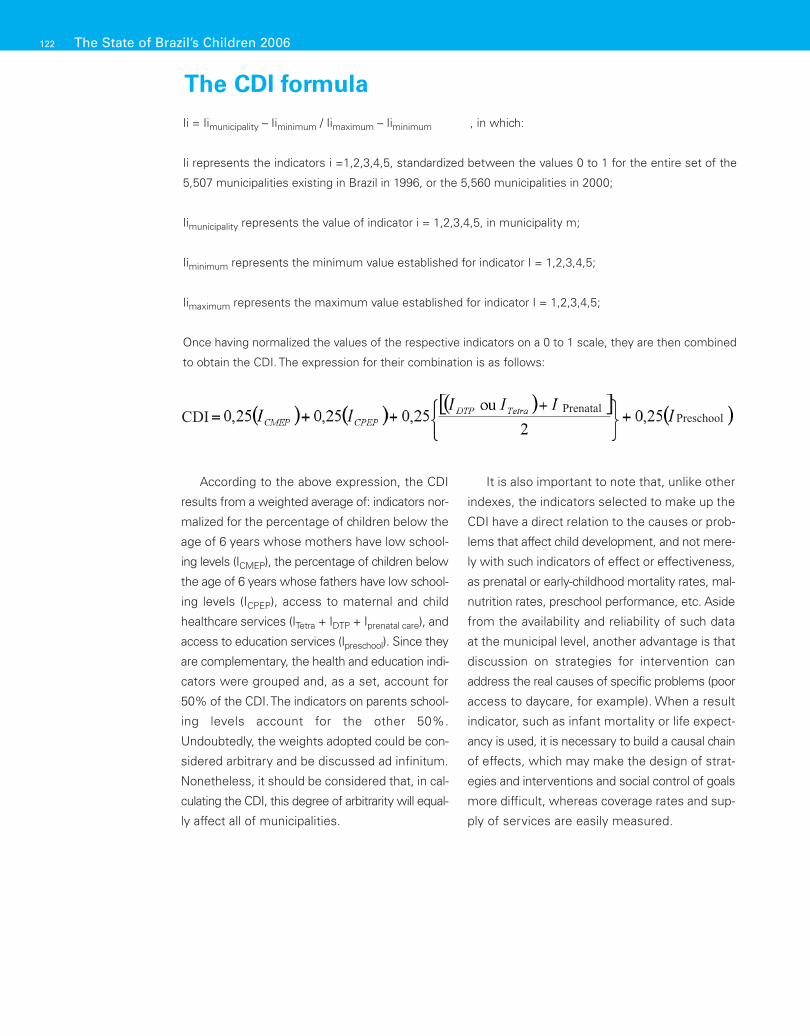
Ii = Iimunicipality – Iiminimum / Iimaximum – Iiminimum , in which:
Ii represents the indicators i =1,2,3,4,5, standardized between the values 0 to 1 for the entire set of the
5,507 municipalities existing in Brazil in 1996, or the 5,560 municipalities in 2000;
Iimunicipality represents the value of indicator i = 1,2,3,4,5, in municipality m;
Iiminimum represents the minimum value established for indicator I = 1,2,3,4,5;
Iimaximum represents the maximum value established for indicator I = 1,2,3,4,5;
Once having normalized the values of the respective indicators on a 0 to 1 scale, they are then combined
to obtain the CDI. The expression for their combination is as follows:
According to the above expression, the CDI
results from a weighted average of: indicators nor-
malized for the percentage of children below the
age of 6 years whose mothers have low school-
ing levels (ICMEP), the percentage of children below
the age of 6 years whose fathers have low school-
ing levels (ICPEP), access to maternal and child
healthcare services (ITetra + IDTP + Iprenatal care), and
access to education services (Ipreschool). Since they
are complementary, the health and education indi-
cators were grouped and, as a set, account for
50% of the CDI. The indicators on parents school-
ing levels account for the other 50%.
Undoubtedly, the weights adopted could be con-
sidered arbitrary and be discussed ad infinitum.
Nonetheless, it should be considered that, in cal-
culating the CDI, this degree of arbitrarity will equal-
ly affect all of municipalities.
It is also important to note that, unlike other
indexes, the indicators selected to make up the
CDI have a direct relation to the causes or prob-
lems that affect child development, and not mere-
ly with such indicators of effect or effectiveness,
as prenatal or early-childhood mortality rates, mal-
nutrition rates, preschool performance, etc. Aside
from the availability and reliability of such data
at the municipal level, another advantage is that
discussion on strategies for intervention can
address the real causes of specific problems (poor
access to daycare, for example). When a result
indicator, such as infant mortality or life expect-
ancy is used, it is necessary to build a causal chain
of effects, which may make the design of strat-
egies and interventions and social control of goals
more difficult, whereas coverage rates and sup-
ply of services are easily measured.
The CDI formula
PreschoolPrenatalCDI
The Child Development Index 123
Interpretation and use of the CDI• The CDI rating of a municipality ranges from 0
to 1, with 1 being the maximum value a munic-
ipality can aspire to in the quest to ensure sur-
vival, growth, and development for children in
early childhood. The difference between the CDI
of a given municipality and 1 indicates the chal-
lenges that must be met in order to reach these
goals. A municipality with the maximum score
reflects a situation in which all children below the
age of 6 years live with parents that have over
4 years of schooling; the rights of mothers and
children to basic healthcare are fulfilled; and the
right to attend preschools is ensured.
• For the purposes of comparison and rating of
municipalities, the same classifications used for
HDI apply, i.e., CDI above 0.800 = high child devel-
opment; between 0.500 and 0.799 = medium child
development; and below 0.500 = low child devel-
opment.
• The CDI should be interpreted alongside the indi-
cators from which it is constructed. Since the
CDI is a weighted average, it may conceal dis-
parities, either among indicators or within a giv-
en indicator. For example, if the percentage of
mothers that lack adequate prenatal coverage
is high, it then becomes necessary to identify
the groups most affected, their location, and size.
Such identification will enable placing a focus upon
the most vulnerable groups, the design of strat-
egies for intervention, and estimation of the cost
of resolving the problem. In line with the prin-
ciple of non-discrimination, fulfillment of rights
can not be compromised by differentiation, exclu-
sion, restriction, or preferences based on race,
gender, color, origin, socioeconomic status, polit-
ical preference, ethnicity, or disability. It is thus
important that the indicators that comprise the
CDI be analyzed and broken down, taking into
account such factors as gender, geographic area,
ethnic origin, and socioeconomic group.
• Analyses of the indicators that comprise the CDI
must be conducted from a holistic and non-sec-
toral standpoint. In line with the principle of indi-
visibility, the Convention on the Rights of the Child
and the Statute of the Child and Adolescent set
no hierarchy of rights, meaning that all rights are
interrelated, and that each is equally important
for the fundamental dignity of the child. The CDI
and its indicators are a starting point for an inte-
grated analysis of the problems afflicting early child-
hood, taking into account the nature of this phase
of the child’s development within the lifecycle.
Such analyses, and the strategies proposed, should
be multidisciplinary and multi-sectoral, and
must take into account the physical, cognitive,
and affective dimensions of the child in early child-
hood, within the family and community environ-
ments. From a planning standpoint, this does not
necessarily mean that all rights can be secured
at the same time. It is necessary to set priorities,
bearing in mind the main threats to child devel-
opment, and the opportunities for ensuring such
rights.
• The mobilizing effect of the CDI, and of the sub-
sequent design of strategies for promoting ear-
ly-childhood welfare and education, ought to involve
great numbers of social players, with a view to
generating programs with high degrees of par-
ticipation, especially on the part of mothers and
fathers, entire families, communities, and gov-
ernmental and non-governmental organizations.
Such popular participation is essential for reach-
ing an overall consensus as to the best
approaches to problems, and for enabling the
design of interventions and solutions that are
appropriate, effective, and sustainable.
Aside from providing support in the setting of pri-
orities for state and/or federal level programs, the
CDI may also serve to identify successful initiatives
in municipalities with higher ratings. Identification,
evaluation, documentation, and dissemination of
such successful experiences can provide essen-
tial inputs for the design of long-range comprehen-
sive public policies.