Embed Size (px)
Citation preview
Proceedings of the
10th Mountain Lion Workshop Cougars: Conservation, Connectivity and Population Management
Sanctioned by: Western Association of Fish and Wildlife Agencies (WAFWA)
WAFWA Agency Host:
Montana Fish, Wildlife & Parks Workshop Co-Host:
Wild Felid Research and Management Association (WFA)
Editors: Jim Williams, Montana Fish, Wildlife & Parks
Hugh Robinson, Panthera Linda Sweanor, WFA
2
Workshop Organizing Committee:
Jim Williams
Caryn Amacher Linda Sweanor Hugh Robinson
Jay Kolbe Howard Quigley Jay Tischendorf
Claire Gower Tonya Chilton
Workshop Sponsors:
Felidae Fund
Patagonia Inc. Panthera
Wildlife Conservation Society Telonics
Vectronics Lotek
Cougar Rewilding Foundation American Ecologocial Research Institute
University of Montana Wildlife Cooperative Unit Montana State University Fish and Wildlife Ecology and Management Program
SUGGESTED CITATION Complete volume:
3
SUGGESTED CITATION Complete volume: Williams, J., H. Robinson, and L. Sweanor, editors. 2011. Proceedings of the 10th Mountain Lion Workshop. May 2-5, 2011. Bozeman, Montana, USA. Individual article: Author’s name(s). 2011. Title of article or abstract. Pages 00-00 in Williams, J., H. Robinson, and L. Sweanor, editors. Proceedings of the 10th Mountain Lion Workshop. May 2-5, 2011. Bozeman, Montana, USA.
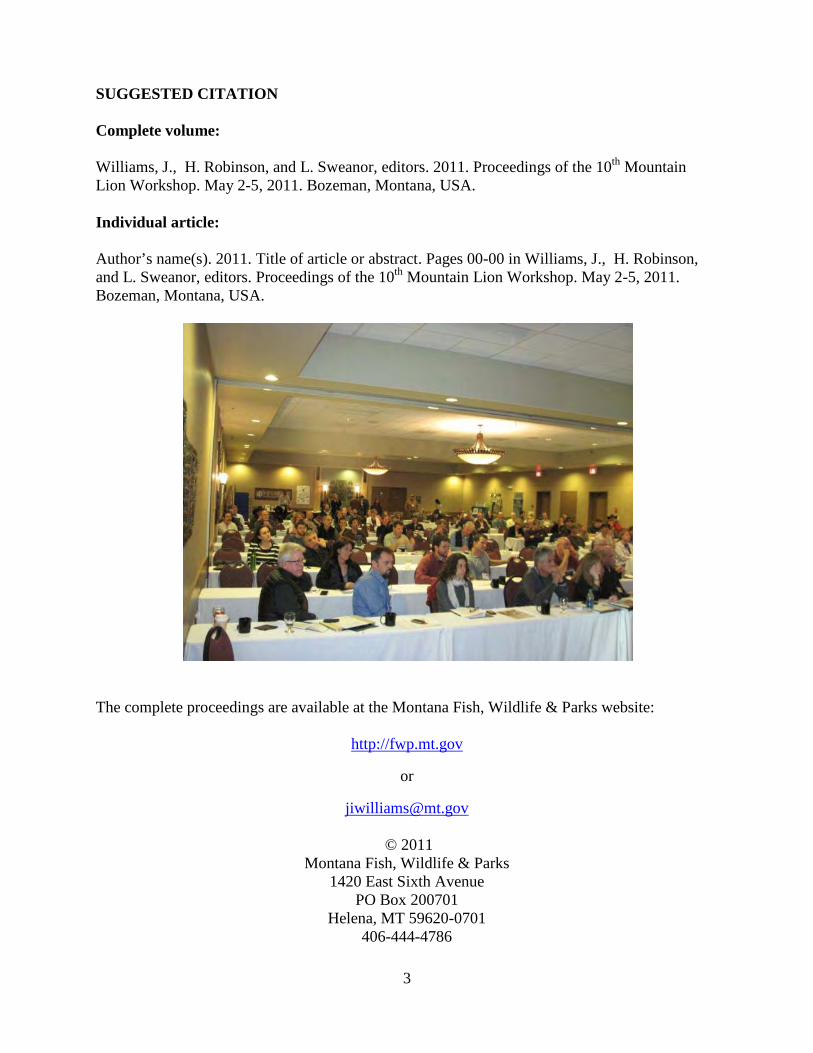
The complete proceedings are available at the Montana Fish, Wildlife & Parks website:
http://fwp.mt.gov
or
© 2011 Montana Fish, Wildlife & Parks
1420 East Sixth Avenue PO Box 200701
Helena, MT 59620-0701 406-444-4786
4
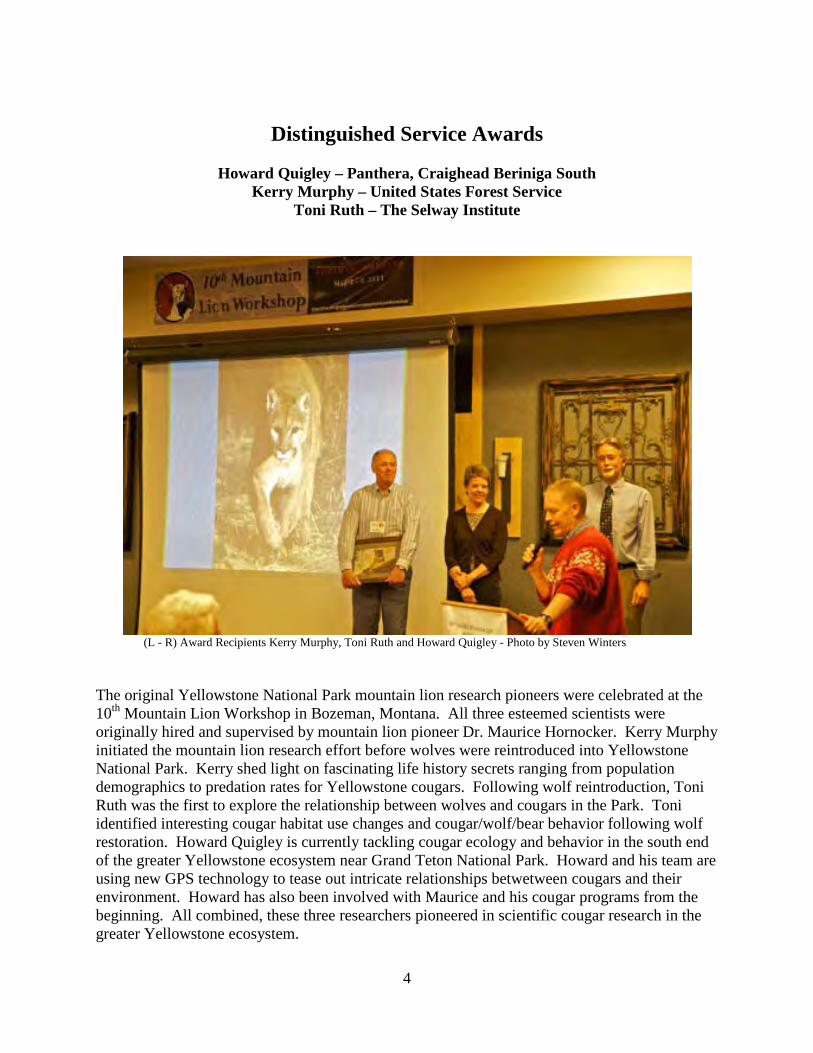
Distinguished Service Awards
Howard Quigley – Panthera, Craighead Beriniga South Kerry Murphy – United States Forest Service
Toni Ruth – The Selway Institute
(L - R) Award Recipients Kerry Murphy, Toni Ruth and Howard Quigley - Photo by Steven Winters
The original Yellowstone National Park mountain lion research pioneers were celebrated at the 10th Mountain Lion Workshop in Bozeman, Montana. All three esteemed scientists were originally hired and supervised by mountain lion pioneer Dr. Maurice Hornocker. Kerry Murphy initiated the mountain lion research effort before wolves were reintroduced into Yellowstone National Park. Kerry shed light on fascinating life history secrets ranging from population demographics to predation rates for Yellowstone cougars. Following wolf reintroduction, Toni Ruth was the first to explore the relationship between wolves and cougars in the Park. Toni identified interesting cougar habitat use changes and cougar/wolf/bear behavior following wolf restoration. Howard Quigley is currently tackling cougar ecology and behavior in the south end of the greater Yellowstone ecosystem near Grand Teton National Park. Howard and his team are using new GPS technology to tease out intricate relationships betwetween cougars and their environment. Howard has also been involved with Maurice and his cougar programs from the beginning. All combined, these three researchers pioneered in scientific cougar research in the greater Yellowstone ecosystem.
5
Preface
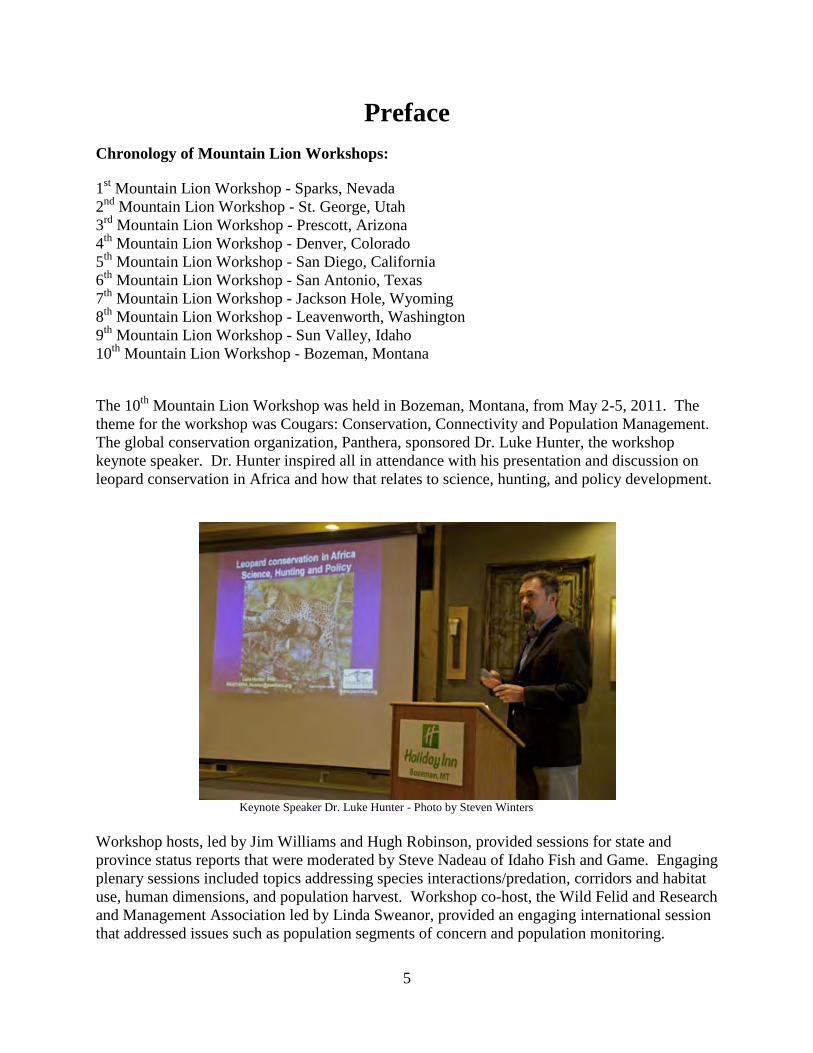
Chronology of Mountain Lion Workshops: 1st Mountain Lion Workshop - Sparks, Nevada 2nd Mountain Lion Workshop - St. George, Utah 3rd Mountain Lion Workshop - Prescott, Arizona 4th Mountain Lion Workshop - Denver, Colorado 5th Mountain Lion Workshop - San Diego, California 6th Mountain Lion Workshop - San Antonio, Texas 7th Mountain Lion Workshop - Jackson Hole, Wyoming 8th Mountain Lion Workshop - Leavenworth, Washington 9th Mountain Lion Workshop - Sun Valley, Idaho 10th Mountain Lion Workshop - Bozeman, Montana The 10th Mountain Lion Workshop was held in Bozeman, Montana, from May 2-5, 2011. The theme for the workshop was Cougars: Conservation, Connectivity and Population Management. The global conservation organization, Panthera, sponsored Dr. Luke Hunter, the workshop keynote speaker. Dr. Hunter inspired all in attendance with his presentation and discussion on leopard conservation in Africa and how that relates to science, hunting, and policy development.
Keynote Speaker Dr. Luke Hunter - Photo by Steven Winters
Workshop hosts, led by Jim Williams and Hugh Robinson, provided sessions for state and province status reports that were moderated by Steve Nadeau of Idaho Fish and Game. Engaging plenary sessions included topics addressing species interactions/predation, corridors and habitat use, human dimensions, and population harvest. Workshop co-host, the Wild Felid and Research and Management Association led by Linda Sweanor, provided an engaging international session that addressed issues such as population segments of concern and population monitoring.
6
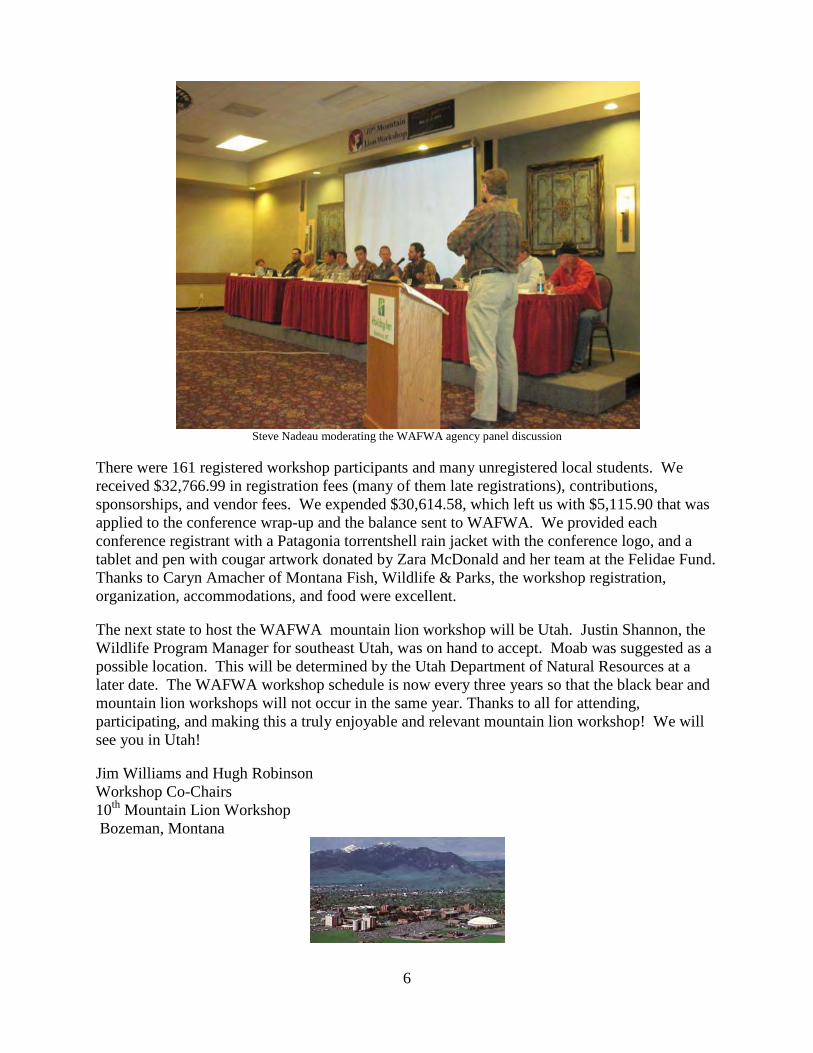
Steve Nadeau moderating the WAFWA agency panel discussion
There were 161 registered workshop participants and many unregistered local students. We received $32,766.99 in registration fees (many of them late registrations), contributions, sponsorships, and vendor fees. We expended $30,614.58, which left us with $5,115.90 that was applied to the conference wrap-up and the balance sent to WAFWA. We provided each conference registrant with a Patagonia torrentshell rain jacket with the conference logo, and a tablet and pen with cougar artwork donated by Zara McDonald and her team at the Felidae Fund. Thanks to Caryn Amacher of Montana Fish, Wildlife & Parks, the workshop registration, organization, accommodations, and food were excellent. The next state to host the WAFWA mountain lion workshop will be Utah. Justin Shannon, the Wildlife Program Manager for southeast Utah, was on hand to accept. Moab was suggested as a possible location. This will be determined by the Utah Department of Natural Resources at a later date. The WAFWA workshop schedule is now every three years so that the black bear and mountain lion workshops will not occur in the same year. Thanks to all for attending, participating, and making this a truly enjoyable and relevant mountain lion workshop! We will see you in Utah! Jim Williams and Hugh Robinson Workshop Co-Chairs 10th Mountain Lion Workshop Bozeman, Montana
7
THE 10TH MOUNTAIN LION WORKSHOP Agenda
Tuesday, May 3 8:30 Welcome – Jim Williams (Montana Fish Wildlife & Parks) and Don Clark
(Houndsman and Libby Rod and Gun Club) 9:00 Keynote – Dr. Luke Hunter (Panthera) 10:00 Break Plenary Session 1 – State and Provincial Presentations Session Chair: Jim Williams (Montana Fish, Wildlife & Parks) Only presenting author listed; see abstract for full authorship. 10:15 Montana – Montana mountain lion status report
Quentin Kujala (Montana Fish Wildlife & Parks) 10:30 Utah – Utah mountain lion status report
Kevin Bunnel (Utah Division of Wildlife Resources) 10:45 New Mexico – New Mexico mountain lion status report
Frederic S. Winslow (New Mexico Department of Game and Fish) 11:00 Nevada – Nevada mountain lion status report
Carl Lackey (Nevada Department of Wildlife) 11:15 Idaho – Idaho mountain lion status report
Craig White (Idaho Department of Fish and Game) 11:30 Alberta – Managing an expanding cougar population in Alberta
Nathan Webb (Alberta Sustainable Resource Development)
11:45 Lunch 1:00 Arizona – Arizona mountain lion status report Ronald L. Day Jr. (Arizona Game and Fish Department) 1:15 Washington – Washington mountain lion status report
Richard A. Beausoleil (Washington Department of Fish and Wildlife)
1:30 Florida – Managing Florida panther depredations: implications for continued recovery Mark A. Lotz (Florida Fish and Wildlife Conservation Commission)
8
1:45 Wyoming – Discussions on source/sink/stable population management of cougars in Wyoming Daniel J. Thompson (Wyoming Game and Fish Department)
2:00 State Panel Discussion – Predator control and other management issues Moderator: Steve Nadeau (Idaho Fish and Game)
2:50 Break Plenary Session 2 – Species Interactions/Predation Session Chair: Dr. Mike Mitchell (Montana Cooperative Wildlife Research Unit) Only presenting author listed; see abstract for full authorship. 3:10 Cougar presence influences diet optimization in ungulate prey
David M. Choate (School of Life Sciences, University of Nevada, Las Vegas) 3:30 Inter- and intraspecific competition in a large carnivore guild
Nathan F. Webb (Alberta Sustainable Resource Development) 3:50 Cougar prey composition and predation rates in a multi-prey community in
northeast Oregon – preliminary results Darren A. Clark (Oregon Cooperative Fish and Wildlife Research Unit, Oregon State University)
4:10 Cougar prey composition and predation rates in Central Utah
Dustin L. Mitchell (Department of Wildland Resources, Utah State University) 4:30 Sex matters: dietary strategies of male and female cougars on the southern
Colorado Plateau Brandon Holton (U.S. National Park Service, Grand Canyon National Park, Science and Resource Management)
4:50 Prey switching, specialization, and multi-species functional response in
cougars: implications for small populations of alternate prey Kyle H. Knopff (Golder Associates Ltd., Calgary, Alberta)
Plenary Session 3 – Social/Poster Session Posters to be posted the entire conference. This evening’s presenters in attendance 6:00-7:00. Wednesday, May 4 Plenary Session 4 – WFA Population Segments of Concern Session Chair: Melanie Culver (Arizona Cooperative Fish & Wildlife Research Unit) Only presenting author listed; see abstract for full authorship. 8:15 Jaguars in peril: the next 100 years

9
Rodrigo A. Medellin (Arizona-Sonora Desert Museum and Instituto de Ecología, Universidad Nacional Autónoma de México)
8:30 Vulnerability of the ocelot populations in the United States
Michael E. Tewes (Caesar Kleberg Wildlife Research Institute, Texas A&M University)
8:45 Don’t eat the shrimp
Jim Sanderson (Small Cat Conservation Alliance, and University of Arizona Wild Cat Center, School of Natural Resources and the Environment)
9:00 Collateral impacts of increasing Florida panther numbers: dealing with
unintended consequences Darrell Land (Florida Fish and Wildlife Conservation Commission)
9:15 Demographic history of mountain lion in Texas: a genetic evaluation
Joseph D. Holbrook (Caesar Kleberg Wildlife Research Institute, Texas A&M University)
9:30 Panel Q&A 10:05 Break Plenary Session 5 – WFA Population Monitoring Session Chair: Linda Sweanor (WFA President) Only presenting author listed; see abstract for full authorship. 10:25 The Puma as an Umbrella Species for Conserving Western Hemisphere
Carnivores Christopher L. Burdett (Colorado State University, Department of Fish, Wildlife,
and Conservation Biology) 10:40 Pilot study on scat detection dogs for cougar population estimation
Gregory A. Davidson (Oregon Department of Fish & Wildlife) 10:55 Noninvasive tracking of jaguars (Panthera onca) and co-occurring feline
species in Belize by genotyping feces and remote camera trapping Claudia Wultsch (Department of Fisheries and Wildlife Sciences, Virginia Tech) 11:10 Estimating detection probability for Canada lynx using snow-track surveys in
the Northern Rocky Mountains John R. Squires (U.S. Forest Service, Rocky Mountain Research Station)
11:25 Estimating mountain lion density with motion-activated cameras using mark-resight Jesse Lewis (Department of Fish, Wildlife, and Conservation Biology, Colorado State University)
11:40 Panel Q&A
10
12:10 Lunch Plenary Session 6 – Corridors, Habitat Use, and the Urban Interface Session Chair: Justin Gude (Montana Fish, Wildlife & Parks) Only presenting author listed; see abstract for full authorship. 1:10 Functional connectivity for pumas (Puma concolor) in central Mexico
Zaira Y. González-Saucedo (Universidad Autónoma de Querétaro, Facultad de Ciencias Naturales, Posgrado en Ciencias de los Recursos Bióticos)
1:30 Mountain lion (Puma concolor) population status, and biological corridors in
Sierra San Luis, Sonora México Alejandro González-Bernal (Naturalia A.C. Av. 32 entre calle 3 y 4 Agua Prieta, Sonora, México)
1:50 Habitat use of pumas during dispersal in the central rocky mountains Jesse R. Newby (Teton Cougar Project, P.O. Box 34 Kelly, WY, 83011, USA)
2:10 Panther habitat characteristics and distribution in Southern Florida
Robert A. Frakes (U.S. Fish and Wildlife Service, South Florida Ecological Services Office)
2:30 Modeling Cougar Resource Selection Over Multiple Scales and Behaviors
Wendy R. Rieth (Department of Wildland Resources, Utah State University) 2:50 Break Plenary Session 7 – Corridors, Habitat Use, and the Urban Interface (cont.) Session Chair: Rich DeSimone (Montana Fish Wildlife & Parks, retired) Only presenting author listed; see abstract for full authorship. 3:10 Linking resource selection and mortality modeling for population estimation of
mountain lions in Montana Hugh S. Robinson (Montana Cooperative Wildlife Research Unit, University of Montana)
3:30 Direct and indirect effects of predators on an endangered species: testing
predictions of the apparent competition hypothesis Mark Hebblewhite (Wildlife Biology Program, College of Forestry and Conservation, University of Montana)
3:50 Understanding the conservation needs of mountain lions in an urban southern
California landscape Jeff A. Sikich (Santa Monica Mountains National Recreation Area)
4:10 Effects of residential development on cougar spatial ecology in Washington
Brian N. Kertson (School of Forest Resources, University of Washington)

11
4:30 Cougars in the backyard: large carnivore conservation in developing landscapes Aliah Adams Knopff (Talus Environmental Consulting, 127 Silver Valley Rise NW, Calgary, AB, Canada)
4:50 Cougar behavioral response to anthropogenic activities and landscapes: evidence of ambivalence? David C. Stoner (Utah State University, Department of Wildland Resources)
5:10 Conservation Conflicts and Management Decisions: the Puma and the Huemul
Deer in Patagonia Park, Chile Cristian Saucedo (Conservacion Patagonica, Patagonia Park, Cochrane, Chile)
6:00 Social 7:00 Banquet Presentation: A Yellowstone Mountain Lion Research Celebration Toni Ruth Kerry Murphy Howard Quigley Thursday, May 5 Plenary Session 8 – Human Dimensions Session Chair: Rod Bullis (Bitterroot Houndsman Association) Only presenting author listed; see abstract for full authorship. 8:30 Florida Gulf Coast University promotes Florida panther conservation through
a unique environmental education program Ricky Pires (Director/FGCU “Wings of Hope” Environmental Education Program)
8:50 The feasibility of the Northeastern U.S. supporting the return of cougars (Puma
concolor) John W. Laundré (Department of Biological Sciences, SUNY Oswego)
9:10 An explanation of cougar-related behaviors and behavioral intentions among northern Arizona residents David J. Mattson (U.S. Geological Survey (USGS) Southwest Biological Science Center, Northern Arizona University)
9:30 Mountain lion policy process in three states – an advocate’s viewpoint
Wendy Keefover (WildEarth Guardians, P.O. Box 1471, Broomfield, CO) 9:50 The discourses of incidents: cougars on Mt. Elden and in Sabino Canyon,
Arizona David J. Mattson (U.S. Geological Survey (USGS) Southwest Biological Science Center, Northern Arizona University)
12
10:10 Break Plenary Session 9 – Harvest Session Chair: Hugh Robinson (Montana Cooperative Wildlife Research Unit) Only presenting author listed; see abstract for full authorship. 10:30 Assessing selectivity and harvest composition of cougar hunters in Wyoming
Daniel J. Thompson (Wyoming Game and Fish Department) 10:50 Landscape context influences spatial population dynamics: pumas under
varying levels of human-induced mortality Jesse R. Newby (Teton Cougar Project, P.O. Box 34 Kelly, WY)
11:10 Mountain lions of the Great Basin: identification of source-sink dynamics
using Bayesian genetic techniques Alyson M. Andreasen (Program in Ecology, Evolution and Conservation Biology,
University of Nevada) 11:30 Beyond cougar source-sink management: distributing hunt effort to preserve
social stability Richard A. Beausoleil (Washington Department of Fish and Wildlife)
11:50 Comparison of cougar survival and mortality patterns in exploited and quasi-
protected population Michael L. Wolfe (Department of Wildland Resources, Utah State University)
12:10 Effects of sport hunting on cougar population, community, and landscape
ecology Robert B. Wielgus (Large Carnivore Conservation Lab, Department of Natural Resource Sciences, Washington State University)
12:30 Closing Remarks – Jim Williams, Linda Sweanor, and Hugh Robinson
13
Session 1:
State and Provincial Presentations
Proceedings of the 10th Mountain Lion Workshop
Cougars: Conservation, Connectivity and Population Management
Session 1: State and Provincial Presentations
14
Montana Mountain Lion Status Report Quentin Kujala, Montana Fish, Wildlife & Parks, 1420 East Sixth Avenue, Helena, Montana
59620-0701 (presenter) Abstract: Montana has a goal of maintaining a reasoned diversity of mountain lion objectives across Montana’s different habitats and associated tolerance levels for mountain lions. Fundamentally, different mountain lion objectives are primarily achieved through adjusted female harvest. A spectrum of lion habitat and human tolerance for mountain lions runs in a “decreasing” continuum from west to east. Northwest Montana as functionally represented by Region 1 and portions of Region 2 has significant public landownership, traditional lion habitat/prey densities and a long-established history/public advocacy for lions and lion hunting. Far eastern Montana has less public land, more open environments with typically lower prey densities and a generally smaller (but present and growing) advocacy for lions and lion hunting. These circumstances describe parts or all of Regions 5, 6 and 7. Between these two ends lie Regions 3 and 4 where the variables of landownership, habitat, prey, and public advocacy mix and transition from one “extreme” to the other. While management objectives often vary across these physical and human landscapes, fundamental management strategies relative to female harvest do not. That is, higher or lower mountain lion objectives are commonly achieved through higher or lower female lion harvest.
In addition to the varying objectives influenced by diverse habitats and other landscape features, population status also influences female lion harvest. Perhaps not surprisingly, Montana exhibits a spectrum of population status levels. Generally speaking, the preponderance of evidence from Region 1 and 2 suggests robust mountain lion populations from both the human tolerance and historical perspectives. Recognizing that special licenses to date suggest a harvest focus on male lions, the region is maintaining (and adjusting with this permit setting process where necessary) female subquotas equal to approximately 20% of the total number of limited licenses. Region 3 in southwest Montana is in part responding from recent history that included higher lion harvest influenced by higher lion populations and public interest in additional lion harvest beyond traditional houndsmen inputs in the late 1990’s. Management questions of prey amounts and wolf interactions are also present in some cases. Regional management actions currently include conservative female harvest intended to rebound some population levels to a point higher than present but yet below previous highs. Not surprisingly, Regions 4, 5, 6 and 7 exhibit a higher tolerance/prescription for female harvest reflecting relatively lower lion objectives. Like Region 1, these regions generally exhibit stability with respect to recent harvest and quota levels—albeit with lower objectives.
Session 1: State and Provincial Presentations
15
Utah Mountain Lion Status Report Justin M. Shannon, Utah Division of Wildlife Resources, 319 North Carbonville Road, Suite A,
Price, UT 84501 (presenter) Kevin D. Bunnell, Utah Division of Wildlife Resources, 1594 W. North Temple, Salt Lake City,
UT 84114, USA. Abstract: Mountain lions have been managed as a protected game species in Utah since 1967. In 2009 the Division of Wildlife Resources completed the Utah Cougar Management Plan v2, developed with the assistance of a public-based Cougar Advisory Group which will guide management of cougars through 2021. Cougar harvest is managed under harvest objective (quota), limited entry and hybrid “split” strategies. The Division manages to sustain cougar densities on all management units except those that have approved predator management plans, where cougar harvests are increased to reduce cougar numbers and predation on big game. Under the revised management plan cougar permits / quotas are determined at an eco-region scale, based primarily on the proportion of adult females (> 3 years old) in the harvest over a 3-year period. Permits / quotas are then distributed to individual hunting units. Cougar harvest has ranged from 287 to 448 annually since the 2000-2001 season. Both hunting and pursuit seasons run from mid-November through June 1, although some units have extended seasons. Harvest management continues to improve with better understanding of cougar movements, dispersal, harvest impacts and population recovery time, particularly between lightly hunted and heavily harvested cougar populations, based on research being conducted in cooperation with Utah State University. All cougar complaints are handled under the guidance of a Nuisance Cougar Complaints policy. Most cougar conflicts are handled through lethal control.
Session 1: State and Provincial Presentations
16
New Mexico Mountain Lion Status Report Frederic S. Winslow, New Mexico Department of Game and Fish, P.O. Box 25112, Santa Fe,
NM 87504 (presenter) Abstract: Cougar (Puma concolor) management in New Mexico has changed from non-protection through the early 1970’s to Zone Management since the late ‘90’s. The current harvest strategy is to manage for stable or reduced cougar populations in areas with important ungulate resources, primarily desert bighorn sheep, and in areas with high or potentially high human conflict. The balance of the state is managed for increasing populations. Cougar harvest limits have historically been met in the northern cougar zones in New Mexico and rarely met in the south. Harvest limits in most of New Mexico are based upon sustainable levels of harvest to the population as a whole and protection of the breeding segment of the population. The maximum zone harvest limits are not quotas to be met.
Session 1: State and Provincial Presentations
17
Nevada Mountain Lion Status Report Carl W. Lackey, Western Region Predator and Furbearer Biologist, Nevada Department of
Wildlife, P.O. Box 277, Genoa, NV 89411, USA, [email protected] (presenter) Russell Woolstenhulme, Furbearer and Waterfowl Staff Specialist, Nevada Department of Wildlife, 1100 Valley Road, Reno, NV 89512, USA Abstract: Mountain lion management in Nevada and throughout the West is not without its controversy. Predator control, as it relates to cougars is a common topic at most public meeting’s when discussions include ungulate population declines and cougar biology. Wildlife managers, tasked with keeping up with constantly changing attitudes and policies regarding predator management have faced many challenges in the last several years. In Nevada the process has resulted in regulations that have often evolved based on input from non-wildlife professionals. Most of these regulatory changes have been made with the goal of reducing statewide cougar abundance and density by increasing harvest. Overall these changes have not had a significant effect on statewide lion harvest. Additionally, predator management projects that focus solely on predator removal have also been implemented. This report will summarize these topics as well as developments in cougar research that have taken place in Nevada since the 9th Mountain Lion Workshop in 2008.
HARVEST & REGULATION HISTORY
Cougars have been a protected game mammal in Nevada since 1965. Since that time changes to
the season structure and harvest regulations have been frequent, including; modification to
season lengths, changes in harvest objectives, requirement of tags, and altering of hunt unit
boundaries to affect hunter distribution. In 1997 particularly, several regulatory changes were
made with the intent of substantially increasing statewide cougar harvest. These changes
included over-the-counter tag sales, an increase in available tags per hunter from one to two, a
decrease in resident tag fees from $50 to $25 and a change in hunt unit groups. The result was a
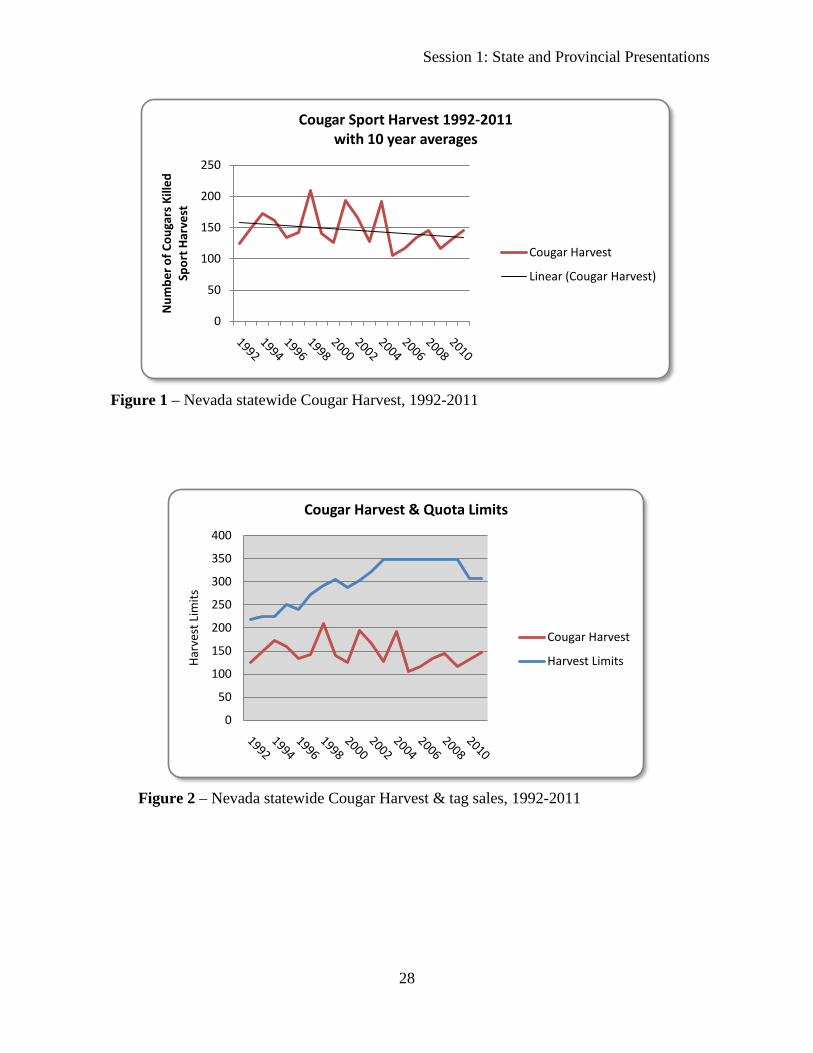
record high statewide cougar harvest of 210 animals that year but by the following year the
harvest had dropped to 140 animals, below the 10 year average (Figure 1). In 1998 the southern
third of the state went to a year-around season and in 2001, the Nevada Wildlife Commission
increased the statewide season length from seven months to year-around for the rest of the state.
Session 1: State and Provincial Presentations
18
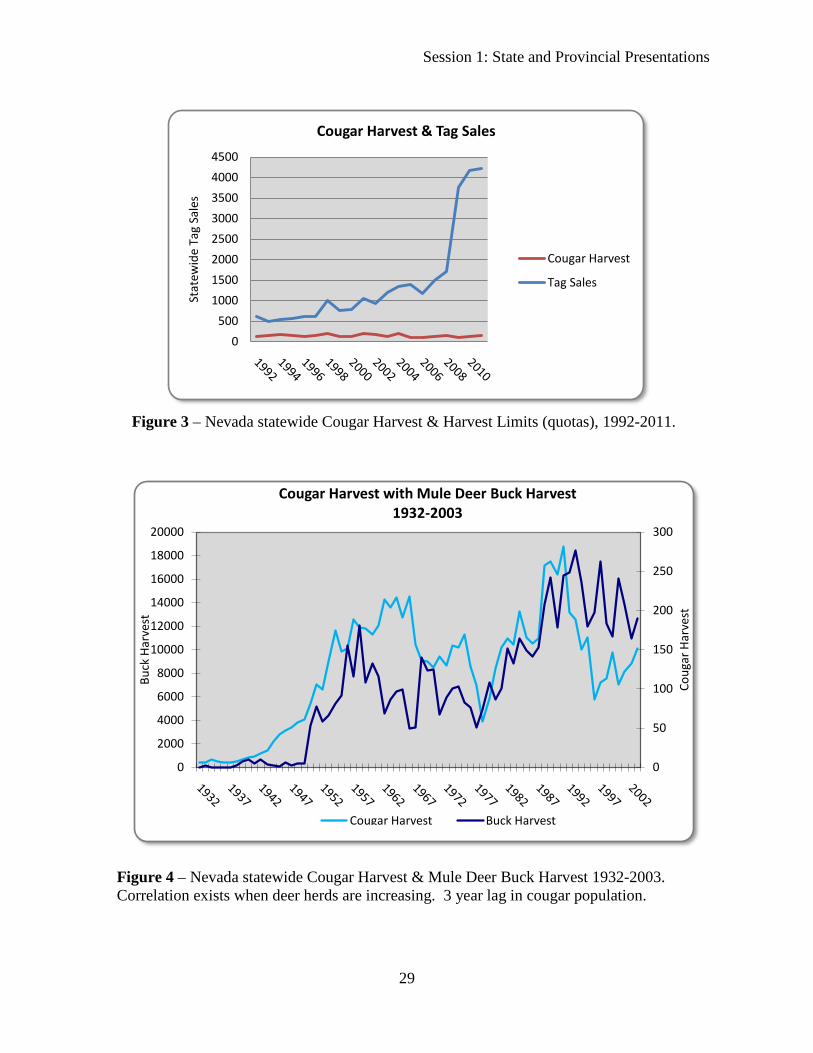
In 2008 lion tags were made available on-line. Despite these major changes in regulation and
season structure, cougar harvest rates in Nevada have remained mostly unchanged and even
slightly declined over the last 15 years on the average. For example, between 1992 and 2001
sport hunters took an average of 156 cougars annually but the average for the period 2002-2011
has decreased to 138 (Figure 1). The only noticeable effect of these regulatory changes has been
the number of tags sold annually (Figure 2).
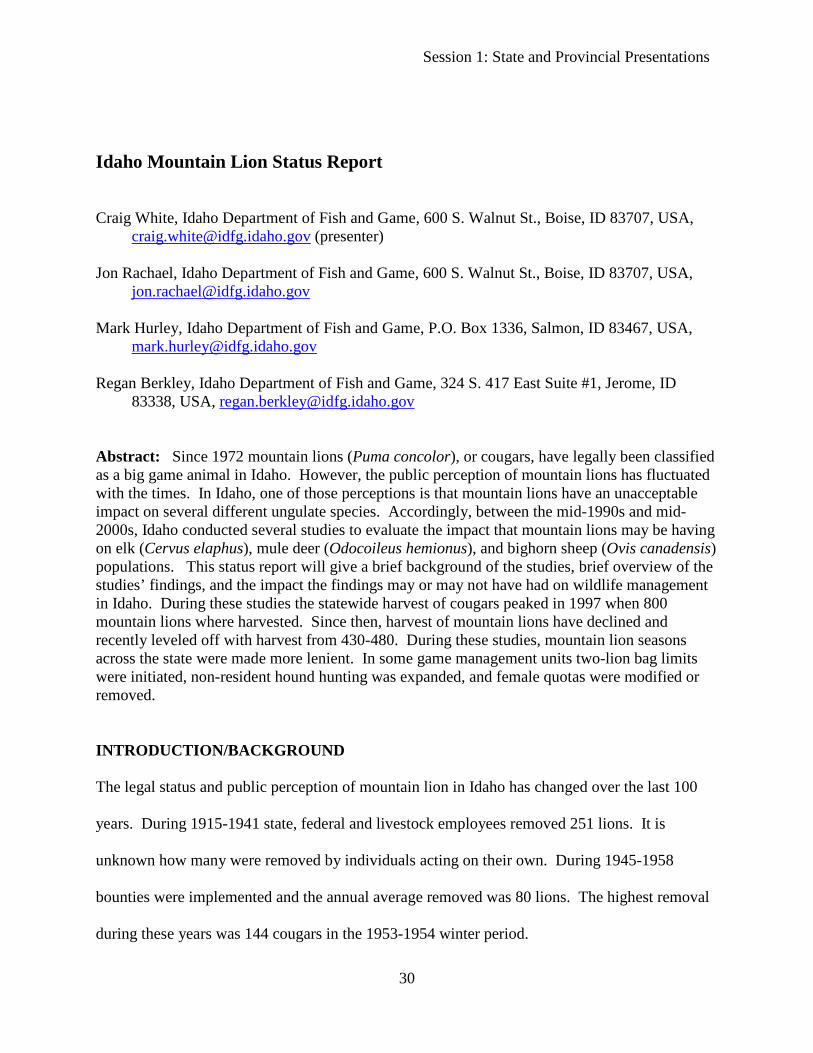
Once referred to as “quotas” the term was changed to “harvest objectives” in the late 1990’s
even though the numbers established were not objectives based on biological goals or indices.
Recently NDOW has been using the term “harvest limits” thereby representing a more biological
rather than political ceiling. Cougar harvest limits are set on an annual or biennial basis along
with other big game quotas. Historically harvest limits were calculated by biologists and those
recommendations were reviewed and sometimes altered during the public meeting process.
Since 2003 harvest limit recommendations were not formulated in this manner, but rather have
been indiscriminately chosen with little input from Department biologists by the Wildlife
Commission. This change in the process was implemented in an endeavor to increase lion
harvest, but these changes and the subsequent increase in harvest limits have had no tangible
effect on the number of cougars killed statewide (Figure 3). For 2011 the harvest limit set by the
Nevada Wildlife Commission was 500 cougars statewide (238% higher than the highest recorded
harvest of 210 animals in 1998). The increases in the harvest limit seem to be in vain given the
fact that for the last 20 years actual sport harvest has averaged approximately 50% of the
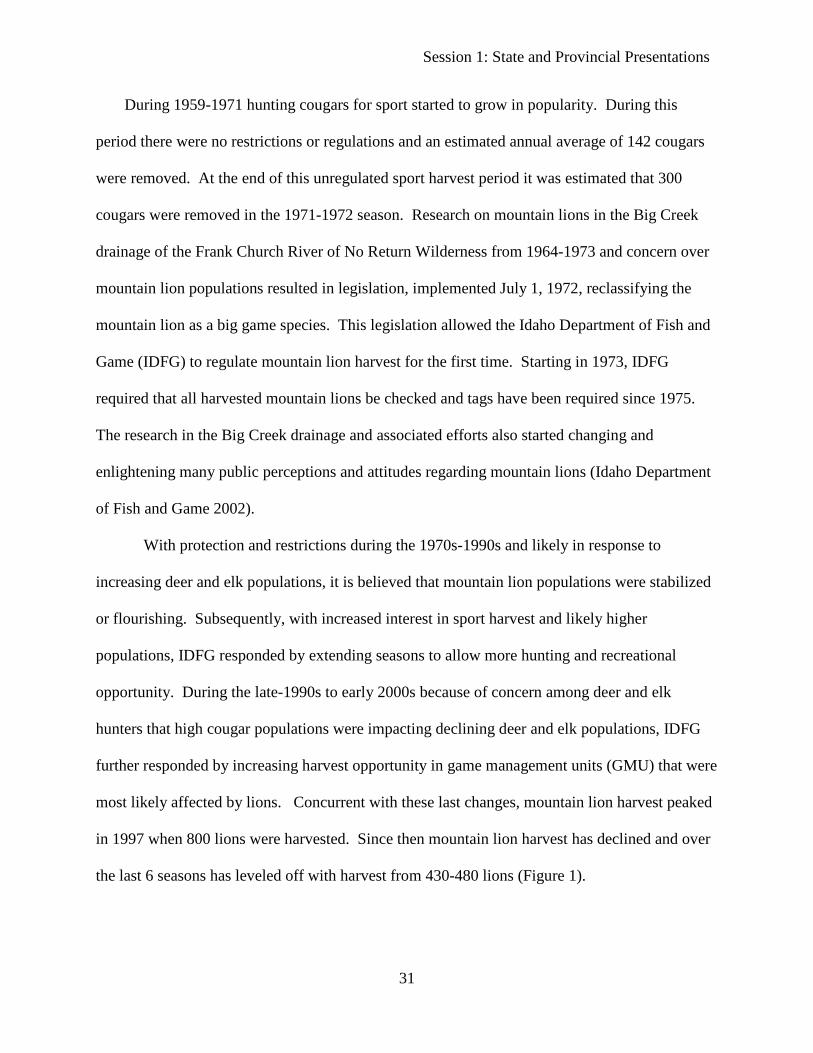
published harvest limit quotas (Figure 3). There is a strong correlation however between cougar
harvest and deer harvest implying that the only way to kill more cougars is if there are more
cougars in the population, a thought process contrary to current political trends (Figure 4).

Session 1: State and Provincial Presentations
19
HARVEST PROGRAM
Per regulation all legally killed cougars, whether taken under the authority of a sport tag or killed
for depredation or public safety reasons, must be inspected and validated. Each cougar validated
receives a metal seal permanently attached to the pelt, and pertinent data are recorded including:
sex, age, weight, location, body condition, reproductive status, stomach contents and physical
anomalies. Additionally, NDOW documents all other known mortalities such as road kills,
natural mortalities, etc. Premolars are pulled for exact aging purposes and tissue samples are
collected and deposited in a DNA bank.
NDOW maintains the practice of adaptive management for most of its big game species and
manages for sustainable populations. Cougar harvest trends are evaluated to determine
population status. Because of Nevada’s basin and range topography and the obstacles this
presents to the public there are many areas that act as natural refugia where cougars are pursued
little if at all. NDOW models the lion population by estimating a minimum population size
needed to maintain known mortality rates. Population structure and trend estimates are based on
harvest data and reports from guides, hunters, and Wildlife Services personnel who remove
depredating lions, lions that are a threat to the public and lions removed for management
purposes related to other big game enhancement programs. Prey abundance and cougar
recruitment, survival and fecundity rates are all parameters used in a deterministic reconstructive
spreadsheet model. Estimates place Nevada’s cougar population at between 1100 – 1500 adults
(data through 2010). Major shifts in sex ratios or age cohorts are absent suggesting the lion
population in Nevada is stable.
Session 1: State and Provincial Presentations
20
NEVADA PREDATOR MANAGEMENT PROGRAM
Nevada’s predator management philosophy as stated in the Nevada Predation Management
Plan-2011(NPMP) was, “The goal of the Nevada Predation Management Program is to initiate
projects that have the greatest potential to produce the intended results based on the best
available information and carried out in the most appropriate manner. NDOW maintains the
philosophy that predation management is a valuable management tool. It is a tool to be applied
by itself, or ideally in conjunction with other management techniques. The sole intention is to
lessen the impacts of predation on identified populations that are being additively impacted by
specific predators. As with any management strategy, predation management should be applied
on a location specific, case-by-case basis, with clear goals, and based on the best available
information. It should be applied in the proper intensity and at a focused scale. Equally
important, after management is initiated, projects should be monitored to determine whether the
desired results are achieved. The analysis of these projects will lead to better applications on
future projects.” The plan may be accessed on the Nevada Department of Wildlife web site at
http://www.ndow.org/about/pubs/brochure/2011_Predator.pdf
There are two different funding sources for predator management projects in Nevada and
both originate from sportsmen’s dollars. Legislative actions in 2001 resulted in Nevada Revised
Statute (NRS) 502.253 which is summarized as follows:
AB291 Introduced at the 71st session of the Nevada State Legislature on March 6, 2001
sought to establish a fee for all Nevada hunt permit applications to be used for predator
management.
Session 1: State and Provincial Presentations
21
NRS 502.253 was signed into law May 31, 2001. This legislation created an
additional application processing fee ($3) for all game tags to be used for the
predator management program as described in subsection 1. as follows:
1. In addition to any fee charged and collected pursuant to NRS 502.250, a fee of $3 must be
charged for processing each application for a game tag, the revenue from which must be
accounted for separately, deposited with the State Treasurer for credit to the Wildlife
Account in the State General Fund and used by the Department for costs related to:
(a) Programs for the management and control of injurious predatory wildlife;
(b) Wildlife management activities relating to the protection of non-predatory game
animals, sensitive wildlife species and related wildlife habitat;
(c) Conducting research, as needed, to determine successful techniques for managing
and controlling predatory wildlife, including studies necessary to ensure effective
programs for the management and control of injurious predatory wildlife; and
(d) Programs for the education of the general public concerning the management and
control of predatory wildlife.
2. The Department of Wildlife is hereby authorized to expend a portion of the money collected
pursuant to subsection 1 to enable the State Department of Agriculture to develop and carry
out the programs described in subsection 1.
3. Any program developed or wildlife management activity or research conducted pursuant to
this section must be developed or conducted under the guidance of the Commission pursuant
to subsection 2 of NRS 501.181.4. The money in the Wildlife Account remains in the
Account and does not revert to the State General Fund at the end of any fiscal year. (Added
to NRS by 2001, 1213; A 2003, 1541; 2009, 464).

Session 1: State and Provincial Presentations
22
Important provisions that guard and regulate the use of these funds include:
• Revenue to be held in a separate wildlife account and only be used for the predator
program.Revenue rolls over each year and cannot be reverted to other state funds.
The following is a summary of revenue and expenditures since the program’s inception:
Average annual amount since inception ≈ $390,000
Total revenues generated since inception ≈ $3.5 million
Total expenditures ≈ $2,950,598
Additional funds are available though the Heritage Program where projects are submitted for
approval by the Nevada Wildlife Commission. The Department administers the Heritage
Program by assembling project proposals, ranking them, providing copies to the Commission,
implementing contracts to conduct projects, and collating project reports.
SUMMARY OF PROJECTS CONDUCTED UNDER NRS 502.253
To date 23 projects have been or are being implemented with funds generated under NRS
502.253.
• Projects have focused on protecting various species including: Mule Deer, Pronghorn,
Bighorn sheep, Sage Grouse, Turkey, Waterfowl and Pheasant.
• Predator species targeted for removal were Mountain lions, Coyote, Badger and
Corvids (Raven, Crow and Magpie).
• No monies have been spent on projects related to sensitive species, habitat or
education and very little has been spent on research.
There are two notable projects pertaining to cougars – Projects 18 and 22.

Session 1: State and Provincial Presentations
23
Project 18
The primary objective of this project was to provide a benefit to mule deer through decreased
predation by cougars and coyotes. This project was implemented in 2004 when NDOW fitted 24
mule deer (8 juveniles and 16 adults) in the project area with ear tag transmitters. The battery
life of the transmitters did not exceed two years and none of the 24 deer were recorded as
mortalities during the two year monitoring period. Predator removal was also initiated in 2004.
Since that time a total of 34 cougars and 812+ coyotes have been removed at a project cost of
$386,567. Average age of the lions taken was 3.6 years (males and females combined). An
additional $102,193 has been proposed for FY2011 bringing the total project costs through July
2011 to $488,760 (Tables 1 and 2). The project will run another five years.
Table 1 - Project 18, Predator Removal by Year
2004 2005 2006 2007 2008 2009 2010 2011 Total Lions 0 4 0 10 5 5 7 4 34 Coyotes 66 119 230 149 84 105 59 na 812+
Table 2 - Project 18, Expenditures by Year
FY05 FY06 FY07 FY08 FY09 FY10
Total Expended Thru FY 2010
FY11 Total
20, 511 25,966 31,946 95,525 103,945 108,674 386,567 102,193 $488,760
Mule deer abundance and production are two of the many parameters being measured to
determine success of this project. As summarized in the Nevada Predator Management Plan –
2011, measured success cannot be attributed solely to the project thus far since most of the mule
Session 1: State and Provincial Presentations
24
deer increase occurred prior to any appreciable cougar removal – “Population increases in 011-
013* (37%) and 014* (53%) could be attributable to a number of factors including; predator
control, wild horse gathers, mild winters, wet springs, and late summer moisture. Predator
control has publicly received credit for much of the 53% increase in Unit 014 (850 deer to 1300)
and may well have facilitated at least some of the growth. It should be noted that well over half
of that population increase (850-1100) occurred by the spring of 2007 before any appreciable
lion removal occurred. Only 4 of the 31 lions were removed before preparation of the 2007 deer
population estimate. Additionally, since the same pattern of deer population increases occurred
in 011-013 and 033* from 2004 to 2008 in the absence of predator control, it strongly suggests
deer population increases in northwest Nevada were likely the result of a larger landscape scale
phenomenon such as weather. Spring Fawn/Adult ratios have varied widely. In only one of 6
years since the inception of the project, was the spring fawn/adult ratio noticeably higher in 014
than the other units. This occurred after only 4 lions and 185 coyotes had been removed and has
not occurred since with significantly more predator removal having occurred subsequent to that
time… the variation between years is much greater for all units than variation between units
within years. This suggests that production and recruitment are most often driven by landscape
scale phenomenon such as climate.”
*(reference to hunt unit boundaries in north western Nevada)
Project 22
The funding amount for this project proposal for 2011 is $145,187. It is referred to in the
NPMP-2011 as “Statewide deer and multi-species enhancement project”. It allows for removal
of predators in areas where:

Session 1: State and Provincial Presentations
25
• Mule deer herds below carrying capacity or exhibiting long-term below average fawn/doe
ratios (post-season) and/or long-term below average recruitment (spring surveys).
• Areas where more than one species of big game animals exist.
• Areas where long-term habitat improvements are under way.
• Areas where recent augmentations or reintroductions are planned.
• Areas where other big game species are below carrying capacity or exhibiting long-term
below average young/adult female ratios and/or long-term below average recruitment.
Monitoring methods of the project is not identified in the NPMP-2011.
SUMMARY OF HERITAGE FUND PROJECTS
The Heritage Fund is funded through Governors Tag auctions. Recently approved proposals
have had an emphasis on predator removal with little or no post-project monitoring. Heritage
Fund Projects approved by the Wildlife Commission for 2011 include the Jersey Valley Cattle
contract which allow a local rancher (the contractor) and his family to take up to 10 cougars in
identified mountain ranges to “maintain a balance between mountain lions and their prey”. The
contractor and his family can harvest lions under authority of NDOW issued mountain lion tags
(sport harvest) but then are paid $1,800 for each cougar killed. As stated in the original proposal
the project areas were identified with empirical and anecdotal information which was supplied to
the Commission. The project goal is to reduce the number of mountain lions in order to increase
the number of mule deer and bighorn sheep. Monitoring of the results will be completed by the
contractor - “as I guide clients for hunts and run my ranch in the area” [sic] for a period of three
years following lion removal.
Session 1: State and Provincial Presentations
26
COUGAR RESEARCH IN NEVADA
There are currently three research projects underway:
• An Assessment of Desert Bighorn Sheep on Desert National Wildlife Refuge, Nevada
• Nevada Test Site Mountain Lion Study
• Characterizing Mountain Lion Distribution, Abundance, and Interactions with Prey
Populations in Nevada
An Assessment of Desert Bighorn Sheep on Desert National Wildlife Refuge, Nevada
The projects main goal is to assess habitat use, diet, distribution and overall health of the bighorn
sheep population in the Sheep Range. Cause specific mortality will also be investigated. The
cougar researcher is David Choate (post doc) and he will be collaring cougars in the study area
for the predator component of the project. Methods of capture include cage traps, foot snares
and houndsmen. They are also using trail cameras to locate lions. As of mid-April 2011 they
have captured four lions and deployed three collars. The project is expected to run through 2014.
Cooperators include the U.S. Fish & Wildlife Service, U.S. Geological Survey, Nevada
Department of Wildlife, University of Nevada, Las Vegas, and the White Mountain Research
Center at the University of California.
Nevada Test Site Mountain Lion Study
In the Draft Study Plan submitted to NDOW authors David Mattson, Brandon Holton and Derek
Hall outlined several goals for the project which takes place in 2010-2011. Specifically they are
investigating: 1) the correlation of human exposure to mountain lions and the associated risks to
workers on the Nevada Test Site; 2) prey composition and the effects of mountain lion predation
on prey distribution; 3) seasonal activity patterns and population demographics of the NTS lion
population which is un-hunted due to access restrictions on the property. Capture methods are
Session 1: State and Provincial Presentations
27
limited to foot snares due to NTS restrictions regarding dogs off-leash. They have captured and
collared three lions as of mid-April 2011, one of which has died. Cooperators include the U.S.
Geological Survey, the National Park Service and the Nevada Test Site.
Characterizing Mountain Lion Distribution, Abundance, and Interactions with Prey
Populations in Nevada
This project is in northwestern Nevada and is being conducted by Alyson Andreason, a PhD
candidate at the University of Nevada, Reno. Goals include determining predation rates, prey
selection, habitat use and connectivity. There is also a statewide genetic analysis component. As
of mid-April 2011 they have captured and collared 25 cougars since January 2009 utilizing
houndsmen and cage traps. There have been a few mortalities for various reasons. They
anticipate two more years of field work. Cooperators include the University of Nevada, Reno,
the Wildlife Conservation Society and the Nevada Department of Wildlife.
Session 1: State and Provincial Presentations
28
0
50
100
150
200
250
300
350
400
Harv
est L
imits
Cougar Harvest & Quota Limits
Cougar Harvest
Harvest Limits
0
50
100
150
200
250N
umbe
r of C
ouga
rs K
illed
Spor
t Har
vest
Cougar Sport Harvest 1992-2011with 10 year averages
Cougar Harvest
Linear (Cougar Harvest)
Figure 1 – Nevada statewide Cougar Harvest, 1992-2011
Figure 2 – Nevada statewide Cougar Harvest & tag sales, 1992-2011
Session 1: State and Provincial Presentations
29
0500
10001500200025003000350040004500
Stat
ewid
e Ta
g Sa
les
Cougar Harvest & Tag Sales
Cougar Harvest
Tag Sales
0
50
100
150
200
250
300
0
2000
4000
6000
8000
10000
12000
14000
16000
18000
20000
Coug
ar H
arve
st
Buck
Har
vest
Cougar Harvest with Mule Deer Buck Harvest1932-2003
Cougar Harvest Buck Harvest
Figure 3 – Nevada statewide Cougar Harvest & Harvest Limits (quotas), 1992-2011.
Figure 4 – Nevada statewide Cougar Harvest & Mule Deer Buck Harvest 1932-2003. Correlation exists when deer herds are increasing. 3 year lag in cougar population.
Session 1: State and Provincial Presentations
30
Idaho Mountain Lion Status Report Craig White, Idaho Department of Fish and Game, 600 S. Walnut St., Boise, ID 83707, USA,
[email protected] (presenter) Jon Rachael, Idaho Department of Fish and Game, 600 S. Walnut St., Boise, ID 83707, USA,
[email protected] Mark Hurley, Idaho Department of Fish and Game, P.O. Box 1336, Salmon, ID 83467, USA,
[email protected] Regan Berkley, Idaho Department of Fish and Game, 324 S. 417 East Suite #1, Jerome, ID
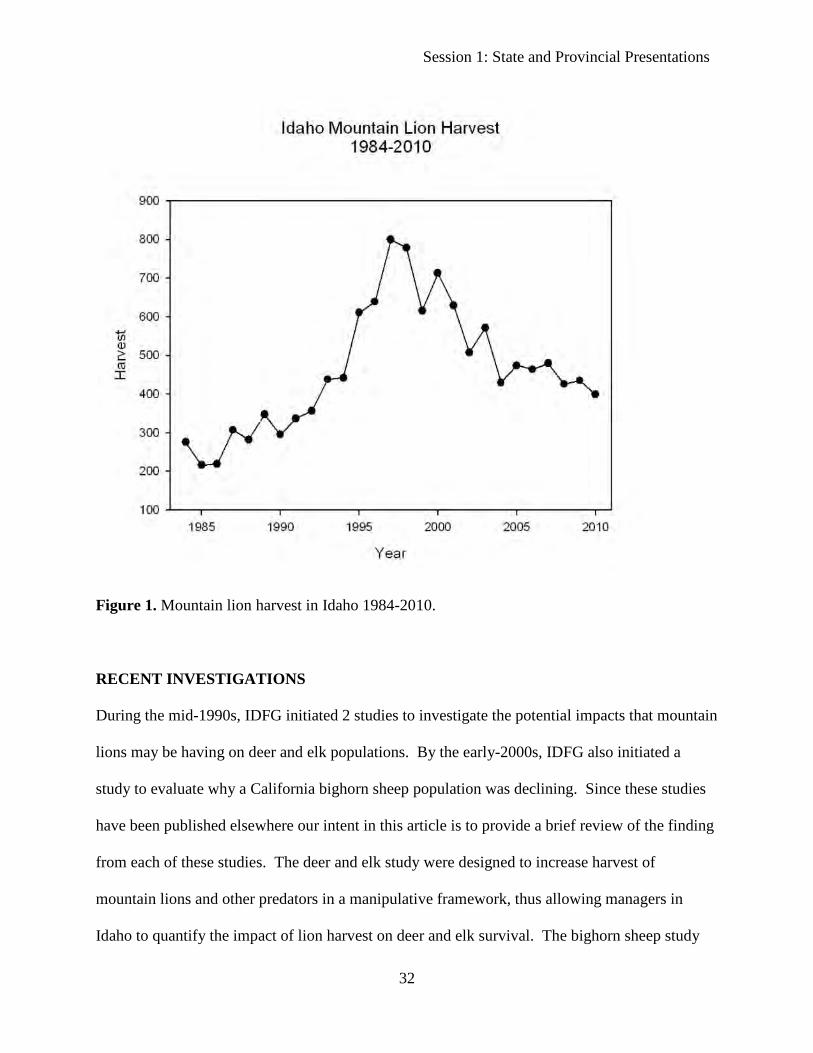
83338, USA, [email protected] Abstract: Since 1972 mountain lions (Puma concolor), or cougars, have legally been classified as a big game animal in Idaho. However, the public perception of mountain lions has fluctuated with the times. In Idaho, one of those perceptions is that mountain lions have an unacceptable impact on several different ungulate species. Accordingly, between the mid-1990s and mid-2000s, Idaho conducted several studies to evaluate the impact that mountain lions may be having on elk (Cervus elaphus), mule deer (Odocoileus hemionus), and bighorn sheep (Ovis canadensis) populations. This status report will give a brief background of the studies, brief overview of the studies’ findings, and the impact the findings may or may not have had on wildlife management in Idaho. During these studies the statewide harvest of cougars peaked in 1997 when 800 mountain lions where harvested. Since then, harvest of mountain lions have declined and recently leveled off with harvest from 430-480. During these studies, mountain lion seasons across the state were made more lenient. In some game management units two-lion bag limits were initiated, non-resident hound hunting was expanded, and female quotas were modified or removed. INTRODUCTION/BACKGROUND
The legal status and public perception of mountain lion in Idaho has changed over the last 100
years. During 1915-1941 state, federal and livestock employees removed 251 lions. It is
unknown how many were removed by individuals acting on their own. During 1945-1958
bounties were implemented and the annual average removed was 80 lions. The highest removal
during these years was 144 cougars in the 1953-1954 winter period.
Session 1: State and Provincial Presentations
31
During 1959-1971 hunting cougars for sport started to grow in popularity. During this
period there were no restrictions or regulations and an estimated annual average of 142 cougars
were removed. At the end of this unregulated sport harvest period it was estimated that 300
cougars were removed in the 1971-1972 season. Research on mountain lions in the Big Creek
drainage of the Frank Church River of No Return Wilderness from 1964-1973 and concern over
mountain lion populations resulted in legislation, implemented July 1, 1972, reclassifying the
mountain lion as a big game species. This legislation allowed the Idaho Department of Fish and
Game (IDFG) to regulate mountain lion harvest for the first time. Starting in 1973, IDFG
required that all harvested mountain lions be checked and tags have been required since 1975.
The research in the Big Creek drainage and associated efforts also started changing and
enlightening many public perceptions and attitudes regarding mountain lions (Idaho Department
of Fish and Game 2002).
With protection and restrictions during the 1970s-1990s and likely in response to
increasing deer and elk populations, it is believed that mountain lion populations were stabilized
or flourishing. Subsequently, with increased interest in sport harvest and likely higher
populations, IDFG responded by extending seasons to allow more hunting and recreational
opportunity. During the late-1990s to early 2000s because of concern among deer and elk
hunters that high cougar populations were impacting declining deer and elk populations, IDFG
further responded by increasing harvest opportunity in game management units (GMU) that were
most likely affected by lions. Concurrent with these last changes, mountain lion harvest peaked
in 1997 when 800 lions were harvested. Since then mountain lion harvest has declined and over
the last 6 seasons has leveled off with harvest from 430-480 lions (Figure 1).
Session 1: State and Provincial Presentations
32
Figure 1. Mountain lion harvest in Idaho 1984-2010.
RECENT INVESTIGATIONS
During the mid-1990s, IDFG initiated 2 studies to investigate the potential impacts that mountain
lions may be having on deer and elk populations. By the early-2000s, IDFG also initiated a
study to evaluate why a California bighorn sheep population was declining. Since these studies
have been published elsewhere our intent in this article is to provide a brief review of the finding
from each of these studies. The deer and elk study were designed to increase harvest of
mountain lions and other predators in a manipulative framework, thus allowing managers in
Idaho to quantify the impact of lion harvest on deer and elk survival. The bighorn sheep study
Session 1: State and Provincial Presentations
33
evaluated bighorn sheep habit use and mortality factors, thus providing insight into the how
habitat and predators may interact to impact bighorn.
Elk Calf Survival in North-Central Idaho
Elk recruitment rates began declining in some north-central Idaho GMUs in the early 1990s. It
was believed that mountain lions were one of the major causes for the decline in elk calf survival
and subsequently, IDFG experimentally manipulated predator populations of black bears (Ursus
americanus) and mountain lions. White et al. (2010) predicted that calf survival would improve
with increasing predator harvest and decline with reductions in predator harvest.
It was determined that mountain lions were responsible for 18-68% of the annual elk calf
mortality during the 8 year study (Zager et al. 2007). White et al. (2010) further determined that
manipulation of black bear harvest had immediate impacts to calf survival. However, it was
difficult to evaluate the results of manipulating mountain lion harvest on calf survival because
harvest declined in almost all of the treatment and control areas. As an obligate predator, it
appeared that the cougar population had a numerical response to declining prey (i.e., elk)
populations. Since mountain lion populations apparently declined because of lower prey
availability, it was difficult to implement an increase in lion harvest. Subsequently, White et al.
(2010) could not statistically detect that manipulation of mountain lion harvest resulted in a
functional response to calf survival. In addition, even though calf survival responded to predator
manipulation, particularly to black bear harvest, White et al. (2010) also demonstrated that calf
birth mass and habitat structure influenced calf survival. In an interesting twist, calf survival and
subsequently the elk population responded to removal of black bear and mountain lions, however
further potential population growth was negated by increased predation on older elk calves when
wolves (Canis lupus) became well established in this study area (IDFG, unpublished data).
Session 1: State and Provincial Presentations
34
California Bighorn Sheep in Southwest Idaho
The purpose of this study was to monitor ewe survival, and lamb production and survival with
the goal of identifying factors contributing to a downward trend in the bighorn sheep population.
The population of bighorn sheep in southwest Idaho grew from a reintroduction of 12 sheep in
the mid-1960s to a few hundred sheep by the early 1990s. However, the bighorn sheep
population started to decline in the 1990s. Mountain lions were a leading cause of bighorn ewe
and lamb mortality during a study spanning 2002-2005 (Berkley 2005).
Berkley (2005) evaluated habitat structure and lamb survival of 3 bighorn sheep herds
jointly, recognizing that predation risk can have important repercussions for prey behavior and
habitat selection, this may in turn affect nutrition, reproductive success, adult health, and an
individual’s ability to escape predation. Berkley (2005) concluded that the herd which had the
highest lamb survival used feeding sites with moderate amounts of grass which were close to
steep terrain resulted in the best tradeoff between security and nutrition. The herd that had
relatively low lamb survival used feeding sites dominated by cliffs but relatively less grass and
was favoring escape security over nutrition. Finally, the herd with the lowest lamb survival
used feeding sites dominated by grass but few cliffs, thus favoring forage over security cover.
Berkley’s (2005) conclusion is that while predators may be a proximate cause of a population
decline, predation may be exacerbated or mitigated by habitat structure.
Mule Deer Survival in Southern Idaho
Mule deer populations exhibit volatile population cycles, with low troughs often viewed by the
public and wildlife professionals as a crisis. In areas of southern Idaho, deer herds underwent a
widespread decline in the 1990s. During this decline it was perceived that predation may be a
reason for population decline since fawn ratios and population growth suggested that habitat and
Session 1: State and Provincial Presentations
35
deer density may not be limiting deer populations. In southern Idaho, predation by mountain
lions and coyotes (Canis latrans) is the major proximate cause of mule deer mortality during
winter (Unsworth et al. 1999, Bishop et al. 2005, Hurley et al. 2011). Subsequently IDFG
tested the effects of removing mountain lions and coyotes on mule deer populations in 11 GMUs
in southeastern Idaho from 1996 to 2006.
Hurley et al. (2011) determined that mountain lion removal did increase survival of
individual adult does in the winter and marginally in the summer, and fawn ratios did increase
with mountain lion removal. However, the overall population changes were variable because
weather had the greatest impact on deer survival and population change, whereas deer population
response exhibited a weak relationship to mountain lion removal.
IMPLICATIONS AND SUMMARY
Mountain lions in Idaho are currently managed to provide continued recreational opportunity for
hunting and non-hunting resources. IDFG has responded with increased harvest or removal of
mountain lions in GMUs when information suggests that lions are impacting ungulate
population(s). Recent investigations in Idaho involving lion removal or proposed lion removal to
benefit ungulate species have had unclear or mixed results; despite solid experimental designs.
The mule deer study and to a very limited degree the elk study did indicate that under certain
situations increased harvest of mountain lions through sport harvest may benefit ungulate species
but it is not a “one size fits all approach” nor does lion removal guarantee a deer or elk
population response. Further, the long-term effectiveness (i.e., cost, consistency, and interest) of
mountain lion removal programs is questionable. The elk and mule deer studies had a difficult
time manipulated cougar populations because interest in mountain lion hunting faded with
declining lion populations or poor hunter success. Further, it appears that the benefits of
Session 1: State and Provincial Presentations
36
mountain lion removal can be short term unless increased pressure is applied to a declining
mountain lion population, which may only increase cost and expectations without actual
population benefit.
Important knowledge has been gained to improved strategies for the management of
predator/prey dynamics in Idaho, and the role that harvest of mountain lions have in these
dynamics. Much of the initial momentum to conserve and promote mountain lions is due to the
research work started in the Big Creek Drainage of the Frank Church River of No Return
Wilderness. Perspectives and attitudes towards mountain lions have changed in Idaho. Recent
investigations in Idaho have focused more on the impact that mountain lions may have on
ungulate species, rather than the demographics and behavioral response of mountain lions. The
tenor of these studies may be the best gauge of current perspective toward mountain lions in
Idaho.
LITERATURE CITED
Berkley, R. 2005. Ecological investigations into a declining population: California bighorn sheep (Ovis canadensis californiana) in Owyhee County, Idaho. Thesis, University of Idaho, Moscow, USA.
Bishop, C. J., J. W. Unsworth, and E. O. Garton. 2005. mule deer survival amoung adjacent populations in southwest Idaho. Journal of Wildlife Management 69: 311-321.
Hurley, M. A., J. W. Unsworth, P. Zager, M. Hebblewhite, E. O, Garton, D. M. Montgomery, J. R. Skalski, and C. L. Maycock. 2011. Demographic response of mule deer to experimental reduction of coyote and mountain lion in southeast Idaho. Wildlife Monograph
Idaho Department of Fish and Game. 2002. Mountain lion management plan. Idaho Department of Fish and Game, Boise, USA.
Unsworth, J. W., D. F. Pac, G. C. White, and R. M. Bartmann. 1999. Mule deer survival in Colorado, Idaho, and Montana. Journal of Wildlife Management 63:315-326.

Session 1: State and Provincial Presentations
37
White, C. G., P. Zager, and M. W. Gratson. 2010. Influence of predator harvest, biological factors, and landscape on elk calf survival in Idaho. Journal of Wildlife Management 74:355-369.
Zager, P., C. White, and G. Pauley. 2007. Elk ecology. Study IV. Factors influencing elk calf recruitment. Idaho Department of Fish and Game Federal Aid in Wildlife Restoration Completion Report W-160-R-33, Boise, USA.
Session 1: State and Provincial Presentations
38
Managing an Expanding Cougar Population in Alberta Nathan F. Webb, Alberta Sustainable Resource Development, 9920 – 108 Street, Edmonton, AB
T5K 2M4; [email protected] (presenter) Kyle H. Knopff, Golder Associates Ltd, 102, 2535 – 3rd Avenue S.E., Calgary, AB T2A 7W5 M. S. Boyce, Department of Biological Sciences, University of Alberta, Edmonton, Alberta,
T6G 2E9, Canada, [email protected] James Allen, Alberta Sustainable Resource Development, 9920 – 108 Street, Edmonton, AB
T5K 2M4 Abstract: In Alberta, number of cougar mortalities caused by humans has increased rapidly over the past two decades. Management agencies sometimes use human-caused mortalities as an index of cougar population trend, but mortalities may be decoupled from cougar numbers. Recent work even suggests that higher human-caused cougar mortalities (primarily due to sport hunting) are causing cougar populations in North America to decline. We used a combination of radiotelemetry based cougar density estimates and the distribution of human-caused cougar mortalities in Alberta to evaluate change in cougar populations during 1991-2009, a period over which human-caused cougar mortality increased rapidly. We provide evidence that cougar densities have increased by at least 250% in west-central Alberta during the past two decades, and that cougars have expanded their range in northern and eastern Alberta. Importantly, both cougar mortalities and cougar sightings have increased markedly in Alberta’s ‘White Zone’, which consists of prairie-parkland habitats and is dominated by private land. Despite increasing cougar populations, hunters have been reluctant to harvest cougars in these areas, likely due to the difficulty of using hounds on small holdings of private land. We discuss recent changes in cougar hunting regulations that are intended to refine management where cougar densities have increased and to address concerns by the rural public who are faced with increasing interactions with cougars.
Session 1: State and Provincial Presentations
39
Arizona Mountain Lion Status Report Ronald L. Day Jr., Arizona Game and Fish Department, 5000 West Carefree Highway, Phoenix,
AZ 85083 USA, [email protected] (presenter) Abstract: Mountain lions are an important part of Arizona’s wildlife resource. They are distributed statewide and have in recent times become established in the harsh habitat found in the southwestern desert. Statewide hunter harvest has been relatively stable averaging 238 during the last five years. Current issues in Arizona lion management include monitoring the adult female portion of the annual harvest, examining potential barriers preventing lion movement, identifying important travel corridors, recognizing and dealing with the increasing potential of human/mountain lion conflicts, and implementing management strategies designed to reduce mountain lion predation on important prey species such as bighorn sheep.
Session 1: State and Provincial Presentations
40
Washington Mountain Lion Status Report Richard A. Beausoleil, Washington Department of Fish and Wildlife, 3515 State Highway 97A,
Wenatchee, WA 98801, USA, [email protected] (presenter) Donald A. Martorello, Washington Department of Fish and Wildlife, 600 Capitol Way N.,
Olympia, WA 98501, USA, [email protected] Abstract: This status report will be an update of cougar research, management, and legislative activities since the last mountain lion workshop in 2008. Several cougar research projects have been completed involving personnel from WDFW, Washington State University, and University of Washington. Collectively, these projects investigated population size, survival, movement patterns, habitat use, changes in predation events, testing apparent competition and prey-switching hypotheses, and how cougars existed along the urban-wild land interface. We will also present a full description of 3 bills that have been introduced in the January 2011 legislative session and explain how they will affect cougar management in Washington. Engrossed Substitute House Bill 2438 (HB 2438), which in 2008 authorized a 3-year extension of a cougar pursuit and kill season with the aid of dogs (for a total of 7 years) in 6 Washington counties, expired in 2011. A new bill, HB 2011, attempts to extend this hunt season for 5 additional years. Another bill, Senate Bill 5385 (SB 5385) was introduced to increase hunting license fees, including that for cougar. Lastly, SB 5201 was introduced and would allow wildlife officers to fine residents that are negligently feeding, attempting to feed, or attracting predatory wildlife. Finally, WDFW and Insight Wildlife Management completed a public opinion survey regarding cougars in Washington. The objective of the survey was to better understand the public’s perceptions of cougar management, identify information gaps, and define effective outreach methodologies for development of a cougar education and outreach plan. We will present results of that project and discuss our cougar education plans.
Session 1: State and Provincial Presentations
41
Managing Florida Panther Depredations: Implications for Continued Recovery Mark A. Lotz, Florida Fish and Wildlife Conservation Commission, 298 Sabal Palm Rd., Naples,
FL 34114-2572, USA, [email protected] (presenter) Darrell Land, Florida Fish and Wildlife Conservation Commission, 298 Sabal Palm Rd., Naples,
FL 34114-2572, USA, [email protected] Dave Onorato, Florida Fish and Wildlife Conservation Commission, 298 Sabal Palm Rd.,
Naples, FL 34114-2572, USA, [email protected] Marc Criffield, Florida Fish and Wildlife Conservation Commission, 298 Sabal Palm Rd.,
Naples, FL 34114-2572, USA, [email protected] Abstract: An increased Florida panther (Puma concolor coryi) population, currently estimated between 100-160 adults, has resulted in new management challenges. Depredation complaints from hobby livestock owners and commercial cattle ranchers occur more frequently. Most conflicts in exurban areas involve panthers preying on pets or hobby livestock, such as goats. The Interagency Florida Panther Response Plan was drafted to deal with human-panther interactions and depredations. However, the Response Plan was not intended to address depredations on large-scale commercial cattle operations. Hobby animals can usually be safeguarded by their owners securing them in predator-proof enclosures at night, but this is not practicable on commercial ranches with herds ranging across hundreds of hectares. Cattle ranches make up a significant portion of the panthers’ current breeding range and frequently offer more favorable habitat conditions than some areas of public lands. Fostering relationships with these private landowners is vital to Florida panther recovery efforts. Recently, the Florida Fish and Wildlife Conservation Commission (FWC) learned that cattle ranchers are experiencing the loss of a portion of their calf crop to panther depredations. Loss of income from panthers, whether real or perceived, has the potential to generate resentment towards panthers within the ranching community, creating reluctance to embrace recovery efforts and accept the presence of panthers on their lands. Ranchers have expressed a desire for FWC to develop a solution. Understanding panther-calf depredation dynamics on private ranchlands is important to develop cooperative solutions to this issue. The FWC will quantify panther prey selection near ranching operations and characterize panther-calf depredation variables. Ideally, this will help to identify management actions that can be taken to reduce calf losses by panthers while at the same time fostering a relationship with the ranching community that will generate additional support for recovery of the Florida panther.
Session 1: State and Provincial Presentations
42
Discussions on Source/Sink/Stable Population Management of Cougars in Wyoming Daniel J. Thompson, Wyoming Game and Fish Department, 260 Buena Vista Dr., Lander, WY
82520, USA; [email protected] (presenter)
David S. Moody, Wyoming Game and Fish Department, 260 Buena Vista Dr., Lander, WY 82520, USA
Daniel D. Bjornlie, Wyoming Game and Fish Department, 260 Buena Vista Dr., Lander, WY 82520, USA
Robert F. Trebelcock, Wyoming Game and Fish Department, 260 Buena Vista Dr., Lander, WY 82520, USA
Abstract: Wyoming recently adopted an adaptive harvest management scenario based on research conducted in Wyoming assessing impacts of harvest on cougar populations; where cougar populations were perturbed in order to quantify what level of harvest resulted in population reduction or increase. Cougar mortality was quantified as the number of mortalities/1,000 km2, as well as quantifying the sex/age relationship of harvest; primarily assessing the female segment of harvest. Generally speaking, as harvest increased (> 8.0 mortalities/1,000 km2), the proportion of adult females taken increased (> 20%). If high harvest levels were maintained, the average age of adult females decreased. Cougar habitat was quantified statewide and used as a template to derive mortality limits for hunt areas based on an objective of source, stable, or sink population status for a 3 year period. Mortality data on mountain lions were gathered annually among 31 hunt areas grouped into five mountain lion management units (MLMUs). Management objectives for MLMUs and hunt areas were determined by balancing public demands and biological requirements for sustainable lion populations throughout the landscape. Three primary monitoring criteria were used to assess population status of hunt areas: 1) Density of human-caused lion mortalities/1,000 km2; 2) Percentage of adult females in the harvest; and 3) average age of adult females in the harvest. Managing for a combination of source, stable, and sink mountain lion subpopulations within MLMUs (i.e., at the hunt area level) provided flexibility to address local management concerns while maintaining overall population viability on a landscape level and provide for long term harvest and recreation opportunities. Maintaining static mortality limits for 3 years allowed us to better assess trend and perhaps more importantly helped prevent unwarranted “knee-jerk” reactions to annual fluctuations in harvest, weather conditions, conflicts, or ungulate recruitment. INTRODUCTION AND BACKGROUND
The following report contains data for mountain lion harvest and mortality in Wyoming for
harvest years (HY) 2007-2009. HY 2009 represents the final harvest period within the 3-year
Session 1: State and Provincial Presentations
43
cycle used for mountain lion harvest management based on the plan adopted by the WGFD
Commission prior to HY 2007. Therefore, this report represents our initial analyses of
management strategies and classification of Hunt Area’s (HA’s) based on monitoring protocol.
Mortality limits and management objectives generally remained static during the 3-year period,
however the mortality limit for HA 15 was increased by 10 for HY 2008 and 2009. Reported
ages and age classifications for HY 2009 are based on field assessment of animal age (based on
tooth wear and pelage) and future reports may alter some of these values as the annuli ages were
not available as this report was finalized.
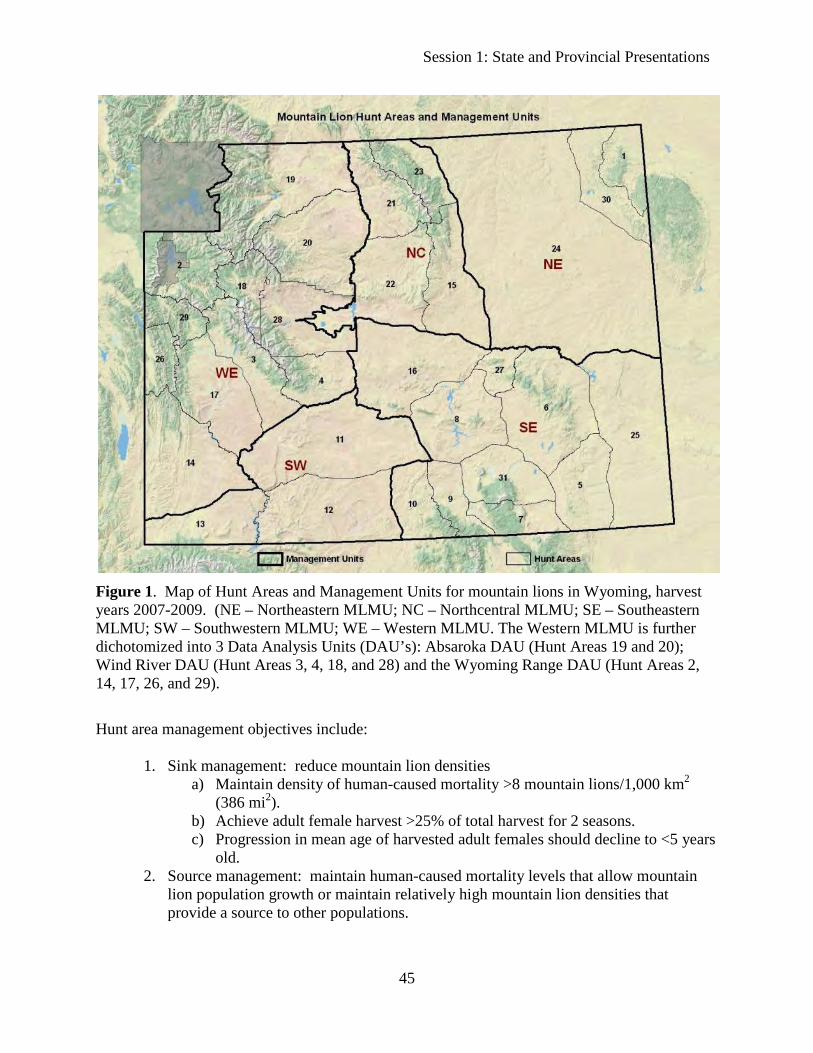
Mortality data on mountain lions are gathered annually among 31 hunt areas (Figure 1)
that are grouped into five MLMUs. The number of hunt areas increased from 29 to 31 in HY
2007. The additional hunt areas came as a result of splitting two existing hunt areas in order to
better address regional concerns. The boundaries of MLMUs encompass large areas with
contiguous habitat and topographic features and are believed to surround population centers.
Each hunt area has an annual mortality limit that varies from 2-35 animals, with 3 areas also
having a maximum female harvest limit. If the mortality limit is filled (total or female), the hunt
area automatically closes, otherwise hunt area closure occurs at the end of the harvest season.
During mandatory inspections of harvested animals, many variables are recorded, including:
harvest date, location, sex, lactation status, estimated age, number of days spent hunting, use of
dogs, other lions observed, as well as several other parameters. Skulls and pelts must be
presented in unfrozen condition so teeth can be removed as well as providing evidence of sex
and lactation status. The information gathered during inspection is used to assess sex/age
structure of harvested animals. Beginning in HY 2007 all known human-caused mortality events

Session 1: State and Provincial Presentations
44
counted toward the mortality limit; prior to this, only legal and illegal mortalities counted toward
the mortality limit.
The WGFD does not estimate lion population numbers. Rather, population trends are
assessed through sex and age composition of mortality data (Anderson and Lindzey 2005).
Management objectives for MLMUs and hunt areas are determined by balancing public demands
(i.e., human/lion interactions, livestock depredation, adequate hunting/viewing opportunity) and
biological requirements for sustainable lion populations throughout the landscape. The sex and
age composition of harvested lions is compiled and analyzed statewide, for each MLMU and for
each hunt area. Analyzing data by management units allows managers to evaluate harvest within
specific hunt areas and therefore assess the effect harvest has on the regional population. If
observed trends are consistent with objectives set forth for each hunt area, changes in mortality
limits are not recommended. However, if trends deviate from hunt area objectives, mortality
limit increases or decreases may be recommended for the next cycle of management.
WGFD fosters a regional scheme based on source/sink/stable population dynamics
(CMWG 2005) for managing mountain lions. Managing for a combination of source, stable, and
sink mountain lion subpopulations within MLMUs (i.e., at the hunt area level) will provide
flexibility to address local management concerns (e.g., livestock depredation) while maintaining
overall population viability on a landscape level and provide for long term harvest and recreation
opportunities.
Session 1: State and Provincial Presentations
45
Figure 1. Map of Hunt Areas and Management Units for mountain lions in Wyoming, harvest years 2007-2009. (NE – Northeastern MLMU; NC – Northcentral MLMU; SE – Southeastern MLMU; SW – Southwestern MLMU; WE – Western MLMU. The Western MLMU is further dichotomized into 3 Data Analysis Units (DAU’s): Absaroka DAU (Hunt Areas 19 and 20); Wind River DAU (Hunt Areas 3, 4, 18, and 28) and the Wyoming Range DAU (Hunt Areas 2, 14, 17, 26, and 29).
Hunt area management objectives include:
1. Sink management: reduce mountain lion densities a) Maintain density of human-caused mortality >8 mountain lions/1,000 km2
(386 mi2). b) Achieve adult female harvest >25% of total harvest for 2 seasons. c) Progression in mean age of harvested adult females should decline to <5 years
old. 2. Source management: maintain human-caused mortality levels that allow mountain
lion population growth or maintain relatively high mountain lion densities that provide a source to other populations.

Session 1: State and Provincial Presentations
46
a) Maintain density of human-caused mortality <5 mountain lions/1,000 km2 (386 mi2)
b) Maintain adult female harvest <20% of total harvest. c) Maintain older-age adult females in the population (>5 years old). This will
be difficult to identify without additional sampling due to low sample size from harvest, but would be expected for lightly hunted populations.
3. Stable management: maximize long-term hunting opportunity and population viability.
a) Maintain human-caused mortality density between 5-8 mountain lions/1,000 km2 (386 mi2)
b) Adult female harvest should not exceed 25% of total harvest for more than 1 season.
c) Maintain intermediate aged adult females (mean ≅ 4-6 years old) in the harvest. Adequate age evaluation may require averaging age data over time to achieve meaningful sample sizes.
MLMU management objectives:
• The MLMU management objective should attempt to achieve the criteria above for source, stable, or sink mountain lion management at the MLMU level. The objectives chosen by managers will be based on the adjacent management priorities, size of the MLMU, maintaining recreational opportunity, maintaining source mountain lion populations, as well as depredations and other factors to achieve the overall management goal of sustaining mountain lion populations throughout core habitat at varying densities depending on management objectives.
• Coordinating management efforts with adjacent states would be most desirable for the
smaller MLMUs (i.e., Northeast and Southwest MLMUs) where the majority of connected mountain lion habitat extends beyond Wyoming. Source or stable management could be maintained with interagency coordination, but sink management could also be implemented when sufficient source habitat has been identified in adjacent areas.
It is important to note that the monitoring criteria (mortality density, proportion of adult
females in harvest, average age of adult females annually harvested) for mountain lion harvest
are not used independently to assess the status of a HA. Density of human-caused mountain lion
mortality is the more powerful tool of assessment and when coupled with percentage of adult
females harvest and their subsequent average age, can be helpful in assessing over a 3-year
period if in fact a Hunt Area is moving in the management direction stated prior to season setting
Session 1: State and Provincial Presentations
47
processes relative to objectives. The quantification of Hunt Area status will be derived from an
assessment of the 3 monitoring criteria together as well as nuances related to
immigration/emigration from other lion populations. When the mountain lion management plan
was adopted by the commission in 2006, there was a paucity of habitat data in the Northeastern
and Southwestern portions of the state relative to mountain lions. During the winter of 2009-
2010, the trophy game section quantified mountain lion habitat in both the Northeastern and
Southwestern MLMU’s based on forested habitat, terrain, historic harvest, regional/expert input,
and telemetry data from marked mountain lions (D. Thompson/SDSU, unpublished data). These
efforts will greatly help to monitor Hunt Areas regionally and help determine future mortality
limits and management strategies.
Acknowledging that managers rarely have precise information to measure success of
management objectives, that mountain lion densities may vary regionally, and that the criteria
proposed here are general guidelines; these criteria should be compared to one another and
applied adaptively to assess success of management prescriptions. Applying management
objectives in an adaptive management framework, where density of human-caused mortality,
harvest composition, and age of harvested adult females are monitored relative to expectations
(criteria above) allows assessment of whether or not management objectives are being achieved
and if management strategies may need modification to produce desired outcomes.
STATEWIDE MOUNTAIN LION HARVEST
During the 2007 – 2009 harvest cycle, we documented record harvest and mortality of mountain
lions in Wyoming since the inception of state management of the species (Figure 2). Due to
the way that management directions (source/stable/sink) are spread across hunt areas and
management units, the record numbers of mortality are not indicative of overall population

Session 1: State and Provincial Presentations
48
reduction or long-term negative effects of harvest. Rather the higher harvests are more a
derivative of higher mortality limits allocated to hunt areas on a statewide level. Relative to
effort, mountain lion hunters successfully harvested a mountain lion for every 3.59 days of
hunting (3.47 – 3.62 days/kill annually; with outliers as high as 50 days per an individual
hunter), the majority of mountain lion hunters harvested a lion during one day of hunting.
Approximately 85% of successful hunters used hounds in order to harvest a lion. Other methods
of harvest included incidental/opportunistic take, spot/stalk, tracking, and predator calling. In
addition to harvest mortalities, 21 mountain lions mortalities were attributed to removal for
depredation/human safety reasons, 16 incidental snare/trap mortalities, 12 vehicle mortalities and
7 self defense mortalities, with agency removal and incidental take accounting for the majority of
non-harvest mountain lion mortality (Figure 3).
A total of 16 illegal mountain lion harvests were documented by agency personnel, which
are included in the harvest analysis. Male cougars made up the highest proportion of mountain
lions taken by hunters, and adult female lions made up less than 20% of the total harvest on an
annual basis (Figure 4). Total take of females never exceeded 50% annually during the 3-year
cycle.
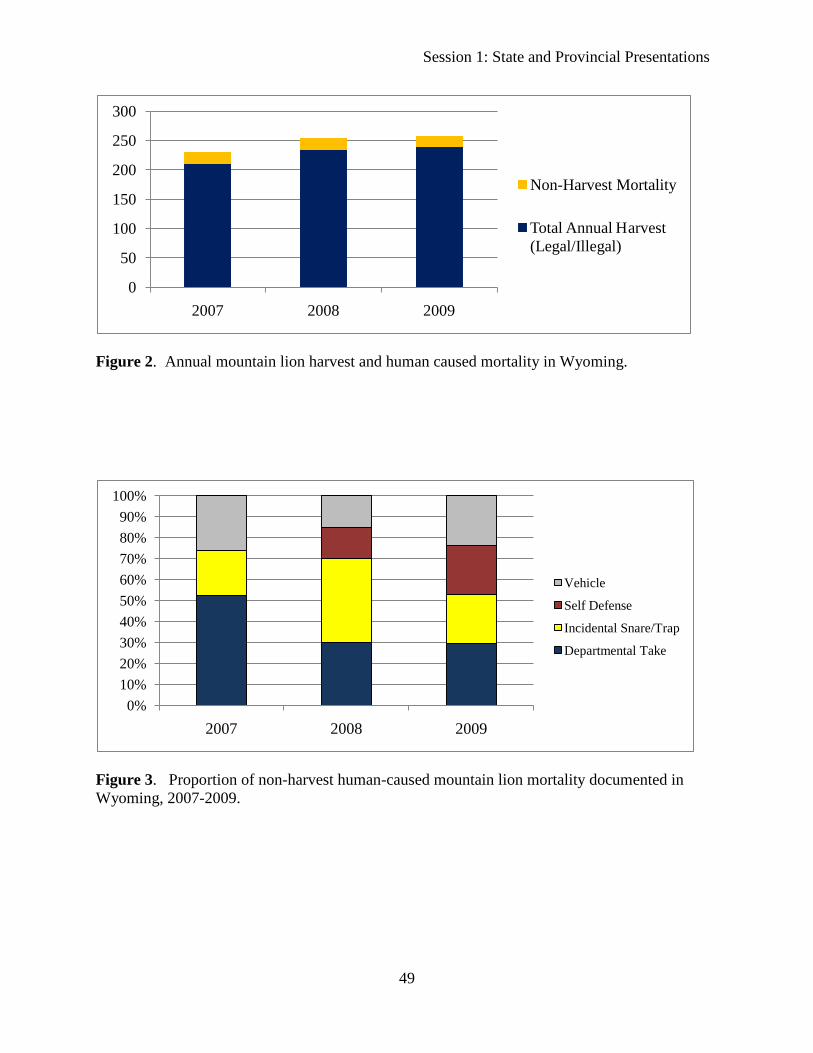
Session 1: State and Provincial Presentations
49
Figure 2. Annual mountain lion harvest and human caused mortality in Wyoming.
Figure 3. Proportion of non-harvest human-caused mountain lion mortality documented in Wyoming, 2007-2009.
0
50
100
150
200
250
300
2007 2008 2009
Non-Harvest Mortality
Total Annual Harvest (Legal/Illegal)
0%10%20%30%40%50%60%70%80%90%
100%
2007 2008 2009
Vehicle
Self Defense
Incidental Snare/Trap
Departmental Take
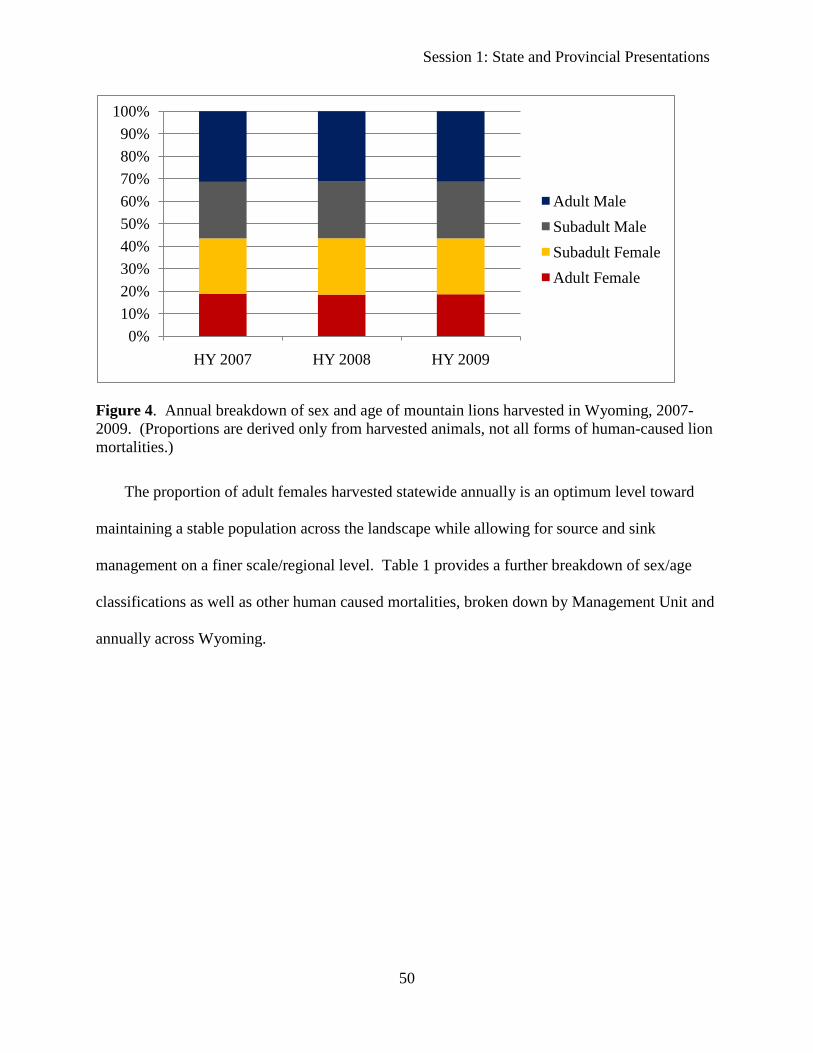
Session 1: State and Provincial Presentations
50
Figure 4. Annual breakdown of sex and age of mountain lions harvested in Wyoming, 2007-2009. (Proportions are derived only from harvested animals, not all forms of human-caused lion mortalities.)
The proportion of adult females harvested statewide annually is an optimum level toward
maintaining a stable population across the landscape while allowing for source and sink
management on a finer scale/regional level. Table 1 provides a further breakdown of sex/age
classifications as well as other human caused mortalities, broken down by Management Unit and
annually across Wyoming.
0%10%20%30%40%50%60%70%80%90%
100%
HY 2007 HY 2008 HY 2009
Adult MaleSubadult MaleSubadult FemaleAdult Female
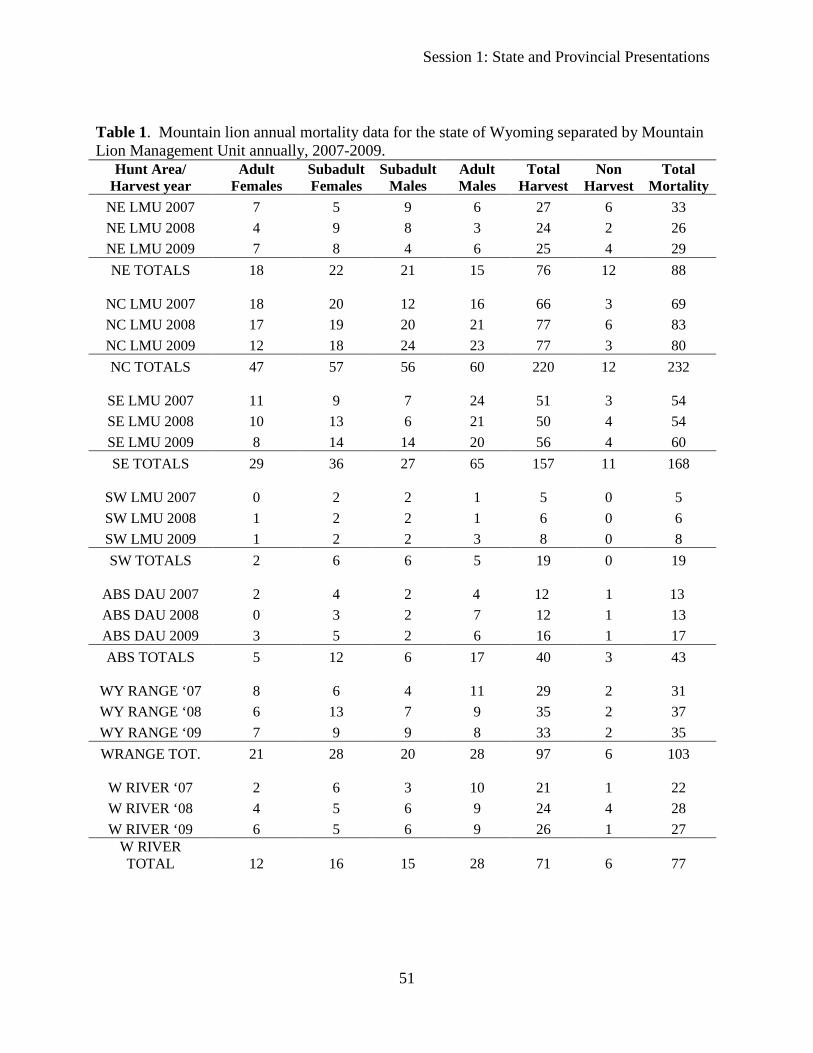
Session 1: State and Provincial Presentations
51
Table 1. Mountain lion annual mortality data for the state of Wyoming separated by Mountain Lion Management Unit annually, 2007-2009.
Hunt Area/ Harvest year
Adult Females
Subadult Females
Subadult Males
Adult Males
Total Harvest
Non Harvest
Total Mortality
NE LMU 2007 7 5 9 6 27 6 33 NE LMU 2008 4 9 8 3 24 2 26 NE LMU 2009 7 8 4 6 25 4 29 NE TOTALS 18 22 21 15 76 12 88
NC LMU 2007 18 20 12 16 66 3 69 NC LMU 2008 17 19 20 21 77 6 83 NC LMU 2009 12 18 24 23 77 3 80 NC TOTALS 47 57 56 60 220 12 232
SE LMU 2007 11 9 7 24 51 3 54 SE LMU 2008 10 13 6 21 50 4 54 SE LMU 2009 8 14 14 20 56 4 60 SE TOTALS 29 36 27 65 157 11 168
SW LMU 2007 0 2 2 1 5 0 5 SW LMU 2008 1 2 2 1 6 0 6 SW LMU 2009 1 2 2 3 8 0 8 SW TOTALS 2 6 6 5 19 0 19
ABS DAU 2007 2 4 2 4 12 1 13 ABS DAU 2008 0 3 2 7 12 1 13 ABS DAU 2009 3 5 2 6 16 1 17 ABS TOTALS 5 12 6 17 40 3 43
WY RANGE ‘07 8 6 4 11 29 2 31 WY RANGE ‘08 6 13 7 9 35 2 37 WY RANGE ‘09 7 9 9 8 33 2 35 WRANGE TOT. 21 28 20 28 97 6 103
W RIVER ‘07 2 6 3 10 21 1 22 W RIVER ‘08 4 5 6 9 24 4 28 W RIVER ‘09 6 5 6 9 26 1 27
W RIVER TOTAL 12 16 15 28 71 6 77
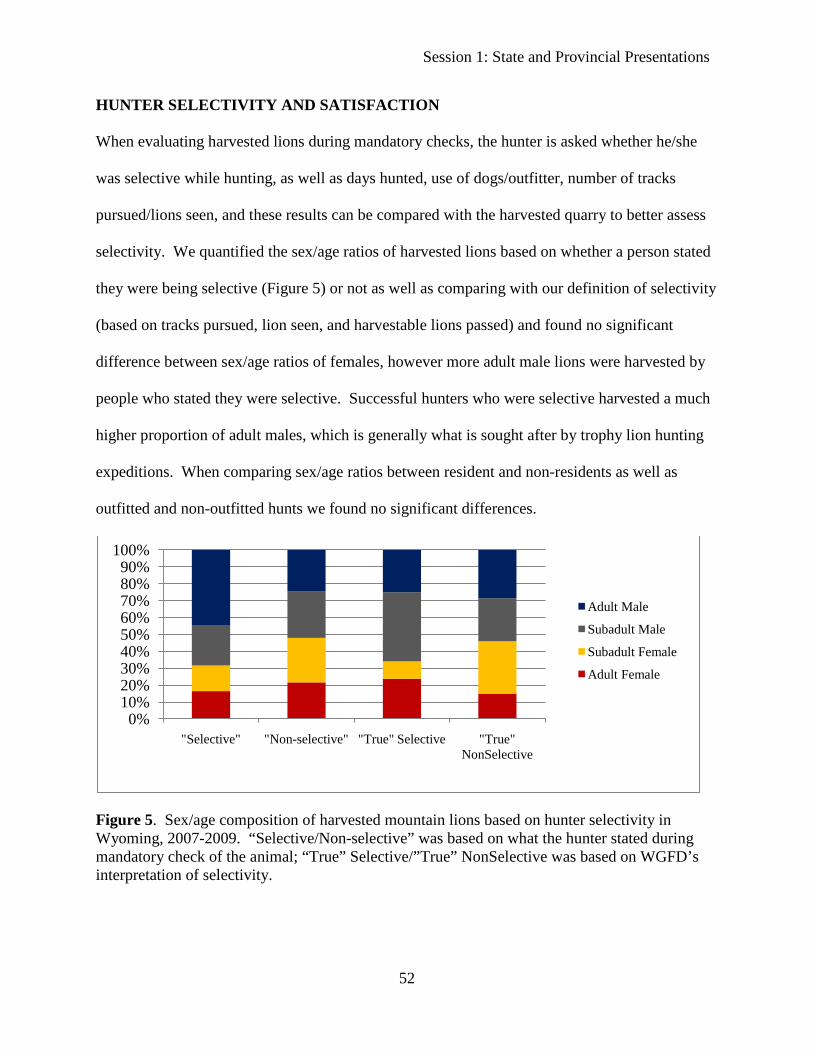
Session 1: State and Provincial Presentations
52
HUNTER SELECTIVITY AND SATISFACTION
When evaluating harvested lions during mandatory checks, the hunter is asked whether he/she
was selective while hunting, as well as days hunted, use of dogs/outfitter, number of tracks
pursued/lions seen, and these results can be compared with the harvested quarry to better assess
selectivity. We quantified the sex/age ratios of harvested lions based on whether a person stated
they were being selective (Figure 5) or not as well as comparing with our definition of selectivity
(based on tracks pursued, lion seen, and harvestable lions passed) and found no significant
difference between sex/age ratios of females, however more adult male lions were harvested by
people who stated they were selective. Successful hunters who were selective harvested a much
higher proportion of adult males, which is generally what is sought after by trophy lion hunting
expeditions. When comparing sex/age ratios between resident and non-residents as well as
outfitted and non-outfitted hunts we found no significant differences.
Figure 5. Sex/age composition of harvested mountain lions based on hunter selectivity in Wyoming, 2007-2009. “Selective/Non-selective” was based on what the hunter stated during mandatory check of the animal; “True” Selective/”True” NonSelective was based on WGFD’s interpretation of selectivity.
0%10%20%30%40%50%60%70%80%90%
100%
"Selective" "Non-selective" "True" Selective "True" NonSelective
Adult Male
Subadult Male
Subadult Female
Adult Female
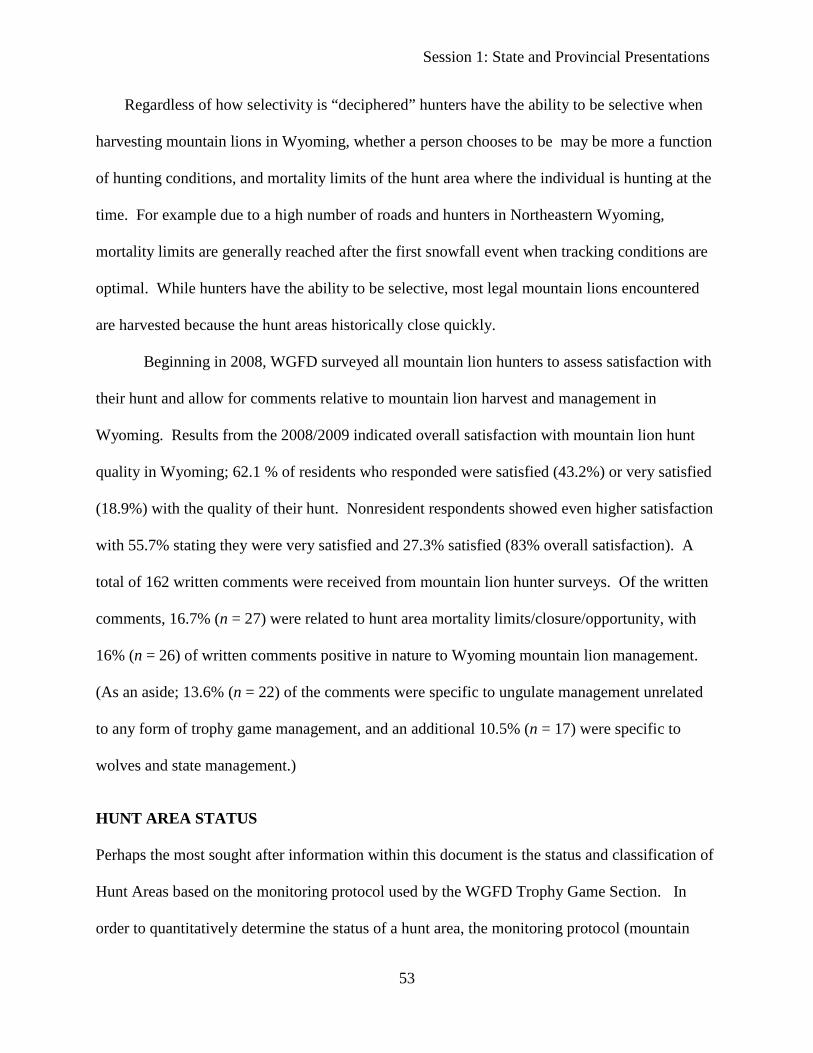
Session 1: State and Provincial Presentations
53
Regardless of how selectivity is “deciphered” hunters have the ability to be selective when
harvesting mountain lions in Wyoming, whether a person chooses to be may be more a function
of hunting conditions, and mortality limits of the hunt area where the individual is hunting at the
time. For example due to a high number of roads and hunters in Northeastern Wyoming,
mortality limits are generally reached after the first snowfall event when tracking conditions are
optimal. While hunters have the ability to be selective, most legal mountain lions encountered
are harvested because the hunt areas historically close quickly.
Beginning in 2008, WGFD surveyed all mountain lion hunters to assess satisfaction with
their hunt and allow for comments relative to mountain lion harvest and management in
Wyoming. Results from the 2008/2009 indicated overall satisfaction with mountain lion hunt
quality in Wyoming; 62.1 % of residents who responded were satisfied (43.2%) or very satisfied
(18.9%) with the quality of their hunt. Nonresident respondents showed even higher satisfaction
with 55.7% stating they were very satisfied and 27.3% satisfied (83% overall satisfaction). A
total of 162 written comments were received from mountain lion hunter surveys. Of the written
comments, 16.7% (n = 27) were related to hunt area mortality limits/closure/opportunity, with
16% (n = 26) of written comments positive in nature to Wyoming mountain lion management.
(As an aside; 13.6% (n = 22) of the comments were specific to ungulate management unrelated
to any form of trophy game management, and an additional 10.5% (n = 17) were specific to
wolves and state management.)
HUNT AREA STATUS
Perhaps the most sought after information within this document is the status and classification of
Hunt Areas based on the monitoring protocol used by the WGFD Trophy Game Section. In
order to quantitatively determine the status of a hunt area, the monitoring protocol (mountain

Session 1: State and Provincial Presentations
54
lion mortality density/1,000 km2, percentage of adult females in harvest, average age of adult
females annually) are used in combination and assessed over a three year period. Evaluation of
harvest and mortality over 3 harvest years helps to negate anomalous incidents related to
harvest/conditions and provide the minimum amount of data points (3) to assess trend relative to
harvest and how it relates to management objectives. The appendices of this document will have
a more in-depth discussion of how each hunt area was classified related to status, as well as
figures to illustrate determination of hunt area status. Figure 6 provides Hunt Area
classifications for Harvest years 2007-2009 in Wyoming. In general, hunt areas met objective
status, or were at least moving in the direction of the status objectives. Twenty-four of 31 Hunt
Areas met objective or were considered to be moving toward the objective status (Table 2). The
SW LMU had three hunt areas that did not meet “objectives” however at the time mortality
limits were developed, there was not a great deal of historical harvest or habitat data relative to
developing harvest numbers for those hunt areas (11, 12, and 13). Hunt Areas 26 and 27 both
appear to be moving toward sink status, but may need additional harvest years at the same level
of harvest to proceed to the point of full sink classification.
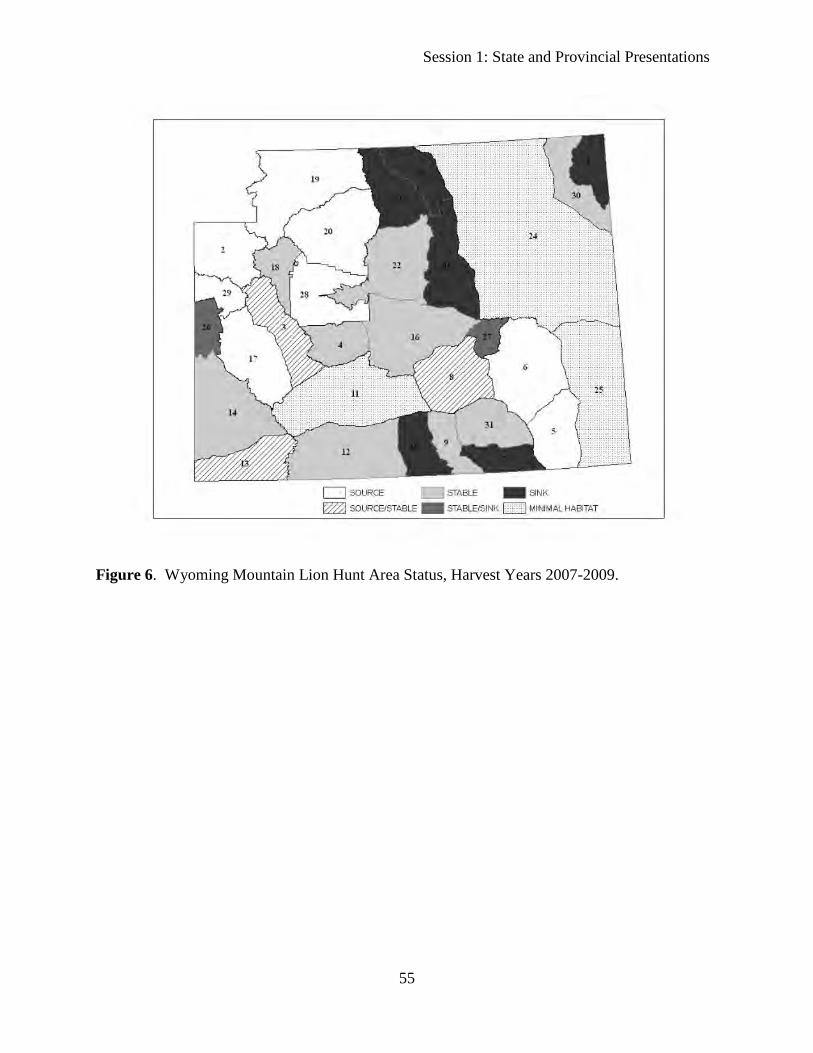
Session 1: State and Provincial Presentations
55
Figure 6. Wyoming Mountain Lion Hunt Area Status, Harvest Years 2007-2009.
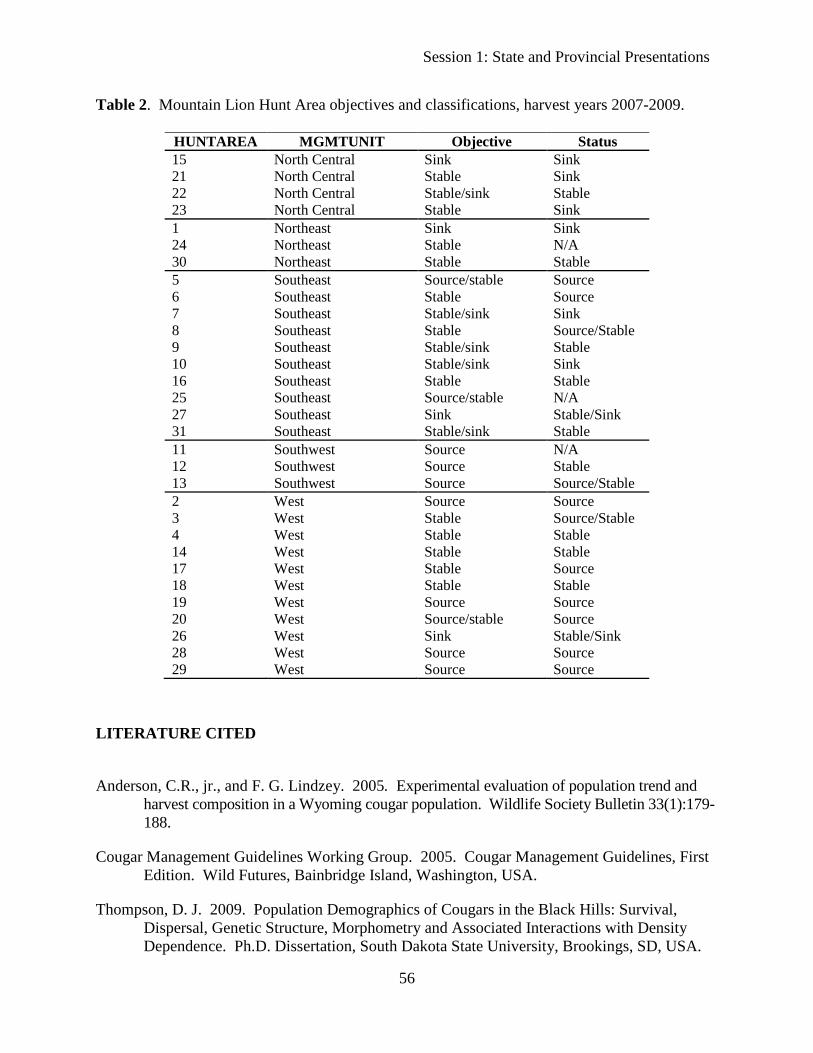
Session 1: State and Provincial Presentations
56
Table 2. Mountain Lion Hunt Area objectives and classifications, harvest years 2007-2009.
HUNTAREA MGMTUNIT Objective Status 15 North Central Sink Sink 21 North Central Stable Sink 22 North Central Stable/sink Stable 23 North Central Stable Sink 1 Northeast Sink Sink 24 Northeast Stable N/A 30 Northeast Stable Stable 5 Southeast Source/stable Source 6 Southeast Stable Source 7 Southeast Stable/sink Sink 8 Southeast Stable Source/Stable 9 Southeast Stable/sink Stable 10 Southeast Stable/sink Sink 16 Southeast Stable Stable 25 Southeast Source/stable N/A 27 Southeast Sink Stable/Sink 31 Southeast Stable/sink Stable 11 Southwest Source N/A 12 Southwest Source Stable 13 Southwest Source Source/Stable 2 West Source Source 3 West Stable Source/Stable 4 West Stable Stable 14 West Stable Stable 17 West Stable Source 18 West Stable Stable 19 West Source Source 20 West Source/stable Source 26 West Sink Stable/Sink 28 West Source Source 29 West Source Source
LITERATURE CITED
Anderson, C.R., jr., and F. G. Lindzey. 2005. Experimental evaluation of population trend and harvest composition in a Wyoming cougar population. Wildlife Society Bulletin 33(1):179-188.
Cougar Management Guidelines Working Group. 2005. Cougar Management Guidelines, First Edition. Wild Futures, Bainbridge Island, Washington, USA.
Thompson, D. J. 2009. Population Demographics of Cougars in the Black Hills: Survival, Dispersal, Genetic Structure, Morphometry and Associated Interactions with Density Dependence. Ph.D. Dissertation, South Dakota State University, Brookings, SD, USA.
57
Session 2:
Species Interactions and Predation
Proceedings of the 10th Mountain Lion Workshop
Cougars: Conservation, Connectivity and Population Management
Session 2: Species Interactions and Predation
58
Cougar Presence Influences Diet Optimization in Ungulate Prey David M. Choate, School of Life Sciences, University of Nevada, Las Vegas, 4505 S.
Maryland Pkwy, Las Vegas, NV 89154, USA, & The USGS Western Ecological Research Station, Henderson, NV 89074, [email protected] (presenter)
Gary E. Belovsky, Biological Sciences, University of Notre Dame, Notre Dame, IN 46556, USA, [email protected] Michael L. Wolfe, Dept. of Wildland Resources, 5230 Old Main Hill, Utah State University, Logan, UT 84322, USA, [email protected] Abstract: Risk-induced changes in prey behavior appear in many predator-prey communities, often triggering cascades to additional trophic levels when prey alter intake rates or diet selection; however, the fitness consequences of predation risk remain unclear. Natural colonization by cougars (Puma concolor) on the National Bison Range (Montana, USA) enabled the testing of predictions from foraging theory that assess the fitness consequences of predation-sensitive foraging decisions by ungulate prey. Diets of herbivores prior to colonization by cougars matched expectations based on an energy maximization foraging goal predicted by a linear programming model. Here, behavioral observations and new field data were used to re-parameterize the foraging models to predict diets for three prey species that differ in body size and anti-predator behavior: mule deer (Odocoileus hemionus) white-tailed deer (O. virginianus) and elk (Cervus elaphus). The models were solved for two goals - energy maximization or time minimization. The latter would be expected if prey reduce their feeding to minimum requirements in order to devote more time to anti-predator behaviors. In response to the increase in predation risk, none of the prey switched to a time-minimization foraging strategy. The largest and least vulnerable prey selected a diet that fit a new energy-maximization strategy but incurred an energetic cost for reduced feeding time. Diets selected by the smaller, more vulnerable prey appeared to be intermediate, suggesting a trade-off between energy maximization and time minimization. With the observed changes in feeding time when faced with predation risk, all three ungulates incurred a 5-38% reduction in daily surplus energy intake – a substantial effect of risk on summer foraging that could impact subsequent winter survival and reproduction. This study represents the first attempt to employ a mechanistic linear programming foraging model to evaluate alternate strategies and energetic costs of large ungulates foraging in the presence of predators.
Session 2: Species Interactions and Predation
59
Inter- and Intraspecific Competition in a Large Carnivore Guild Nathan F. Webb, Alberta Sustainable Resource Development, 9920 – 108 Street, Edmonton, AB
T5K 2M4; [email protected] (presenter) Kyle H. Knopff, Golder Associates Ltd, 102, 2535 – 3rd Avenue S.E., Calgary, AB T2A 7W5 E. H. Merrill, Department of Biological Sciences, University of Alberta, Edmonton, Alberta,
T6G 2E9, Canada, [email protected] M. S. Boyce, Department of Biological Sciences, University of Alberta, Edmonton, Alberta,
T6G 2E9, Canada, [email protected] Abstract: Historically, cougars and wolves were sympatric across much of North America, but range overlap was reduced to include only portions of Alberta, British Columbia and Montana during the 20th century. Wolf reintroduction in northwestern USA has sparked increased interest in understanding wolf-cougar niche partitioning, the effects of reintroduced wolves on cougar populations, and their combined effects of both predators on ungulate prey. However, most studies of wolf-cougar interactions have focused on recently reintroduced wolf populations and little is known about long-term dynamics of wolf-cougar systems. In west-central Alberta, cougars and wolves have persisted together throughout modern times, and both species currently exist at relatively high densities. We compared winter movement rates, habitat use, and ungulate predation patterns between wolves and cougars during 2003-2008 to investigate niche separation. Wolves were most active at dawn and dusk and moved nearly 3X as fast as cougars, while cougar movement rates and killing frequency both peaked during the evening. Cougars and wolves exhibited slightly different patterns of fine-scale habitat selection, with cougars tending to use areas with higher terrain ruggedness while avoiding forest openings. Male cougars used areas with more rugged terrain than either female cougars or wolves. Overall, wolves tended to kill more large-bodied prey species and fewer YOY prey than cougars, but male cougars were more similar to wolves than to female cougars in their predation patterns. We found that differences in hunting styles, habitat use, and body size altered prey selection between wolves and cougars, resulting in niche separation and reducing direct competition. Predator facilitation, where attempts by prey to avoid one predator put them at increased risk from the other, may also occur where wolves and cougars are sympatric.
Session 2: Species Interactions and Predation
60
Cougar Prey Composition and Predation Rates in a Multi-Prey Community in Northeast Oregon – Preliminary Results Darren A. Clark, Oregon Cooperative Fish and Wildlife Research Unit, Oregon State University,
104 Nash Hall, Corvallis, OR 97331, USA, [email protected] (presenter) Gregory A. Davidson, Oregon Department of Fish and Wildlife, 1401 Gekeler Lane, La Grande,
OR 97850, USA, [email protected] Bruce K. Johnson, Oregon Department of Fish and Wildlife, 1401 Gekeler Lane, La Grande, OR
97850, USA, [email protected] Robert G. Anthony, Oregon Cooperative Fish and Wildlife Research Unit, Oregon State
University, 104 Nash Hall, Corvallis, OR 97331, USA, [email protected]
Abstract: To better understand the impact of cougars (Puma concolor) on elk (Cervus elaphus) and mule deer (Odocoileus hemionus) populations in northeast Oregon, we are placing GPS collars on cougars to estimate prey composition and predation rates of cougars. Between January 2009 and October 2010, we monitored 16 GPS collared cougars for 4,910 days (x‾ = 307 days, range = 42-638 days). During this time, we investigated 1,913 potential predation sites and found prey remains at 675 (35%) of these sites. The remains of deer were located at approximately 65% of kill sites and remains of elk were located at approximately 30% of kill sites. Non-ungulate prey was present at the remaining kill sites. We located remains of 201 elk killed by cougars. Most of the elk killed were calves (79%) followed by adult (11%) and yearling (10%) elk. The remains of 455 individual deer were located at 440 predation sites. Mule deer were the most common deer species preyed upon (55%), followed by unknown deer species (25%), and white-tailed deer (Odocoileus virginianus; 20%). Out of all deer killed by cougars, 49% were fawns, 36% were adults, 9% were yearlings, and 6% were of unknown age. Seasonal patterns in deer predation were evident, with a higher percentage of fawns being killed in the summer than in the winter. On average, cougars in our study area killed one ungulate every 6.71 days. Strong patterns in seasonal predation rates are evident, with predation rates in June being the highest (4.41 days per kill) and lowest in March (13.62 days per kill). Our research is ongoing and results will be updated.
Session 2: Species Interactions and Predation
61
Cougar Prey Composition and Predation Rates in Central Utah
Dustin L. Mitchell, Department of Wildland Resources, Utah State University, Logan, UT 84322-5230, USA, [email protected] (presenter)
Michael L. Wolfe, Department of Wildland Resources, Utah State University, Logan, UT 84322-
5230, USA, [email protected] David C. Stoner, Department of Wildland Resources, Utah State University, Logan, UT 84322-
5230, USA, [email protected] Abstract: We studied cougar (Puma concolor) prey use in a multi-prey system consisting of mule deer (Odocoileus hemionus), elk (Cervus elaphus) and livestock, on three mountain ranges in central Utah. Our goal was to determine: (1) cougar prey composition; (2) age and sex classes of prey; and (3) predation rates. Between May 2003 and October 2010, we investigated potential kill sites of 23 adult cougars (18 females, 5 males) equipped with global positioning system (GPS) collars. We ground truthed potential kill sites based on GPS cluster locations, accessing the sites with the aid of hand held GPS units. The sites were systematically searched within a 100 m radius from the mean of the cluster location for 30 minutes or until evidence of a kill was found. Demographic and habitat information (species, sex, age, vegetation) were recorded for all prey remains located. We identified 910 potential kill sites and ground truthed 773 sites. Of these, we found 518 prey remains. Prey composition consisted of 11 species, of which mule deer comprised 88%, with elk and livestock accounting for 5% and 2%, respectively. The age composition of the deer remains encountered was: juveniles 16%, yearlings 13% and adults 63%). Elk were taken more frequently by males than females (78% vs. 22%). Mesocarnivores and porcupines (Erethizon dorsatum) were more commonly associated with subadult and senescent individuals. We also documented 3 scavenging and multiple surplus killing events. Of all the predation events documented 47% occurred in gambel oak (Quercus gambelii) vegetation. These data have utility in a management context, including: (1) parameterization of cougar predation-impact models, (2) identification of predation refugia for mule deer, and (3) construction of a framework for using prescribed burning to improve forage while minimizing predation risk to mule deer.
Session 2: Species Interactions and Predation
62
Sex Matters: Dietary Strategies of Male and Female Cougars on the Southern Colorado Plateau Brandon Holton, U.S. National Park Service, Grand Canyon National Park, Science and
Resource Management, P.O. Box 129, Grand Canyon, AZ 86023 USA, [email protected] (presenter)
David J. Mattson, U.S. Geological Survey (USGS) Southwest Biological Science Center, P.O.
Box 5614, Northern Arizona University, Flagstaff, AZ 86011, USA, [email protected]
Abstract: Sexual dimorphism can result in males and females of the same species occupying different niches, with implications for management. We report preliminary results of a long-term study of cougars (Puma concolor) on the southern Colorado Plateau that reveal different sex-specific dietary strategies. To date, our sample of cougar kills is >630, of which 225 were investigated within 9 days of when the kill happened, and 433 within 32 days. By design, the 60 cougars studied to date were tracked in 3 study areas that encompassed a wide range of biophysical conditions and prey availability. Sex had a stronger effect on size of kills than did either cougar size, as such, or study area, with male kills averaging nearly twice the size of female kills. Much of this difference was attributable to the much greater proportion of elk among male kills, compared to mule deer (Odocoileus heminous) among female kills, controlling for intervening effects. Compared to males, females consistently more often drug (60%) and buried (75%) their kills (versus 40-75% and 30-70%, respectively, for males), and also more thoroughly consumed their kills (87% of estimated edibles), at a more leisurely rate (typically c. 1.5 kg/hr). Males consumed 40-75% of edibles from kills, at a rate of approximately 2.0-3.2 kg/hr. The longer kill intervals of females (7.5 dys) and smaller mass of their kills (50-60 kg) during most of the year yielded low average ingestion rates (8.5 kg/dy). However, during winter, ingestion rates increased to 15 kg/dy. With the exception of spring, males killed prey 60-125 kg in size at average 3.5-7 day intervals, which yielded ingestion rates of around 19.5 kg/dy. These results regarding predatory behavior suggest that female cougars in our study areas were employing an energy maximizing foraging strategy whereas males were employing a time minimizing strategy.
Session 2: Species Interactions and Predation
63
Prey Switching, Specialization, and Multi-Species Functional Response in Cougars: Implications for Small Populations of Alternate Prey Kyle H. Knopff, Golder Associates Ltd., 102, 2535 - 3rd Avenue S.E., Calgary, Alberta T2A
7W5, Canada, www.golder.com (presenter) Mark S. Boyce, Department of Biological Sciences, University of Alberta, Edmonton, AB T6G
2E9, Canada, www.biology.ualberta.ca Abstract: Predation by generalist predators (e.g., cougars) in multi-prey systems has the potential to limit small populations of alternate prey and even contribute to extinction through apparent competition. Accurate prediction of species-specific predation rates may depend on understanding of multi-species functional response (MSFR). Our primary objectives were to investigate prevalence of prey switching and individual specialization and to distinguish the primary drivers of cougar MSFR. We studied the MSFR of cougars preying on 6 species of wild ungulates in west-central Alberta, Canada. Data were derived from continuous monitoring of predation by 37 cougars over an average of 241 consecutive days (SD = 125 days), yielding a total of 1,093 ungulate predation events. Prey switching by cougars was weakly supported by the data, and there was substantial evidence for specialization. Specialist predators occasionally contravened the switching pattern by focusing on less-abundant prey within the home range. Male cougars specialized most often on large prey (e.g., moose, elk, feral horses), while females focused exclusively on smaller prey (e.g., deer, bighorn sheep). Contrary to expectation, cougar MSFR was not driven by prey density or habitat variables, but rather by cougar demography and relative abundance of alternative prey. Our results indicate that cougars are efficient predators, capable of maintaining high kill rates even as prey density declines. A weak relationship between prey density and predation rate means that cougar predation is more likely limiting than regulating. The risk posed by cougars to small populations of endangered prey is ameliorated by a tendency towards prey switching (stabilizing), but can be exacerbated by the presence of individual specialists (destabilizing). Targeted removal of individual specialists might be an effective strategy for managing the effects of cougar-mediated apparent competition.

64
Session 3: Poster Presentations
Session 3: Poster Presentations
65
Characterizing Cougar Predatory Behaviour from Fine Scale Movement Data Jeremy E. Banfield, University of Alberta, CW-405 Biological Sciences Building, Edmonton,
AB T6G2E9, Canada, [email protected] (presenter) Mark S. Boyce, University of Alberta, Z-907 Biological Sciences Building, Edmonton, AB
T6G2E9, Canada, [email protected] Abstract: It is generally accepted that cougar (Puma concolor) hunt and kill prey by stalking; using stealth to reduce the distance between themselves and prey before initiating a final attack. However, support for this is limited to a few anecdotal observations and descriptions of snow-tracking. Few studies have described this predatory behaviour based on fine scale movement data. Using GPS location data from 6 collared cougars with a between-fix-interval of 15 minutes, we examined movement metrics (i.e. step length and turning angle) created by cougars just prior to making a kill. We combined these metrics with data from GPS clusters visited in the field (i.e. kill/no-kill). We assumed that prior to making a kill; a cougar is “hunting” and in a state of predatory behaviour. Using cluster analysis we plan to sub-divide movement metrics made prior to kills into distinct groups. Ultimately, we will describe cougar predatory behaviour by categorizing it into unique movement states such as search, stalk and travel between consecutive searches. By breaking cougar predatory behaviour into quantifiable components we then hope to develop a measure of predation success from the ratio of stalk attempts/stalks resulting in a kill. It should be noted that this study is currently in the latter stages of field data collection and the final results are not expected until Jan 2012. As such, the methods, preliminary results and plans for future analysis will be presented.
Session 3: Poster Presentations
66
Cougar Ecology, Predation, and Caribou in the Columbia Mountains of British Columbia Corey Bird, Corey Bird & Associates, PO Box 2652, Revelstoke, BC, V0E 2S0,
[email protected] Ross Clarke, R Clarke Environmental Services, 663 Parkview Rd, Nelson, BC, V1L 6H6,
[email protected] Dave Lewis, PO Box 269, Edgewater, BC, V0A 1E0, [email protected] Rob Serrouya, Columbia Mountains Caribou Project, RPO#3, Box 9158, Revelstoke, BC, V0E
3K0, [email protected] Abstract: Much of the recent decline of mountain caribou (Rangifer tarandus) populations in British Columbia has been attributed to an increase of other large ungulates and their predators following broad-scale habitat modification. In response to the decline of caribou in the Columbia Mountains (CM), the Fish and Wildlife Compensation Program began a cougar (Puma concolor) project in 2006 to: 1) determine their distribution, 2) quantify their overlap with mountain caribou, and 3) determine their prey selection and kill rates. Between 2006 and 2009, we monitored 3 GPS-collared cougars (1 adult male, 1 adult female, and 1 sub-adult male) as well as 1 VHF-collared cougar (adult female). We used GPS data to investigate 200 of a total 634 multiple-point cluster locations and found prey remains at 101 of those clusters. Although our cougar sample was small, we found that caribou comprised of a small proportion (3 of 101 total kills) of the cougar diet and that alternate prey such as deer, moose, elk, and beaver were the predominant prey species selected. However, this amount of predation can still be sufficient to negatively affect a small caribou population that lives in the study area. In quantifying cougar overlap with caribou habitat, we found that cougars spent the largest proportion of time in lower quality caribou habitat for all seasons but that there was overlap with higher quality habitat during the spring, summer, and early winter suggesting a relatively higher predation risk to caribou during those seasons. A similar pattern was seen in the overlap of non-caribou cougar kills, where non-caribou prey were killed in higher quality caribou habitat during the spring, summer, and early winter. Although our sample size was small, it represented a significant proportion of the cougars in the study area (3 of 6-7cougars). In this context, our dataset suggests that alternate prey make up the predominant prey species for cougars in this area which suggest at least partial credence to the apparent competition hypothesis.
Session 3: Poster Presentations
67
Conservation Implications of Tiger Predation Dynamics in the Russian Far East: New Insights from GPS Collars Clayton S. Miller, Wildlife Conservation Society, Bronx, NY and Wildlife Biology Program,
College of Forestry and Conservation, University of Montana, Missoula MT (presenter) Yuri K. Petrunenko, Pacific Geographical Institute, Vladivostok, Russia. Mark Hebblewhite, Wildlife Biology Program, College of Forestry and Conservation, University
of Montana, Missoula, MT Ivan V. Seryodkin, Pacific Geographical Institute, Vladivostok, Russia. John M. Goodrich, Wildlife Conservation Society, Bronx, NY. Dale G. Miquelle, Wildlife Conservation Society, Bronx, NY. Abstract: Prey depletion is one of the primary short-term threats to Amur tigers (Panthera tigris altaica). Therefore, improved ungulate management is essential for the survival of this northernmost tiger subspecies, particularly as the vast majority of Amur tiger habitat in the Russian Far East (RFE) is comprised of unprotected, multiple-use forest lands where both tigers and hunters rely on the same prey base. Russian wildlife management agencies currently adjust legal ungulate harvests to account for the estimated number of ungulates needed to sustain tigers. Rigorous data on tiger kill rates are lacking, but are needed to inform this approach. Unfortunately, information on kill rates of Amur tigers outside the winter season has been difficult to obtain, and existing winter estimates vary greatly. Recent advances in Global Positioning System (GPS) collar technology have enabled researchers to gain insights into year-round predator-prey dynamics for many carnivores, but until recently, no one had applied this approach to tigers. Our project is the first to use GPS technology to expand existing scientific knowledge of year-round tiger-prey dynamics in the RFE, improve methods to estimate kill rates and contribute practically to sustainable wildlife management. We will also develop a tiger energetics model using information from the literature to estimate the energy budget of tigers, and test the model using GPS-based, empirically derived movement rates and kill/consumption rates. This model will provide estimates of tiger food requirements and facilitate understanding of which suite of prey sizes are likely to ensure successful reproduction. Quantifying the energetic requirements of tigers will allow conservationists and wildlife managers to estimate adequate prey population sizes, better identify critical prey species and promote science-based recommendations for ungulate management. An improved understanding of tiger energetics has implications for conservation efforts across all tiger range countries.
Session 3: Poster Presentations
68
Cougar Response to a Seasonal Flux of Human Use in Insular Cougar Habitat Carl D. Morrison, University of Alberta, CW CW405 Biological Sciences Building, Edmonton,
AB, Canada, T6G 2E9, carlm@ualberta Boyce S. Mark, University of Alberta, CW405 Biological Sciences Building, Edmonton, AB,
Canada, T6G 2E9, [email protected] Abstract: The Cypress Hills, located in southeastern Alberta and southwestern Saskatchewan, is characterized by an isolated foothill eco-zone surrounded by a vast expanse of native grasslands, ranchlands, agricultural and rural development. Cougars (Puma concolor) have recently re-colonized this island-like portion of their former range and exist in very high density (6.5-8.25 cougars/ 100km2). The hills also form the basis for Cypress Hills Interprovincial Park which attracts approximately 500 000 visitors seasonally. The high density of cougars and humans using the same area raises questions about how to manage this shared environment. Large carnivores can alter the distribution and abundance of herbivores ultimately influencing the communities and ecosystems in which they exist. However, large carnivores can evoke heated social, political and legal conflicts which can influence the management, and ultimately the ecological function, of these species. Our research will examine the ecological implications associated with the return of cougars to the Cypress Hills including 1) seasonal variation in habitat selection and movement in an isolated and fragmented landscape and 2) seasonal changes in potential human-cougar interactions and conflict. GPS radiocollared cougars, traffic counters and remote cameras will be used to monitor the spatial and temporal patterns of human and cougar use. We hypothesize that the Cypress Hills cougar population is structured into three resident subpopulations occurring in distinct patches of forested habitat with travel between habitat patches limited to dispersing juvenile cougars. At a finer scale we expect that cougars will shift their seasonal distribution avoiding areas with a seasonal pulse in human use and that the extent of this spatial shift will be constrained by the spatial and temporal availability of suitable habitat.
Session 3: Poster Presentations
69
Effects of Trophy Hunting on Female Cougar Population Growth and Persistence Dana E. Morrison, Washington State University, Large Carnivore Conservation Lab, Dept.
Natural Resource Sciences, Washington State University Pullman, WA 99164-6410, USA. Email: [email protected]
Rob B Wielgus, Washington State University, Large Carnivore Conservation Lab, Dept. Natural
Resource Sciences, Washington State University Pullman, WA 99164-6410, USA. (509) 335-2796, Email: [email protected] (presenter)
Gary M. Koehler, Washington Department of Fish and Wildlife, 600 Capital Way North,
Olympia, WA 98501-1091. [email protected]
Hilary Cooley, Washington State University, Large Carnivore Conservation Lab, Dept. Natural Resource Sciences, Washington State University Pullman, WA 99164-6410, USA
Ben Maletzke Washington State University, Large Carnivore Conservation Lab, Dept. Natural
Resource Sciences, Washington State University Pullman, WA 99164-6410, USA Abstract :Carnivore populations are managed based on the density dependent, compensatory mortality model, which suggests that trophy hunting of males causes an increase in female reproductive success, survival, and population growth. Previous research on cougars showed that increased mortality of males resulted in no net reduction in males due to increased immigration. Female reproduction and survival did not increase with male mortality. That research suggested that female demographics are additive to male mortality and might even be depensatory (inversely compensatory), whereby increased male immigration and infanticide may be associated with decreased female reproductive success, survival, and population growth. In this paper we test the compensatory, additive, and depensatory hypotheses by censoring incidental female hunting deaths and plausible kitten infanticides from two independent cougar populations. The previously observed lack of compensatory demographics allowed us to censor deaths in this manner. The lightly hunted population (male hunting mortality = 0.16) had a female population growth rate of 1.05. With incidental female mortality from hunting removed the growth rate increased to 1.14. The heavily hunted population (male hunting mortality = 0.35) had a female population growth rate of 0.78. With plausible infanticide removed the growth rate increased to 0.89. With hunting mortality of females removed, the growth rate increased to 0.98. With both female mortalities and infanticide removed, the growth rate increased to 1.14. Light hunting of males (no net male immigration) decreased female population growth in an additive manner and heavy hunting of males (increased net male immigration) decreased female population growth in a depensatory manner. We reject the compensatory mortality hypothesis, and suggest that hunting of males has a negative additive or depensatory effect on female population growth depending on the intensity of male mortality.
Session 3: Poster Presentations
70
Exclusive Use of Riparian Habitat by a Population of Puma in Central New Mexico Travis Perry, Department of Biology, Furman University, Greenville, SC, 29613, USA,
[email protected] Eric Anderson, Room 100, College of Natural Resources, UW-Stevens Point, WI 54481, USA,
[email protected] Megan Pitman, Department of Forestry and Natural Resources , 261 Lehotsky Hall, Clemson
University, Clemson, SC 29634 [email protected] Brendan Talwar, Department of Biology, Furman University, Greenville, SC 29613, USA,
[email protected] Brianna Upton, Department of Biology, University of New Mexico, Albuquerque, 87108, USA,
[email protected] Abstract: Understanding metapopulation dynamics of puma (Puma concolor) is critical for their successful long-term management and conservation. Riparian areas have been recognized as potentially critical dispersal corridors for puma, particularly in the Southwest and Midwest where there may be large areas of inhospitable matrix dividing suitable habitat patches. We describe the movement, home range, and prey selection characteristics of a resident puma population (3 males, 2 females), that confine their movements almost exclusively to the relatively narrow middle Rio Grande flood plain of New Mexico. Implications of resident puma populations in narrow strips of riparian habitat for puma conservation, dispersal, and recolonization of the Midwest are discussed.
Session 3: Poster Presentations
71
Mule Deer and Elk Adhere to Puma Induced Landscape of Fear in Southwestern New Mexico Travis Perry, Department of Biology, Furman University, Greenville, SC, 29613, USA,
[email protected] Megan Pitman, Department of Forestry and Natural Resources , 261 Lehotsky Hall, Clemson
University, Clemson, SC 29634 [email protected] Michael Jiang, Department of Biology, Furman University, Greenville, SC 29613, USA,
[email protected] Abstract: Large carnivores may alter the distribution of prey species as the prey select habitat based on predation risk, or evaluate the ‘landscape of fear’. We hypothesized that mule deer (Odocoileus hemionus) and elk (Cervus elaphus) would both exhibit different spatial distribution patterns than puma (Puma concolor) based on this ‘landscape of fear’ assumption. Using GPS collar data from 3 male and 3 female puma along with data from 175, 200m sq, ungulate pellet plots, we found that habitat use of both mule deer and elk differed significantly from that of puma at the landscape (~500Km sq) scale. Further, using data from 14,240 camera nights of data collected from 25 remote cameras distributed in a 100Km sq grid a Poisson regression revealed significant negative associations between puma and both mule deer and elk, consistent with our hypothesis. However, at this time we cannot rule out the possibility that simple differences in habitat preference are responsible for this pattern.
Session 3: Poster Presentations
72
Developing a Management Tool to Estimate Unmarked Puma Populations with a Remote Camera Array Megan E. Pitman, Clemson University, 20 Regent Dr., Greenville, SC 26917, USA
[email protected] Travis W. Perry, Furman University, Department of Biology, 3300 Poinsett Hwy., Greenville,
SC 26913, USA, [email protected] Abstract: Remote camera traps placed in an array present a promising new tool for surveying cryptic mammals. Techniques for estimating population levels of unmarked animals or species that do not have individual markings are needed. Our goal was to develop a technique using a remote camera array (1) to determine the camera effort needed to detect resident pumas (Puma concolor) with 95% certainty and (2) to estimate the puma density of an unmarked puma population. An array of 25 cameras spread 2km apart in a square grid covering an area of 100km2 was used to monitor the detection of 5 individually marked pumas. Photographic captures and GPS collar data for one male and one female puma were used to estimate the mean number of camera nights required to reach a detection probability of 95% for a single puma within the camera array for any number of cameras (1-25). These estimates were used to develop a technique to calculate puma density based on the number of cameras in the array, camera nights included in the survey, and puma photos captured. Population estimates were calculated from 71 days of camera data, including 1,220 camera nights. A mark-resight population estimate yielded a puma density of 2.1 (1.7-4.4) pumas/100km2. Our population estimate based on photo capture rate yielded 1.8 (1.4-2.2) pumas/100km2 and fell within the 95% confidence interval of the mark-resight estimate. These results suggest that a remote camera array can be used to accurately estimate puma population density based only on unmarked pumas.
Session 3: Poster Presentations
73
Assessing Spatial Dynamics of Cougars in North-central Montana: Distribution, Resource Selection, Population Dynamics, and Conservation Design Cody Welch, Chippewa Cree Tribal Wildlife Program, Rocky Boy, Montana;
[email protected] Kyran Kunkel, Conservation Science Collaborative and World Wildlife Fund, Northern Great
Plains Program, Gallatin Gateway, Montana Tim Vosburgh, Chippewa Cree Tribal Wildlife Program, Rocky Boy, Montana Sarah Olimb, World Wildlife Fund, Northern Great Plains Program, Bozeman, Montana Abstract: Cougars use large scale landscapes and require cooperative management and conservation at multi-jurisdictional scales. Montana manages cougars based on regional habitat capabilities, however, little is known about capabilities of landscapes in the island mountain ranges of northeastern Montana or the Missouri River Breaks, nor of current population levels or viability. We began a study in 2006 with objectives including: 1. Obtaining a minimum count estimate; 2. Obtaining estimated rate of mortality, density, distribution, and reproduction; 3. Obtaining estimates of landscape composition of home ranges; 4. Estimating connectivity between island mountain ranges and the Missouri River Breaks; and 5. Obtaining estimates of conflicts between cougars and livestock. We placed GPS collars on 6 females and 8 males in the Bears Paw and Little Rocky Mountain ranges. Hunters harvested 9 and 2 died of natural causes. From December 2006 - May 2010, overall survival rate was 0.01. Hunter harvest mortality rate for that period was 0.81. Mean number of months alive post capture for cougars was 8 (range = 1-12). One cougar dispersed from the Bears Paws to the Little Rockies. We estimate the core habitat for cougars in the Bears Paws is about 260 km2
yielding a density of 1.5 adult cougars/100 km2 during periods of known high population and a density of 0.7/100 km2
during periods of lowest known population. Three female home ranges ranged from 95-326 km2
. Five male home ranges ranged from 160-472 km2. The composite home range for 8 cougars was 931 km2. Most cougar locations were within habitats we predicted and defined as cougar habitat based on ruggedness and forest cover models. Investigations are continuing with attempts to collar additional cougars in the Bears Paw and Little Rocky Mountains, and 5 cougars were collared in the Missouri River Breaks during January-March, 2011.
Session 3: Poster Presentations
74
Differential Prey Use by Male and Female Cougars in Washington Kevin R. White, Large Carnivore Conservation Laboratory, Department of Natural Resource
Sciences, Washington State University, Pullman, WA, 99164-6410, USA, [email protected]
Gary M. Koehler, Washington Department of Fish and Wildlife, Olympia, WA, 98501, USA [email protected] Benjamin T. Maletzke, Large Carnivore Conservation Laboratory, Department of Natural
Resource Sciences, Washington State University, Pullman, WA, 99164-6410, USA, [email protected]
Robert B. Wilegus, Large Carnivore Conservation Laboratory, Department of Natural Resource Sciences, Washington State University, Pullman, WA, 99164-6410, USA, [email protected] (presenter)
Abstract: Male and female predators are usually assumed to have the same effects on prey. However, because of differences in body size and behavior, male and female predators may use different species, sexes, and ages of prey. This could have important implications for wildlife conservation and management. We tested for differential prey use by male and female cougars (Puma concolor) from 2003-2008 in Washington State. We predicted that male cougars would kill a greater proportion of larger and older prey (adult elk, Cervus elaphus), while solitary females and females with dependent offspring would kill smaller and younger prey (elk calves, mule deer, Odocoileus hemionus). We marked cougars with Global Positioning System (GPS) radio collars and investigated 436 predation sites. We located prey remains at 345 sites from 9 male and 9 female cougars. We found prey remains at 127 sites for solitary females, 111 sites for females with dependent offspring, and 107 sites for males. We detected 184 mule deer, 142 elk, and 17 remains from 4 other species. We used log-linear modeling to detect differences in species and age of prey killed among cougar reproductive classes. Solitary females and females with dependent offspring killed more mule deer than elk (143 vs. 83, P < 0.01), while males killed more elk than mule deer (59 vs. 41, P < 0.01). Proportionately, males killed 4 times as many adult elk than females (24% vs. 6% of kills) and females killed twice as many adult mule deer than males (26% vs. 15% of kills). Managers should consider the effects of sex of predator in conservation and management of ungulates, particularly when managing for sensitive, threatened or endangered species.

75
Session 4: Felid Population Segments of Concern
Wild Felid Research and Management Association (WFA)
Proceedings of the 10th Mountain Lion Workshop
Cougars: Conservation, Connectivity and Population Management
Session 4: WFA – Felid Population Segments of Concern
76
Jaguars in Peril: The Next 100 Years Rodrigo A. Medellin, Arizona-Sonora Desert Museum and Instituto de Ecología, Universidad
Nacional Autónoma de México, 2021 N Kinney Road, Tucson, AZ 85743, [email protected] (presenter)
Abstract: Jaguars are deeply intertwined with humans wherever they exist. They have been incorporated into the culture of innumerable pre-Columbian indigenous groups, and also are currently considered modern symbols of power, strength, and superiority. At the same time, unfortunately, jaguar numbers continue to dwindle. At a recent continent-wide conference, we identified that the single most important factor determining jaguar mortality is not deforestation or hunting of prey, but direct jaguar killing. Hundreds of jaguars are killed every year across Latin America for any number of unfounded reasons. Today, Mexico has become the first country to have a nation-wide estimate of the jaguar population. The National Jaguar Census is a multisectoral effort to survey jaguars across the Mexican territory. Mexico has also produced a National Jaguar Conservation Strategy and with the aid of a protocol to aid livestock operations in cases of jaguar predation, the country is on the road to secure the future of its jaguar populations, although time is running out. The continent-wide experts who met to evaluate the status of jaguars signed an open letter to all federal governments of Latin America demanding attention to the severe problem of jaguar killing. To continue along those lines and given the similarities in ecology and differences in conservation status, Mexico has signed an agreement with the Kenya Wildlife Service to carry out a workshop to compare the ecology, natural history, and conservation needs of jaguars and leopards. The coin is in the air; much more needs to be done in the next 20 years if we are to secure the future of the jaguar. With a strong, diverse group working in many areas, exchanging and comparing data, and collaborating, this challenge is feasible.
Session 4: WFA – Felid Population Segments of Concern
77
Vulnerability of the Ocelot Populations in the United States Michael E. Tewes, Caesar Kleberg Wildlife Research Institute, MSC 218, 700 University Blvd., Texas A&M University-Kingsville, Kingsville, TX 78363, USA, [email protected] (presenter) Arturo Caso, Caesar Kleberg Wildlife Research Institute, MSC 218, 700 University Blvd., Texas A&M University-Kingsville, Kingsville, TX 78363, USA, [email protected] Jody Mays, U.S. Fish & Wildlife Service, Laguna Atascosa National Wildlife Refuge, Los
Fresnos, TX 78566, USA, [email protected] Jan E. Janecka, College of Veterinary Medicine, Texas A&M University, College Station, TX
77843, USA, [email protected] W.C. Stasey, Caesar Kleberg Wildlife Research Institute, MSC 218, 700 University Blvd., Texas A&M University-Kingsville, Kingsville, TX 78363, USA, [email protected] John H. Young, Texas Parks & Wildlife Department, 4200 Smith School Road, Austin, TX
78744, USA, [email protected] Abstract: The only known resident populations of ocelot (Leopardus pardalis) in the United States occur in southern Texas. Our research and monitoring for the past 30 years has yielded valuable information and insight into the vulnerability of this endangered felid. The two populations in Texas are isolated, occupy a constellation of small, fragmented habitat tracts, and experience high mortality on roads. Each population is likely less than 40 individuals with no documented exchange. Genetic erosion in the ocelot populations of Texas has occurred over the past 25 years, while heterozygosity and allelic richness maintain higher levels in northeast Mexico. Population viability analyses suggest vulnerability of the two populations in the United States. Catastrophic events further threaten these populations, including extreme and frequent drought, disease epidemics and uncontrolled wildfire under certain burning conditions. For long-term benefits, habitat restoration near the core populations is being actively undertaken for both populations and will ultimately facilitate population stability. Additionally, conservation strategies are being implemented that will mitigate road mortality, including placement of culvert passages with appropriate fencing. Immediate benefits could be derived from demographic and genetic augmentation of the ocelot population from vital, healthy sources. Finally, the establishment of one or more new populations within the former range would lessen the vulnerability of the ocelot in the United States.
.
Session 4: WFA – Felid Population Segments of Concern
78
Don’t Eat the Shrimp Jim Sanderson, Ph.D., University of Arizona Wildcat Research and Conservation Center, Small
Wild Cat Conservation Foundation, Wildcat Conservation Network, Feline Conservation Federation, IUCN Cat Specialist Group, and School of Natural Resources and the Environment, Tucson, AZ 85721, [email protected] (presenter)
Abstract: Currently six felids are ranked Endangered by the IUCN Cat Specialist Group. Two are big cats, the tiger and snow leopard, and four are small cats: Andean cat, Bay cat, Fishing cat and Flat-headed cat. While tiger and snow leopard conservation programs are well-funded, money flowing into conservation efforts of small cats is a mere trickle. Best estimates of the total Andean cat population are 2200 individuals, only 2/3 that of the estimated wild tiger population. While there are many tigers and snow leopards in zoos throughout the world, no Andean cats are found in captivity. Conservation actions that reduce threats to all species, especially small cats, are urgently needed. A few conservationists’ actions are necessary but not sufficient. Broad public support is needed. But how can the public help to reduce threats to species living far beyond their home country’s borders? Understanding the threats and informing the public of specific actions they can take that will make a difference is one way to harness the broad public support that is vital to saving these species from extinction. Biodiversity loss is widely recognized to be the most serious global threat to the well-being of humans. Many argue that the sixth mass extinction is well underway with losses of species exceeding 10 to 100 times historical rates. Though many people might reject the existence of global warming and ocean acidification, there is widespread recognition that species and habitats are disappearing. With this recognition, however, comes frustration about how the average person can help stem these losses. For instance, what positive steps can a person in Arkansas take to help save a wild cat that exists on the other side of the planet? One course of action is to stop eating shrimp.
The IUCN Cat Specialist Group considers six members of the Felidae to be globally endangered.
While many millions of dollars are invested annually in snow leopard and tiger conservation
efforts, far fewer dollars are spent on conservation efforts aimed reducing threats to Andean cat,
bay cat, fishing cat, and flat-headed cat. Certainly much of this lack on investment in small cat
conservation is due to a severe lack of awareness of the plight of these four small cats.
Moreover, the threats to these cats have not been articulated clearly. Surely conservation efforts
cannot be mobilized if the threats to these cats are not clearly understood. In fact, the many
threats faced by these small wild cats are well known and courses of action to reduce and
mitigate these threats are being taken. In some cases reducing global demand created by a

Session 4: WFA – Felid Population Segments of Concern
79
largely ignorant public for certain products marketed by some of the world’s largest companies is
a formidable task.
THE TALES OF THREE WILD CATS
For at least three small cats, Andean cat, fishing cat, and flat-headed cat, threats are well known.
Dealing with these threats is a different matter altogether. This is because each cat faces unique
threats so that solutions designed to deal with threats to one cat do not apply to other cats.
Because these cats are small, they do not pose a direct threat to humans. No records of attacks
on humans has ever been recorded.
Populations of Andean cat have been reduced by direct killing, loss of prey due to
competition from humans, loss of fresh water due to industrial scale mining, competition from a
competitor those populations have increased due to an introduced prey species, and global
warming that threatens the long-term existence of Andean glaciers and the fresh water they
supply to the prey of Andean cats.
Humans and their poultry pose a direct threat to fishing cats. A fishing cat that is tempted
by free-ranging chickens eventually becomes a dead cat. Fed by a growing global consumer
demand, the widespread conversion of coastal wetlands to support industrial-scale shrimp and
fish ponds is the direct cause of massive losses of prime fishing cat habitat. Moreover, because
ponds become polluted in less than ten years and are simply abandoned and never restored more
wetland must be converted.
The flat-headed cat is very poorly known and does not pose a threat to humans. Like the
fishing cat, a flat-headed cat that attempts to prey upon poultry does not live long. Like the
fishing cat the main prey of the flat-headed cat is fish, frogs, and other creatures inhabiting
wetlands in Southeast Asia. The cancerous replacement of tropical hardwood forest and the
immense biodiversity contained within it by oil palm plantations across peninsular Malaysia and
Indonesia including Sumatra and Borneo (the entirely of the flat-headed cat’s geographic range)

Session 4: WFA – Felid Population Segments of Concern
80
has caused a dramatic decline in flat-headed cat populations. Palm oil is found in many
consumer products used daily by humans. Both Malaysia and Indonesia have state goals of
becoming the world’s largest producers of palm oil. Indeed the demand by global consumers for
such products has recently led to an agreement between Malaysia and Brazil to establish oil palm
plantations in the Amazon Basin. Once again global companies market these products to
ignorant consumes who become unwitting accomplices supporting the Sixth Mass Extinction.
Conservation strategies for Andean cat, fishing cat, and flat-headed cat
In the case of the fishing cat and flat-headed cat the cause of their endangerment is widespread
habitat destruction caused by global consumer demand for products whose origin and destructive
nature they have absolutely no understanding of. Thus, the task of conservationists is to increase
awareness among consumers that shrimp and fish pond such as those in Thailand, and products
that contain palm oil are causing widespread habitat loss. Such products must be avoided.
Indeed, conservationists are educating consumers that they are in fact partly responsible for the
decline in populations of fishing cats, flat-headed cats, orangutans, and other creatures inhabiting
what little remains of natural forests and wetland in Southeast Asia.
For the Andean cat, other conservation actions are necessary. Few people live in the high
Andes of Argentina, Bolivia, Chile, and Peru. The inhospitable climate and lack of rainfall make
agriculture impossible. Unfortunately those people that do live in the Andes believe that cats are
sacred and hold supernatural powers that can be harnessed only when the cats are killed, dried,
and elaborately decorated. Unless consumers can halt global warming by their actions, there is
little than can do but support the work of conservationists in educating school children about the
plight of the Andean cat, the most threatened cat in the Americas.
Session 4: WFA – Felid Population Segments of Concern
81
Collateral Impacts of Increasing Florida Panther Numbers: Dealing With Unintended Consequences Darrell Land, Florida Fish and Wildlife Conservation Commission, 298 Sabal Palm Road, Naples, FL 34114-2572, USA, 239-417-6352, fax: 239-417-6361, e-mail: [email protected] (presenter) Kipp Frohlich, Florida Fish and Wildlife Conservation Commission, 620 South Meridian Street,
Tallahassee, FL 32399, USA Mark Lotz, Florida Fish and Wildlife Conservation Commission, 298 Sabal Palm Road, Naples,
FL 34114-2572, USA, [email protected] Chris Belden, United States Fish and Wildlife Service, 1339 20th Street
Vero Beach, FL 32960, USA, [email protected] Abstract: Since a breeding population of Florida panthers (Puma concolor coryi) was officially verified in 1978 south of Lake Okeechobee, intense panther conservation efforts were directed towards ensuring the survival of this small population. These efforts included habitat preservation, installation of wildlife crossings in highways, improved habitat management practices that benefited both panthers and their prey, and thorough biomedical assessments of individual panthers. These health assessments revealed that the remnant population was suffering from inbreeding and subsequent demographic modeling suggested the population was spiraling towards extinction. Therefore, in 1995, we initiated panther genetic restoration to mimic natural gene flow into this isolated and small population. We documented higher kitten and adult survival for genetically-admixed panthers versus canonical panthers and survival increased with increased genetic heterozygosity. Additionally, we found that kitten survival was negatively density dependent with a panther abundance index. The panther population has grown over the past 30 years from as few as 20-30 animals to 100-160 adult (>1 year of age) cats today. This population growth is a desirable outcome based on the third revision of the Florida Panther Recovery Plan (FWS 2008) that established recovery criteria of 2 or 3 populations of at least 240 adults and subadults, coupled with sufficient habitat security, for reclassification to threatened or delisting, respectively. However, population growth has led to unintended consequences that could undermine support for panther conservation. Increased human-panther interactions, hobby livestock depredations, depredations on commercial livestock and perceptions that game species have been declining are some collateral impacts of increasing panther numbers. Managing both conservation needs and social acceptance will be critical not only for maintaining the current population but also for fostering population expansion that is an essential component of panther recovery.
Session 4: WFA – Felid Population Segments of Concern
82
INTRODUCTION
The Florida panther (Puma concolor coryi) is a State and Federal endangered subspecies of the
puma that at one time occurred throughout the southeastern U.S. (Young and Goldman 1946).
Unregulated harvest of panthers through the mid-1900s and, more recently, habitat loss and
fragmentation due to the human population growth reduced panther numbers and isolated them
from other puma populations. When the Florida Fish and Wildlife Conservation Commission
(FWC) began investigations into the status and distribution of panthers in the early 1970s, there
were an estimated 20-30 panthers still living in southern Florida.
Intensive panther research and management actions began in 1981 and were focused
primarily on ensuring that this small population did not disappear. Highways were made safer
with wildlife crossings and barrier fencing and thousands of acres of panther habitat were
purchased or preserved through easements. Gene flow into this isolated population was also
restored to levels that would have occurred historically prior to its isolation. These measures
have been successful resulting in a rise in panther numbers and increased population viability.
Social acceptance of Florida panthers has not kept pace with the increase in panther numbers
as evidenced by increasing reports of conflicts between humans and panthers. These conflicts
include hobby livestock depredations in residential areas, depredations on cow-calf operations
and perceptions that white-tailed deer herds are declining. Additionally, people are encountering
panthers and their sign more frequently to the point where questions are raised about whether the
species should still be considered endangered. Resolving these complex social acceptance issues
may be the biggest challenge for managing the existing population and more so for establishing
new populations within the historic range.
Session 4: WFA – Felid Population Segments of Concern
83
RECOVERY GOALS
The US Fish and Wildlife Service (FWS) completed the third revision of the Florida panther
recovery plan in 2008 (FWS 2008). The recovery objectives from this plan calls for: 1) the
maintenance, restoration, and expansion of the panther population and its habitat in south Florida
and expanding this population into south-central Florida; 2) identifying, securing, restoring and
maintaining habitat in potential reintroduction areas and the establishment of additional viable
populations within the historic range outside of south and south-central Florida; and 3) to
facilitate panther recovery through public awareness and education.
A viable panther population for purposes of recovery is defined as one in which there is a
95% probability of persistence for 100 years. Population viability analyses indicated that to be
viable, a population would consist of at least 240 individuals. Reclassification from endangered
to threatened will be considered when two viable populations have been established and
maintained for a minimum of 12 years. Additionally, habitat protection measures need to be in
place to protect the quality, quantity and connectivity of panther habitat within each population
re-establishment area. Similarly, delisting will be considered when three viable populations have
been established for a minimum of 12 years and the habitat base for these populations is secured
for the long-term.
GENETIC RESTORATION
In the early 1990s, the panther population reached a critical juncture. The combined effects of
habitat loss and isolation over the previous century led to an inbred and declining population that
suffered from low levels of genetic variation and various health problems. In 1994, FWC met
with population genetics experts and other cooperating agencies (the National Park Service and
Session 4: WFA – Felid Population Segments of Concern
84
the FWS) to develop “A Plan for Genetic Restoration and Management of the Florida Panther”
(Seal 1994). The resultant objectives included the following:
reducing inbreeding in the Florida panther,
restoring genetic variability and vitality of panther offspring, and
restoring the population’s genetic diversity to levels comparable to those in populations
of western puma subspecies.
The group determined that introducing 6 to 10 individuals from a genetically healthy
population of North American pumas would reverse the effects of inbreeding in resulting
offspring and achieve the desired genetic restoration of the Florida subspecies. FWS approved
the plan following an Environmental Assessment and FWC began the process to release eight
female Texas pumas (Puma concolor stanleyana) into the wilds of southern Florida. This tactic
mimicked historic gene flow between the two subspecies and gave the remaining 30 to 50
Florida panthers the best chance of avoiding extinction. The intent of this management initiative
was not to replace the Florida panther’s gene pool, but to create a healthier, more resilient
population that is similar to the historic population that roamed the southeastern United States
prior to becoming isolated in southern Florida. A population with higher levels of genetic
variation is more apt to recover from its endangered status.
Following the release of the eight Texas pumas in 1995, researchers assessed the level of
genetic variation in the population using three methods:
a pedigree analysis, similar to a family tree, to assist in determining family lineages and
associated health issues that may be passed along family lines;
a genetic analysis to identify unique characteristics of Florida panthers and Texas pumas
and define levels of genetic variation; and
Session 4: WFA – Felid Population Segments of Concern
85
an analysis of physical characteristics associated with inbreeding (e.g., tail kinks,
cowlicks, undescended testicles, sperm quality, and heart defects).
Pedigree analyses verified successful pairings between canonical panthers and the Texas
females, as well as between subsequent generations of the offspring of these pairings (admixed
panthers)(Johnson et al. 2010). Inbreeding continued to occur to some extent, although not at
pre-1995 levels. Pedigree analyses also documented associations between specific family lines
and occurrences of undescended testicles and heart defects. Genetic markers showed greater
genetic variation than existed before restoration, with obvious impacts on the frequency of
physical defects associated with inbreeding: fewer undescended testicles, a higher percentage of
normal sperm, and fewer instances of heart defects, kinked tails, and cowlicks. Today’s
population has increased heterozygosity and is comprised of younger individuals than the pre-
restoration panther population.
Panther survival rates improved as heterozygosity increased both for adults and kittens and
adult females had higher survival than adult males (Hostetler et al. 2010, Benson et al. 2011).
The female Texas puma offspring had the highest survival rates both as kittens and as adults
(Hostetler et al. 2010, Benson et al. 2011). Kitten survivorship irrespective of genetic diversity
was correlated negatively with a panther abundance index (negatively density dependent)
(Hostetler et al. 2010).
While genetic restoration of the Florida panther was successful with regard to some of its
initial objectives, Florida panthers remain isolated and will therefore suffer from inbreeding and
loss of genetic variation over time. As the plan acknowledges, this eventuality may require the
release of additional pumas in Florida to assure the long-term survival of the panther population.
Session 4: WFA – Felid Population Segments of Concern
86
PANTHER POPULATION GROWTH
References to panther numbers have appeared in scientific literature, agency outreach materials,
and popular media for years. Historically, most statements regarding Florida panther numbers
have resulted from expert opinion, informed by field observations of those most closely engaged
in panther research. Various figures have been used throughout the years, including 20-30
throughout the 1970s and early 1980s; 30-50 in the late 1980s through the mid-1990s; 50-70 for
a few years following genetic restoration in 1995; and from 2000-10, 90-120 panthers (McBride
et al. 2008).
FWC recently completed a new population “guesstimate” suggesting that the number of
adult (> 1 year of age) panthers is between 100-160 individuals
(http://myfwc.com/news/resources/fact-sheets/panther-population/ ). The upper bound of 160 is
based on an idealized and unlikely premise that the high panther density found in the core range
would be found across all areas within the breeding range. Nevertheless, this provides
reasonable boundaries of a minimum and maximum population to provide some insight into the
possible magnitude of the adult population size in this area of Florida. Dispersal of male
panthers has been documented throughout peninsular Florida and in one case as far north as
Georgia. Female panthers have not been documented north of Lake Okeechobee and therefore
breeding range is restricted to southern Florida.
COLLATERAL IMPACTS OF PANTHER POPULATION GROWTH
The intent of genetic restoration was to create a healthier, more resilient panther population with
improved long-term viability. A larger population size was an anticipated result. What was not
foreseen were impacts that were products of the law of unintended consequences, namely “that
actions of people and especially of government always have effects that are unanticipated or
Session 4: WFA – Felid Population Segments of Concern
87
unintended” (Norton 2008). In our case, an increase in the number of panthers has placed more
panthers in proximity to people resulting in increases in residential animal depredations, calf
depredations on ranchlands and perceptions that white-tailed deer herds are in decline. Another
unintended consequence of more panthers is the expectation that agencies should be able to
count panthers and measure our progress towards achieving recovery plan criteria.
Residential Animal Depredations
FWC, in partnership with the National Park Service and FWS, developed a Florida Panther
Response Plan in 2008 to provide guidance in dealing with human-panther interactions including
depredations. Depredation complaints from hobby livestock and pet owners have been
increasing as the number of panthers increased. Most conflicts in exurban areas involve panthers
preying on goats or sheep. The vulnerability of pets and residential livestock can be lessened
significantly by proper animal husbandry practices such as keeping pets indoors and confining
livestock to secure enclosures at night. Some residents are willing to take steps to secure their
animals and others are very resistant. If panther numbers remain at current levels, we can expect
to have perennial panther issues between people that live in rural areas and panthers. These
human-panther interactions are an emerging human dimensions issue that must be handled
appropriately in order to maintain or improve upon the social acceptance of panthers by people
living in rural areas.
Calf Depredations on Ranchlands
Publicly owned lands in south Florida, such as Fakahatchee Strand State Preserve, Big Cypress
National Preserve and the Florida Panther National Wildlife Refuge, provide large tracts of
protected panther habitat. Quality panther habitat also exists on privately-owned lands and many
of these lands are managed as cattle ranches. Cattle ranching has a long and rich history in
Session 4: WFA – Felid Population Segments of Concern
88
Florida and these operations rank among the top 15 of calf-producing states (National
Agricultural Statistics Service [NASS] 2011). Panther numbers have risen over the past decade
on both public and private lands. Co-existence of cattle ranching and panthers will be critical to
maintain the existing population and perhaps more so to establish new populations within the
historic range.
Surveys conducted by the NASS found that in Florida, calf losses to predators statewide
were around 18% and 67% of these predators were reported to be either coyotes (59%) or dogs
(8%). No losses were attributed to either panthers or bobcats. It should be noted, however, that
this survey was conducted either via telephone or through a questionnaire not through direct
hands-on studies. Typically, panthers feed on deer and other wildlife, but in the past, FWC has
documented the occasional calf depredation by panthers. These depredations were considered to
be rare events.
Recent reports, however, indicate an increase in the number of calves lost to panther
predation. Calf depredation causes an economic loss to ranchers. These losses are viewed as an
economic penalty against the very individuals who manage their land in ways that benefit
wildlife and panthers. A long term approach is warranted to assist private ranch owners so that
they do not bear the financial burden of providing panther habitat and to provide incentives to
them to accommodate panthers as the species expands their range and continues on the road
toward recovery.
The problem of calf depredation by panthers is complex and there are no easy answers. As a
federally protected endangered species, there are many legal requirements that must be adhered
to by local, state, and federal agencies when dealing with these conflicts. Lethal removal of an
offending panther would not be permitted in most cases. Relocation risks moving a problem to a

Session 4: WFA – Felid Population Segments of Concern
89
different area or could put the panther in unfamiliar, occupied territory causing disruptions of the
social structure. The state and federal agencies recognize that without the cooperation of private
land owners, it is doubtful that the panther will ever be removed from the endangered species
list. The long term best interest of both panther conservation and ranching may be the
development of financial incentives for private land owners to manage their land in ways that are
conducive to providing habitat for wildlife, including panthers. For example, there are programs
in the U.S. Department of Agriculture that are designed to provide incentives for land owners to
encourage sound ecological land management. Potential modification of existing programs
should be explored to see if they can be applied to recognize the public value these private ranch
lands provide for panther conservation.
While this is the long term vision, more information is needed to adequately design such
programs. It will be important to determine with some certainty the impacts panthers may be
having on ranch production in order to develop land incentive programs that will offset these
economic losses. FWC, FWS and the University of Florida will be working with some private
ranches in areas occupied by panthers to 1) conduct panther prey studies; 2) conduct calf
survival studies; and 3) analyze existing data on past calf production. There is a need to
conduct research to provide factual and science based information regarding the panther
impacts. We need to better understand how panthers adapt to living in these landscapes to better
understand the biological and ecological aspects of this issue. By learning more about panther
depredations we may discover steps that can be taken that would reduce the likelihood of
depredations.
Some form of immediate relief is needed now because it will take several years to collect
reliable data to better inform long-term solutions. A working group comprised of landowners,
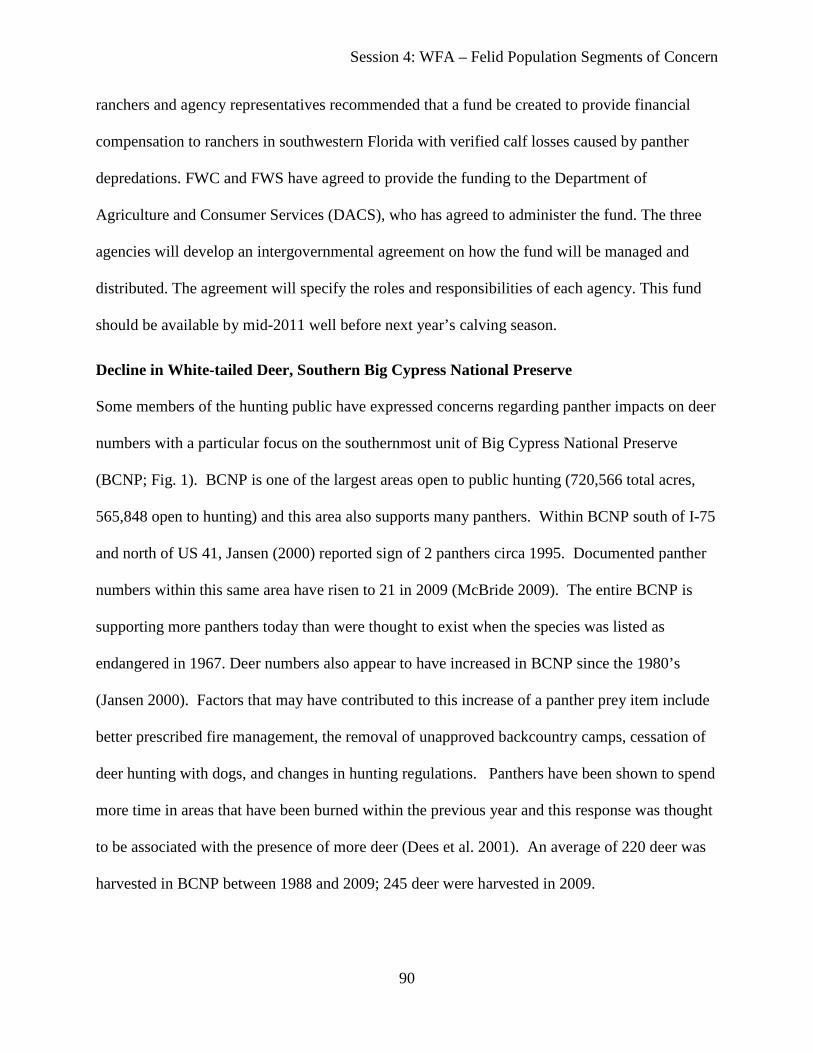
Session 4: WFA – Felid Population Segments of Concern
90
ranchers and agency representatives recommended that a fund be created to provide financial
compensation to ranchers in southwestern Florida with verified calf losses caused by panther
depredations. FWC and FWS have agreed to provide the funding to the Department of
Agriculture and Consumer Services (DACS), who has agreed to administer the fund. The three
agencies will develop an intergovernmental agreement on how the fund will be managed and
distributed. The agreement will specify the roles and responsibilities of each agency. This fund
should be available by mid-2011 well before next year’s calving season.
Decline in White-tailed Deer, Southern Big Cypress National Preserve
Some members of the hunting public have expressed concerns regarding panther impacts on deer
numbers with a particular focus on the southernmost unit of Big Cypress National Preserve
(BCNP; Fig. 1). BCNP is one of the largest areas open to public hunting (720,566 total acres,
565,848 open to hunting) and this area also supports many panthers. Within BCNP south of I-75
and north of US 41, Jansen (2000) reported sign of 2 panthers circa 1995. Documented panther
numbers within this same area have risen to 21 in 2009 (McBride 2009). The entire BCNP is
supporting more panthers today than were thought to exist when the species was listed as
endangered in 1967. Deer numbers also appear to have increased in BCNP since the 1980’s
(Jansen 2000). Factors that may have contributed to this increase of a panther prey item include
better prescribed fire management, the removal of unapproved backcountry camps, cessation of
deer hunting with dogs, and changes in hunting regulations. Panthers have been shown to spend
more time in areas that have been burned within the previous year and this response was thought
to be associated with the presence of more deer (Dees et al. 2001). An average of 220 deer was
harvested in BCNP between 1988 and 2009; 245 deer were harvested in 2009.
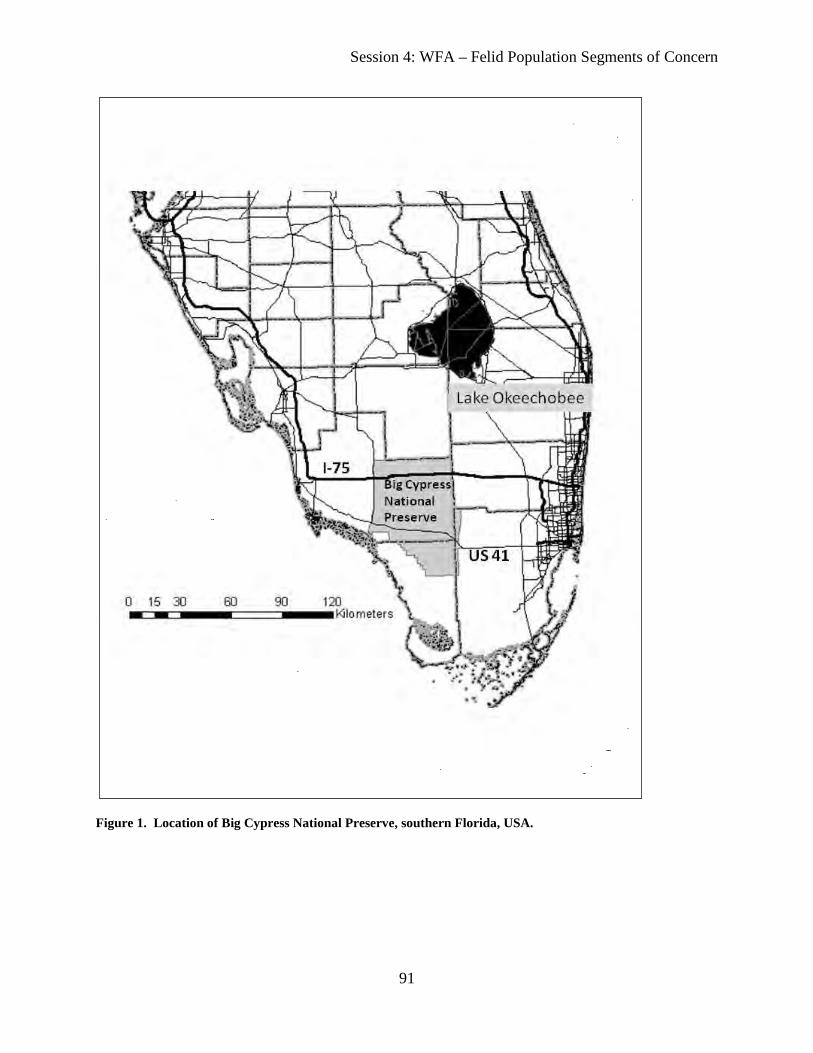
Session 4: WFA – Felid Population Segments of Concern
91
Figure 1. Location of Big Cypress National Preserve, southern Florida, USA.

Session 4: WFA – Felid Population Segments of Concern
92
The Stairsteps Unit of BCNP experienced an increase in deer numbers between 1996 and
2001 (393 deer counted in summer aerial surveys) then declined to a low of 7 deer counted in
2010. Hunter harvest declined from a high of 113 deer harvested in 1998 down to 22 harvested
in 2009. This is the southernmost unit of BCNP and is 147,312 acres in size. Habitats within the
Stairsteps Unit are predominantly open marshes and wet prairies with some tree islands, cypress
forests, and scattered pinelands (Duever et al.1986). Yearly hydrological fluctuations determine
the plant communities of south Florida ecosystems and are influenced not only by yearly rainfall
amounts but also by the extensive system of canals, levees and pump stations that have been
built to move water. The Stairsteps unit is considered to be rather poor deer habitat in
comparison to the rest of BCNP and has not historically been utilized by as many panthers.
Annual panther surveys conducted between 2003 and 2009 documented a range of 1-5
panthers in this area of BCNP. Most radiocollared panthers that used this area also included
other units of BCNP in their home ranges. FWC and BCNP are working together to analyze
factors associated with the declining deer numbers. Preliminary results suggest that increases in
the frequency of high water events since the mid-1990’s may have caused the deer declines due
to lower deer productivity, reduced recruitment and higher mortality. There is evidence that
habitats have changed from wet prairies to freshwater marshes, most likely a reflection of the
changing hydrology, and this transition would reduce deer habitat quality. Predation certainly
contributed somewhat to the decline but does not appear to be the driving force behind the
reduction in deer numbers.
Other units of BCNP have not experienced similar declines in deer numbers, as evidenced
by consistent harvest levels, even though they support more panthers. Also, FWC manages
hunts on other State lands occupied by panthers that total over 160,000 acres; no declines in deer
Session 4: WFA – Felid Population Segments of Concern
93
numbers are evident on these wildlife management areas. However, there still is a perception
that the documented increase in panther numbers is diminishing deer populations throughout
south Florida. Whether these conflicts are real or perceived, acceptance of Florida panthers by
outdoor sporting groups will be critical for further population expansion and achieving recovery.
Measuring Population Size Relative to Recovery Goals
The 2008 Florida Panther Recovery Plan established recovery criteria that utilized discrete
numbers of panthers without also identifying a way to count panthers. The question of “how
many are there?” is a natural one when discussing the status of an endangered species.
Currently, our measures of population trends rely on an annual count of panthers based on
documented physical evidence (McBride et al. 2008) as well as a summation of the minimum
number of panthers alive during a given year. Neither of these methods provides a population
estimate with associated confidence intervals.
Rigorous capture-mark-recapture methods (CMR) used to develop population estimates,
including DNA hair snares and trail cameras, have been effective for bears or felids with
uniquely identifiable fur coloration patterns, respectively. Unfortunately, preliminary testing has
shown that panthers are not consistently attracted to hair snares to make this a dependable
method to obtain a robust population estimate, and it is not possible to reliably identify
individual panthers via their fur (they are not spotted or striped). In addition, CMR sampling
techniques are labor intensive and expensive when implemented for carnivore populations that
occupy large areas. This includes panthers, which occupy a breeding range of 2.2 million acres.
The need to develop a statistically robust panther population estimate has now become a
political concern with a proviso attached to FWC’s panther budget allocation that reads “the
Commission will develop improved methods to generate statistically sound estimates of the
Session 4: WFA – Felid Population Segments of Concern
94
panther population size using best available science.” FWC is planning on assembling a small
team of people with expertise in population estimation techniques to provide guidance and
recommendations for appropriate estimators for Florida panthers.
SUMMARY
Intensive Florida panther research and management actions began in the early 1980’s and the
main focus of these actions was to prevent extinction of the small remnant population of 20-30
animals. These actions concentrated on improving the health of the population through genetic
restoration, protecting habitat and reducing panther deaths along highways through wildlife
crossings, fencing and speed zones. The panther population responded well to these measures
and now numbers between 100 to 160 adult cats. However, these management actions had
unintended consequences that may prove to be even greater conservation challenges. Florida’s
human population has grown considerably since the early 1980’s and panthers have expanded
their range to include rural residential areas resulting in depredations on pets and hobby
livestock. Panthers have also been documented taking calves on commercial ranchlands and
these private lands are important as panther habitat. Outdoor sporting groups have expressed
concerns that the rise in panther numbers is reducing deer herds. Finally, with the well-
documented panther population increase, FWC and FWS are being challenged to provide
statistically-valid population estimates so that progress towards achieving recovery criteria can
be measured. Advancing Florida panther recovery will depend upon habitat protection and direct
population management as well as developing strategies for resolving recently emerging social
acceptance issues. Resolving these complex social acceptance issues may be the biggest
challenge for managing the existing population and more so for establishing new populations
within the historic range.
Session 4: WFA – Felid Population Segments of Concern
95
LITERATURE CITED Benson, J.F., J.A Hostetler, D.P. Onorato, W.E. Johnson, M.E. Roelke, S.J. O’Brien, D. Jansen
and M.K. Oli. 2011. Intentional genetic introgression influences survival of adults and subadults in a small, inbred felid population. Journal of Animal Ecology doi: 10.1111/j.1365-2656.2011.01809.x.
Duever, M. J., J. E. Carlson, J. F. Meeder, L. C. Duever, L. H. Gunderson, L. A. Riopelle, T.
R.Alexander, R. L. Myers, and D. P. Spangler. 1986. The Big Cypress National Preserve. Research Report 8. National Audubon Society, New York, NY. 444 pp.
Hostetler, J.A., D.P. Onorato, J.D. Nichols, W.E. Johnson, M.E. Roelke, S.J. O’Brien, D. Jansen,
M.K. Oli. 2010. Genetic introgression and the survival of Florida panther kittens. Biological Conservation 143:2789-2796.
Jansen, D.K. 2000. Florida panthers in wetland ecosystem (abstract only). Page 62 in L.A.
Haverson, P.M. Haverson, and R.W. Adams, eds. Proceedings of the sixth mountain lion workshop. Austin, Texas.
Johnson, W.E., D.P. Onorato, M.E. Roelke, E.D. Land, M. Cunningham, R.C. Belden, R.
McBride, D. Jansen, M. Lotz, D. Shindle, J. Howard, D.E. Wildt, L. Penfold, J.A Hostetler, M.K. Oli and S.J. O’Brien. 2010. Science 329:1641-1645.
Kautz, R., R,Kawula, T. Hoctor, J. Comiskey, D. Jansen, D. Jennings, J. Kasbohm, F. Mazzotti,
R. McBride, L. Richardson and K. Root. 2006. How much is enough? Landscape-scale conservation for the Florida panther. Biological Conservation 130:118-133.
Logan, K. A., and L. L. Sweanor. 2001. Desert puma: evolutionary ecology and conservation of
an enduring carnivore. Island Press, Washington. McBride, R.T., R.T. McBride, R.M. McBride and C.E. McBride. 2008. Counting pumas by
categorizing physical evidence. Southeastern Naturalist 7:381-400. McBride, R. T. 2009. Synoptic survey of Florida panthers 2009. Annual Report submitted to
U.S. Fish and Wildlife Service (Agreement #401817G005). Rancher’s Supply, Inc., Alpine, TX. 147pp.
National Agricultural Statistics Service. 2011. Retrieved April 20, 2011 from the World Wide
Web: http://usda.mannlib.cornell.edu/usda/current/Catt/Catt-01-28-2011.pdf Norton, R. 2008. Unintended Consequences. The Concise Encyclopedia of Economics. Library
of Economics and Liberty. Retrieved April 8, 2011 from the World Wide Web: http://www.econlib.org/library/Enc/UnintendedConsequences.html
Session 4: WFA – Felid Population Segments of Concern
96
Ranchers Supply, Inc. 2009. Florida panther annual count 2009. 147pp. Seal, U. S. (ed). 1994. A plan for genetic restoration and management of the Florida panther
(Felis concolor coryi). Report to the Florida Game and Fresh Water Fish Commission, by the Conservation Breeding Specialist Group, Species Survival Commission, IUCN, Apple Valley, MN.
U.S. Fish and Wildlife Service. 2008. Florida Panther Recovery Plan (Puma concolor coryi),
Third Revision. U.S. Fish and Wildlife Service. Atlanta, Georgia. 217pp. Young, S.P and E.A. Goldman. 1946. The puma: mysterious American cat. The Wildlife
Institute, Washington, DC. 358 pp.
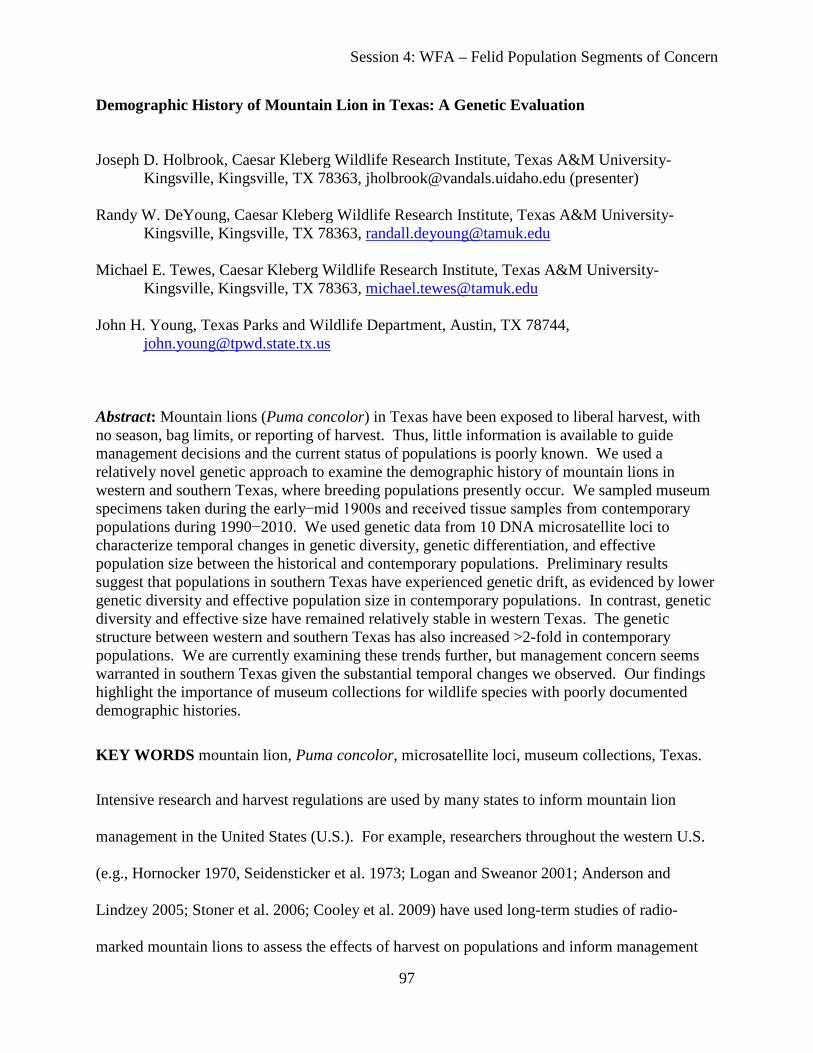
Session 4: WFA – Felid Population Segments of Concern
97
Demographic History of Mountain Lion in Texas: A Genetic Evaluation Joseph D. Holbrook, Caesar Kleberg Wildlife Research Institute, Texas A&M University-
Kingsville, Kingsville, TX 78363, [email protected] (presenter) Randy W. DeYoung, Caesar Kleberg Wildlife Research Institute, Texas A&M University-
Kingsville, Kingsville, TX 78363, [email protected] Michael E. Tewes, Caesar Kleberg Wildlife Research Institute, Texas A&M University-
Kingsville, Kingsville, TX 78363, [email protected] John H. Young, Texas Parks and Wildlife Department, Austin, TX 78744,
Abstract: Mountain lions (Puma concolor) in Texas have been exposed to liberal harvest, with no season, bag limits, or reporting of harvest. Thus, little information is available to guide management decisions and the current status of populations is poorly known. We used a relatively novel genetic approach to examine the demographic history of mountain lions in western and southern Texas, where breeding populations presently occur. We sampled museum specimens taken during the early−mid 1900s and received tissue samples from contemporary populations during 1990−2010. We used genetic data from 10 DNA microsatellite loci to characterize temporal changes in genetic diversity, genetic differentiation, and effective population size between the historical and contemporary populations. Preliminary results suggest that populations in southern Texas have experienced genetic drift, as evidenced by lower genetic diversity and effective population size in contemporary populations. In contrast, genetic diversity and effective size have remained relatively stable in western Texas. The genetic structure between western and southern Texas has also increased >2-fold in contemporary populations. We are currently examining these trends further, but management concern seems warranted in southern Texas given the substantial temporal changes we observed. Our findings highlight the importance of museum collections for wildlife species with poorly documented demographic histories.
KEY WORDS mountain lion, Puma concolor, microsatellite loci, museum collections, Texas.
Intensive research and harvest regulations are used by many states to inform mountain lion
management in the United States (U.S.). For example, researchers throughout the western U.S.
(e.g., Hornocker 1970, Seidensticker et al. 1973; Logan and Sweanor 2001; Anderson and
Lindzey 2005; Stoner et al. 2006; Cooley et al. 2009) have used long-term studies of radio-
marked mountain lions to assess the effects of harvest on populations and inform management
Session 4: WFA – Felid Population Segments of Concern
98
goals. Most states set region-specific goals for harvest, which are regulated by length of hunting
seasons, bag limits, and mandatory inspection (Anderson et al. 2010). Reporting of harvest
facilitates the collection of demographic data that can be used to inform future mountain lion
harvest (e.g., Anderson and Lindzey 2005).
In Texas, the harvest of mountain lions is not regulated by season or bag limits, and
mandatory inspection is not required (Harveson et al. 1996). Breeding populations primarily
occur in western and southern Texas (Schmidly 2004), though mountain lions have been sighted
throughout the state (Figure 1). Previous research has indicated that mountain lions in western
(Pittman et al. 2000; Young et al. 2010) and southern (Harveson 1997) Texas exhibit high
mortality due to harvest. Furthermore, a recent study revealed low levels of genetic diversity in
southern Texas, and substantial genetic structure between the 2 breeding populations (Walker et
al. 2000). Collectively, the little information available suggests that high mortality and
reproductive isolation may be a concern for southern Texas mountain lions. However, southern
Texas populations occur on the periphery of the North American range. Peripheral populations
may display lower genetic diversity due to small populations, less opportunity for gene flow, or
large changes in census size due to range shifts (Schwartz et al. 2003). Thus, it is difficult to
determine if the genetic data are the result of historical or recent processes.
The lack of historical data on population trends and absence of harvest reporting leaves
few options to evaluate the current population status of Texas mountain lions. Retrospective
genetic analysis is a relatively new approach that has not been widely used for populations of
large mammals (Schwartz et al. 2006, Wandeler et al. 2007). For example, researchers can
investigate temporal changes in populations by comparing genetic data from museum specimens
to samples from contemporary populations. Retrospective analyses are appearing in the recent
Session 4: WFA – Felid Population Segments of Concern
99
literature and have revealed useful data to guide conservation and management. For instance, a
temporal decline in genetic diversity was documented in grey wolves (Canis lupus; Leonard et
al. 2005), Florida panthers (P. c. coryi; Culver et al. 2008), and Arctic foxes (Alopex lagopus;
Nystrӧm et al. 2006), which substantiated hypotheses of long-term population declines. In
contrast, genetic data indicated that populations of grizzly bears (Ursus arctos; Miller and Waits
2003) and Eurasian badgers (Pertoldi et al. 2005) had remained stable over time despite
predictions of genetic bottlenecks. We are applying retrospective genetic analyses to examine
temporal changes in population characteristics of mountain lions in Texas.
The ultimate goal of our study is to characterize the demographic history of mountain
lions in western and southern Texas. Our specific objectives are to examine long-term changes
in genetic diversity, genetic structure, and effective population size. Currently, we have sampled
>60 mountain lion skulls from museum collections including the National Museum of Natural
History (Smithsonian) and Texas Tech University Museum; these samples span the early−mid
1900s. We also have acquired >200 tissue samples from trappers between 1990−2010.
Preliminary results suggest mountain lions within southern Texas have experienced declines in
genetic diversity and effective population size, and that genetic drift has occurred over time.
However, mountain lions within western Texas appear to have remained stable given that we
documented no declines in diversity or effective size. Furthermore, the genetic structure
between southern and western Texas has apparently increased >2-fold over time. Our results
indicate that the low genetic diversity in southern Texas and the pronounced genetic structure
between western and southern Texas are the result of recent events. The temporal changes and
declines we observed, along with the high mortality previously documented (Harveson 1997),
suggest population concerns are likely warranted in southern Texas. Additional data on
Session 4: WFA – Felid Population Segments of Concern
100
reproduction and survival are needed to determine the viability of mountain lions in this region.
In western Texas, mountain lion populations seem to have remained relatively stable over time.
Our study highlights the importance of natural history collections for conservation and
management. Retrospective genetic analyses are not commonly employed, but can be highly
useful when historical data are lacking or where populations are difficult to survey.
Retrospective genetic approaches should be considered more frequently as a tool to inform the
conservation and management of wildlife species.
ACKNOWLEDGMENTS
We thank the National Museum of Natural History, Texas Tech University, Sul Ross
State University, Field Museum of Natural History, Texas Cooperative Wildlife Collection,
University of Michigan Museum of Zoology, Texas Memorial Museum, American Museum of
Natural History, Baylor University’s Mayborn Museum Complex, Midwestern State University,
Louisiana State University Museum of Natural Science, Angelo State University, Illinois Natural
History Survey, and Carnegie Museum of Natural History for allowing access to museum
collections. Bill Applegate, Louis Harveson, Jan Janecka, Jimmy Rutledge, and personnel from
USDA APHIS Texas Wildlife Services assisted with contemporary tissue collection. Texas
Parks and Wildlife Department provided financial support for this project. This represents
contribution 2011-124 of the Caesar Kleberg Wildlife Research Institute.
Session 4: WFA – Felid Population Segments of Concern
101
LITERATURE CITED
Anderson, C. R., and F. G. Lindzey. 2005. Experimental evaluation of population trend and harvest composition in a Wyoming cougar population. Wildlife Society Bulletin 33:179−188.
Anderson, C. R., F. G. Lindzey, K. H. Knopff, M. G. Jalkotzy, and M. S. Boyce. 2010. Cougar management in North America. Pages 41−54 in M. Hornocker and S. Negri, editor. Cougar ecology and conservation. University of Chicago Press, Chicago, Illinois, USA.
Cooley, H. S., R. B. Wielgus, G. M. Koehler, H. S. Robinson, and B. T. Maletzke. 2009. Does hunting regulate cougar populations? A test of the compensatory mortality hypothesis. Ecology 90:2913−2921.
Culver, M., P. W. Hedrick, K. Murphy, S. O’Brien, and M. G. Hornocker. 2008. Estimation of the bottleneck size in Florida panthers. Animal Conservation 11:104−110.
Harveson, L. A. 1997. Ecology of a mountain lion population in southern Texas. Dissertation. Texas A&M University & Texas A&M University-Kingsville, College Station, Texas, USA.
Harveson, L. A., M. E. Tewes, N. J. Silvy, and J. Rutledge. 1996. Mountain lion research in Texas: past, present, and future. Pages 45–54 in W. D. Padly, editor. Proceedings of the fifth mountain lion workshop. Department of Fish and Game, San Diego, California, USA.
Hornocker, M. G. 1970. An analysis of mountain lion predation upon mule deer and elk in the Idaho Primitive Area. Wildlife Monograph No. 21.
Leonard, J. A., C. Vila, and R. K. Wayne. 2005. Legacy lost: genetic variability and population size of extirpated US grey wolves (Canis lupus). Molecular Ecology 14:9−17.
Logan, K. A., and L. L. Sweanor. 2001. Desert puma: evolutionary ecology and conservation of an enduring carnivore. Island Press, Washington D.C., USA.
Miller, C. R., and L. P. Waits. 2003. The history of effective population size and genetic diversity in the Yellowstone grizzly (Ursus arctos): implications for conservation. Proceedings of the National Academy of Sciences, USA 100:4434–4439.
Nystrӧm, V., A. Angerbjӧrn, and L. Dalén. 2006. Genetic consequences of a demographic bottleneck in the Scandinavian arctic fox. Oikos 114:84−94.
Pertoldi, C., V. Loeschcke, E. Randi, A. B. Madsen, M. M. Hansen, R. Bijlsma, and L. V. De Zande. 2005. Present and past microsatellite variation and assessment of genetic structure in Eurasian badger (Meles meles) in Denmark. Journal of Zoology, London 265:387−394.
Session 4: WFA – Felid Population Segments of Concern
102
Pittman, M. T., G. J. Guzman, and B. P. McKinney. 2000. Ecology of the mountain lion on Big Bend Ranch State Park in Trans-Pecos region of Texas. Texas Parks and Wildlife, Final Report Project Number 86, Austin, Texas, USA.
Schmidly, D. J. 2004. The mammals of Texas. 6th ed. University of Texas Press, Austin, Texas, USA.
Schwartz, M. K., G. Luikart, and R. S. Waples. 2006. Genetic monitoring as a promising tool for conservation and management. Trends in Ecology and Evolution 22:25−33.
Schwartz, M. K., L. S. Mills, Y. Ortega, L. F. Ruggiero, and F. W. Allendorf. 2003. Landscape location affects genetic variation of Canada lynx (Lynx canadensis). Molecular Ecology 12:1807–1816.
Seidensticker, J. C., M. G. Hornocker, W. V. Wiles, and J. P. Messick. 1973. Mountain lion social organization in the Idaho Primitive Area. Wildlife Monograph No. 35.
Stoner, D. C., M. L. Wolfe, and D. M. Choate. 2006. Cougar exploitation levels in Utah: implications for demographic structure, population recovery, and metapopulation dynamics. Journal of Wildlife Management 70:1588−1600.
Walker, C. W., L. A. Harveson, M. T. Pittman, M. E. Tewes, and R. L. Honeycutt. 2000. Microsatellite variation in two populations of mountain lions (Puma concolor) in Texas. Southwestern Naturalist 45:196–203.
Wandeler, P., P. Hoeck, and L. F. Keller. 2007. Back to the future: museum specimens in population genetics. Trends in Ecology and Evolution 22:634−642.
Young, J. H., M. E. Tewes, A. M. Haines, G. Guzman, and S. J. DeMaso. 2010. Survival and mortality of cougars in the Trans-Pecos region. Southwestern Naturalist 55:411–418.
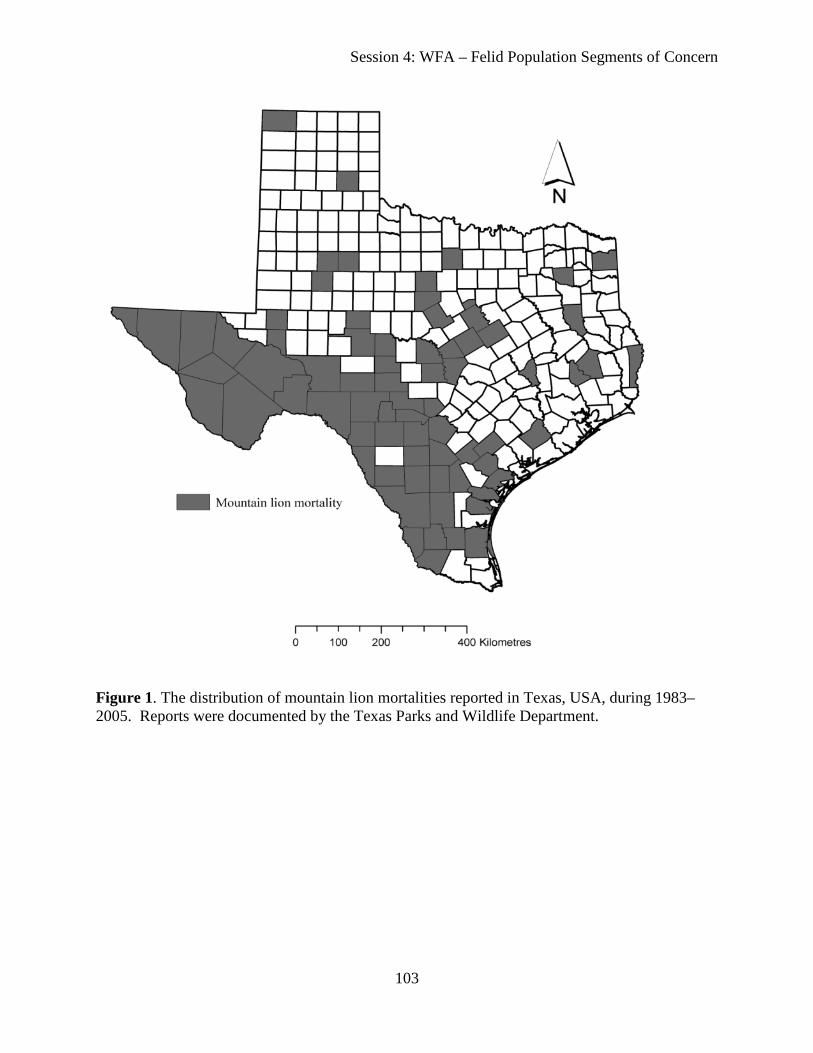
Session 4: WFA – Felid Population Segments of Concern
103
Figure 1. The distribution of mountain lion mortalities reported in Texas, USA, during 1983–2005. Reports were documented by the Texas Parks and Wildlife Department.

Session 4: WFA – Felid Population Segments of Concern
104
Felid Population Segments of Concern, Panel Q & A Participants and Presentations: Joe Holbrook (JH) - Demographic history of mountain lions in Texas: a genetic evaluation.
Darrell Land (DL) – Collateral impacts of increasing Florida panther numbers: dealing with unintended consequences.
Rodrigo Medellin (RM) – Jaguars in peril: the next 100 years.
Jim Sanderson (JS) – Don’t eat the shrimp.
Mike Tewes (MT) – Vulnerability of the ocelot populations in the United States.
Mediator: Dr. Melanie Culver, Assistant Professor University of Arizona, and Assistant Leader
Arizona Cooperative Fish and Wildlife Research Unit. (Recorded and transcribed by L. Sweanor)
1. Q: What are the impacts of the US-Mexico border fence on the movement of ocelots,
pumas and jaguars?
RM – I will reiterate some of the findings from our recent Jaguar Recovery Team
meeting in Arizona. Yes, the wall has had significant impacts on wildlife, overall.
However, because most of it is built along the flat areas of the border and not really in the
mountains, it is not affecting the jaguar. The Department of Homeland Security has
provided some mitigation for jaguars; however, it is only applied on the U.S. side of the
border where there are no jaguars.
2. Q: What is status of pumas in Mexico? Are they increasing and if so, is there
competition with jaguars?
RM – We do not have specific data on pumas in most places. However, pumas are in
really good shape throughout most of Mexico except around Mexico City. There is a
record of a puma going from the northern to the western part of Mexico City on the
outskirts. We have found puma sign in all places where we do jaguar surveys. As to
linkages, we are still not sure. We may work with Melanie (Culver) on that? Pumas are
Session 4: WFA – Felid Population Segments of Concern
105
not experiencing significant threats except in specific locations. Double and single
cameras we’ve been using have allowed us to individually identify 95% of jaguars.
3. Q: In your educational program for people in Thailand, what are your
recommendations for alternate forms of economic development?
JS - Prior to industrial shrimp farming, human population densities in small villages were
not nearly as high. People were self-sufficient, providing products to local markets.
Industrial shrimp farming increased the human population density. It is not our job to
provide alternate forms of employment. Our job is one of conservation in dealing with
the issues caused by large companies, industrialization and global markets. People had
other jobs before they moved into these areas. For example – a few Germans came in and
started shrimp farms because it was so lucrative. I don’t think we should be providing
other jobs (than shrimping). What we’d rather do is shut down the market. I don’t
understand why don’t we have shrimp farms in Louisiana. There (Thailand) we’re
driving species to extinction; here in the U.S., we can monitor and ensure against that. In
Thailand they are creating shrimp farms in former mangrove swamps. It is a profit motive
for them to be in Thailand (vs. U.S.); they can make more money there than anywhere
else.
4. Q: Is there still suitable ocelot habitat in other areas of Texas?
MT – Yes. But think stabilizing the existing population is the first priority. We formed a
subcommittee within the recovery plan to identify possible locations for new ocelot
populations. The problems in East Texas included a much higher human density and
amount of development. Using South Texas optimal habitat as a baseline, there is not
much habitat in East Texas. Historically ocelots were found in most riparian systems but
these were the first places to be colonized by pioneers and thus caused the early loss of
ocelot populations. We may be able to use areas in Southern Texas as a possible platform
for a new population, but this may require putting together a few smaller subpopulations
to make an effective metapopulation. In South Texas there are more options.
Session 4: WFA – Felid Population Segments of Concern
106
Follow-up Q: Any GIS analyses been done?
MT – Yes. John Young did 1 modeling effort using genetic algorithms, and the Fish and
Wildlife Service has done some mapping.
5. Q: Can the present Florida panther population reach the 240 recommended for a
viable population?
DL – If you had asked me before we started the genetic restoration if we could have 100-
160 panthers in the same area where we had 30-50 beforehand, I would have thought
there was no way you could pack them in so densely. Given what’s happened, I have to
rethink it a little. However, I don’t really think we can get to 240. Kitten survivorship is
an indication. I think the box has gotten full. The average age of the population has gone
down (high turnover) and kitten survivorship is down to 25-30%. I think we can use these
accomplishments to help guide us in determining how many panthers other areas will
support in a reintroduction effort.
MT – Ocelots – We think the two populations we’re aware of are near saturation. There
is variation depending on conditions (e.g., drought). The population has declined because
of drought. Private lands likely have other ocelots; how many we can only speculate for
now. With the formation of a coalition I think we’ll have a better answer for that. We are
attempting to have natural movements between subpopulations with infrequent
intervention to mimic dispersal.
RM – Jaguars –There is very little known about jaguars in comparison to other species.
We can’t use data at face value and must rely on modeling. But we can use models as
indicators to help us determine where we want to focus our efforts. In VORTEX for
example, the estimated MVP was 600. But there are hardly any 600 populations of
jaguars left in world. There are key variables in model – for example kitten survival. We
have no idea what it is. Same for female survivorship and fecundity. But this helps point
the way where we need to go in research. Other MVP estimates go as low as 200. We are
using this benchmark of 200 animals and not the 600 and feel it is acceptable based on
similar estimates for the Florida panther.

Session 4: WFA – Felid Population Segments of Concern
107
6. Q: Are there regions where we know extremely little about jaguars, considering
they have such a large range?
RM – In our 2002 book we did a gap analysis. We examined where we know we have
jaguars and where we don’t. We’ve made a significant effort to fill the gap over the past
10 years to go look in those areas. The dry scrub habitat in northern Mexico is still a big
mystery. How do jaguars survive there? Historically there have been good populations
there.
7. Q: What about using trophy hunting of jaguars as a conservation tool?
RM – First I must make a disclaimer. I am an advocate for trophy hunting for purposes of
conservation and have done this very significantly with bighorn sheep in northern Mexico
for a very long time. Trophy hunting may be a very strong conservation tool. But, in the
case with jaguars, there are so few left and such a strong image of the animals
everywhere you go. Consequently, trying to put trophy hunting on the table as a
conservation tool probably would not work. However, there are some problem jaguars
that we have tried to relocate, to get them away from the places where they are causing
trouble, and 2-3 weeks later they are back. We need to come to grips with this problem.
(To reiterate), the situation presently is not ripe enough to have a decent discussion about
trophy hunting because of 2 things: 1) too few jaguars; and 2) strong public image.
8. Q: Have there been any recent discussions among sports groups to change the
status of the puma in Texas to a game animal?
JH – There have been 2 panel discussions. One included various interest groups:
sportsmen, cattle ranchers, advocacy groups. The consensus there was that individual
land owners liked the flexibility of being able to do what they wanted on their land but
also didn’t want to see pumas wiped out. That was the agreement everyone came to but
there was still a lot of conflict. Texas has a lot of privately owned land. Right now those
landowners want the flexibility to take care of what they feel is necessary. In a recent
panel that took place on campus in South Texas, groups talked about alternatives and
future directions. They agreed there was the potential for alternatives, but mainly in
South Texas. They agreed they needed to evaluate what was happening in South Texas,
Session 4: WFA – Felid Population Segments of Concern
108
with the possibility there would be changes in just that region, such as reporting harvest
or that sort of thing.
MT- It is a very complex, difficult issue. JH was (first) referring to the 1992 Del Rio
roundtable. It included a very interesting collection of groups, including every kind of
advocate. The only consensus from the 2-day meeting was no one wanted pumas to
disappear. I would like to see the development of a management plan with goals and
objectives. If we can get to that point, it will dictate what happens after that - whether
there needs to be seasons, bag limits, etc. Research is showing that the West Texas
population is pretty resilient, probably because of the surrounding populations in New
Mexico and Mexico. The South Texas population was probably historically not a large
population. The area was mostly grassland 200 yrs ago, and recent modeling by John
Young (PhD) shows there is not a lot of good habitat. The puma population there is
sensitive/vulnerable. The problem is when you don’t collect information on mortalities,
which I think we should be doing in South Texas as a minimum, is that you don’t have a
baseline to use to compare with over time. Landowners do like flexibility and are one of
the dominant forces in Texas. However, they can’t collectively see the bigger picture
about what’s going on in the puma population over large regions. That’s where the state
agency can step up and provide the big picture.
9. Q: Another question on the effects of the border fence, this time for ocelots and
pumas along the Texas-Mexico border.
MT – The border fence in Texas is not continuous; it is interrupted in places. In terms of
possible effects on ocelots – the impact on ocelots had already been done in terms of
creating a disconnect between Mexico and Texas. I don’t think much more harm can be
done by the fence. In the past 30 years there has been only one instance of an ocelot
showing it may have come from Mexico. The exception may be upstream from McAllen.
We don’t know much about that area. Concerning pumas, I am unsure how contiguous
the population is. I’m sure there’s ongoing exchange around the Yule Pass(?) and Laredo
area. The fence could be a factor for pumas. MT asks JH to discuss the problem in terms
of genetics. JH – I definitely think it’s a factor and a huge unknown. We need to follow
up on this. Development along the Rio Grande to the south of South Texas and the
Session 4: WFA – Felid Population Segments of Concern
109
location of South Texas pumas shows they are on the periphery, and from landscape
perspective this seems to be creating a pinch from Mexico in. We don’t know the
frequency of animals moving in but also all the samples we collect are from harvested
cats. So they may be moving in but don’t know if they are reproducing.
10. Q: Now that the small population problem (for Florida panthers) is solved (i.e., the
“box is full”), are there other reintroduction locations identified? And are you
obtaining acceptance?
DL – Our focus now is north of Lake Okeechobee. Panther breeding is only occurring
south of Lake Okeechobee. The Caloosahafchee River drains west out of the lake to Ft.
Meyers. South of there is where we documented the presence of female panthers. We
know dispersing males will make it north of this point, but not females. We had a male
shot southwest of Atlanta along the Alabama border, so the males have great dispersal
capability. We consistently see male sign in a fairly large area south of Orlando down to
Lake Okeechobee. We are looking at potential habitat there. The Fish and Wildlife
Service is looking at projects to secure as much land base as we can. But if asked –
“When are we taking females across the river?” We are not there yet. We are doing
outreach opportunities now, getting the public ready for having resident panthers. This is
a lot different than having dispersing panthers. The magnitude of the problem is much
greater, considering the amount of panther food on the properties (domestic, hobby
animals) and the larger numbers of people. This is a big challenge and will be a long term
project. We are not at a critical point right now; the population won’t go extinct in the
next 10 years.
Follow-up Q: What about building a bridge across river?
DL – We’re not considering it right now. We would need one that’s high enough (or a
drawbridge) to allow boat traffic. It would be extremely expensive.
Follow-up Q: Back to acceptance – is that your biggest problem?
DL – Twenty years ago we ran a surrogate test, bringing Texas cats into the Okefenokee
Swamp - Osceola National Forest area. Chris (Belden’s) study showed cats finding food
and cover, but also coming into contact with lots of people. The presence of people was
the determining factor. The panthers were not accepted! The agency is not anxious to

Session 4: WFA – Felid Population Segments of Concern
110
repeat this experiment. Q: Are there identifiable release sites outside Florida? Yes, the
recovery team has identified possible release sites outside Florida. But I believe every
state that is in historic panther range has said “no thank you” to having panthers. The
situation is pretty bleak right now...
End of panel discussion.
111
Session 5: Felid Population Monitoring
Wild Felid Research and Management Association (WFA)
Proceedings of the 10th Mountain Lion Workshop
Cougars: Conservation, Connectivity and Population Management
Session 5: WFA – Felid Population Monitoring
112
The Puma as an Umbrella Species for Conserving Western Hemisphere
Carnivores Chris Burdett, Department of Fish, Wildlife and Conservation Biology, Colorado State
University, Fort Collins, CO 80523, [email protected] (presenter) Dave Theobald, Department of Fish, Wildlife and Conservation Biology, Colorado State
University, Fort Collins, CO 80523 Carlo Rondinini, Department of Biology and Biotechnology, Sapienza Università di Roma, Viale
dell'Università 32, 00185 Roma, Italy Moreno Di Marco, Department of Biology and Biotechnology, Sapienza Università di Roma,
Viale dell'Università 32, 00185 Roma, Italy Luigi Boitani, Department of Biology and Biotechnology, Sapienza Università di Roma, Viale
dell'Università 32, 00185 Roma, Italy Kevin Crooks, Department of Fish, Wildlife and Conservation Biology, Colorado State
University, Fort Collins, CO 80523 Abstract: A challenge for macroecological studies is collecting sufficient empirical data to study large-scale patterns of distribution or abundance. Comprehensive surveys for presence cannot be conducted at such large scales for most carnivores, including the puma. However, habitat-suitability models were recently developed to estimate the area of occupancy (i.e., presence), rather than just the extent of occurrence, within the geographic ranges of all terrestrial mammals. We used these models to measure the distribution of high-quality habitat within the geographic range of the puma, and evaluate the potential for the puma to serve as an umbrella species for carnivore conservation in the Western Hemisphere. The extent of the puma’s geographic range covered a total area of over 22 million km2, and 75% of that area was high-quality habitat. However, only 6% of this high-quality habitat occurred in protected areas. The puma has considerable potential to serve as an umbrella species. The puma’s high-quality habitat overlaps 75 ± 8% (mean ± SE) of the high-quality habitat of 11 sympatric felid species. Puma habitat supports more than double the mean species richness of mammalian carnivores (9.34) than unsuitable puma habitat (4.37). In addition to providing valuable life-history data for macroecological analyses, these models allow species co-occurrence patterns to be quickly estimated at a fine spatial resolution, which has historically been an impediment to evaluating the utility of umbrella species. KEYWORDS: carnivore, connectivity, cougar, fragmentation, habitat modeling, mountain lion,
puma, Puma concolor, umbrella species
Session 5: WFA – Felid Population Monitoring
113
INTRODUCTION
Macroecology is the study of factors influencing the distribution and abundance of species at
large spatial or temporal scales (Brown 1995). One overriding challenge for any macroecological
study is obtaining sufficient large-scale data on species’ distributions. Although some species,
notably birds, can be surveyed at national or continental scales, these data are unavailable for
secretive, low-density carnivores like the puma (Puma concolor). Consequently, most
macroecological analyses of carnivores have been conducted using only coarse information
about the distribution of these animals. One distribution metric that is widely used in
macroecological studies is the area of the geographic range.
The current extents of all mammalian geographic ranges, including the puma (Figure 1),
were recently reassessed and digitized as part of the International Union for the Conservation of
Nature’s (IUCN) Global Mammal Assessment (Schipper et al. 2008). This map of the puma’s
geographic range depicts what is known as the extent of occurrence, or the entire area in which
the species has been known to occur (Gaston 1991). For the puma, the extent of occurrence is
undoubtedly an optimistic estimate of the actual species distribution, primarily because it does
not account for the differences in habitat suitability that determine whether an area contains
sufficient resources to support a puma population. To better depict the distributions of all
mammals, the geographic-range maps produced as part of the IUCN’s Global Mammal
Assessment were recently merged with expert-based habitat-suitability models (Rondinini et al.
2011). Instead of the extent of occurrence, these habitat-suitability models estimate what is
known as the area of occupancy, or the area within the geographic range where the species is
likely to be present (Gaston 1991). These new habitat-suitability models are therefore designed
to better depict the actual distributions of mammals.
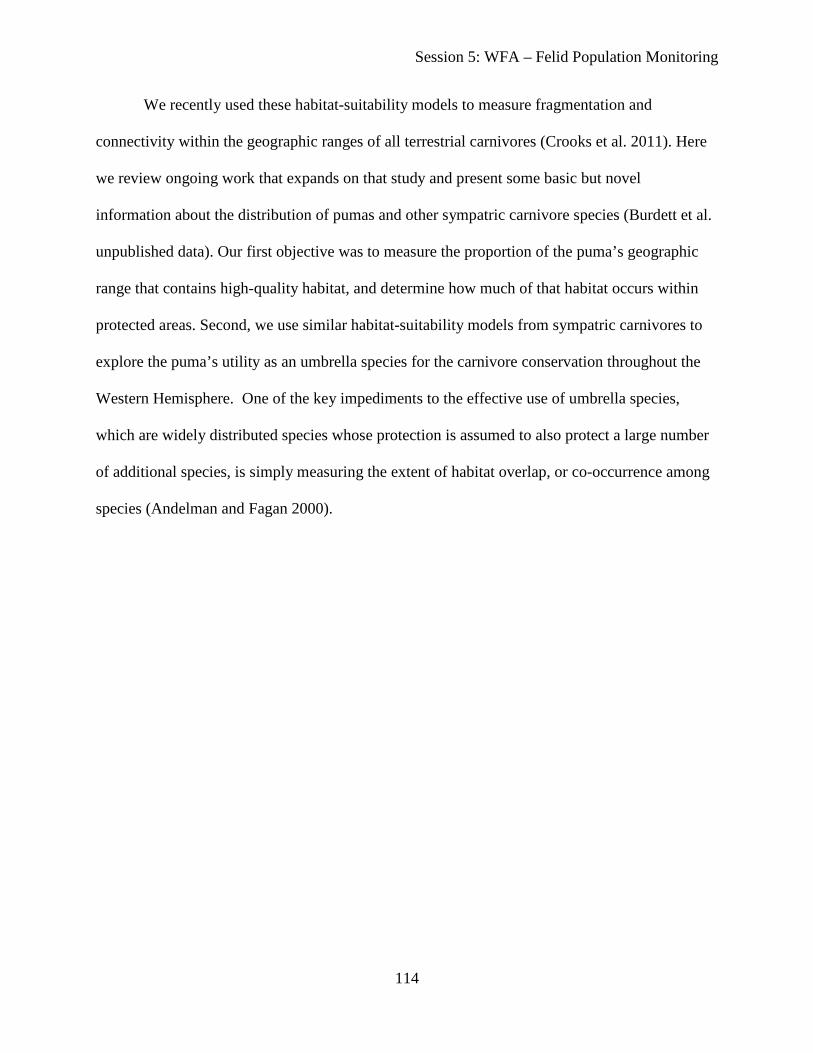
Session 5: WFA – Felid Population Monitoring
114
We recently used these habitat-suitability models to measure fragmentation and
connectivity within the geographic ranges of all terrestrial carnivores (Crooks et al. 2011). Here
we review ongoing work that expands on that study and present some basic but novel
information about the distribution of pumas and other sympatric carnivore species (Burdett et al.
unpublished data). Our first objective was to measure the proportion of the puma’s geographic
range that contains high-quality habitat, and determine how much of that habitat occurs within
protected areas. Second, we use similar habitat-suitability models from sympatric carnivores to
explore the puma’s utility as an umbrella species for the carnivore conservation throughout the
Western Hemisphere. One of the key impediments to the effective use of umbrella species,
which are widely distributed species whose protection is assumed to also protect a large number
of additional species, is simply measuring the extent of habitat overlap, or co-occurrence among
species (Andelman and Fagan 2000).
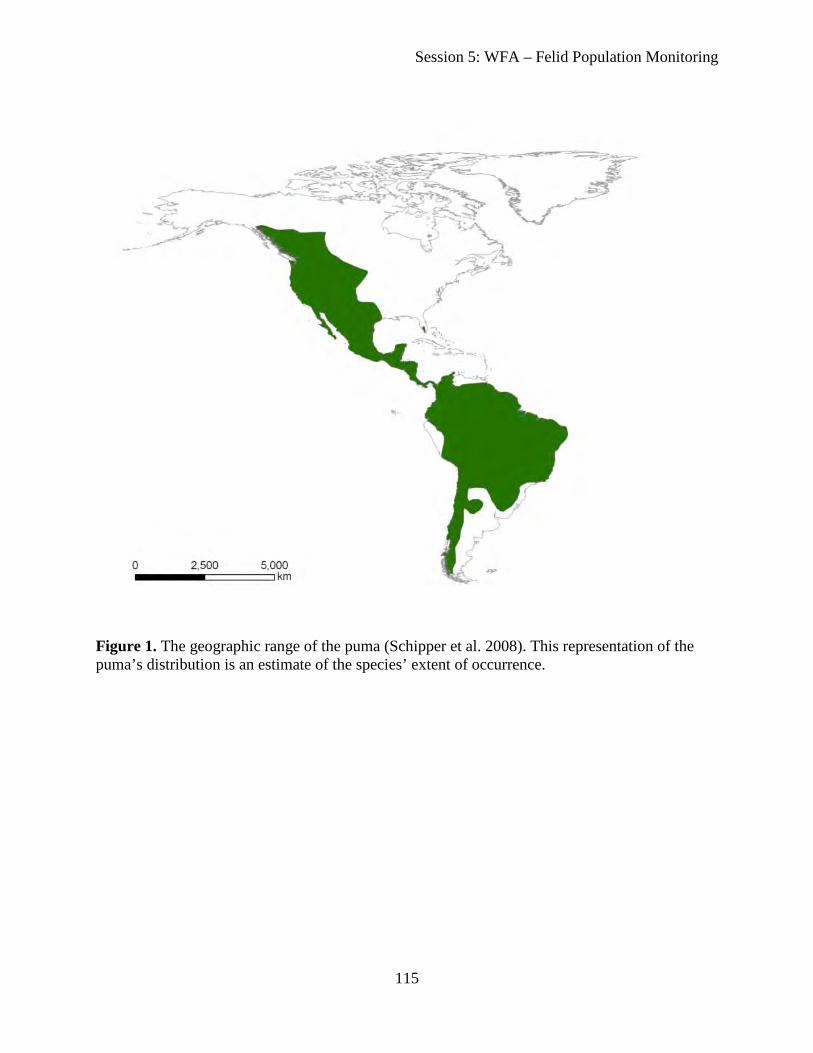
Session 5: WFA – Felid Population Monitoring
115
Figure 1. The geographic range of the puma (Schipper et al. 2008). This representation of the puma’s distribution is an estimate of the species’ extent of occurrence.

Session 5: WFA – Felid Population Monitoring
116
METHODS
Habitat-suitability models
Rondinini et al. (2011) recently developed expert-based habitat-suitability models for all extant
terrestrial and semi-aquatic mammals (n = 5315 species). These models assessed habitat
suitability at a 300m resolution and were restricted to the area within the updated geographic
ranges of mammals (Schipper et al. 2008). Habitat suitability was assessed for four
environmental variables (elevation, land cover, human impact, and hydrological features) using
the expert opinions (i.e., both numerical and textual data) collected as part of the IUCN’s Global
Mammal Assessment. The models define three levels of habitat suitability: 1) high, which
represents the primary habitat of a species that contains sufficient resources for persistence, 2)
medium, which represents the secondary habitat of a species, where presence is possible but
persistence is unlikely without nearby high-quality habitat, and 3) unsuitable, which represents
places where the species is not expected to be found. The models also depict the area of habitat
that occurs within protected areas. Additional methodological details are available in Rondinini
et al. (2011).
We used the puma habitat-suitability model to measure the puma’s extent of occurrence
(i.e., the total area within the boundaries of its geographic range) and estimated area of
occupancy (i.e., the proportion of the puma’s geographic range that is high-quality habitat). We
also measured the proportion of high-quality habitat that occurs within protected areas.
The puma as an umbrella species for felid and carnivore conservation
We also used the habitat-suitability models of Rondinini et al. (2011) to quantify the overlap
among high-quality habitat for the puma and other Western Hemisphere carnivores. First, we
Session 5: WFA – Felid Population Monitoring
117
measured the percentage of overlap between the puma’s high-quality habitat and the high-quality
habitat of the 11 other Western Hemisphere felids, which are the Andean cat (Leopardus
jacobita), bobcat (Lynx rufus), Canada lynx (Lynx canadensis), Geoffroy’s cat (Leopardus
geoffroyi), guigña (Leopardus guigna), jaguar (Panthera onca), jaguarundi (Puma
yagouaroundi), margay (Leopardus wiedii), ocelot (Leopardus pardalis), oncilla (Leopardus
tigrinus), and Pampas cat (Leopardus colocolo). The geographic ranges of all 11 Western
Hemisphere felids at least partly overlap with the geographic range of the puma. Second, to
assess overlap between the puma’s high-quality habitat and other sympatric carnivores, we
created a species richness map for all 79 terrestrial carnivore species of the Western Hemisphere
and measured the mean ± SD carnivore species richness that occurred in high-quality puma
habitat. For comparison, we also measured the mean ± SD carnivore species richness of the
unsuitable habitat within the geographic range of the puma.
RESULTS
The area of the puma’s geographic range was 22,284,237 km2, of which 75% (16, 756, 875 km2)
was high-quality habitat (Figure 2). These are the largest values among all carnivores whose
distribution occurs only within the Western Hemisphere. Nonetheless, only 6% of the puma’s
high-quality habitat (1,391,261 km2) occurred within protected areas.
Between 22 - 97% (mean ± SE = 75 ± 8%) of the high-quality habitat of other Western
Hemisphere felids occurred within high-quality puma habitat (Fig. 3). The high-quality habitat of
three felid species classified by the IUCN as vulnerable (guigña and oncilla) or endangered
(Andean cat) all overlapped the puma’s high-quality habitat by over 90%. Adjusting for
spatially-explicit patterns of co-occurrence, we found 19 carnivore species was the maximum
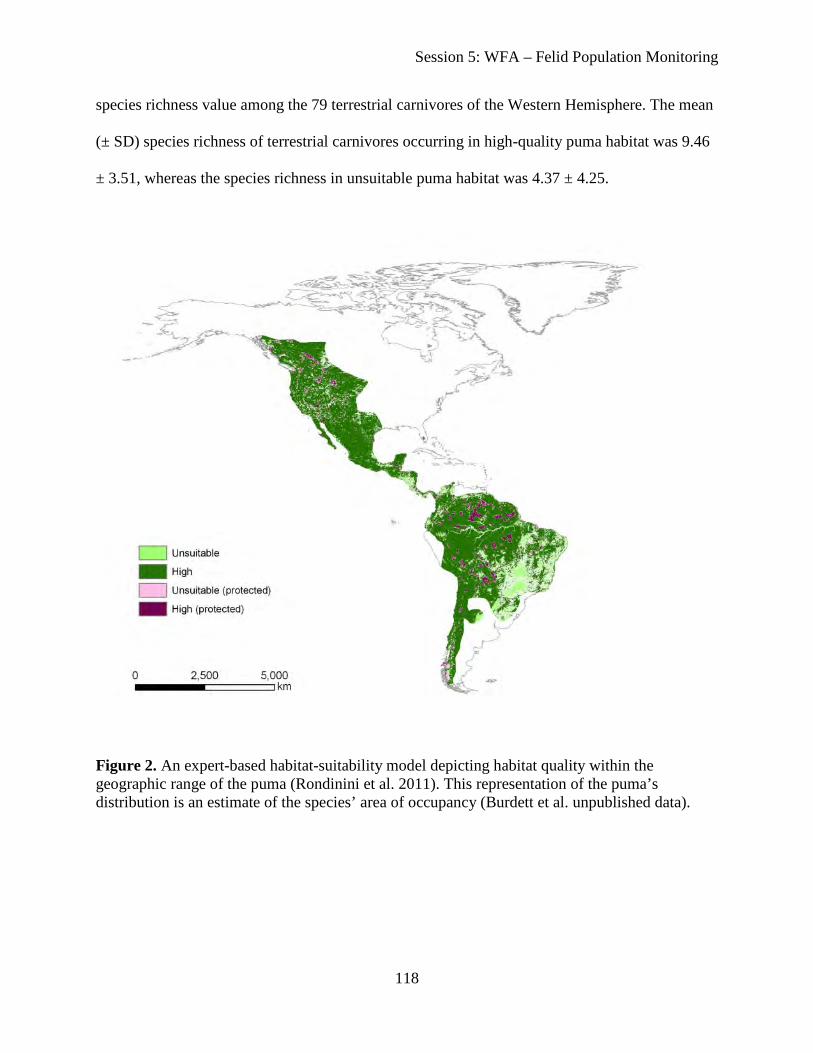
Session 5: WFA – Felid Population Monitoring
118
species richness value among the 79 terrestrial carnivores of the Western Hemisphere. The mean
(± SD) species richness of terrestrial carnivores occurring in high-quality puma habitat was 9.46
± 3.51, whereas the species richness in unsuitable puma habitat was 4.37 ± 4.25.
Figure 2. An expert-based habitat-suitability model depicting habitat quality within the geographic range of the puma (Rondinini et al. 2011). This representation of the puma’s distribution is an estimate of the species’ area of occupancy (Burdett et al. unpublished data).
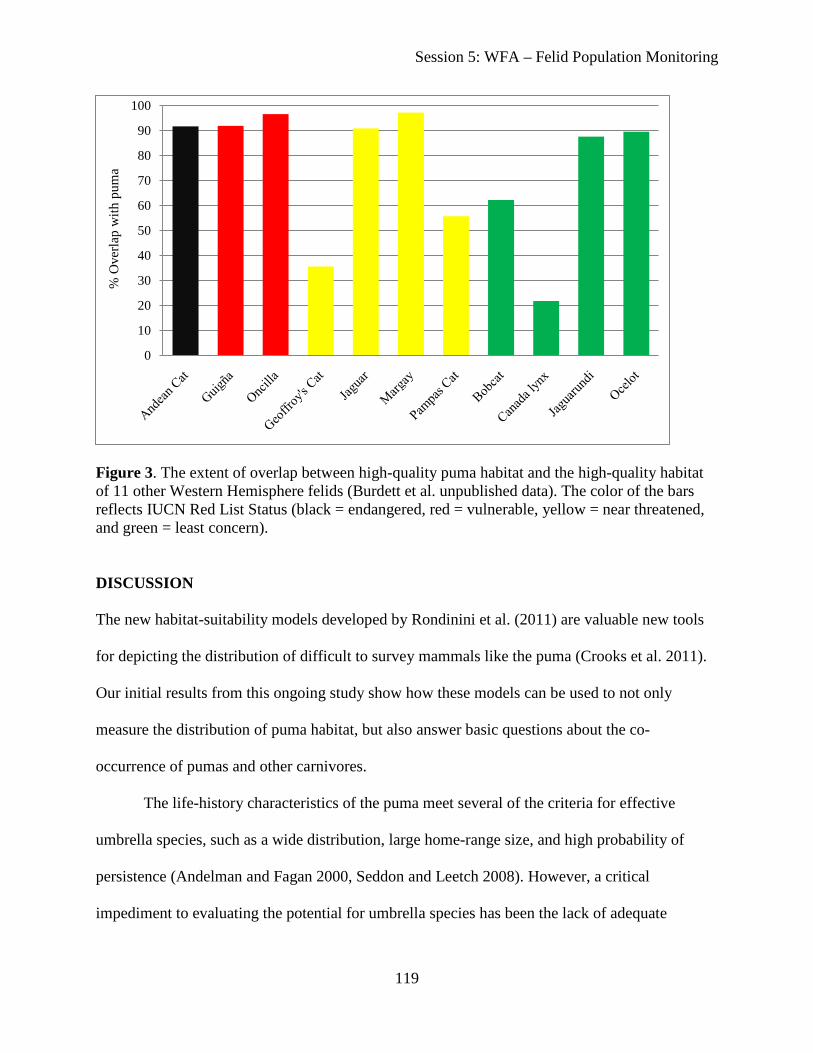
Session 5: WFA – Felid Population Monitoring
119
Figure 3. The extent of overlap between high-quality puma habitat and the high-quality habitat of 11 other Western Hemisphere felids (Burdett et al. unpublished data). The color of the bars reflects IUCN Red List Status (black = endangered, red = vulnerable, yellow = near threatened, and green = least concern).
DISCUSSION
The new habitat-suitability models developed by Rondinini et al. (2011) are valuable new tools
for depicting the distribution of difficult to survey mammals like the puma (Crooks et al. 2011).
Our initial results from this ongoing study show how these models can be used to not only
measure the distribution of puma habitat, but also answer basic questions about the co-
occurrence of pumas and other carnivores.
The life-history characteristics of the puma meet several of the criteria for effective
umbrella species, such as a wide distribution, large home-range size, and high probability of
persistence (Andelman and Fagan 2000, Seddon and Leetch 2008). However, a critical
impediment to evaluating the potential for umbrella species has been the lack of adequate
0
10
20
30
40
50
60
70
80
90
100%
Ove
rlap
with
pum
a
Session 5: WFA – Felid Population Monitoring
120
distribution data to assess species co-occurrence (Andelman and Fagan 2000). The habitat-
suitability models of Rondinini et al. (2011) help overcome this problem by providing a better
estimate of the area that pumas actually occupy within their geographic range.
The puma has been previously promoted as a flagship or umbrella species for regional
habitat-connectivity planning (Beier et al. 2006, Morrison and Boyce 2009). Our results suggest
the puma also has value for habitat conservation at larger scales. Specifically, we found that
puma habitat overlapped extensively with the habitat other sympatric carnivores. The extensive
overlap between the puma’s habitat and that of other, more threatened, felid species suggests the
puma could have particular value as an umbrella species for the conservation of Western
Hemisphere felids. Additional studies will be necessary to corroborate whether the conservation
and management needs of pumas actually benefit co-occurring felids or other carnivore species,
especially those classified by the IUCN as vulnerable and endangered. Nonetheless, our
preliminary analyses suggest that the puma could be an effective umbrella species for
conservation planning in the Western Hemisphere.
LITERATURE CITED
Andelman, S.J., and W.F. Fagan. 2000. Umbrellas and flagships: efficient conservation surrogates of expensive mistakes? Proceedings of the National Academy of Sciences 97:5954-5959.
Beier, P., K.L. Penrod, C. Luke, W.D. Spencer, and C. Cabaňero 2006. South Coast Missing
Linkages: restoring connectivity to wildlands in the largest metropolitan area in the USA. Pages 555-586 in K.R. Crooks and M. Sanjayan, editors. Connectivity conservation. Cambridge University Press, Cambridge, UK.
Brown, J.H. 1995. Macroecology. University of Chicago Press, Chicago, Illinois, USA. Crooks, K.R., C.L. Burdett, D.M. Theobald, C. Rondinini, and L. Boitani. 2011. Global patterns
of fragmentation and connectivity of mammalian carnivore habitat. Philosophical Transactions of the Royal Society B 366:In Press.

Session 5: WFA – Felid Population Monitoring
121
Gaston, K.J. 1991. How large is a species’ geographic range? Oikos 61:434-438. Morrison, S.A., and W.M. Boyce. 2009. Conserving connectivity: some lessons from mountain
lions in southern California. Conservation Biology 23:275-285. Rondinini, C., M. Di Marco, F. Chiozza, G. Santulli, D. Baisero, P. Visconti, M. Hoffmann, J.
Schipper, S. N. Stuart, M.F. Tognelli, G. Amori, A. Falcucci, L. Maiorano, L.Boitani. 2011. Global habitat suitability models of terrestrial mammals. Philosophical Transactions of the Royal Society B 366:In Press
Schipper, J. et al. 2008. The status of the world’s land and marine mammals: diversity, threat,
and knowledge. Science 322:225-230. Seddon, P.J., and T. Leech. 2008. Conservation short cut, or long and winding road? A critique
of umbrella species criteria. Oryx 42: 240-245.
Session 5: WFA – Felid Population Monitoring
122
Pilot Study on Scat Detection Dogs for Cougar Population Estimation Gregory A. Davidson, Oregon Department of Fish & Wildlife, 1401 Gekeler Lane, La Grande,
OR 97850, USA, [email protected] (presenter) Darren A. Clark, Oregon State University, Department of Fisheries and Wildlife, Nash Hall,
Room 104, Corvallis, OR 97331, [email protected] Bruce K. Johnson, Oregon Department of Fish & Wildlife, 1401 Gekeler Lane, La Grande, OR 97850, USA, [email protected] Abstract. Estimating cougar (Puma concolor) populations is fraught with difficulties because of the cougar’s solitary and elusive habits as well as their low densities. Currently, the most accurate estimates for cougar populations involve intensive capturing of cougars to approximate a census. Noninvasive sampling methods are increasingly being used to monitor carnivore populations and offer a less intrusive and more economical alternative over traditional mark-recapture techniques. We are exploring utilizing scat detecting dogs (Canis familiaris) to collect scat and estimate the cougar population across a 2000 km2 study area in northeast Oregon. Beginning this spring, we will take 2 dog teams in the field to determine how many scats can be located per dog team per sampling session. Our study design will then be developed that will accomplish the goals of covering a large area, collect a sufficient amount of scat for unbiased and precise estimates, account for heterogeneity, satisfy closed model assumptions, and be economically feasible. We will explore increasing precision of estimates by using a stratified random sample in which the study area is divided up into high, medium, and low areas of expected cougar densities based on current research in the area. We will explore single and multiple survey sessions in order to meet model requirements. We will test 2 methods of incorporating heterogeneity into capture probability estimates – CAPWIRE, and a generalization of the closed population capture-recapture models. As a result of this presentation, we hope to generate discussion and promote collaboration from other researchers who have dealt with some of the issues addressed above.
Session 5: WFA – Felid Population Monitoring
123
Noninvasive Tracking of Jaguars (Panthera onca) and Co-Occurring Felids by Combining Molecular Scatology, Remote Camera Trapping and GIS in Belize, Central America Claudia Wultsch, Department of Fisheries and Wildlife Sciences, 106 Cheatham Hall, Virginia
Tech, Blacksburg, VA 24061-0321, USA, 540-231-7710, Fax: 540-231-7580, e-mail: [email protected] (presenter)
Marcella J. Kelly, Department of Fisheries and Wildlife Sciences, 146 Cheatham Hall, Virginia
Tech, Blacksburg, VA 24061-0321, USA, [email protected] Lisette P. Waits, Department of Fish and Wildlife Resources, University of Idaho, ID 83844-
1136, USA, [email protected] Abstract: Jaguars (Panthera onca), mountain lions (Puma concolor) and other elusive felids are extremely difficult to study due to their wide ranging behavior, crepuscular activity peaks, and their occurrence at low population densities. We demonstrate the feasibility of noninvasive research approaches such as scat detector dogs, molecular scatology and remote cameras to study these species and other co-occurring wild felids (ocelot, jaguarondi, margay) across fragmented tropical forest habitats in Belize, Central America. We used the survey techniques simultaneously across 5 study sites from 2007-2010 to gain valuable information on population densities, genetic variation and connectivity of wild felid populations which will ultimately help to assess their conservation status within the country. An initial pilot study helped us to identify the most efficient scat collection and storage techniques for our target species. Furthermore we optimized laboratory methods to amplify 14 highly polymorphic microsatellite loci which are used to determine species and individual ID for all felid scats collected. We also provide several recommendations for scat detector dog work conducted in hot and humid climates. The preliminary results presented here intend to provide an overview of our findings and demonstrate that the techniques used enable large-scale and multiple species monitoring of elusive felids occurring in tropical environments. The elusive jaguar (Panthera onca) is extremely difficult to study due to its wide ranging
movements, crepuscular activity peaks and its occurrence in low population densities in often
dense forest habitats. It is the least studied of all large cats and as a result, little is known about
its ecology. Listed as near threatened (IUCN 2011), some jaguar populations face local
extirpation due to habitat loss, fragmentation and direct persecution (Ruiz-Garcia et al. 2006).
Due to increased human presence, forest areas have disappeared and/or have been reduced to
small, isolated patches. Severe habitat loss and fragmentation has resulted in a more than fifty

Session 5: WFA – Felid Population Monitoring
124
percent decrease in the jaguar's historic range, and jaguars now exist often in highly fragmented
populations spread across Central and South America. Loss of large carnivores has ramifications
for biodiversity conservation because these species can have broad impacts on ecosystems.
Ecosystems where top predators have been removed have been shown to suffer trophic cascades
whereby smaller predators (or prey) increase dramatically in number and, in-turn, decimate their
prey which can then result in altering vegetation structure (Terborgh et al. 2001). Additionally,
protecting carnivores often requires establishing large reserves that protect substantial
biodiversity allowing such animals to function as umbrella species. Jaguars are a species of
concern, but our ability to provide for their survival is hampered by our inability to obtain
reliable information on the status of their wild populations, which is crucial for successful
wildlife management and conservation in the future.
Studying tropical felids often requires physical capture, handling and extensive subsequent
monitoring, an approach which is intrusive, expensive, time-consuming, often dangerous, and
considering its low sample sizes, not efficient enough to gather information relevant to
conservation. Noninvasive monitoring techniques such as remote camera trapping have been
developed in response to these inadequacies. Camera-trapping, where wild felids are captured on
film and identified by their distinct coat patterns, has provided the first repeatable estimates of
densities and sex-ratios for jaguars (Silver et al. 2004). Yet this technique has limitations. It tends
to photograph a disproportionate number of males which might result in inaccurate population
estimates. Furthermore, due to severe loss and fragmentation of jaguar habitat, there is a great
need to study the effects these two major threats may have on wild felid populations and examine
whether they suffer from reduced genetic variation or an alteration in population structure, often
caused by low levels of gene flow between populations. Severe isolation of entire populations

Session 5: WFA – Felid Population Monitoring
125
may decrease the genetic variation within the population resulting in lower fitness (e.g. lower
survival and/or reproduction) and the loss of adaptive potential (i.e. ability of animals to adapt to
a changing environment) (Frankham and Ralls 1998).
Molecular scatology is a relatively recent advancement in non-invasive genetic monitoring,
where individuals are genotyped from intestinal epithelial cells found in their feces (scat) (Kohn
et al. 1999). This technique is especially suitable for elusive and hard to detect species such as
jaguars since scat is a prominent sign the animals leave behind for intra-specific communication
and territorial marking. Without ever capturing wild felids and by simply collecting and
analyzing their scat samples, molecular scatology is a powerful approach applicable for
identification of species, gender and individuals. It can be also used for population size
estimation and monitoring (Ernest et al. 2001). Furthermore, molecular scatology also provides
the means to analyze genetic variation and population structure of wild felid populations giving
insight into genetic health and the degree of population connectivity across the landscape.
Molecular population genetics approaches on jaguars are rare (Ruiz-Garcia et al. 2006; Eizirik et
al. 2001), and noninvasive fecal genotyping of wild jaguars has only been conducted on a small
scale. This project is the first large-scale genetic study which genotypes jaguars across the
country of Belize, Central America. A set of 14 highly variable microsatellite primers is used to
estimate population size and density, and to determine sex ratio, genetic structure and variability
of felid populations on a country-wide scale. Co-occurring cat species such as mountain lion
(Puma concolor), ocelot (Leopardus pardalis), margay (Felis wiedii), and jaguarundi
(Herpailurus yaguarondi) are also genotyped for the same purpose. This study will provide
crucial information on the coexistence of these elusive carnivore species. The felids are
Session 5: WFA – Felid Population Monitoring
126
simultaneously monitored by remote camera traps which allows for a pioneering comparison of
density estimates obtained from these two non-invasive techniques in tropical environments.
Finding scat of wide-ranging carnivores can be difficult, particularly in thick tropical
vegetation and in a hot and humid climate where feces decompose much faster and the scat DNA
has a high potential to show genotyping error caused by allelic dropout, PCR failure, or
contamination. Because of these concerns and also due to a lack of an established protocol for
locating, collecting, storing and analyzing scat samples of elusive felid species in the tropics, the
feasibility of the molecular scatology approach was evaluated during a pilot study conducted in
two initial study sites in Belize: the Mountain Pine Ridge Forest Reserve and the Rio Bravo
Conservation and Management Area. A scat detector dog (originally bomb/drug detector dog)
was used to increase the detection rate of scat samples in the field since professionally trained
dogs detect target scats much faster and more successfully than an experienced person searching
for scat visually (Long et al. 2007). The scat dog survey was conducted based on an
opportunistic search design and simultaneously with the camera trap study within an effective
survey area of ~216 km2. The study areas were superimposed with a grid consisting of 10-13 (4 x
4 km) cells and each cell was searched 4-5 times to create 4-5 encounter occasions for
subsequent mark-recapture population density analysis. During the pilot study 375 scat samples
were collected. DNA samples can be collected from different locations on the scat which may
vary in DNA quality and quantity due to factors such as mold, UV-light, contamination with
prey DNA, etc. Thus, DNA amplification success rates from samples collected from four
different scat locations (top, bottom, side, and inside) were tested. Also, two different storage
techniques, 95% ethanol and DET buffer at 1:4 ratio by volume, which can be both stored under
room temperature, were further investigated. The four scat locations differ significantly with
Session 5: WFA – Felid Population Monitoring
127
highest success rates for DNA samples collected from the often more dry and less moldy top
(74.38%) and side (74.88%) locations of scat samples. The comparison of the two storage
techniques resulted in significantly higher amplification success rates for DET buffer (68.80%)
versus 95% ETOH (49.98%). Based on a large sample size and high DNA amplification success
rates (> 70%), we conclude that scat detector dogs and the molecular scatology approach can be
successfully applied to survey multiple elusive carnivore species simultaneously in tropical
environments.
Belize currently is experiencing widespread land conversion and development, as well as
privatization of public lands. The large number of reserves with various degrees of fragmentation
and human impacts makes Belize an excellent location to examine the impact of fragmentation
on felid distribution, abundance, connectivity and gene flow countrywide. Since dispersal is
dependent on geographical and environmental landscape features (Manel et al. 2003), a
landscape genetic study will be conducted examining various factors facilitating genetic
connectivity. We hypothesize that jaguars living in most northern and southern sites of Belize
exist in lower population densities and experience lower levels of genetic connectivity due to the
highly isolated protected areas in these parts of the country and a higher degree of human
disturbance. We will determine if natural or anthropogenic barriers in the landscape, geographic
distance or the degree a heterogeneous landscape facilitates movement drive gene flow in the
landscape and cause population structure by testing several hypotheses of landscape resistance
(Cushman et al. 2006). Noninvasive genetic sampling combined with landscape genetics
techniques will help to identify and map the strongest relationship between the landscape and
population structure of felids. This approach provides more insight for conservation and
Session 5: WFA – Felid Population Monitoring
128
management by identifying potential movement corridors (if needed) for multiple felids across
the fragmented landscape of Belize counteracting genetic isolation.
Noninvasive survey techniques such as molecular scatology and remote camera trapping
made it possible to study multiple felids noninvasively across Belize and to explore and compare
new techniques and types of analysis used for capture-mark recapture (photographic and genetic
data), conservation and landscape genetics studies with the main goal to combine results from
spatial, genetic and demographic analyses to examine the conservation status of wild felids
countrywide. To date, a total of 1190 felid scat samples have been collected in the wild and 160
individual felids (68 jaguars, 56 mountain lions, 29 ocelots and 7 margays) have been genetically
identified so far. Compared to previous studies which used only small sample sizes mainly
collected from zoos or museums, this project allows us to conduct a population genetic study on
multiple wild cat species on a country-wide scale. This information is crucial for future
conservation and management actions such as increasing understanding of landscape effects on
genetic connectivity of felid populations, identifying local felid populations under threat and
establishing corridors between more isolated populations to ensure their survival also in a
fragmented landscape. Besides developing and optimizing protocols for molecular scatology and
scat detector dog studies in the tropics, the techniques and analysis developed will serve as
model system, widely applicable and relevant for the conservation of endangered carnivore
species existing in fragmented and changing landscapes worldwide.
Session 5: WFA – Felid Population Monitoring
129
LITERATURE CITED
Cushman S.A., K.S. McKelvey, J. Hayden, and M.K. Schwartz. 2006. Gene flow in complex landscapes: Testing multiple hypotheses with causal modeling. American Naturalist 168: 486–499.
Eizirik, E., J.-H. Kim, et al. 2001. Phylogeography, population history and conservation genetics of jaguars (Panthera onca). Molecular Ecology 10: 65-79.
Ernest, H., Penedo M., et al. 2000. Molecular tracking of mountain lions in the Yosemite Valley region in California: genetic analysis using microsatellites and faecal DNA. Molecular Ecology 9: 433-441.
Frankham, R. and K. Ralls. 1998. Conservation biology: Inbreeding leads to extinction. Nature 392: 441-442.
IUCN 2011. IUCN Red List of Threatened Species. Version 2011.1. <www.iucnredlist.org>. Downloaded on 5 June 2011.
Kohn, M.H., York, E.C., et al. 1999. Estimating population size by genotyping faeces. Proceedings of the Royal Society B: Biological Sciences 266(1420): 657-657.
Long, R.A., Donovan, T.M., MacKay, P., Zielinski, W.J., and J.S. Buzas. 2007. Effectiveness of Scat Detection Dogs for Detecting Forest carnivores. The Journal of Wildlife Management 71(6): 2007-20.
Manel S., M.K. Schwartz, G. Luikart., and P. Taberlet. 2003. Landscape genetics: combining landscape ecology and population genetics. Trends in Ecology and Evolution 18: 189–197.
Ruiz-Garcia, M., Payan E., et al. 2006. DNA microsatellite characterization of the jaguar (Panthera onca) in Colombia. Genes & Genetic Systems 81(2): 115-127.
Silver, S.C., Ostro, L.E.T., Marsh, L.K., Maffei, L., Noss, A.J., Kelly, M.J., Wallace, R.B., Gomez, H. and G. Ayala. 2004. The use of camera traps for estimating jaguar abundance and density using capture/recapture analysis. Oryx 38:148-154.
Terborgh, J., L. Lopez, P. Nufiez V., M. Rao, G. Shahabuddin, G. Orihuela, M. Riveros, R. Ascanio, G. H. Adler, T. D. Lambert, and L. Balbas. 2001. Ecological meltdown in predator-free forest fragments. Science 294: 1923-1925.
Session 5: WFA – Felid Population Monitoring
130
Estimating Detection Probability for Canada Lynx Using Snow-Track Surveys in the Northern Rocky Mountains John R. Squires, U.S. Forest Service, Rocky Mountain Research Station, 800 E. Beckwith,
Missoula, MT 59801, USA, [email protected] (presenter) Lucretia E. Olson, U.S. Forest Service, Rocky Mountain Research Station, 800 E. Beckwith,
Missoula, MT 59801, USA, [email protected] David L. Turner , U.S. Forest Service, Rocky Mountain Research Station, 860 North 1200 E.
Logan, UT 84321, USA, [email protected] Nicholas J. DeCesare, College of Forestry and Conservation, University Of Montana, Missoula,
MT 59812, USA, [email protected] Jay A. Kolbe, Montana Fish, Wildlife and Parks, P.O. Box 1288, Seeley Lake, MT 59868, USA,
[email protected] Abstract: During winter of 2006 and 2007, we used snow-tracking surveys to determine the probability of detecting Canada lynx (Lynx canadensis) in areas where lynx were known to be present in the northern Rocky Mountains, Montana, USA. We used this information to determine the minimum number of survey replicates necessary to confidently infer the presence and absence of lynx in areas of similar lynx density. In the Purcell Mountains, we sampled a total of 50 survey routes (24 in 2006 and 26 in 2007) for a total of 504 km surveyed over all grid cells. We detected lynx tracks 424 times during the 2 years of sampling. Average survey distance per lynx detection was 0.9 km (SD = 1.2 km, range = 0.02 – 9.1 km, n = 424). In the Seeley Lake area, we sampled 35 survey routes (18 in 2006 and 17 in 2007) and surveyed 371 km total. We detected lynx 130 times during the 2 years of sampling. Average survey distance per lynx detection was 1.8 km (SD = 2.1 km, range = 0.08 – 9.8 km, n = 130). Our track encounter rate averaged 2.9 lynx detections / 10 km of survey distance. The probability of detecting lynx in mountainous habitats that support resident populations was 0.8 – 0.99 when surveys were conducted on an 8 x 8 km2 grid with 10 km of search effort per cell. Snow-track surveys were highly successful at detecting the presence of Canada lynx over large landscapes. Two survey replicates were needed to establish Canada lynx absence with 95% certainty. The high probability of detection associated with snow-track surveys makes this method useful for documenting populations of Canada lynx in areas where their presence is uncertain.
Session 5: WFA – Felid Population Monitoring
131
Conceptual Framework for Estimating Mountain Lion Density with Motion-activated Cameras Jesse Lewis, Department of Fish, Wildlife, and Conservation Biology, Colorado State University, Fort Collins, CO 80523, [email protected] (presenter) Kevin Crooks, Department of Fish, Wildlife, and Conservation Biology, Colorado State University, Fort Collins, CO 80523, [email protected] Larissa Bailey, Department of Fish, Wildlife, and Conservation Biology, Colorado State University, Fort Collins, CO 80523, [email protected] Linda Sweanor, President of Wild Felid Association, Montrose, CO, [email protected] Brady Dunne, Colorado Division of Wildlife, Montrose, CO, [email protected] Sue VandeWoude, Department of Microbiology, Immuniology, and Pathology, Colorado State University, Fort Collins, CO 80523, [email protected] Ken Logan, Colorado Division of Wildlife, Montrose, CO, [email protected] Abstract: Reliable population estimates of wildlife are critical for management and conservation. It is particularly challenging to obtain population estimates of mountain lions due to their secretive nature, inherently low population densities, and wide-ranging movements. Estimates of population characteristics for mountain lions would be especially useful to wildlife agencies in western states that manage hunting seasons on these populations. The goal of this ongoing pilot study was to evaluate whether reasonable estimates of mountain lion density could be obtained with motion-activated cameras to inform future efforts to estimate mountain lion densities across an appropriately broader spatial scale. Our study site consisted of 40 motion-activated camera sites spaces approximately 2-km apart within two 80 km2 grids, constructed on the Uncompahgre Plateau, CO, for the primary purposes of estimating occupancy of sympatric mountain lions and bobcats and to estimate bobcat density. Using mark-resight techniques in program MARK, we estimated the super population size of mountain lions using our camera grids and then used telemetry data to determine the amount of time that animals spent on camera grids to estimate population density for our grid areas. This mountain lion population has been the subject of an intensive radio-collaring and demographic study since 2004. Over a 3.5 month period during summer and fall 2009, we obtained 80 photographs of lions (51 marked, 29 unmarked) and detected 9 marked mountain lions using our sampling grids. The amount of time spent on grids was calculated for 8 mountain lions wearing functioning telemetry collars and ranged between 8 – 64%. We discuss how these results could inform camera grid designs scaled specifically to mountain lions to obtain better population estimates. These considerations might also be useful for designing camera and mark-resight methods for other species of large solitary-living felids.
Session 5: WFA – Felid Population Monitoring
132
KEYWORDS: cougar, density, mark-resight, motion-activated cameras, mountain lion,
population estimation, Puma concolor
INTRODUCTION
Estimates of population size, density, and trend for mountain lions (Puma concolor) have been
obtained through intensive telemetry studies (Logan and Sweanor 2001), track surveys
(Smallwood and Fitzhugh 1995), and identifying unique individuals based on natural markings
using motion-activated cameras (Kelly et al. 2008; Negroes et al. 2010). If a proportion of a
mountain lion population consists of marked individuals (e.g., through telemetry collars and/or
eartags), motion-activated cameras can also be used to estimate population size using mark-
resight techniques (McClintock et al. 2009). Estimates of population size can then be used in
conjunction with the amount of time that animals spent on the sampling grid to estimate the
density of animals within the grid (White and Shenk 2001).
Our objective is to outline a conceptual framework that can be used to estimate the super
population size and density of mountain lions, which is part of an ongoing pilot effort that we
conducted on the Uncompahgre Plateau, CO in 2009. The ultimate goal of our work is to
demonstrate how reliable population estimates can be obtained through a mark-resight
framework to inform future efforts that would conduct similar techniques across a broader spatial
extent appropriate for mountain lions. Such information would be invaluable for managing and
conserving mountain lion populations, especially those that experience harvest by sportsmen.
STUDY AREA
Our work was conducted in southwest Colorado on the Uncompahgre Plateau to the west of
Montrose, CO (Figure 1). The area was characterized by mesas, canyons, and ravines, which
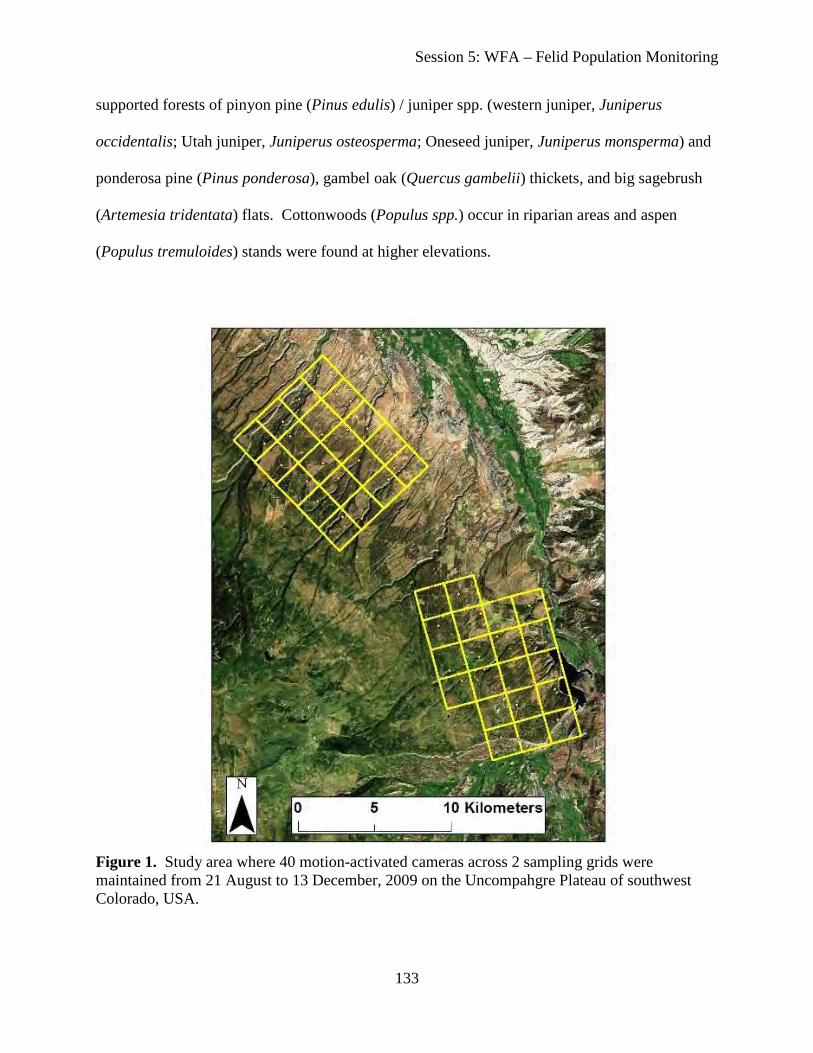
Session 5: WFA – Felid Population Monitoring
133
supported forests of pinyon pine (Pinus edulis) / juniper spp. (western juniper, Juniperus
occidentalis; Utah juniper, Juniperus osteosperma; Oneseed juniper, Juniperus monsperma) and
ponderosa pine (Pinus ponderosa), gambel oak (Quercus gambelii) thickets, and big sagebrush
(Artemesia tridentata) flats. Cottonwoods (Populus spp.) occur in riparian areas and aspen
(Populus tremuloides) stands were found at higher elevations.
Figure 1. Study area where 40 motion-activated cameras across 2 sampling grids were maintained from 21 August to 13 December, 2009 on the Uncompahgre Plateau of southwest Colorado, USA.
Session 5: WFA – Felid Population Monitoring
134
METHODS
Camera Placement
Our study site consisted of 2 grids of motion-activated cameras (Figure 1; area 1 = southern grid,
area 2 = northern grid). Each grid was comprised of 20 sampling cells that measured 2 x 2 km.
Our grid layout was designed to evaluate the occupancy of mountain lions and bobcats (Lynx
rufus) and estimate density of bobcats. Within each cell, we placed 1 Cuddeback Capture white-
flash motion-activated camera at a site that we believed maximized the opportunity to
photograph both mountain lions and bobcats. Cameras were placed along game trails, people
trails, and secondary dirt roads where felid sign was observed or in areas that appeared to be
likely travel routes for felids. Our sampling was passive in that we did not use attractants (i.e.,
sight, sound, scent) to lure animals in front of the camera. Cameras were operational from
August 21 to December 13, 2009. We visited each camera approximately every 2 weeks to
replace memory cards and batteries if necessary.
Marked Mountain Lions
As part of an ongoing research project through the Colorado Division of Wildlife, mountain lions
were captured with the use of hounds and cage traps for 5 years leading up to the camera study.
Animals were fit with either GPS or VHF collars as well as eartags – we used these marks to
assist in identifying individuals. GPS collars attempted a location every 6 hours and animals
wearing VHF collars were located via aerial telemetry approximately every 2 weeks.
Estimating Super Population Size and Density of Mountain Lions
To estimate the super population size (number of individuals that used the sampling grids during
the period of our camera surveys) we used mark-resight techniques and the Poisson log-normal
mixed effects model (PNE; McClintock et al. 2009) in Program MARK (White and Burnham
Session 5: WFA – Felid Population Monitoring
135
1999). Assumptions of the PNE model included marking does not affect sightability, unmarked
animals are counted as efficiently as marked animals, sampling with replacement, the number of
marked animals was known, marked individuals were identified without error, and demographic
and geographic closure during the primary interval. These recent mark-resight techniques extend
Program NOREMARK (White 1996), where sighting information from marked and unmarked
individuals is used to estimate the super population size. To estimate density of mountain lions
on our camera grids, we used the amount of time that animals with telemetry collars spent on our
grids (White and Shenk 2001). Therefore, our estimates of density are specific to the grid areas
and we did not extrapolate our results out to a larger area.
RESULTS
We obtained a photo of a mountain lion at 23 out of 40 camera sites (area 1 = 11 out of 20 sites;
area 2 = 12 out of 20 sites). Overall, we documented 80 photographs of mountain lions (area 1 =
39 photos; area 2 = 41 photos), with 50 photographs of marked individuals (area 1 = 17 marked
individuals; area 2 = 33 marked individuals).
Nine marked mountain lions were captured with our motion-activated cameras across our 40
camera sites. Four marked mountain lions used area 1 (3 GPS, 1 VHF) and 5 marked lions used
area 2 (2 GPS, 3 VHF). Another marked female mountain lion used grid 2, but her GPS collar
was not functioning during the camera survey. One male wearing a GPS used both areas 1 and
2. For the amount of time spent on grid, on average, mountain lions spent 12% of their time in
area 1 and 30% of their time in area 2. The amount of time spent on grid ranged from 8% to
64% for individual mountain lions.
Session 5: WFA – Felid Population Monitoring
136
Analyses for our pilot effort are currently ongoing and being modified; therefore, herein we
do not present estimates of the super population size or density of mountain lions in our study.
However, when finalized, this information will be presented in a future scientific publication
(Lewis et al. in prep).
DISCUSSION
Motion-activated cameras appeared to be an effective method to obtain an appropriate data set to
use with mark-resight and time spent on grid techniques to estimate population parameters of
mountain lion populations. Although we do not report specific values of our preliminary
estimates of super population size or density because our analyses are on-going, our initial
results appear reasonable and fall within estimates as reported by previous research (Lewis et al.
in prep). For example, Logan and Sweanor (2001) summarized estimates of mountain lion
density across several studies and reported that density can range from 1 – 4 individuals per 100
km^2, which is consistent with our preliminary estimates.
While our pilot effort is encouraging in that we were able to demonstrate that both mark-
resight and time spent on grid techniques could be effectively applied to our data set to obtain
reasonable population and density estimates of mountain lions, our results should only be
considered for demonstrative purposes and not used for management of mountain lions. To
obtain reliable population estimates for mountain lions we suggest several considerations for
future work. First, more cameras should be maintained over a broader spatial extent to better
sample the landscape used by mountain lions. Our sampling occurred over 1602 km and a larger
study area is necessary to better sample mountain lions due to their relatively large home range
sizes. As a result of sampling over a broader area, more photos of mountain lions would be
obtained, thus increasing the sample size for analyses. Second, a greater number of marked
Session 5: WFA – Felid Population Monitoring
137
mountain lions should be incorporated into the analyses. Nine mountain lions used portions of
our 2 sampling grids during our survey; there are between 20-30 individuals with telemetry
collars, however, that occur within the larger Uncompahgre Plateau study area throughout the
year. Thus, by expanding the grid to a broader extent more animals with telemetry collars would
be sampled, which would produce a better estimate for the amount of time that animals spend on
the sampling grids. Lastly, the cameras could be run for a longer time period. Our cameras
operated for 3.5 months; if cameras were maintained for a longer time period, population size
and density could be estimated for different times of the year.
ACKNOWLEDGEMENTS
Funding and support were provided by the Colorado Division of Wildlife, Colorado State
University, and the National Science Foundation (NSF EF-0723676).
LITERATURE CITED
Kelly, M.L., A.J. Noss, M.S. DiBitetti, L. Maffei, R.L. Arispe, A. Paviolo, C.D. De Angelo, and Y.E. Di Blanco. 2008. Estimating puma densities from camera trapping across three study sites: Bolivia, Argentina, and Belize. Journal of Mammalogy 89: 408-418.
Lewis, J.S., K.R. Crooks, L.L. Bailey, L.L. Sweanor, B. Dunne, S. VandeWoude, and K.A. Logan. In preparation. Estimating mountain lion density with motion-activated cameras using mark-resight.
Logan. K.A. and L.L. Sweanor. 2001. Desert puma: evolutionary ecology and conservation of an enduring carnivore. Island Press, Washington D.C., USA.
Negroes, N., P. Sarmento, J. Cruz, C. Eira, E. Revilla, C. Fonseca, R. Sollmann, N.M. Torres, M.M. Furtado, A.T.A. Jacomo, L. Silveira. 2010. Use of camera-trapping to estimate puma density and influencing factors in central Brazil. Journal of Wildlife Management 74: 1195-1203.
Session 5: WFA – Felid Population Monitoring
138
Smallwood, K.S. and E.L. Fitzhugh. 1995. A track count for estimating mountain lion Felis concolor californica population trent. Biological Conservation 71: 251-259.
White, G.C. 1996. NOREMARK: population estimation from mark-resighting surveys. Wildlife Society Bulletin 24: 50-52.
White, G.C. and K.P. Burnham. 1999. Program MARK: survival estimation from populations of marked animals. Bird Study 46 Supplement: 120-138.
White, G.C. and T.M. Shenk. 2001. Population estimation with radio-marked animals. Pages 329-350 in J.J. Millspaugh and J.M. Marzluff, editors. Radio tracking and animal populations. Academic Press, San Diego, CA, USA.

Session 5: WFA – Felid Population Monitoring
139
Felid Population Monitoring, Panel Q & A
Participants and Presentations:
Chris Burdett (CB) – Novel tools for the range-wide conservation and management of pumas.
Greg Davidson (GD) – Pilot study on scat detection dogs for cougar population estimation.
Jesse Lewis (JL) – Estimating mountain lion density with motion-activated cameras using mark-resight.
John Squires (JS) – Estimating detection probability for Canada lynx using snow-track surveys in the Northern Rocky Mountains.
Claudia Wultsch (CW) – Noninvasive tracking of jaguars and co-occurring feline species in Belize by genotyping feces and remote camera trapping.
Mediator: Linda Sweanor, President, Wild Felid Research and Management Association
(Recorded and transcribed by L. Sweanor)
----------------------------------------------------
1. Q: Will you compare your puma mark-resight densities using time-spent-on-grid with
other methods to define the survey area, like mean maximum distance moved
(MMDM)?
JL – We just started doing the analyses. This summer we will compare the estimates to
MMDM.
2. Q: Did you identify individuals based on just ear-tags; did you have dual camera sets?
JL – Ear-tags were put in primarily in conjunction with GPS collars. Ear-tags were put in
both ears, but sometimes males would rip out one of them. Also, we only had 1 camera.
2b. Follow-up Q: How did you consider ear-tagged cats in your data set?
We looked at different ways of formatting the input file and what we classified as a marked
individual. Marked animals either had been or were wearing a radiocollar and had ear-tags.

Session 5: WFA – Felid Population Monitoring
140
When Ken (Logan) visited nurseries and marked kittens, he would put an ear-tag in 1 ear
(and often an expandable radiocollar that fell off prior to independence). We got at least 1
photo of a subadult with an ear-tag. We classed this as an unmarked individual. An
assumption of these models is that you know the number of marked individuals on the
camera grid. There could be a number of subadults with or without ear-tags running around;
we wouldn’t know how many. We do know the number of radiocollared individuals.
3. Q: Many of these non-invasive surveys are done on a relatively small area and likely
individuals roam well beyond the area surveyed. Is this a problem?
CW – I haven’t started my analyses yet. I will be using a couple of different mark-recapture
analyses types. We have done some preliminary capture /mark analysis. Especially for scat
analysis I didn’t feel the MMDM way to estimate the study area was the best way to do it.
Plus, I believe some of the new Spatial Explicit (SE) models would account for temporal
animals coming in and out. So that’s what I’m hoping to do. With scat and cameras we’ve
seen cats come in once and we never detect them again. Many of these may be males. I hope
the SE model will account for this. Haven’t started; ask me again in a couple of months.
4. Q: (by Jim Sanderson) – [Mentions that he had a camera trap study in Surinam over a 3.5-
year period with 35 paired cameras running 365 days per year. There were 5 cat species, but
jaguars could be identified to individual. The individual jaguars we identified were in the
high 40s with over 1700 total jaguar pictures.] We observed so many because there were no
people in the area. We found a constant flow of floaters. So, over any 2-month period we had
about the same number of pictures of floaters and residents. But by running the cameras year

Session 5: WFA – Felid Population Monitoring
141
after year we could identify the residents. If you run the cameras for only a 2- to 3-month
period how do you know who is a floater and who’s a resident? And what’s the
population density? You use all the pictures in the mark-recapture program and it spits out
a number.
JL – For unmarked individuals, that’s a great question. By incorporating the information for
the amount of time spent on grid for the marked pumas, we are assuming that is a
representative sample for the population. Potentially we would group all adults (marked,
unmarked) and subadults. We didn’t include kittens. If you have an expert you can probably
identify adults versus subadults in the camera data. This is one way to have more confidence
that you are identifying residents. Subaduuts (versus adults) are most likely the ones that are
passing through.
4b. Follow up Q by JS: I noticed that residents can shift their home ranges over years.
JL - Sure. That was something we struggled with: time spent on grid. Jake Ivan, who
finished his PhD on snowshoe hares at CSU, tagged and released hares, then used telemetry
locations to determine time spent on grid. For this effort we decided to use only the 3.5-
month period that cameras were operational.
4c. Follow up Q: Did you think the spatial extent of the grid was appropriate for pumas? Also,
would it have been more appropriate to run the grid during winter when puma home range
sizes would be smaller?
JL – We were focusing on bobcat and puma. We found it appropriate for bobcats (we also
put GPS collars on the bobcats). In some cases the bobcat’s entire home range fell within the
grid. For puma – it was not appropriate; it wasn’t large enough. We’re just providing this
information for future studies. It should have a broader extent. The numbers we obtained for

Session 5: WFA – Felid Population Monitoring
142
pumas should also not be used for management purposes. We just wanted to put the
technique out there. We think there is a lot of potential for mark-resight models to be used
with puma camera data, but there’s a lot of work to be done. Definitely need a larger scale.
As to your second question about winter… I don’t have good answer. I think it would be
good for future studies to consider a more robust design where you look across seasons.
There are also constraints in winter, for example cameras operating properly and batteries
lasting in the cold.
5. Q: Have you evaluated multiple techniques for determining density?
CW – We did genetics (from scats) and the cameras, and have started some comparisons. We
want to compare density estimates. We used CAPTURE to analyze our data. So far we have
gotten slightly less cats (lower density) with genetics but it hasn’t been significantly
different. But the effective survey area was calculated using the ½ MMDM which may not
work well with the genetics (cat-dog work). Effective area is hard to calculate based on scat
work. I am hoping to do the comparison with the Spatial Explicit models. We actually should
have comparisons ready in a couple of months.
6. Q: (by Darrell Land). Can work conducted at broad regional and global scales utilize
the population estimation techniques that people are using in local-scale study areas?
CB – I think it certainly could. When you compile home range estimates you run into all the
different techniques that have been used to calculate them. This is certainly the case with
density estimates. However, on a regional scale it doesn’t really matter. It is more accepting
of error in the data. We can put it in and use that instead of presence-absence or ask how
Session 5: WFA – Felid Population Monitoring
143
density might vary relative to habitat suitability - plugging those in would be very
interesting to do. I’m not sure how much that’s been done. It’s a very simple thing to do.
Later (after the Q&A), CB stressed that a complied list of density estimates would be more
useful for model validation rather than prediction. He thought that we will likely never have
enough abundance/density estimates with which to build a broad-scale model. In hind sight,
he said a better answer might have been to turn the answer around and explain that broad-
scale models can help camera trappers find key places to conduct new studies. Specifically,
working in areas where connectivity is poor, low to medium density populations, etc.
Camera traps are almost always done in areas where populations are relatively high and
secure. While it is certainly hard to justify funding work likely to find few cats, it is
important to know more about such areas of conservation concern.
7. Q: Can you get distribution and density information from snow-tracking?
JS – I can’t give a formalized p value associated with that. I’m basing this on my experience
both in Colorado and Wyoming where we were able to detect single individuals really
effectively. In Colorado we did a real survey trying to detect the number of lynx in the Vail
Pass area; we knew what was there because of telemetry. In the Wyoming Range in
Wyoming we had a single marked individual and we think that was it. I think lynx are
extremely visible, like wolverines. They are highly mobile. And a formalized grid based
track surveys is a powerful way to delineate local distributions and densities.
7b. Follow-up Q: how useful are snow-track surveys in population estimation?
JS – They can certainly be used in a mark-recapture framework. We did this with
wolverines; we used a mark-recapture estimate in the Southern Island Ranges of Montana

Session 5: WFA – Felid Population Monitoring
144
that was a truly genetic-based snow-tracking effort where we had marked individuals for
research. Our recapture was based on snow tracks and taking DNA off of snow tracks. In that
context it was a true population estimator.
We’ve been using it mainly to delineate distributions just as a presence on-off.
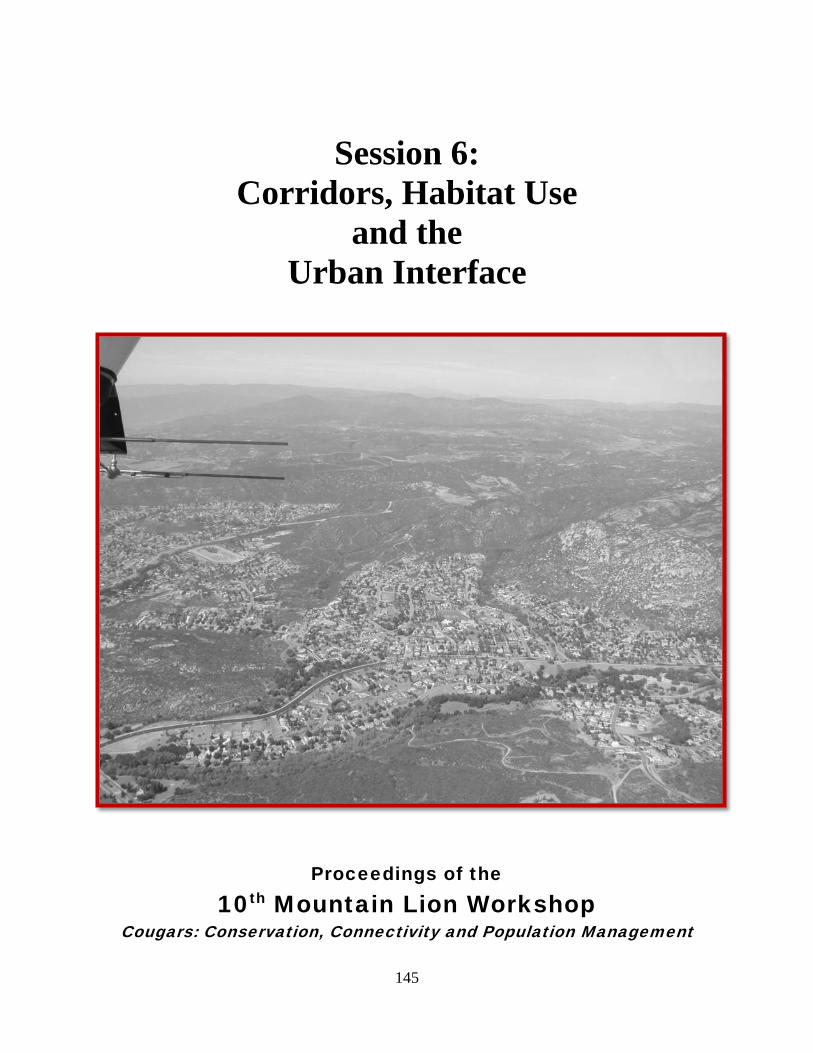
145
Session 6: Corridors, Habitat Use
and the Urban Interface
Proceedings of the
10th Mountain Lion Workshop Cougars: Conservation, Connectivity and Population Management
Session 6: Corridors, Habitat Use and the Urban Interface
146
FUNCTIONAL CONNECTIVITY FOR PUMAS IN CENTRAL MEXICO
Zaira Y. Gonzalez-Saucedo, Universidad Autónoma de Querétaro, Facultad de Ciencias Naturales, Avenida de la Ciencias S/N, Colonia Juriquilla, C.P.76230, Querétaro, México, [email protected]
Carlos A. Lopez Gonzalez, Universidad Autónoma de Querétaro, Facultad de Ciencias Naturales, Avenida de la Ciencias S/N, Colonia Juriquilla, C.P.76230, Querétaro, México, [email protected]
Abstract: The transformation of natural habitat through human pressures results in the reduction and isolation of natural areas making them not suitable for maintaining viable populations of large carnivores, such as pumas, because dispersal is affected by the loss of connectivity between habitat patches. Consequently, the identification of corridors through a least-cost path analysis (LCPA) is an important tool to understand landscape permeability and dispersal for this felid. Sierra Fria, located in the State of Aguascalientes, is a natural protected area surrounded by a highly human-impacted landscape, conditions favorable for studying the effect of isolation and test models of LCPA for puma populations in Mexico. Our objective was to identify least- cost paths between protected natural areas and verify their use by cougars. Through the creation of a Geographic Information System (ArcGIS 9.3 and Corridor Design), a model for puma habitat was created to connect Sierra Fria-Sierra de Laurel and Sierra Fria-Sierra Morones. Currently, validation in the field used semi-structured interviews with the local inhabitants within and around corridors, to identify sites where the puma has been documented. Habitat characteristics in the study area indicate 35% is suitable habitat for puma. On this basis, we identified three potential corridors for the movements of pumas in the Sierra Fría and surrounding mountains, which are not entirely protected. Corridors are located south, southwest and northwest of ANP Sierra Fría, with a length of 3.60, 35 and 44 km, respectively. Of the 86 interviews conducted, 25 verified cougar presence in the first corridor, 29 in the second, and 12 in the third, while the remaining (n=20) failed to detect it in places with high human impact. It requires the protection of natural areas with high habitat quality and connectivity to promote stability and long-term survival of populations of cougars in central Mexico and the rest of its distribution.
KEYWORDS: Puma concolor, Central México, Connectivity, Fragmented habitat
The transformation of natural habitat through human pressures results in the reduction and
isolation of natural areas, making them unsuitable for maintaining viable populations of large
carnivores with a wide distribution, such as pumas (Sepúlveda, et al. 1997; Crooks and Sanjayan,
2006). Large carnivores are directly affected because the movement of any species between
patches may restrict the access to unevenly distributed resources, consequently increasing their
Session 6: Corridors, Habitat Use and the Urban Interface
147
home range size, which can in turn increase the energy cost for individuals (Jones, 2004). As
distance between patches increases, movement between patches becomes hazardous, increasing
mortality risk or express different patterns of movement as small quality patches are hard to find
(Kindlmann and Burel, 2008). As a consequence, species such as carnivores only survive within
a network of habitat patches that remain connected and local extinctions become common (Beier
and Noss, 1998, Collinge, 2009).
The puma (Puma concolor, Linnaeus) had one of the widest distributions for any
mammal in the Americas; currently the re-colonization of former areas where it occurred has
been limited because of the loss of connectivity between patches of habitat. Connectivity is
defined as the degree to which the landscape facilitates or impedes movement of organisms
between habitat patches (Ferreras, 2001; Rothley, 2005; Kindlmann and Burel, 2008), and is not
only dependent on the characteristics of the landscape (structural connectivity), but also on the
mobility of organisms (functional connectivity) (Crooks and Sanjayan, 2006).
Habitat loss and fragmentation hinders puma dispersal. As distance between patches
increases and landscape connectivity is reduced, gene flow also decreases (Broquet, et al. 2006).
Consequently the identification of travel corridors will help us to understand the landscape
connectivity for pumas, as they facilitate long-distance movements (LaRue, 2007).
One way to determine dispersal corridors is through a least-cost path analysis. This tool
has been used to explain landscape permeability and dispersal for several species. This analysis
measures the effective distance between patches of habitat to determine the connectivity of
landscapes or reserves (Rothley, 2005). This is important because protected areas should be able
to maintain populations of species with large home ranges and allow connectivity to support
genetically viable populations (Crooks and Sanjayan, 2006; Sepulveda, et al. 1997).
Session 6: Corridors, Habitat Use and the Urban Interface
148
Least Cost Path Analysis (LCPA) models the relative cost for an animal to move between
two areas of available habitat. This technique uses landscape features (such as land use, human
population density, roads) and how those features affect the movement path of an animal (LaRue
and Nielsen, 2008). This model is developed through a Geographic Information System (GIS),
where each cell is assigned a cost value based on various environmental factors that impede or
facilitate movement (Crooks and Sanjayan, 2006). The model creates the most likely travel route
with the least resistance and shortest distance between two areas of available habitat (LaRue,
2007).
Central Mexico provides a good opportunity to develop and test such models, as the
landscape is highly fragmented with isolated populations of pumas subject to anthropological
pressure. To test the LCPA model we selected an area encompassing portions of the Mexican
States of Aguascalientes and Zacatecas. This area includes three natural protected areas with
reduced to no connectivity due to habitat loss. Our aim was to identify least-cost paths between
protected natural areas and verify their use by pumas.
STUDY AREA
This study was carried out in central Mexico, on sites adjacent to Sierra Fría and two other
protected natural areas (PNA), including portions of the states of Aguascalientes and Zacatecas.
The evaluation was carried out on intermediate sites to the northwest, between Sierra Fría and
Sierra Morones PNA, and south, between Sierra Fría and Sierra del Laurel PNA (Figure 1). The
study area has a temperate arid climate with summer rains. Precipitation ranges from 500 -800
mm with temperatures of 14-22 ° C, The site consists of a system of intermountain valleys
surrounded by mountain ranges, deep canyons and mesas (INEGI, 2005).
Session 6: Corridors, Habitat Use and the Urban Interface
149
The vegetation types include oak forest, pine-oak forest, tropical deciduous forest,
grasslands and agricultural. Oak species Quercus eduardii, Q. laeta and Q. potosina, occur with
juniper (Juniperus flaccida) or pinyon pines (Pinus cembroides). There are also tropical species
such as Ipomoea intrapilosa, I. murucoides, Bursera bipinnata, Heliocarpus terebinthinaceus,
Acacia pennatula, Acacia farnesiana, Tecoma stans, Eysenhardtia polystachya, Opuntia
fuliginosa and Mimosa monancistra. Shrubs include Arctostaphylos pungens, A. polifolia,
Arbutus glandulosa and A. arizonica). Mammalian species include white-tailed deer (Odocoileus
virginianus), bobcat (Lynx rufus), gray fox (Urocyon cinereoargenteus), coyote (Canis latrans),
white-nosed coati (Nasua narica), raccoon (Procyon lotor), ringtail (Bassariscus astutus) and
collared peccary (Tayassu tajacu) (Biodiversidad del Estado de Aguascalientes, 2008).
Human activities have changed the landscape in the study area to satisfy the demand for
food, timber, and combustibles; of added importance are rain-fed or irrigated agriculture and
livestock grazing. The tropical deciduous forest is subject to deforestation from logging and
agave plantations for tequila (Biodiversidad del Estado de Aguascalientes, 2008). Several two-
lane highways occur between mountain ranges and protected areas both in Aguascalientes and
Zacatecas (INEGI, 2005).
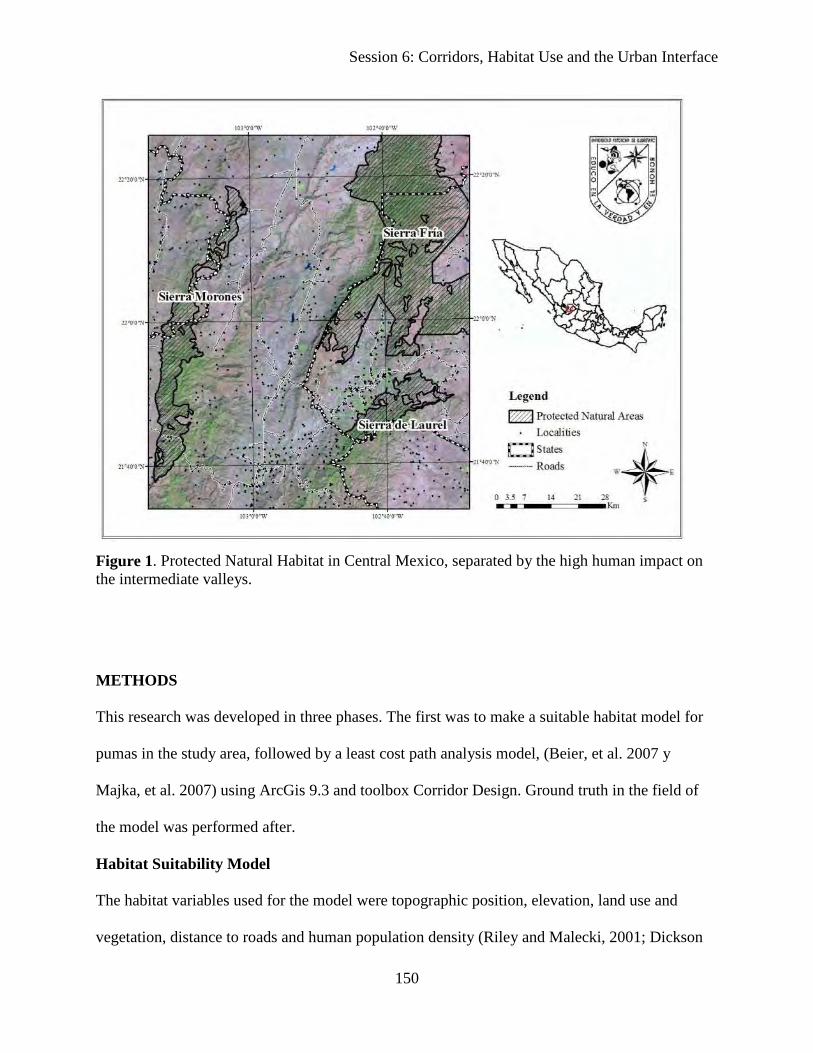
Session 6: Corridors, Habitat Use and the Urban Interface
150
Figure 1. Protected Natural Habitat in Central Mexico, separated by the high human impact on the intermediate valleys.
METHODS
This research was developed in three phases. The first was to make a suitable habitat model for
pumas in the study area, followed by a least cost path analysis model, (Beier, et al. 2007 y
Majka, et al. 2007) using ArcGis 9.3 and toolbox Corridor Design. Ground truth in the field of
the model was performed after.
Habitat Suitability Model
The habitat variables used for the model were topographic position, elevation, land use and
vegetation, distance to roads and human population density (Riley and Malecki, 2001; Dickson
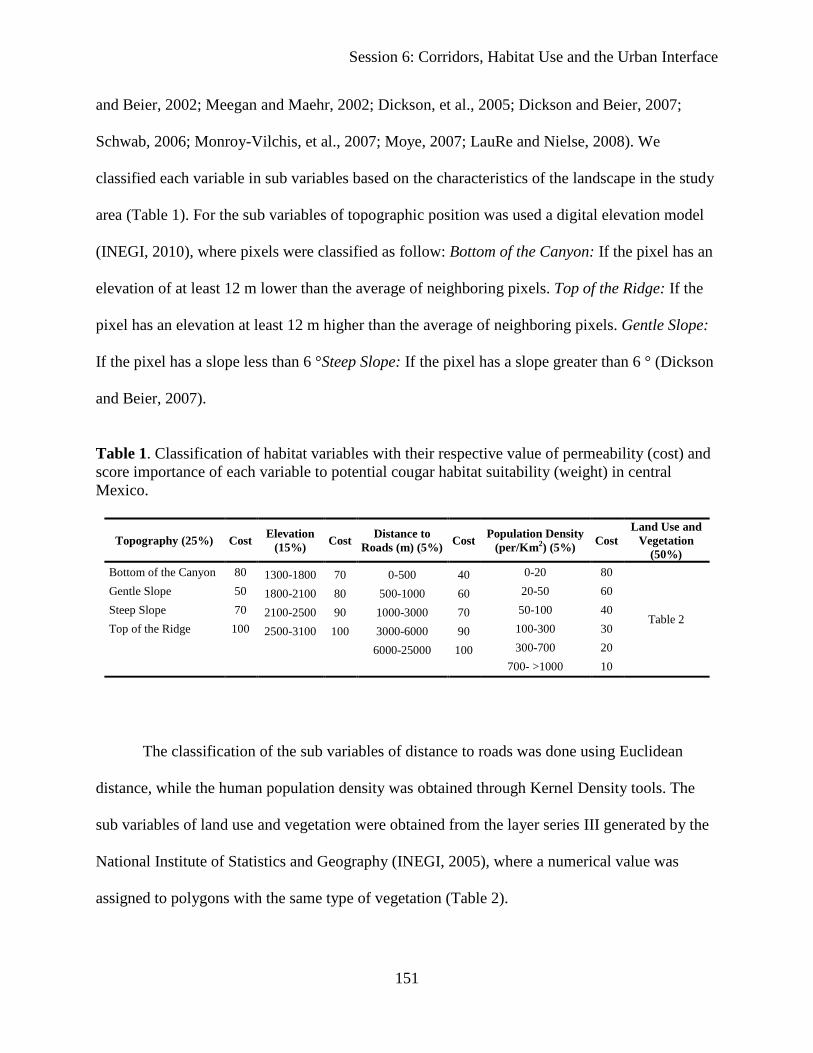
Session 6: Corridors, Habitat Use and the Urban Interface
151
and Beier, 2002; Meegan and Maehr, 2002; Dickson, et al., 2005; Dickson and Beier, 2007;
Schwab, 2006; Monroy-Vilchis, et al., 2007; Moye, 2007; LauRe and Nielse, 2008). We
classified each variable in sub variables based on the characteristics of the landscape in the study
area (Table 1). For the sub variables of topographic position was used a digital elevation model
(INEGI, 2010), where pixels were classified as follow: Bottom of the Canyon: If the pixel has an
elevation of at least 12 m lower than the average of neighboring pixels. Top of the Ridge: If the
pixel has an elevation at least 12 m higher than the average of neighboring pixels. Gentle Slope:
If the pixel has a slope less than 6 °Steep Slope: If the pixel has a slope greater than 6 ° (Dickson
and Beier, 2007).
Table 1. Classification of habitat variables with their respective value of permeability (cost) and score importance of each variable to potential cougar habitat suitability (weight) in central Mexico.
Topography (25%) Cost Elevation (15%) Cost Distance to
Roads (m) (5%) Cost Population Density (per/Km2) (5%) Cost
Land Use and Vegetation
(50%) Bottom of the Canyon 80 1300-1800 70 0-500 40 0-20 80
Table 2
Gentle Slope 50 1800-2100 80 500-1000 60 20-50 60 Steep Slope 70 2100-2500 90 1000-3000 70 50-100 40 Top of the Ridge 100 2500-3100 100 3000-6000 90 100-300 30
6000-25000 100 300-700 20
700- >1000 10
The classification of the sub variables of distance to roads was done using Euclidean
distance, while the human population density was obtained through Kernel Density tools. The
sub variables of land use and vegetation were obtained from the layer series III generated by the
National Institute of Statistics and Geography (INEGI, 2005), where a numerical value was
assigned to polygons with the same type of vegetation (Table 2).
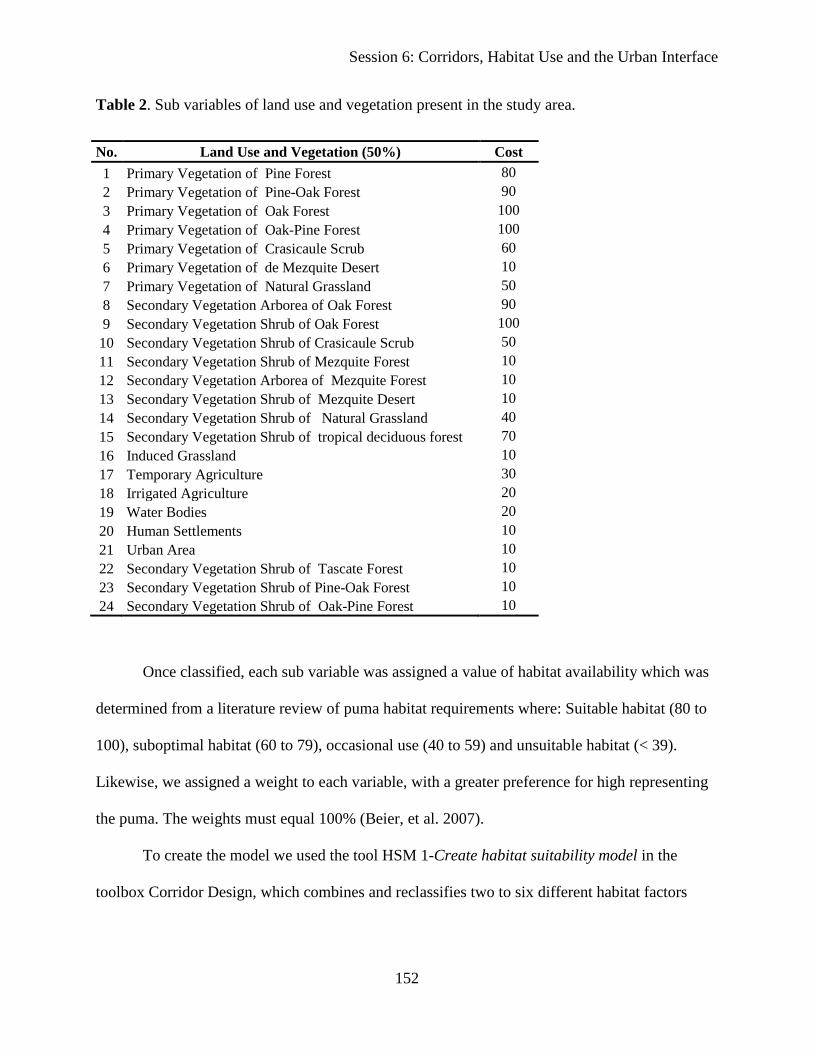
Session 6: Corridors, Habitat Use and the Urban Interface
152
Table 2. Sub variables of land use and vegetation present in the study area.
No. Land Use and Vegetation (50%) Cost 1 Primary Vegetation of Pine Forest 80 2 Primary Vegetation of Pine-Oak Forest 90 3 Primary Vegetation of Oak Forest 100 4 Primary Vegetation of Oak-Pine Forest 100 5 Primary Vegetation of Crasicaule Scrub 60 6 Primary Vegetation of de Mezquite Desert 10 7 Primary Vegetation of Natural Grassland 50 8 Secondary Vegetation Arborea of Oak Forest 90 9 Secondary Vegetation Shrub of Oak Forest 100 10 Secondary Vegetation Shrub of Crasicaule Scrub 50 11 Secondary Vegetation Shrub of Mezquite Forest 10 12 Secondary Vegetation Arborea of Mezquite Forest 10 13 Secondary Vegetation Shrub of Mezquite Desert 10 14 Secondary Vegetation Shrub of Natural Grassland 40 15 Secondary Vegetation Shrub of tropical deciduous forest 70 16 Induced Grassland 10 17 Temporary Agriculture 30 18 Irrigated Agriculture 20 19 Water Bodies 20 20 Human Settlements 10 21 Urban Area 10 22 Secondary Vegetation Shrub of Tascate Forest 10 23 Secondary Vegetation Shrub of Pine-Oak Forest 10 24 Secondary Vegetation Shrub of Oak-Pine Forest 10
Once classified, each sub variable was assigned a value of habitat availability which was
determined from a literature review of puma habitat requirements where: Suitable habitat (80 to
100), suboptimal habitat (60 to 79), occasional use (40 to 59) and unsuitable habitat (< 39).
Likewise, we assigned a weight to each variable, with a greater preference for high representing
the puma. The weights must equal 100% (Beier, et al. 2007).
To create the model we used the tool HSM 1-Create habitat suitability model in the
toolbox Corridor Design, which combines and reclassifies two to six different habitat factors
Session 6: Corridors, Habitat Use and the Urban Interface
153
based on their availability. This was done using the geometric mean algorithm, to obtain a single
availability value for each pixel.
Permeability = П (Sn Wn)
Where each Sn is the cost score for variable n, Wn is the weight for that variable and П mean
“multiply the n terms”. Once generated, the model calculates the percentage of suitable and
unsuitable habitat for the puma in the area of study.
Least – Cost Path Model
This model was generated in two phases. The first was between Sierra Fría PNA and Sierra del
Laurel PNA, while the second was to the Sierra Morones PNA. For this, we used the tool Create
corridor model of the toolbox Corridor Design. We established as the connecting habitat block
the polygons designed by the National Commission of Protected Natural Areas (CONANP).
Also for each interaction, was used as a base model suitable habitat (map of permeability), which
was created a cost raster (map of resistance), which associates the favorable habitat with lower
pixel values and thus, lower cost of movement across the landscape. The model generates a
corridor with 11 bands of different permeability percent (0.1, 10 to 100%), where permeability
ranges from high (0.1 %) to low (100 %). The bands with higher permeability were characterized
to obtain length, area, percentage of suitable and unsuitable habitat, road length and narrow
points of the corridor, taking into account a threshold of 500 meters (Beier, 1995).
Field Validation
For corroboration of the model, semi-structured interviews were conducted with the inhabitants
of towns located within and outside the corridors, considering only those with more than 50
Session 6: Corridors, Habitat Use and the Urban Interface
154
residents and people over 25 years, preferably peasants, because they are more in contact with
the environment. We were particularly interested in determining those areas involving puma
sightings, and spoor (tracks, scats and scrapes). As a test to assess the reliability of the sighting a
plate that included several species of Mexican and African felids was shown to any interviewed
person. Of the information gathered, analyzed the frequency, distance to the towns, and season
in which they have been observed. For different puma records were considered records obtained
in both interviews and collected by biologists from the University of the State of Aguascalientes.
RESULTS
Habitat Suitability Model and Least-Cost Model
The model developed included 35% of good quality habitat for the puma, concentrating mainly
on protected areas, while 65% was not adequate (Figure 2). We generated a cost raster for each
interaction (Figure 3A, 3B) and detected three least-cost paths for the puma. One was south of
the Sierra Fría NPA and two were north-west of this location. The first two corridors were
detected at the minimum permeability percent (0.1%), while the third was at 60%; this is because
it has a greater distance (Figure 4). Of the three corridors, the least distance and best quality
habitat was between Sierra Fría-Sierra de Laurel PNAs (Table 3). The second corridor, Sierra
Fría-Sierra Morones, had greater distance and reduced quality of habitat, as almost half of it was
very narrow and comprised of unsuitable habitat. Because of this, we considered an adjacent
strip of permeability (10%) as part of the corridor, resulting in a wider corridor with more area
and higher habitat quality. The third corridor was longer but had better quality of habitat. It was
also very narrow, so we again considered a second strip of permeability (70%) as part of the
corridor (Table 4). The amount of unsuitable habitat in this corridor increased and was
distributed along the corridor as small patches within a matrix of suitable habitat.
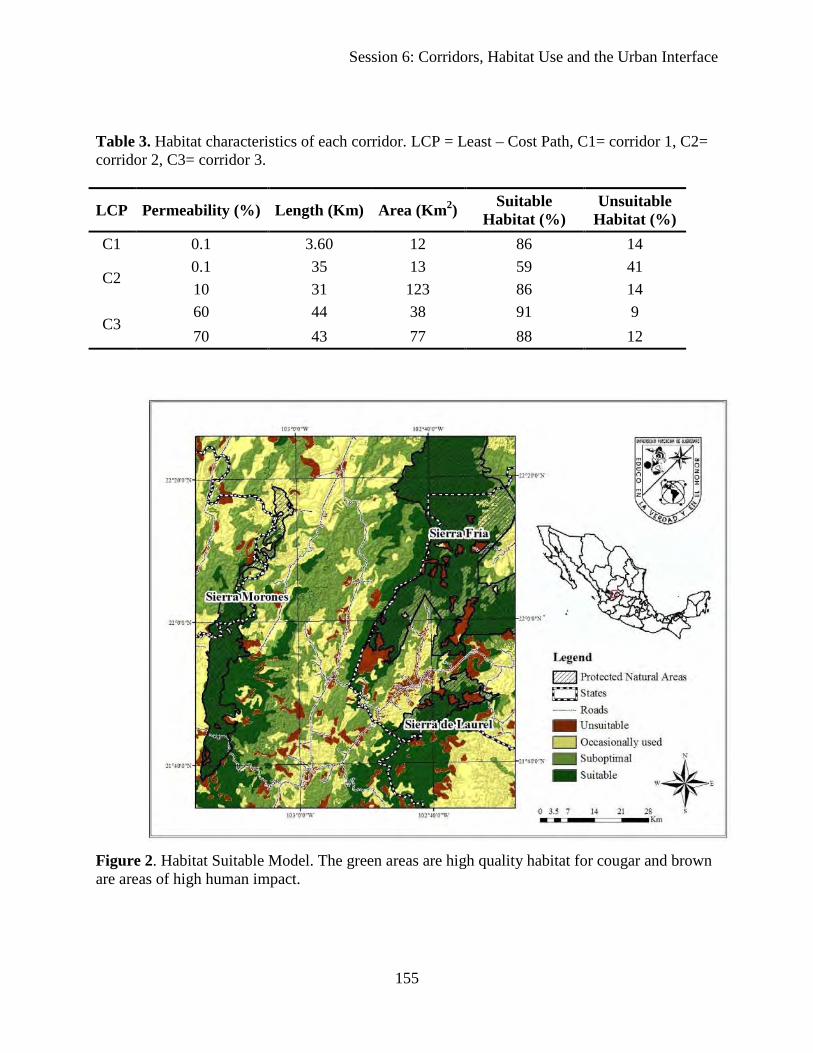
Session 6: Corridors, Habitat Use and the Urban Interface
155
Table 3. Habitat characteristics of each corridor. LCP = Least – Cost Path, C1= corridor 1, C2= corridor 2, C3= corridor 3.
LCP Permeability (%) Length (Km) Area (Km2) Suitable Habitat (%)
Unsuitable Habitat (%)
C1 0.1 3.60 12 86 14
C2 0.1 35 13 59 41 10 31 123 86 14
C3 60 44 38 91 9 70 43 77 88 12
Figure 2. Habitat Suitable Model. The green areas are high quality habitat for cougar and brown are areas of high human impact.
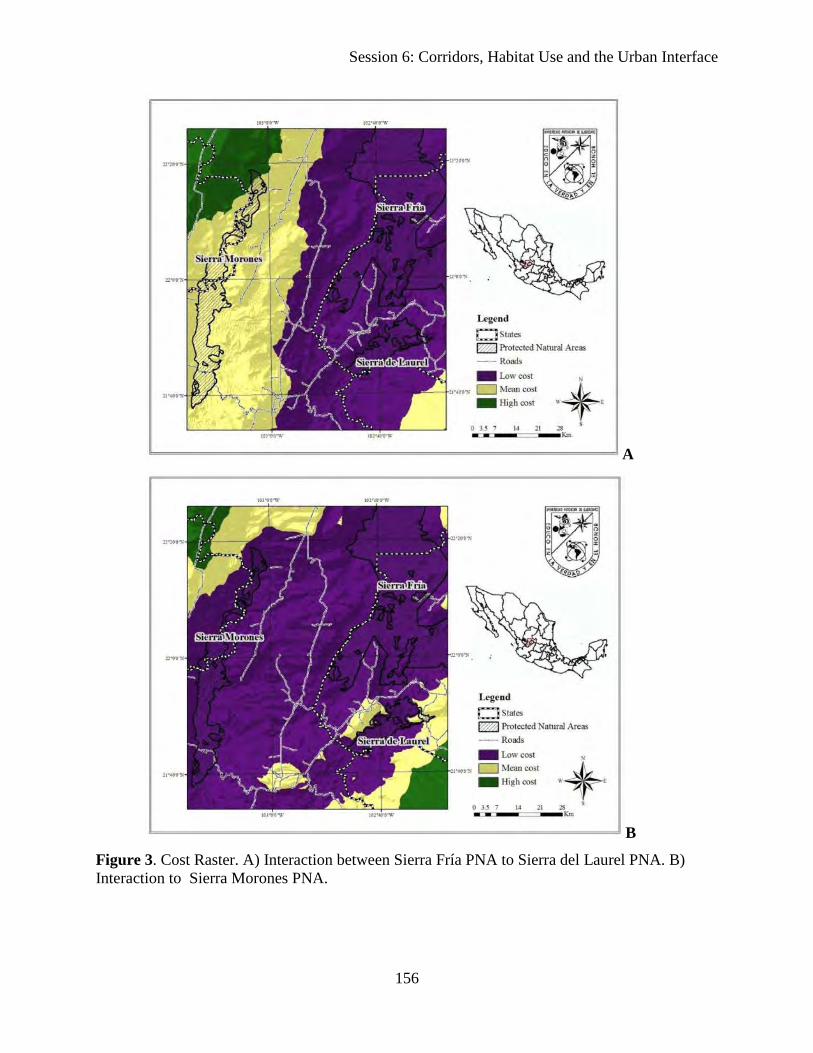
Session 6: Corridors, Habitat Use and the Urban Interface
156
A
B
Figure 3. Cost Raster. A) Interaction between Sierra Fría PNA to Sierra del Laurel PNA. B) Interaction to Sierra Morones PNA.
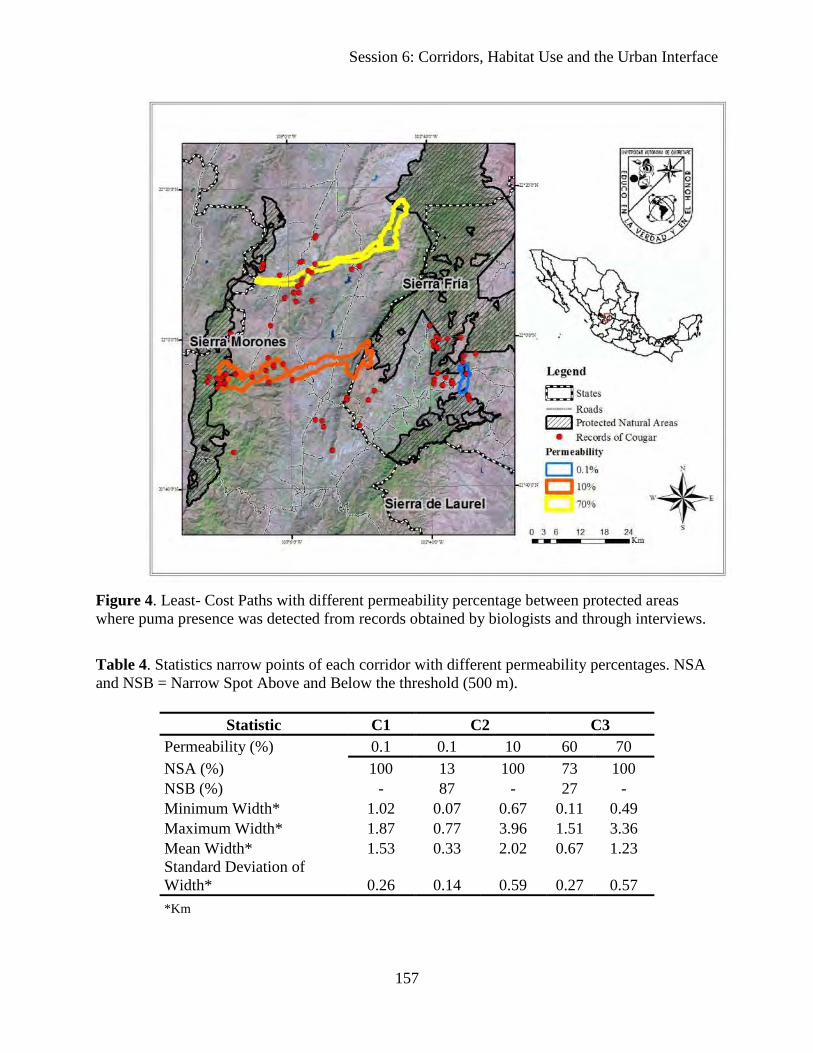
Session 6: Corridors, Habitat Use and the Urban Interface
157
Figure 4. Least- Cost Paths with different permeability percentage between protected areas where puma presence was detected from records obtained by biologists and through interviews.
Table 4. Statistics narrow points of each corridor with different permeability percentages. NSA and NSB = Narrow Spot Above and Below the threshold (500 m).
Statistic C1 C2 C3 Permeability (%) 0.1 0.1 10 60 70 NSA (%) 100 13 100 73 100 NSB (%) - 87 - 27 - Minimum Width* 1.02 0.07 0.67 0.11 0.49 Maximum Width* 1.87 0.77 3.96 1.51 3.36 Mean Width* 1.53 0.33 2.02 0.67 1.23 Standard Deviation of Width* 0.26 0.14 0.59 0.27 0.57 *Km
Session 6: Corridors, Habitat Use and the Urban Interface
158
The three corridors are traversed by a two-lane federal highway, where the highest traffic
flow occurs during the day. However, the corridors linking the Sierra Fría PNA with Sierra
Morones PNA are also crossed by a municipal road (second corridor) and two state roads (third
corridor), which have low traffic flows (Table 5).
Table 5. Length of roads crossing least-cost paths for pumas between natural protected areas.
LCP Permeability (%) Roads Length
(Km) C1 0.1 Libre Federal Ags. - Jalpa 1.89
C2 0.1 Libre Federal Gdl. – Zac. 0.39
Libre Municipal Ramal-Cosalima 0.32
10 Libre Federal Gdl. – Zac. 1.95 Libre Municipal Ramal-Cosalima 2.77
C3
60 Libre Federal Gdl. – Zac. 0.84 Estatal Ramal-Joaquín Amaro 0.69
70 Libre Federal Gdl. – Zac. 1.72 Estatal Ramal-Joaquín Amaro 1.48 Estatal Libre Ramal-Col A. López Mateos 0.40
Field Validation
We surveyed a total of 50 localities and obtained a total of 86 interviews, where 76.9% verified
puma presence. Of the total interviewed, 25 verified puma presence in the first corridor, 29 in the
second, and 12 in the third, while the remaining (n=20) failed to detect it (Figure 4). We were
unable to carry out any interviews in the state of Zacatecas due to drug cartel activity. Puma
records included sightings, claws, scats, and meat from a cougar, deer caches and puma carcass.
The data obtained in the interviews documented the presence of pumas in the area between one
to three years ago or older than three years. Pumas were mostly observed less than one kilometer
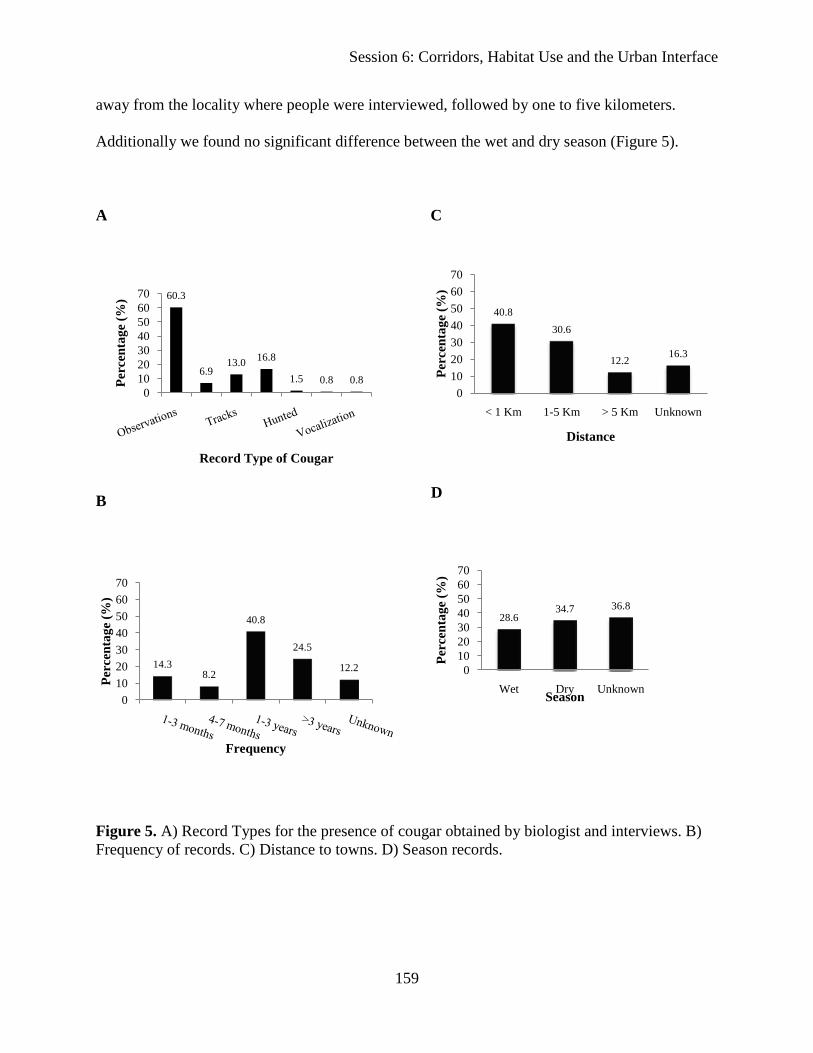
Session 6: Corridors, Habitat Use and the Urban Interface
159
away from the locality where people were interviewed, followed by one to five kilometers.
Additionally we found no significant difference between the wet and dry season (Figure 5).
A C
B
D
Figure 5. A) Record Types for the presence of cougar obtained by biologist and interviews. B) Frequency of records. C) Distance to towns. D) Season records.
60.3
6.913.0 16.8
1.5 0.8 0.80
10203040506070
Perc
enta
ge (%
)
Record Type of Cougar
14.38.2
40.8
24.5
12.2
010203040506070
Perc
enta
ge (%
)
Frequency
40.830.6
12.2 16.3
010203040506070
< 1 Km 1-5 Km > 5 Km Unknown
Perc
enta
ge (%
)Distance
28.634.7 36.8
010203040506070
Wet Dry Unknown
Perc
enta
ge (%
)
Season
Session 6: Corridors, Habitat Use and the Urban Interface
160
DISCUSSION
The puma has a broad geographical distribution throughout most of the Americas, from central
Canada to southern Chile and Argentina (López-González & González-Romero, 1998; Hemes
2004; Caso, et al., 2008), where most of the information on their ecology, behavior, and habitat
use is concentrated in the United States and Canada (Hornocker and Negri, 2010). In Mexico
there are very few studies that consider puma habitat use (Monroy-Vilchis, et al. 2007;
Rodriguez-Soto, 2007) but little is known about the interaction between the landscape structure
and movements of pumas, so this work is the first in Mexico to determine the functional
connectivity of the landscape through the identification and description of dispersal corridors for
pumas.
Understanding in detail the habitat of the puma is necessary to predict patterns of
dispersal across the landscape (Shrader-Frechette, 2004). It also is an indirect way of conserving
this species, by identifying the habitat characteristics required (Cougar Management Guidelines
Working Group, 2005) in order to generate information on the areas and resources that influence
physical activity (fitness) of individuals and population viability (Land, et al. 2007). This is
reflected in the results of the habitat model showing that the study area still has good habitat
(35%) that is able to support viable populations of pumas, focusing on protected areas, which,
over time are more separated, due to loss of habitat to its surroundings.
More than half of the study area (65%) is highly impacted by human activities such as
agriculture or urbanization. These activities are deteriorating and fragmenting large areas of
habitat in the intermountain valleys and and gentle hills found between PNAs, creating a mosaic
of patches of different sizes (Chapa- Bezanilla, et al. 2008). The identification of small patches
of habitat between habitat block is of utmost important as these may serve as sinks (Sweanor et
Session 6: Corridors, Habitat Use and the Urban Interface
161
al., 2000; Laundré and Clark, 2003; Hornocker and Negri, 2010). Such is the case for the only
potential breeding patch identified in this study, because areas <100 km2 are too small to be
biologically self-sufficient and are considered sinks because of the small number of residents
(Laundré and Clark, 2003) as a breeding pair in courtship or to pumas young age of dispersal
(Majka, et al. 2007; Beier, et al. 2010).
Dispersal movements are usually made through suitable habitat (Hornocker and Negri,
2010), that is not always continuous, so pumas are forced to cross unsuitable areas quickly, using
very small patches as stepping stones (Beier et al. 2007; Hornocker and Negri, 2010). This may
facilitate the movement of pumas through a fragmented landscape, as identified in the model.
Such patches were not identified within the corridors, However, small patches of unsuitable
habitat were detected within a matrix of suitable habitat. This is no great problem for the puma,
as they have been found using corridors located in areas with high human impact (Beier, 1993).
Landscape connectivity and robustness of a source population are essential for
maintaining population stability and a metapopulation structure in the puma (Cougar
Management Guidelines Working Group, 2005; Hornocker and Negri, 2010). Consequently, the
identification and protection of natural areas with high quality habitat where land use is regulated
and safe for a source population of cougars is necessary to ensure the persistence of puma
populations. There are protected areas as Sierra Fria where both natural and anthropogenic
disturbance has led to fragmentation of forest in areas with gentle slopes and surrounding areas
(Chapa-Bezanilla, et al. 2008). These regions are apparently becoming isolated, threatening the
stability of puma populations, that by occupying small areas or large isolated regions, have a
high risk of being removed. As a result, both pumas and their prey require corridors to allow
dispersal among areas (Cougar Management Guidelines Working Group, 2005)
Session 6: Corridors, Habitat Use and the Urban Interface
162
The results of the LCP show that functional connectivity exists between the Sierra Fría
PNA to adjacent protected areas (Sierra de Laurel and Sierra Morones). We identified three
dispersal corridors that are used by pumas to move between patches of habitat. This agrees with
Crooks and Sanjayan (2006) and Sepulveda, et al. (1997), who mentioned that protected areas
should have high connectivity to maintain genetically viable populations of animals with a wide
distribution as the puma. For a network of patches, can combine landscape patterns with species
metapopulation dynamics to better understand the influence of fragmentation on the persistence
of populations such as the puma (Baggion et al., 2011)
To understand the movement in networks of patches, it is necessary to identify potential
dispersal corridors, which connect to two or more blocks of habitat, facilitating the movement of
species across the landscape (Beier and Noss, 1998; Collinge, 2009). However, due to
increasingly greater distances between patches because of habitat loss, as among the protected
areas of central Mexico, the puma will find it more difficult to cross from one patch to another,
and face a high risk death of being caught or hit by a vehicle. The identification of least cost
paths will help us understand landscape permeability for large carnivores such as pumas and
acknowledge the effort that an individual has to exert to move between patches of habitat
(Adriaensen, et al. 2003, LaRue and Nielsen, 2008).
These movements are usually performed by young pumas from their natal areas in order
to establish territories or by adults to reproduce or go in search of food (Logan and Sweanor,
2001; Hornocker and Negri, 2010).The mean dispersal distance for males estimated by Beier
(1995) is 63 km, while the rank of the analysis of eight studies in the western United States and
Canada is 49 to 483 km (Hornocker and Negri, 2010). As the length of the three corridors (3.60,
31 and 43 km) designed among protected areas of central Mexico is short in relation to dispersal

Session 6: Corridors, Habitat Use and the Urban Interface
163
distances of male pumas, which typically disperse greater distances than females, we can infer
that they do not represent large energy costs for mobility, provided the profile to be the least cost
paths.
Of the three corridors, the smallest connects Sierra Fría with Sierra de Laurel (12 Km2).
This represents a good corridor because it has high quality habitat (86%) and its narrowest point
is 1.02 km, conditions favoring the movement of pumas between sierras. Beier (1995) suggests
that the corridors used by pumas with distances from 1 to 7 km must be over 400 m wide. In
contrast to this corridor, the first strip of the second and third corridor (southeast and northeast of
Sierra Fria) have more than half of the habitat in good condition (59 and 91%) but are not very
favorable for puma movement because 87% and 73%, respectively, of these are very narrow
(<500 m). This agrees with Collinge (2009), who mentions that some animal species like the
puma actively avoid corridors that are not wide enough. So it was necessary to consider as part
of the corridors, a second strip of permeability (10 and 70%) by increasing its width to exceed
the threshold, making them suitable corridors for puma movement. It can be inferred that
corridors 31-44 km in length must be more than one kilometer wide.
An additional impact on the landscape is the presence of roads between patches of
habitat, which directly increases the mortality of animals that move from one patch to another
due to their large spatial requirements for survival (Gloyne & Clevenger, 2001; Hornocker and
Negri, 2010). Which, was not reflected in this work, for any two-lane roads that cross through
the corridors, it is highly transited by night, so it can be said to pose no threat to pumas, because
to date there has been no incidents collisions with vehicles..
The design of corridors through geographic information systems is a way to infer puma
movements across the landscape (Rabinowitz and Zeller, 2010; Cougar Management Guidelines
Session 6: Corridors, Habitat Use and the Urban Interface
164
Working Group, 2005) so its validation in the field helps us better understand the importance of
these corridors. There are different ways to validate a model, from the most effective but more
expensive methods of using GPS collars or camera traps to the most economical as searching for
sign or conducting interviews with local residents about the presence of puma (Land et al. 2007;
Collinge, 2009). Validation of corridors is not only recommended within the corridors, but also
in disturbed areas, in order to ensure that the puma is not displaced by these sites (Naranjo -
Piñera, Pers. Com.). Based on this, our findings through interviews we conducted within the
corridors confirm that pumas use the least cost paths to move between protected areas and
indicates pumas are not using areas highly impacted by humans, at least in the state of
Aguascalientes. This could not be verified for the state of Zacatecas because of the current
threats from drug trafficking.
The application of interviews reflected not only puma presence (Rabinowitz and Zeller,
2010), but also provided information on puma biology and behavior around anthropological
activities. This was demonstrated in scores of interviews, where pumas are seen or detected one
to three or more years in the corridors, possibly due to young pumas leaving their natal areas to
disperse to other areas (Logan and Sweanor, 2001).During dispersal moves, is likely that pumas
face barriers such as roads or urban areas, with the risk of being killed (Logan and Sweanor,
2001; Hornocker and Negri, 2010). However, the interview data show that the pumas did not
avoid areas where the total population was > 50 inhabitants. This does not mean they are not at
risk, as there are people who, due to lack of economic resources, hunt pumas for fat, meat, or
skins to survive (Don Santos, Pers. Com. ).
Protected areas are considered source populations if they are large enough and experience
low human pressure (Laundré and Clark, 2003). As this work is an initiative to begin to assess
Session 6: Corridors, Habitat Use and the Urban Interface
165
puma metapopulation dynamics by identifying dispersal corridors between protected natural
areas because they are less likely to be altered and are able to provide dispersal links to sink
areas (Laundré and Clark, 2003). Also, this work contributes to and complements the scarce
information on cougar populations in Latin America (Hornocker and Negri, 2010).
On the other hand, this work shows a way to identify areas with high habitat quality that
are not under any protected status and used by umbrella species like the puma. Such was the
case, to identify records in a small mountainous region located between protected areas Sierra
Fría and Sierra Morones, which may disappear if you do not have a control over human activities
in the area. As the study of cougars may generate information for conservation strategies that
benefit the most species, they help to establish limits on human activities that degrade key areas
as corridors (Hornocker and Negri, 2010). In addition, it can be an important tool to make
proposals to extend protected areas, not only ensuring the conservation of cougar populations but
from many species and the same landscape.
ACKNOWLEDGMENTS
I want to thank Dr. Eduardo Naranjo Piñera and Dr. Robert W. Jones that enriched with their
knowledge this work. To Universidad Autónoma de Querétaro and Universidad Autónoma de
Aguascalientes. To Instituto Nacional de Estadística y Geografía (INEGI) and Instituto
Mexicano del Transporte (IMT) by facilitation of geographic information. Likewise, to
Biodiversity Conservation for Central Mexico, A.C. and Comisión Nacional de Areas Naturales
Protegidas (CONANP), for their support during field trips and Environmental Management Unit
“Sierra Morones” for providing information and hospitality.
Session 6: Corridors, Habitat Use and the Urban Interface
166
LITERATURE CITED
Adriaensen, F., J. P. Chardon, G. De Blust, E. Swinner, S. Villalba, H. Gulinck and E. Matthysen. 2003. The Application of Least-Cost Modelling as a Functional Landscape Model. 64:233-247
Baggio, J. A., K. Salau, M. A. Janssen, M. L. Schoon and O. Bodin. 2011. Landscape Connectivity and Predator-Prey Population Dynamics. Landscape Ecology 26:33-45
Beier, P. 1993. Determining Minimum Habitat Areas and Habitat Corridors for Cougars. Conservation Biology. 7 (1): 94-108
Beier, P. 1995. Dispersal of Juvenile Cougars in Fragmented Habitat. Journal of Wildlife Management. 59(2):228-237.
Beier, P. and F. Noss. 1998. Do Habitat Corridors Provide Connectivity?. Conservation Biology, 12 (6): 1241-1252
Beier, P., D. Majka and J. Jenness. 2007.Conceptual Steps for Designing Wildlife Corridors. Corridordesign.org
Broquet, T., N. Ray, E. Petit, J. M. Fryxell and F. Burel. 2006. Genetic isolation by distance and landscape connectivity in the American marten (Martes americana). Landscape Ecology 21:877–889
Caso, A., Lopez-Gonzalez, C., Payan, E., Eizirik, E., de Oliveira, T., Leite-Pitman, R., Kelly, M., Valderrama, C. & Lucherini, M. 2008. Puma concolor. In: IUCN 2010. IUCN Red List of Threatened Species. Version 2010.4. <www.iucnredlist.org>. Downloaded on 30 May 2011.
Chapa-Bezanilla, D., J. S. Ramírez y A. A. Ávila. 2008. Estudio Multitemporal de Fragmentación de los Bosques en la Sierra Fría, Aguascalientes, México. Madera y Bosques. 14(1): 37-51
Cougar Management Guidelines Working Group. 2005. Cougar management guidelines. WildFutures, Bainbridge Island, WA.
Crooks, K. R. and M. Sanjayan. 2006. Connectivity Conservation. Conservation Biology Book Series, Cambridge University Press. US. 712 Pag.
Dickson, B.G. and P. Beier. 2002. Home-Range and Habitat Selection by Adult Cougars in Southern California. Journal of Wildlife Management. 66(40):1235-1245
Dickson, B.G., J.S. Jenness and P. Beier. 2005. Influence of Vegetation, Topography, and Roads on Cougar Movement in Southern California. Journal of Wildlife Management. 69(1):264-276
Dickson, B.G. and P. Beier. 2007. Quantifying the Influence of Topographic Position on Cougar (Puma concolor) Movement in Southern California, USA. Journal of Zoology. 271:270-277
Session 6: Corridors, Habitat Use and the Urban Interface
167
Ferreras, P. 2001. Landscape Structure and Asymmetrical Inter-patch Connectivity in a Metapopulation of the endangered Iberian lynx. Biological Conservation 100: 125-136
Gloyne, C.C. & Clevenger, A.P. 2001: Cougar Puma concolor use of wildlife crossing structures on the Trans-Canada highway in Banff National Park, Alberta. - Wildl. Biol. 7: 117-124.
Hermes, C. M. S. 2004. Abundancia Relativa del Jaguar (Panthera onca), Puma (Puma concolor) y Ocelote (Leopardus pardalis) en el Parque Nacional de Laguna Lachuá, Coban, Alta Verapaz. Tesis. Facultad de Ciencias Químicas y Farmacia. Universidad de San Carlos de Guatemala.
Hornocker, M. and S. Negri. 2010. Cougar Ecology & Conservation. The University of Chicago Press, Chicago, Ilinois, USA. 306 pp.
INEGI. 2005. Prontuario de información geográfica municipal de los Estados Unidos Mexicanos. Calvillo, Aguascalientes, Clave geoestadística 01003. 6 p.
INEGI. 2005. Prontuario de información geográfica municipal de los Estados Unidos Mexicanos. Huanusco, Zacatecas, Clave geoestadística 32018. 5 p.
INEGI. 2005. Prontuario de información geográfica municipal de los Estados Unidos Mexicanos. Tabasco,Zacatecas, Clave geoestadística 32044. 6 p.
INEGI. 2005. Prontuario de información geográfica municipal de los Estados Unidos Mexicanos. Villanueva, Zacatecas, Clave geoestadística 32055. 6 p.
Jones, A. P. 2004. Graph-theoretic Modeling of Functional Habitat Connectivity for Lynx on the Okanogan Highlands, Northern Washington. Thesis. Montana State University.
Kindlmann, P. and F. Burel. 2008. Connectivity Measures: a Review. Landscape Ecology. 23:879-890.
La Biodiversidad en Aguascalientes: Estudio de Estado. 2008. Comisión Nacional para el Conocimiento y Uso de la Biodiversidad (CONABIO), Instituto del Medio Ambiente del Estado de Aguascalientes (IMAE), Universidad Autónoma de Aguascalientes (UAA). México.
Land, E. D., D. B. Shindle, R. J. Kawula, J. F. Benson, M. A. Lotz and D. P. Onorato. 2007. Florida Panther Habitat Selection Analysis of Concurrent GPS and VHF Telemetry Data. Management and Conservation. 72 (3) 633-639
LaRue, M. A. 2007. Predicting Potential Habitat and Dispersal Corridors for Cougars in Midwestern North America. Thesis. Southern Illinois University Carbondale
Laundré, J. W., and T. W. Clark. 2003. Managing puma hunting in the western United States: Through a metapopulation approach. Animal Conservation. 6:159–70.
LauRe, M.A. and C.K. Nielsen. 2008. Modelling Potential Dispersal Corridors for Cougars in Minwestern North America Using Least-Cost Path Methods. Ecological modelling 2 1 2: 372–381.
López–González, C. A. & A. González–Romero. 1998. A Synthesis of Current Literature and Knowledge about the Ecology of the Puma (Puma concolor Linnaeus). Acta Zoologíca Mexicana (Nueva serie) 75:171 – 190 pp.
Session 6: Corridors, Habitat Use and the Urban Interface
168
Majka, D., P. Beier and J. Jenness. 2007. Corridor Designer ArcGIS Toolbox Tutorial. Corridordesign.org
Meegan, R.P. and D.S. Maehr. 2002. Landscape Conservation and Regional Planning for the Florida Panther. Southeastern Naturalist. 1(3): 217-232
Monroy–Vilchis, O., C. Rodríguez–Soto, M. Zarco–González y V. Urios. 2007. Distribución, Uso de Hábitat y Patrones de Actividad de Puma y Jaguares en el Estado de México. AMMAC. 9° Congreso de Mastozoología: Mamíferos de México un Reto de Conservación Presente y Futuro. Autlan de la Grana, Jalisco. 51 Pág.
Moye, V. P. 2007. Habitat Suitability Analysis for Mountain Lion (Puma concolor) on the Southern Cumberland Plateau.Thesis. University of the South
Rabinowitz, A. and K. A. Zeller. 2010. A range-wide model of landscape connectivity and conservation for the jaguar, Panthera onca. Biological Conservation 143, 949-945
Riley, S.J. and R. A. Malecki. 2001. A landscape analysis of cougar distribution and abundance in Montana, USA. Environmental Management 28(3) 317-323
Rodriguez–Soto, C. 2007. Distribución y Uso de Hábitat de Felinos en la Sierra Nanchititla, Estado de México. Tesis. Facultad de Ciencias. Universidad Autónoma del Estado de México.
Rothley, K. 2005. Finding and Filling the “Cracks” in Resistance Surfaces for Least-cost Modeling. Ecology and Society 10(1): 4.
Schwab, A. C. 2006. The Influence of Roads on the Florida Panther. Thesis. University of South Florida.
Sepulveda, C., A. Moreira y P. Villarroel. 1997. Conservación Biológica Fuera de las Áreas Silvestres Protegidas. Ambiente y Desarrollo. 8 (2): 48 - 58.
Shrader-Frechette, K. 2004. Measurement Problems and Florida Panther Models. Southeastern Naturalist. 3(1):37-50
Sweanor, L. L., K. A. Logan, M. G. Hornocker. 2000. Cougar Dispersal Patterns, Metapopulation Dynamics, and Conservation. Society for Conservation Biology. 14 (3) 798-808
Sweanor, L. L., K. A. Logan. 2001. Desert Puma, Evolutionary Ecology and Conservation of and Enduring Carnivore. Hornocker Wildlife Institute. Island Press. 464 p.
Session 6: Corridors, Habitat Use and the Urban Interface
169
Mountain Lion (Puma Concolor) Population Status, and Biological Corridors in Sierra San Luis, Sonora México. Alejandro González-Bernal, Naturalia A.C. Av. 32 entre calle 3 y 4 Agua Prieta, Sonora,
México, (+52) 633 338 6380, (+52) 633 337 6057, [email protected] (presenter) Nalleli E. Lara-Díaz, Universidad Autónoma de Querétaro Campus Juriquilla, UAQ., Av. de las
Ciencias s/n Querétaro, Querétaro 76010 [email protected] Heli Coronel-Arellano, Naturalia A.C. Av. 32 entre calle 3 y 4 Agua Prieta, Sonora, México,
[email protected] Carlos A. López-González, Universidad Autónoma de Querétaro Campus Juriquilla, UAQ., Av.
de las Ciencias s/n Querétaro, Querétaro 76010, [email protected] Abstract: The sky islands are mountainous complex surrounded by grasslands, deserts and valleys between the United States and Mexico, characterized by a high biodiversity. However, in this region the main economic activity is livestock, where carnivores represent a problem due to predation, which result in predator control measures. This, coupled with the construction of the border fence between the two countries and the increment in traffic due to mining reactivation in the region make a necessity to evaluate the current status and conservation of predators and population connectivity in the region. One of the carnivore that is markedly affected by predator control is the mountain lion(Puma concolor). Our objective was to determine the population status and distribution of mountain lion in the Sky Islands and to identify biological corridors in this region. We used records from camera-trap surveys to estimate the abundance and density using capture-recapture models with the program Mark. To assess the distribution and probability of occupation we use the program PRESENCE. Corridor were determined taking into account the probability distribution of this species and the type of management and land tenure. The average density obtained (2.2 individuals/100km2) indicates that mountain lions present no immediate problems in conservation, but there is a gradient of less than 1 to 4 individuals/100km2, which shows that there are significant differences in mountain lion densities depending in the type of management (conservation, livestock), which potentially can affect the population due to unregulated predator control measures. According to our results Sierra de San Luis seems to work as a source population of individuals to the rest of the Sky islands. The occupation probability model shows a major biological corridor for both Mexico and the U.S. located in Sierra San Luis, therefore, the development plans for the future should take into account the connectivity between wild areas to ensure the population viability of mountain lions and also the rest of mammal community.
INTRODUCTION
The diversity and richness of species in the Northeast region of the State of Sonora is given
according to its topographical and environmental characteristics given by its mountain ranges,
Session 6: Corridors, Habitat Use and the Urban Interface
170
which are known as Sky Island or Archipelago Madrean (Coblentz, 2005; Coblentz and Riitters,
2005). The Sky Islands are a mountainous complex composed of more than 40 mountains
located from the southwestern United States in the Colorado Plateau and the Rocky Mountains to
the north of the Sierra Madre Occidental in Mexico.
Within this region converge various different climates, which give a high ecological
importance, since different habitats provide with a high diversity of flora and fauna species
(Coblentz and Riiters, 2005). In Mexico, this richness and diversity has been affected by the type
of land management (Ceballos and Navarro, 1991), which has threatened the wildlife populations
reducing significantly their abundance, even to the point of disappearing some of them. Such is
the case of some mammals such as the grizzly bear (Ursus arctos) and the Mexican wolf (Canis
lupus baileyi, Brown, 1983). In this region, you can find different types of management such as
private conservation areas, protected natural areas and areas with economic activities. The Sierra
San Luis is located within the Sky Islands and the dominant land tenure is private ranches where
the main economic activity is extensive livestock farming. Predators are considered a serious
problem due to the alleged excessive predation on livestock, resulting in measures of control
over them.
Of the predators present in this region, the cougar or mountain lion (Puma concolor) is the
one that probably is receiving more of this predator control measures, because of its strict
carnivorism diet and its abundance and widely distribution throughout the region. Added to this,
the construction of the border wall between Mexico and the United States, the expanding of
border highway no. 2 from two to four lanes and the imminent increase in vehicular traffic due to
the re-activation of the mining area in the region, makes a necessity to evaluate the current status
of cougar populations and connectivity of their populations in this region. Therefore, the
Session 6: Corridors, Habitat Use and the Urban Interface
171
objectives were to determine the population status of cougar population in four Sky Islands and
to identify areas most likely to be occupied by the species to determine potential biological
corridors in the region.
STUDY AREA
The study was conducted in four Sky Islands located in the northeast of the state of Sonora,
Mexico. The area is under the influence of the Sierra Madre Occidental, the Rocky Mountains
and the Chihuahuan and Sonoran deserts (Coblentz and Riiters, 2005). This landscape is
characterized by mountains range surrounded by grasslands, deserts and valleys between them
(TheWildlands Project 2000). The sampling areas included the Sierra San Luis (SSL), Ajos,
Buenos Aires and El Tigre, the last three in the National Forest Reserve and Wildlife Refuge
Ajos Bavispe (RFN and RFS Ajos Bavispe).
The SSL is constituted by a mosaic of ranches with different types of management
strategies. The San Bernardino, El Pinito and Los Ojos ranches are focus, since more than 10
years on conservation of flora and fauna where the hunting and cattlement are not allowed. San
Bernardino Ranch is bordered is located in the foothills of the SSL while El Pinito and Los Ojos
ranches are set in the mountains. The properties Potrero de la Sierra, El Tápila and Oaxaca, are
dedicated to cattlement and apply regular predator control measures.
The elevation of the localities goes from 1.500 to 1.800 meters. The hydrography is
characterized by a permanent river called Cajon Bonito and several intermittent and artificial
water bodies (Rodríguez-Martínez et al. 2008). The climate is dry temperate with summer
rainfall, the average summer temperature is 18 º C , and in winter from 7 º C (INEGI, 1973).
Average annual rainfall is 450 mm (Iniguez et al. 2005). The vegetation is mainly composed of
Session 6: Corridors, Habitat Use and the Urban Interface
172
grassland and scrub. Also, there are forested areas dominated by aspen (Populus sp.) and in some
parts can be found juniper-oak and huizachal-oak associations (Rodríguez-Martínez et al. 2008).
Sierras within the RFN and RFS Ajos Bavispe have varying degrees of livestock
management. Sierras Madera and Buenos Aires are those with the highest number of cattle
ranches, followed by the Sierra del Tigre. Finally, in Sierra Ajos the cattle is rare, appearing only
in the lowlands, due to the steep topography.
Altitudinal gradient range from 1.100 to 2.646 meters (CONANP, 2003). The RFN and RFS
Ajos Bavispe covers an important area of the watersheds in the region, including the Sonora, San
Pedro, Bavispe and Yaqui rivers and the Mariano, Borregas and Mavavi streams (CONANP,
2003). Precipitation in this Sierras ranges between 500 mm to 600(CONANP, 2003).
The vegetation within the reserve are forested areas, dominated mostly by oak, juniper, pine-oak
and pine forests, grasslands, desert vegetation, mezquite areas and subtropical scrub. (CONANP,
2003).
METHODS
Trap Cameras
We place an average of 28 camera traps (WildView ®) by locality, for a total of 248 sampling
stations in nine locations. The camera traps were placed along fauna trails, during the years 2009
and 2010. The camera traps were active for an average of 28 days for each sampling point were
recorded geographic coordinates and altitude using GPS.
The cameras had a north-south orientation in order to avoid being activated by sunlight.
Were placed in trees at a height between 50 and 100 cm, depending on the topography of the
terrain and the type of vegetation. We program the cameras to record the time and date for each
Session 6: Corridors, Habitat Use and the Urban Interface
173
event photography, as well as taking three shots every time the camera was activated for
maximize the chance of getting elusive species.
Abundance and Density
To calculate the abundance and density of cougars, photographic records obtained were
classified and separated and trough a 5 researchers comparative analysis (Kelly et al, 2008) the
cougars were identified at an individual level taking on account the independent events. Each
observer determined the number of individuals who were photographed and their recapture,
based on the following characteristics: body complexion, blemishes, scars and natural markings.
To calculate the abundance, we generate a capture-recapture history of cougars in each sampling
site, which was introduced to the program MARK (using CAPTURE extension). Subsequently,
we calculated the effective sample area (ESA) for each sampling location using ArcMap 10
(ESRI, 2011), to do this, we generated a buffer around each camera trap, trying to dissolve the
overlapping areas to avoid overlap on the circles, and therefore overestimation of the ESA. This
buffer corresponded to the species home range (293 km2; Currier, 1983). Finally, the density
was calculated by dividing the abundance between the ESA, and reported as number of
individuals per 100 km2.
Occupancy models and potential wildlife linkages
To estimate the probability of occupation of the cougar and identify potential wildlife linkages,
photographic records were associated with the environmental and topographical covariables
through the program PRESENCE (Hines, 2006), under the assumptions of a single species, one
sampling season and covariates associated with each site (Donovan and Hines, 2007).
The study area was divided into sampling units of 1 km2, representing a grid of 32.761 km2.
Each obtained record of cougar was related to its corresponding sampling unit. Also, it was
Session 6: Corridors, Habitat Use and the Urban Interface
174
determined as sampling units visited (SUV) those where the cameras were placed. With the SUV
we proceeded to build a matrix of presence (1) – pseudo absences (0), sample units not visited
were cataloged with a dash (-) which the program recognizes as an unknown category (whether
the species is present or absent).
The environmental and topographical variables that were chosen for the analysis were
altitude, orientation, slope and normalized vegetation index (NDVI). Geographical layers of the
covariates were associated with the grid of sampling units, using the program ArcView 3.2
(ESRI, 1999), through the Spatial Analyst extension (version 1.1). In this way we obtained a
matrix where each sample was associated with a specific value of each of the covariates. The
obtained values of the covariates in all sampling units were normalized (Mackenzie et al., 2003).
Based on the array of records and the matrix of covariates, we proceeded to generate generalized
linear probability models within the PRESENCE program. Each model considered the
probability of occupancy and detection probability associated with one or more covariates,
considering also a constant covariate (.) and a covariate with time (t; Donovan and Hines, 2007).
Thus, given all the possible combinations of covariables, we generated a total of 1,024 models.
The best model to explain the occurrence and probability of detection was selected by the lowest
AIC (King et al., 2007).
Once we got the best model, we generate a space map, given the probabilities of occurrence per
sampling unit. This map served us to identify areas of highest probability of occurrence of the
species, and to determine potential corridors for cougar.
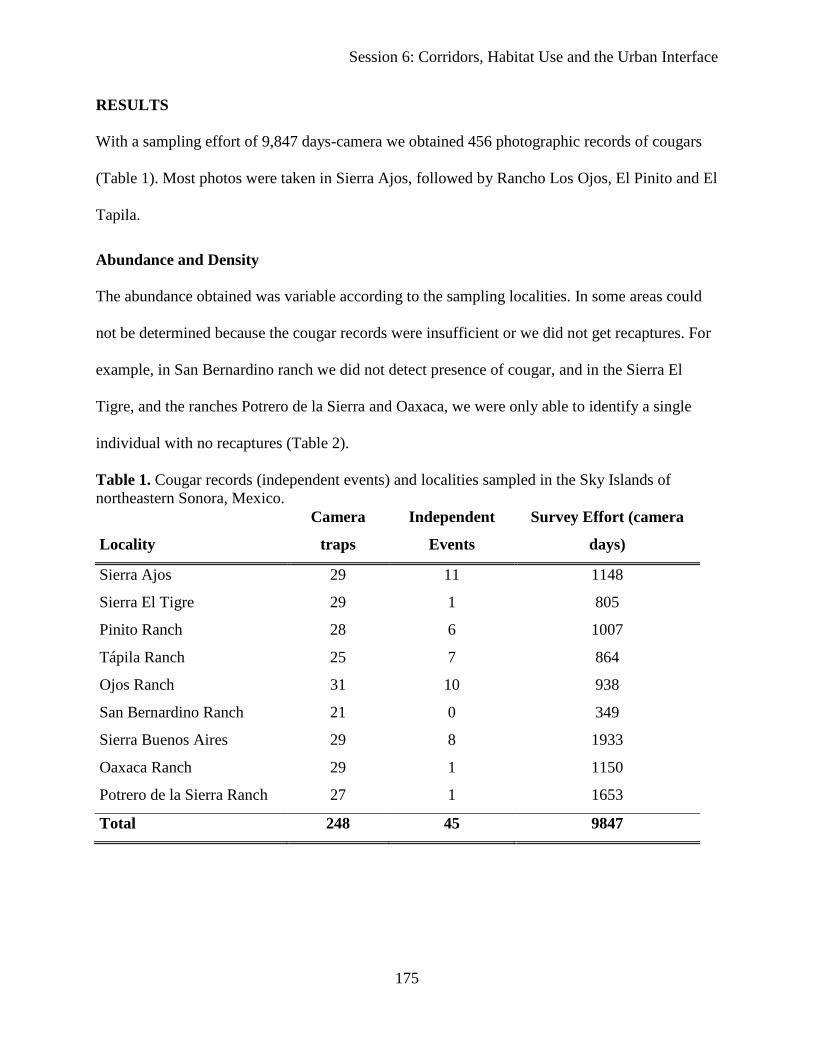
Session 6: Corridors, Habitat Use and the Urban Interface
175
RESULTS
With a sampling effort of 9,847 days-camera we obtained 456 photographic records of cougars
(Table 1). Most photos were taken in Sierra Ajos, followed by Rancho Los Ojos, El Pinito and El
Tapila.
Abundance and Density
The abundance obtained was variable according to the sampling localities. In some areas could
not be determined because the cougar records were insufficient or we did not get recaptures. For
example, in San Bernardino ranch we did not detect presence of cougar, and in the Sierra El
Tigre, and the ranches Potrero de la Sierra and Oaxaca, we were only able to identify a single
individual with no recaptures (Table 2).
Table 1. Cougar records (independent events) and localities sampled in the Sky Islands of northeastern Sonora, Mexico.
Locality
Camera
traps
Independent
Events
Survey Effort (camera
days)
Sierra Ajos 29 11 1148
Sierra El Tigre 29 1 805
Pinito Ranch 28 6 1007
Tápila Ranch 25 7 864
Ojos Ranch 31 10 938
San Bernardino Ranch 21 0 349
Sierra Buenos Aires 29 8 1933
Oaxaca Ranch 29 1 1150
Potrero de la Sierra Ranch 27 1 1653
Total 248 45 9847
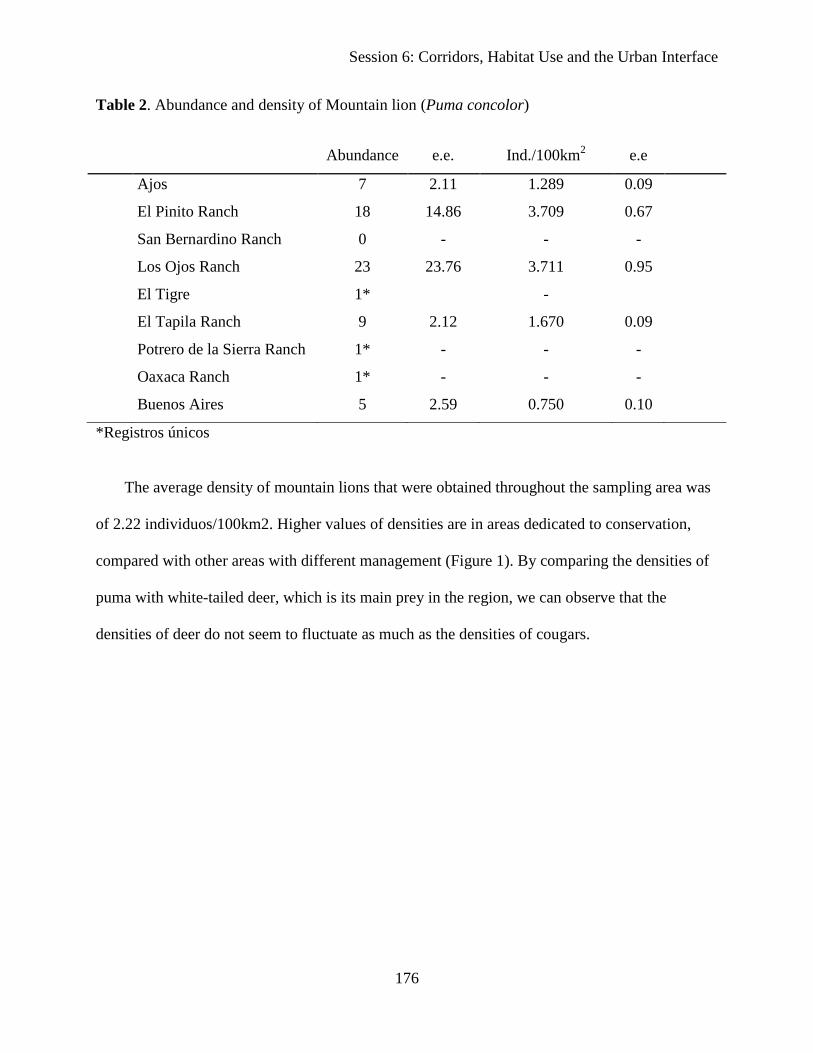
Session 6: Corridors, Habitat Use and the Urban Interface
176
Table 2. Abundance and density of Mountain lion (Puma concolor)
Abundance e.e. Ind./100km2 e.e
Ajos 7 2.11 1.289 0.09
El Pinito Ranch 18 14.86 3.709 0.67
San Bernardino Ranch 0 - - -
Los Ojos Ranch 23 23.76 3.711 0.95
El Tigre 1*
-
El Tapila Ranch 9 2.12 1.670 0.09
Potrero de la Sierra Ranch 1* - - -
Oaxaca Ranch 1* - - -
Buenos Aires 5 2.59 0.750 0.10
*Registros únicos
The average density of mountain lions that were obtained throughout the sampling area was
of 2.22 individuos/100km2. Higher values of densities are in areas dedicated to conservation,
compared with other areas with different management (Figure 1). By comparing the densities of
puma with white-tailed deer, which is its main prey in the region, we can observe that the
densities of deer do not seem to fluctuate as much as the densities of cougars.
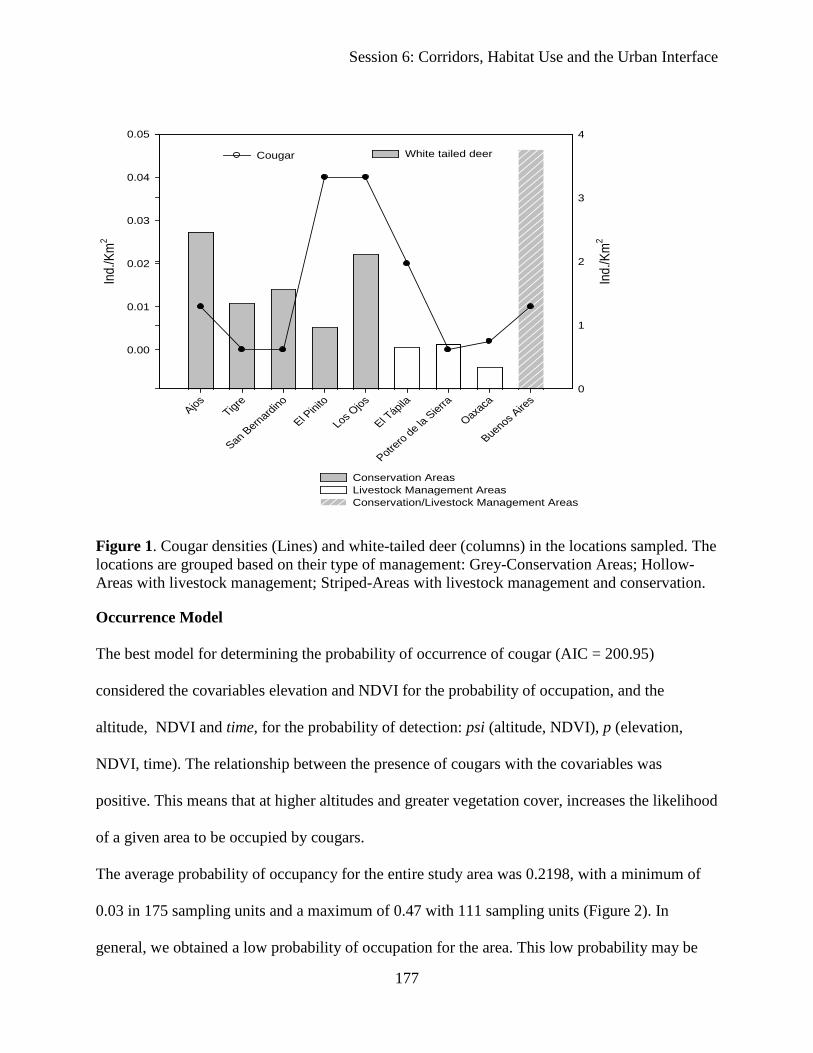
Session 6: Corridors, Habitat Use and the Urban Interface
177
White tailed deer
Ind.
/Km
2
0
1
2
3
4
Conservation AreasLivestock Management AreasConservation/Livestock Management Areas
AjosTigre
San Bernardino
El Pinito
Los Ojos
El Tápila
Potrero de la
Sierra
Oaxaca
Buenos Aire
s
Ind.
/Km
2
0.00
0.01
0.02
0.03
0.04
0.05
Cougar
Figure 1. Cougar densities (Lines) and white-tailed deer (columns) in the locations sampled. The locations are grouped based on their type of management: Grey-Conservation Areas; Hollow-Areas with livestock management; Striped-Areas with livestock management and conservation.
Occurrence Model
The best model for determining the probability of occurrence of cougar (AIC = 200.95)
considered the covariables elevation and NDVI for the probability of occupation, and the
altitude, NDVI and time, for the probability of detection: psi (altitude, NDVI), p (elevation,
NDVI, time). The relationship between the presence of cougars with the covariables was
positive. This means that at higher altitudes and greater vegetation cover, increases the likelihood
of a given area to be occupied by cougars.
The average probability of occupancy for the entire study area was 0.2198, with a minimum of
0.03 in 175 sampling units and a maximum of 0.47 with 111 sampling units (Figure 2). In
general, we obtained a low probability of occupation for the area. This low probability may be
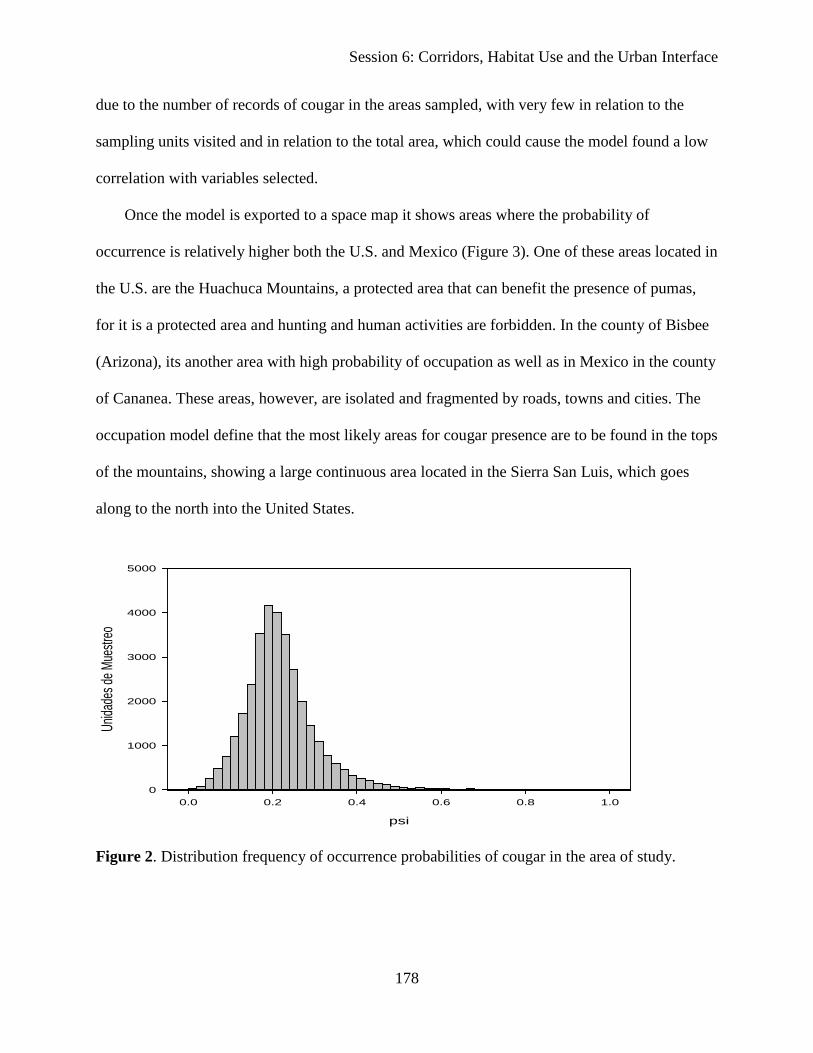
Session 6: Corridors, Habitat Use and the Urban Interface
178
due to the number of records of cougar in the areas sampled, with very few in relation to the
sampling units visited and in relation to the total area, which could cause the model found a low
correlation with variables selected.
Once the model is exported to a space map it shows areas where the probability of
occurrence is relatively higher both the U.S. and Mexico (Figure 3). One of these areas located in
the U.S. are the Huachuca Mountains, a protected area that can benefit the presence of pumas,
for it is a protected area and hunting and human activities are forbidden. In the county of Bisbee
(Arizona), its another area with high probability of occupation as well as in Mexico in the county
of Cananea. These areas, however, are isolated and fragmented by roads, towns and cities. The
occupation model define that the most likely areas for cougar presence are to be found in the tops
of the mountains, showing a large continuous area located in the Sierra San Luis, which goes
along to the north into the United States.
psi
0.0 0.2 0.4 0.6 0.8 1.0
Unida
des d
e Mue
streo
0
1000
2000
3000
4000
5000
Figure 2. Distribution frequency of occurrence probabilities of cougar in the area of study.
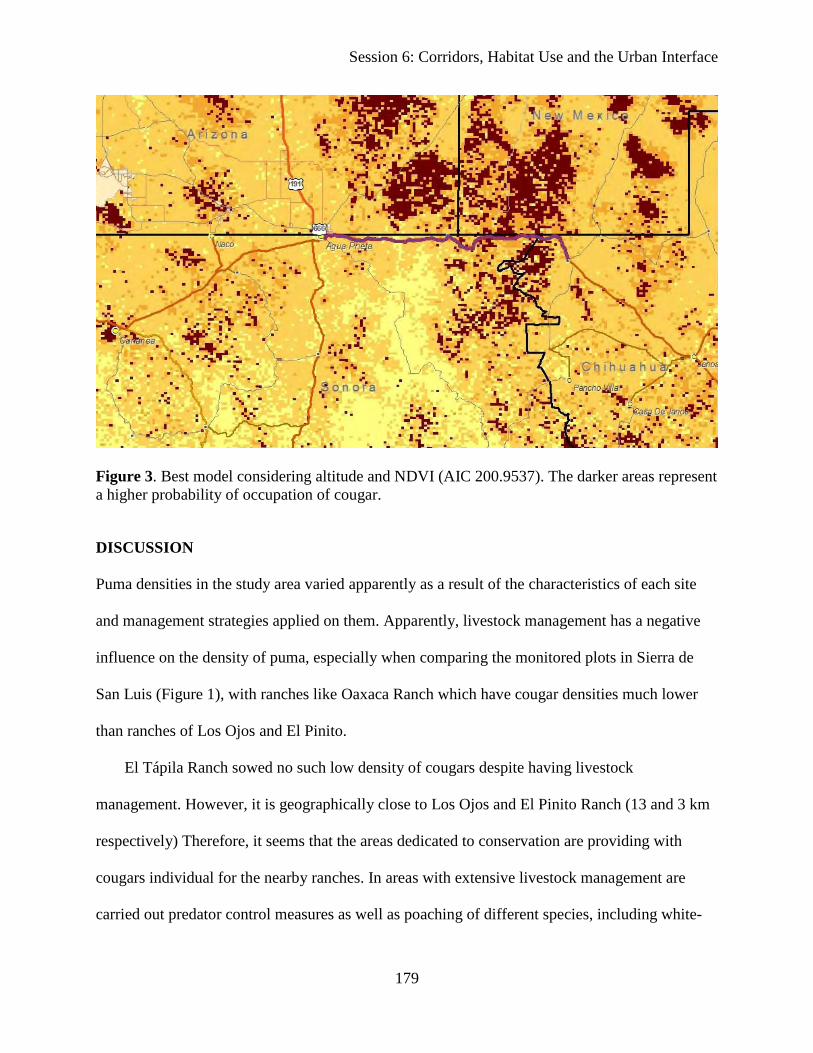
Session 6: Corridors, Habitat Use and the Urban Interface
179
Figure 3. Best model considering altitude and NDVI (AIC 200.9537). The darker areas represent a higher probability of occupation of cougar.
DISCUSSION
Puma densities in the study area varied apparently as a result of the characteristics of each site
and management strategies applied on them. Apparently, livestock management has a negative
influence on the density of puma, especially when comparing the monitored plots in Sierra de
San Luis (Figure 1), with ranches like Oaxaca Ranch which have cougar densities much lower
than ranches of Los Ojos and El Pinito.
El Tápila Ranch sowed no such low density of cougars despite having livestock
management. However, it is geographically close to Los Ojos and El Pinito Ranch (13 and 3 km
respectively) Therefore, it seems that the areas dedicated to conservation are providing with
cougars individual for the nearby ranches. In areas with extensive livestock management are
carried out predator control measures as well as poaching of different species, including white-

Session 6: Corridors, Habitat Use and the Urban Interface
180
tailed deer (pers. obs). The combination of this two things (not directed predator control using
poisons and poaching) may be contributing to the reduction of the availability of wild prey, in
turn increasing the probability of predation by cougars over livestock (Polisar et al, 2003).
Although consumption of livestock by the puma may represent less than 10% of the biomass
consumed (Rosas-Rosas et al, 2008), and that the main prey for cougars are white tailed deer
(Luna-Soria y Lopez-Gonzalez, 2005) social perception may aggravate the situation,
encouraging measures to increase in predator control techniques in those areas.
Predator control, particularly related to pumas, has shown that if done in areas less than
1,000 km2 (Robinson et al 2008), the animals removed are substituted by immigrant individuals
(typically young individuals searching for a territory) from neighboring areas, causing a change
in the population structure toward mostly younger individuals (Cooley et al 2009). This scenario
could be causing an increase in predation on livestock (calves and female) due to lack of
experience of younger immigrants in hunt techniques. Therefore predator control measures could
be feeding a vicious cycle in which it promote predation on livestock instead of preventing form
it.
The model showed a low probability of occupation of puma in the entire study area. This
may be due because we used only the photographic records obtained with the trap cameras to
build the model. The number of records obtained was low, mainly because the puma is an elusive
species and the probability of detection is low. Therefore, we recommend using the probability
of detection in the estimation procedure (MacKenzie et al, 2004) in a future analysis and to
include other records of the species presence (tracks, scats, sightings) to increase the number of
SUV, especially when working on such a large area.

Session 6: Corridors, Habitat Use and the Urban Interface
181
The model showed that the zones to the west of the study area are isolated from each other
by large non-cougar habitat areas. To the east (Figure 3), there is one large and continuous patch,
indicating that this area should be treated as one. Because in this area we obtained the highest
cougar densities reported in this study, we consider that this area might be functioning as source
populations for the Mexican Sky Islands, and possibly as a biological corridor for the U.S.
These wildlife corridors and linkages should be considered in management and conservation
plans for the cougar, especially in the presence of natural and anthropogenic barriers that may
hinder the dispersion of cougar populations. In this sense, the two immediate threats to these
predator populations are the border wall and the expansion of a federal highway in Mexico.
Although, in the area of highest probability of occupancy and potential biological corridor for the
puma, the border wall has mostly Normandy type barriers, which can be permeable for this
species, it can potentially affect the dispersion of its prey. Likewise, the expansion of Highway #
2, from 2 to 4 lanes, will bring an increase in vehicular traffic and people, which could affect the
distribution and dispersal of individuals, not only of pumas, but also for black bears, deer and
jaguars among other species. Therefore it is necessary to identify biological corridors at a fine
scale for species through tools like the one posed in this study, to establish measures in
management plans to reduce negative impacts (e.g. wildlife passes, Dickson and Beier, 2007).
The occupation model shows a potential isolation of cougar populations in the region, thus
we recommend considering it as a metapopulation having special emphasis on dispersal behavior
of individuals, to assess the connectivity between populations by migration patterns.
Management Implications
This study shows that cougar populations, in terms of densities, present no immediate problems
in conservation. However, there is a gradient of less than 1 to 4 ind/100km2, which may be
Session 6: Corridors, Habitat Use and the Urban Interface
182
associated with the type of land management. Livestock management, linked to the control of
predators could be the factor that exerts a greater negative influence on populations of cougars,
both in density and in their places of employment. It is necessary to promote livestock
management practices that reduce the chances of predation and decrease the removal of
predators. Such practices could include the induction of simultaneous parturition, keeping
livestock away from the hunting areas, the increase of wild prey, among others.
The occurrence model shows a potential biological corridor between Mexico and the U.S.,
located in Sierra San Luis, therefore human activities in this region must take on account in their
development plans the wildlife connectivity, not only for this carnivore species, but for the rest
of the mammal community.
Cougar populations in the region appear to be functioning as a metapopulation in which Sierra de
San Luis could be a source population for the rest of the Sky Islands in Mexico, so it is
recommended that the cougar management proposals are made in a regional basis.
LITERATURE CITED
Brown, E. D. 1983. The Wolf in the southwest the making of an endangered species. The University of Arizona Press.
Ceballos, G. and D. Navarro.1991. Diversity and conservation of Mexican Mammals. Pp 167-198 in Mares, Michael A. Schmidly, David J. Eds. 1991 Latin American mammalogy :history, biodiversity, and conservation Norman : University of Oklahoma Press
Coblentz, D. 2005. The Tectonic Evolution of the Madrean Archipelago and ItsImpact on the Geoecology of the Sky Islands. En: Gottfried, G. J., B. S.Gebow, L.G. Eskew, C. B. Edminster(Comp.). 2005. Connecting Mountain Islands and Deserts Seas: biodiversity and Management of the Madrean Archipelago II. U. S. Department of Agriculture, Forest Service, RockyMountain Research Station. Pp. 62-68
Session 6: Corridors, Habitat Use and the Urban Interface
183
Coblentz, D. y K. Riitters. 2005. A Quantitative Topographic Analysis of the Sky Islands: A Closer Examination of the Topography-Biodiversity Relationship in the Madrean Archipelago. En: Gottfried, G. J., B. S. Gebow, L.G. Eskew, C. B.Edminster (Comp.). 2005. Connecting Mountain Islands and Deserts Seas:biodiversity and Management of the Madrean Archipelago II. U. S.Department of Agriculture, Forest Service, Rocky Mountain Research Station. Pp.69-74.
CONANP (Comisión Nacional de Áreas Naturales Protegidas). 2003. Estudio previo justificativo “Área de Protección de Flora y Fauna Mavavi. SEMARNAT. México.
Cooley, H., R. Wielgus, G. Koehler, H. Robinson, B. Maletzke. 2009. Does hunting regulate cougar populations? A test of the compensatory mortality hypothesis. Ecology 90. Pp 2913-2921.
Currier, M. J. P. 1983. Felis concolor. Mammalian Species. The American Society of Mammalogist. 200:1-7.
Dickson, B. G. and P. Beier. 2007. Quantifying the influence of topographic position on cougar (Puma concolor) movement in southern California, USA. Journal of Zoology. 271: 270–277.
Donovan, T. M. y J. Hines. 2007. Exercises in occupancy modeling and estimation. http://www.uvm.edu/envnr/vtcfwru/spreadsheets/occupancy/occupancy.html
ESRI. 1999. ArcView. Arc View GIS, Ver. 3.2. Windows. USA
Hines, J. E. 2006. PRESENCE 2-Software to estimate patch occupancy and related parameters. USGS-PWRC. http://www.mbrpwrc. usgs.gov/software/presence.html
INEGI. 1973. Cartas topográficas Estado de Sonora, Escala 1:250,000. INEGI. Aguascalientes, México.
Kelly, M. J., A. J. Noss, M. S. Di Bitetti, L. Maffei, R. L. Arispe, A. Paviolo, C. D. De Angelo, y Y. E. Di Blanco. 2008. Estimating Puma Densities From Camera Trapping Across Three Study Sites: Bolivia, Argentina, And Belize. Journal of Mammalogy 89:2. Pp. 408–418.
King, C.M., R. M. McDonald, R. D. Martin, D. I. MacKenzie, G. W. Tempero y S. J. Holmes. 2007. Continuous monitoring of predator control operations at landscape scale. Ecological Management and Restoration 8. Pp 133-139.
Luna Soria, H. y C. A. López González. 2005. Abundance and food habits of cougars and bobcats in the Sierra San Luis, Sonora. Pp. 416-420. In: Connecting mountain islands and desert seas: biodiversity and management of the Madrean Archipelago II. 2004 May 11-15; Tucson, AZ. Proceedings RMRS-P-36. G. J. Gottfried, B. S. Gebow, L. G. Eskew& C. Edminster (eds.). U. S. Forest Service. Fort Collins, CO: US Department of Agriculture, Forest Service, Rocky Mountain Research Station.
Session 6: Corridors, Habitat Use and the Urban Interface
184
MacKenzie D. I., J. D. Nichols, J. E. Hines, M. G. Knutson y A. D. Franklin. 2003. Estimating site occupancy, colonization and local extinction when a species is detected imperfectly. Ecology 84. Pp. 2200–2207.
MacKenzie D.I., J. A Royle, J. A. Brown, J. D. Nichols. 2004 Occupancy Estimation and Modeling for rare and elusive Population. Pp. 134–145 in W. L. Thompson. Ed. 2004. Sampling rare or elusive species. Island Press. Washington , DC .
Menke, K. 2008. GIS data and map documents for Northern Jaguar Project.
Polisar J., I. Maxit, D. Scognamillo, L. Farrell, M. E. Sunquist and J. F. Eisenberg. 2003 Jaguars, pumas, their prey base, and cattle ranching: ecological interpretations of a management problem. Biological Conservation. 109. Issue 2. Pp. 297-310.
Ponce Guevara, E., K. Pelz Serrano y C. A. López González. 2005. Coyote Abundance in Relation to Habitat Characteristics in Sierra San Luis, Sonora, México. En: Gottfried, G. J., B. S. Gebow, L.G. Eskew, C. B. Edminster(Comp.). 2005. Connecting Mountain Islands and Deserts Seas: biodiversity and Management of the Madrean Archipelago II. U. S. Department of Agriculture, Forest Service, Rocky Mountain Research Station. Pp. 337-340.
Robinson, H., R. Wielgus, H. Cooley, S. Cooley. 2008. Sink populations in carnivore management: cougar demography and immigration in a hunted population. Ecological Applications. 18: 1028-1037
Rodríguez-Martínez, A., C. N. Moreno-Arzate, E. R. González-Sierra y C. A. López-González. 2008. Uso de Hábitat, Hábitos Alimentarios y Estructura Poblacional del Oso Negro (Ursus americanus) En la Sierra Madre Occidental de México. En: Lorenzo, C., E. Espinoza y J. Ortega (Eds.). 2008. Avances en el Estudio de los Mamíferos de México. Publicaciones especiales, Vol. II. Asociación Mexicana de Mastozoología, A. C., México, D.F. Pp. 279-294
Rosas-Rosas O.C., L. C. Bender and R. Valdez. 2008. Jaguar and Puma Predation on Cattle Calves in Northeastern Sonora, Mexico. Rangeland Ecology & Management: September 2008, Vol. 61:5. Pp. 554-560.
The Wildlands Project. 2000. Sky Islands Wildlands Network, Conservation Plan, An Extraordinary Plan for a Place Beyond Compare. USA.
Session 6: Corridors, Habitat Use and the Urban Interface
185
Habitat Use of Pumas during Dispersal in the Central Rocky Mountains
Jesse R. Newby, Teton Cougar Project, P.O. Box 34 Kelly, WY 83011, USA (presenter) L. Scott Mills, Wildlife Biology Program, Univ. of Montana, Missoula, MT 59812, USA Howard B. Quigley, Panthera, 8 W 40th St, 18th Floor, New York, NY 10018, USA Michael S. Mitchell, Montana Cooperative Wildlife Research Unit, Univ. of Montana, Missoula,
MT 59812, USA Toni K. Ruth, Hornocker Wildlife Institute/Wildlife Conservation Society, 301 N Wilson
Avenue, Bozeman, MT 59715, USA Daniel H. Pletscher, Wildlife Biology Program, Univ. of Montana, Missoula, MT 59812, USA Kerry M. Murphy, Bridger-Teton National Forest, 340 N Cache, Jackson, WY 83001, USA Rich DeSimone, Montana Fish, Wildlife & Parks, Helena, MT 59620, USA Abstract: Dispersal movements through heterogeneous landscapes form the foundation for species’ evolution, ecology and conservation. Habitat use during dispersal is expected to be especially significant for populations strongly influenced by inter-population processes. We examined habitat use of dispersing pumas (Puma concolor) in three separate study populations in the Central Rocky Mountains using location data from GPS (n = 11) and VHF (n = 123) radio-collared individuals, providing two independent datasets from all three study areas. Hypotheses for landscape features preferred during dispersal were tested with a priori models centered on forest cover, topographic cover, hunting habitat, and anthropogenic disturbance. The best-supported hypotheses for GPS collared dispersers included landscape characteristics associated with successful hunting of ungulate prey and avoidance of anthropogenic development. Among VHF collared individuals the hunting of ungulate prey model performed best, with the combined prey and anthropogenic disturbance model ranked second. For both GPS and VHF datasets no significant effects on habitat use were found for dispersers’ sex, study populations, or day versus night locations. No difference in habitat use was evident between winter and summer for VHF collared individuals; however, seasonal effects were significant in the GPS dataset. A resource selection function (RSF) was developed using results obtained from the best performing GPS model and validated with an independent dataset (VHF locations). Overall, the RSF was found to be highly predictive of disperser space use with an independent dataset. This RSF could help identify areas important to dispersal in the Central Rockies. More generally, tests of competing a priori models indicate dispersing pumas prefer habitats with ample access to ungulate prey, similar to resident adult pumas, and that dispersers may avoid development. Identifying landscape linkages of suitable hunting habitat and minimizing anthropogenic development in these areas could assist conservation of puma populations and inter-population connectivity.
Session 6: Corridors, Habitat Use and the Urban Interface
186
Panther Habitat Characteristics and Distribution in Southern Florida
Robert A. Frakes, U.S. Fish and Wildlife Service, South Florida Ecological Services Office,
1339 20th Street, Vero Beach, FL 32960, USA, [email protected] (presenter) Robert C. Belden, U.S. Fish and Wildlife Service, South Florida Ecological Services Office,
1339 20th Street, Vero Beach, FL 32960, USA, [email protected] Barry E. Wood, U.S. Fish and Wildlife Service, South Florida Ecological Services Office, 1339
20th Street, Vero Beach, FL 32960, USA, [email protected] Frederick E. James, South Florida Natural Resources Center, Everglades National Park, 950 N.
Krome Ave., 3rd Floor, Homestead, FL 33030, USA, [email protected] Timothy J. Robinson, University of Wyoming, Laramie, WY 82071, USA, [email protected]
Abstract: The Florida panther is the last subspecies of Puma still surviving in the eastern United States. Historically occurring throughout the southeastern United States, today the panther is restricted to less than 5 percent of its historic range in one breeding population of approximately 100 animals, located in southern Florida. Using radio-telemetry data from 84 prime-aged adult panthers (31 males and 53 females) during the period 1999 to 2009 (30,247 radio-locations), we analyzed the characteristics of the occupied area and used those attributes in a generalized linear model and a random forest model to develop a predictive distribution map for resident breeding panthers in southern Florida. Using 10-fold cross validation, the model was 90 percent accurate in predicting presence or absence of panthers in the 17,000 km2 study area. Analysis of variable importance indicated that the amount of wetland forests and forest edge, hydrology, and human population density were the most important factors determining presence or absence of panthers in southern Florida. Marshes, shrub swamps, and grassland/prairies were also important components of panther habitat. As expected, saltwater wetlands and urbanized areas were strong negative predictors of panther presence. On a scale of 0-1, all panther home ranges had an average model-predicted probability between 0.48 and 0.98, with a median probability of 0.87. The models indicate that 6,345 km2 of suitable breeding habitat remain in southern Florida and that 1,548 km2 (25%) of this habitat is in non-protected private ownership. These models should be useful for evaluating the impacts of future development projects, in prioritizing areas for panther conservation (e.g., mitigation areas, panther conservation banks, conservation easements, and fee title purchases), and evaluating the potential impacts of sea-level rise and changes in hydrology associated with climate change.
Session 6: Corridors, Habitat Use and the Urban Interface
187
Modeling Cougar Resource Selection over Multiple Scales and Behaviors Wendy R. Rieth, Dept. of Wildland Resources, 5230 Old Main Hill, Utah State University,
Logan, UT 84322-5230, USA, [email protected] (presenter) David C. Stoner, Dept. of Wildland Resources, 5230 Old Main Hill, Utah State University,
Logan, UT 84322-5230, USA, [email protected] Michael L. Wolfe, Dept. of Wildland Resources, 5230 Old Main Hill, Utah State University,
Logan, UT 84322-5230, USA, [email protected] R. Douglas Ramsey, Dept. of Wildland Resources, 5230 Old Main Hill, Utah State University, Logan, UT 84322-5230, USA, [email protected] Abstract: Nocturnal predators, such as the cougar (Puma concolor), may utilize resources differently depending on time of day, particularly if resource use is optimized for a specific behavior. We used conditional logistic regression models and GPS collar data from 12 cougars in the Oquirrh Mountains, Utah, to determine whether cougar resource selection varied over three behaviors (prey caching, daybed selection, and nocturnal activities) and two scales of availability. Results indicated that cougars used resources differently depending on their behavior. The cache site models suggested that cougars attempt to reduce losses to scavengers and decomposition when caching prey. Cougars cached prey in canyons; southern and eastern aspects; lower elevations; areas with a high diversity of vegetation types; wooded and forested land cover types; and away from edges. Cougar selection of daybeds appeared to be a function of security and thermoregulation variables. Daybed models indicated a negative association with western aspects, edges, and roads, but a positive association with streams; moderate to high elevations; moderate to steep slopes; southern aspects; and rocky, deciduous woodland, and riparian cover types. Cougars used a wider range of resources during nocturnal activities than for caching or daybed activities, but cougars used resources that reduced the energetic costs of hunting and facilitate stalking of prey. Models describing cougar nocturnal activities indicated a negative association with northern aspects, valley landforms, grasslands, agriculture, and disturbance, and a positive association with streams; roads; edges; canyon landforms; gentle to moderate slopes; and rock and deciduous woodland cover types. Models differed depending on the scale at which resource availability was defined. Cross-validation procedures confirmed that the models were reliable. We conclude that using only diurnal telemetry data to model cougar habitat, or using data pooled over all behaviors and times of day could result in a misleading or incomplete understanding of cougar habitat.
188
Session 7: Corridors, Habitat Use
and the Urban Interface (cont.)
Proceedings of the 10th Mountain Lion Workshop
Cougars: Conservation, Connectivity and Population Management
Session 7: Corridors, Habitat Use and the Urban Interface (cont.)
189
Linking Resource Selection and Mortality Modeling for Population Estimation of Mountain Lions in Montana
Hugh Robinson, Cooperative Wildlife Research Unit, Natural Sciences Rm#208, University of Montana, Missoula, MT, [email protected] (presenter)
David Choate1, Ecology Center and Berryman Institute, Utah State University, Logan UT 84322. [email protected]
Rich DiSimone, Montana Fish, Wildlife & Parks, Helena, MT 59620 (retired)
Mark Hebblewhite, Wildlife Biology Program, College of Forestry and Conservation, University of Montana, Missoula MT
Tom Jones, Game Warden/Supervisor, Gros Ventre and Assiniboine Tribes, Fort Belknap Reservation, Harlem, MT
Mike Mitchell, Cooperative Wildlife Research Unit, Natural Sciences Rm#205, University of Montana, Missoula, MT
Kerry Murphy2, Hornocker Wildlife Institute/Wildlife Conservation Society, 301 North Wilson Avenue, Bozeman, MT 59715, USA
Toni Ruth3, Hornocker Wildlife Institute/Wildlife Conservation Society, 301 North Wilson Avenue, Bozeman, MT 59715, USA
Leland Top Sky, Fish and Game Supervisor, The Chippewa Cree Tribe, Rocky Boys Reservation, Box Elder, MT
Jim Williams, Montana Fish, Wildlife &Parks, Kalispell, MT 59901
1 present address: School of Life Sciences, University of Nevada, Las Vegas, 4505 S. Maryland Pkwy, Las Vegas, NV
2 present address: Bridger-Teton National Forest, Jackson WY, 83001 3 present address: Selway Institute, 76 Sunflower Road Salmon ID 83467 Abstract: In Montana a combination of limited entry and quotas are used by the Department of Fish Wildlife and Parks (MTFWP) to allow recreational opportunities for the public, while maintaining viable mountain lion populations, thus creating a need for accurate and defensible population estimates. Advances in generalized linear modeling and geographical information systems (GIS) have made available new techniques to quantify and spatially represent resource selection, mortality risk, and population dynamics. Using data collected by our collaboration of scientists, I propose to produce spatially explicit models of mountain lion resource selection, survival, densities, and population dynamics. This research will be directed towards aiding MTFWP personnel in developing local harvest strategies and a statewide mountain lion management plan.
Session 7: Corridors, Habitat Use and the Urban Interface (cont.)
190
Direct and Indirect Effects of Predators on an Endangered Species: Testing Predictions of the Apparent Competition Hypothesis
Heather E. Johnson, University of Montana, Wildlife Biology Program, College of Forestry and Conservation, Missoula, MT 59812, USA (presenter)
Mark Hebblewhite, University of Montana, Wildlife Biology Program, College of Forestry and Conservation, Missoula, MT 59812, USA
Thomas R. Stephenson, Sierra Nevada Bighorn Sheep Recovery Program, California Department of Fish and Game, 407 West Line Street, Bishop, CA 93514, USA
David W. German, Sierra Nevada Bighorn Sheep Recovery Program, California Department of Fish and Game, 407 West Line Street, Bishop, CA 93514, USA
Becky M. Pierce, Sierra Nevada Bighorn Sheep Recovery Program, California Department of Fish and Game, 407 West Line Street, Bishop, CA 93514, USA
Vernon C. Bleich, Sierra Nevada Bighorn Sheep Recovery Program, California Department of Fish and Game, 407 West Line Street, Bishop, CA 93514, USA
Abstract: Predation can disproportionately affect endangered prey populations when generalist predators are numerically linked to more abundant primary prey. Apparent competition, the term for this phenomenon, has been increasingly implicated in the declines of endangered prey populations. We examined the potential for apparent competition to limit the recovery of Sierra Nevada bighorn sheep (Ovis canadensis sierrae) an endangered subspecies under the U.S. Endangered Species Act. Using a combination of spatial, demographic, and habitat data we assessed whether cougars were having direct and indirect effects on bighorn sheep as a consequence of winter range overlap with abundant mule deer. Consistent with the apparent competition hypothesis, bighorn sheep populations with high spatial overlap with deer exhibited higher rates of cougar predation and cougar-kills occurred within areas of overlap of bighorn sheep and deer. Of those bighorn sheep populations that experienced cougar predation, antipredator behavior was correlated to the area of overlap with deer, such that populations with greater spatial overlap with deer selected steeper, more rugged terrain. The effects of predation were spatially variable among bighorn populations and temporally variable within them. Spatial variation was likely driven by landscape-scale differences in the availability of low elevation habitat, and temporal variation by changes in forage availability. Evidence suggests that apparent competition is limiting some bighorn sheep populations, but is not the primary factor limiting all populations. Management plans for endangered species should consider the spatial distributions of key competitors and predators to reduce the potential for apparent competition to hijack conservation success.
Session 7: Corridors, Habitat Use and the Urban Interface (cont.)
191
Understanding the Conservation Needs of Mountain Lions in an Urban Southern California Landscape Jeff A. Sikich, Santa Monica Mountains National Recreation Area, 401 W. Hillcrest Dr., Thousand Oaks, California 91360, USA, [email protected] (presenter) Seth P. D. Riley, Santa Monica Mountains National Recreation Area, 401 W. Hillcrest Dr., Thousand Oaks, California 91360, USA, [email protected] Abstract: Habitat loss and fragmentation are serious threats to mountain lion conservation, especially in southern California, where human development encroaches upon and subdivides remaining natural areas. In 2002, the National Park Service began studying the ecology, behavior, and conservation of mountain lions in and around Santa Monica Mountains National Recreation Area using GPS radio-collars. Based on home range sizes and the small population, it is clear that remaining natural areas are too small to support a sustainable mountain lion population; therefore habitat connectivity across freeways is critical for local mountain lion persistence. Only 1 of 20 radio-collared lions has crossed Highway 101, which separates the Santa Monica Mountains from other natural areas to the north. Based on microsatellite genotypes, the lions in our study area are less genetically diverse than those in other areas throughout California. The lion that crossed Highway 101 successfully mated with a female that produced three kittens, bringing new genetic material to the region. We have documented successful reproduction and monitored 7 kittens (2 litters) with implantable VHF transmitters. However, the leading cause of death in our study is intraspecific strife, and we have found that roads and development can restrict lion movements, especially for young males attempting to disperse, which may increase the likelihood of fights with adult males. The exposure of lions to anticoagulant rodenticides may also be greater in urban areas. Two lions died from anticoagulant toxicity, and 8 of 9 lions showed exposure to multiple compounds, with the youngest being 3.5 months old. Fortunately, conflict with humans and livestock has been minimal. We identified 389 kills, and although 94% were mule deer, 2 lions also killed sheep and goats on a local ranch. After working with the landowner to modify their husbandry practices, depredations were eliminated. Mountain lion persistence in the park may be possible as long as sufficient habitat with connectivity is available, human-caused mortality sources are reduced, and lion-human conflict remains minimal.
Session 7: Corridors, Habitat Use and the Urban Interface (cont.)
192
Effects of Residential Development on Cougar Spatial Ecology in Washington
Brian N. Kertson1, 2, School of Forest Resources, Box 352100, University of Washington, Seattle, WA 98195, USA, [email protected] (presenter)
Benjamin T. Maletzke, Large Carnivore Conservation Lab, Washington State University, Pullman, WA 99164, USA, [email protected]
Mark E. Swanson, Department of Natural Resource Sciences, Washington State University, Pullman, WA 99164, USA, [email protected]
Gary M. Koehler, Washington Department of Fish and Wildlife, 2218 Stephanie Brooke, Wenatchee, WA 98801, USA, [email protected]
Richard A. Beausoleil, Washington Department of Fish and Wildlife, 3515 State Highway 97A, Wenatchee, WA 98801, USA, [email protected]
Hilary S. Cooley, Idaho Department of Fish and Game, 3101 S Powerline Rd Nampa, ID 83686, USA, [email protected]
Robert B. Wielgus, Large Carnivore Conservation Lab, Washington State University, Pullman, WA 99164, USA, [email protected]
1present address: Idaho Department of Fish and Game, 3101 S Powerline Rd, Nampa, ID 83686 2current email: [email protected] Abstract: Residential development creates significant challenges for managing and conserving large carnivores. Cougar (Puma concolor) use of residential areas and proximity to people is a growing management concern, but little is known of how residential levels and patterns effect cougar spatial ecology. We used utilization distributions (UD), county tax parcel data, and multiple comparison techniques to quantify and compare cougar (n = 101) use of residential areas across 4 study areas in Washington. We used Weibull functions and a lacunarity analysis to examine how different levels and patterns of residential development influence space use and reports of cougar-human interaction. Cougar UDs encompassed predominantly undeveloped parcels at both the hectare (𝑥 = 98.09%, SD = 3.12, n = 101) and km2 (𝑥 = 81.59%, SD = 15.60, n = 101) scales as cougars decreased use as residential densities increased. Lower use of residential areas at the hectare scale demonstrated use of undeveloped, suitable habitat within the matrix of residential development. Use in eastern Washington study areas occurred in areas with residential densities ≤ 55.2 residences/km2 whereas use in western Washington occurred in areas with ≤ 846.0 residences/km2. Dense forest vegetation and clustered residential development allowed western Washington cougars to exploit landscapes with higher residential densities. Increasing amounts of forested habitat and human population size increased the number of cougar reports, but both factors explained < 50% of observed variability in annual report levels (Forest: R2 = 30.5%, Population: R2 = 44.3%). Diffuse, low density development (i.e., exurban) can increase cougar proximity to residences and may increase report levels. Wildlife managers looking to reduce use of residential areas and interactions should account for cougar spatial ecology and human distribution while exploring collaborations with development and landscape planners to cluster residential development at urban densities (> 10 residences/ha) in lower quality habitat.
Session 7: Corridors, Habitat Use and the Urban Interface (cont.)
193
Cougars in the Backyard: Large Carnivore Conservation in Developing Landscapes Aliah Adams Knopff, Talus Environmental Consulting, 127 Silver Valley Rise NW, Calgary,
AB T3B 4W9, Canada, (presenter) Kyle H. Knopff, Golder Associates Ltd., 102, 2535 - 3rd Avenue S.E., Calgary, Alberta T2A
7W5, Canada, www.golder.com Mark S. Boyce, Department of Biological Sciences, University of Alberta, Edmonton, AB T6G
2E9, Canada, www.biology.ualberta.ca Colleen Cassady St. Clair, Department of Biological Sciences, University of Alberta, Edmonton,
AB T6G 2E9, Canada, www.biology.ualberta.ca Abstract: Maintaining large carnivores in human-dominated landscapes poses a significant conservation challenge. In such landscapes, large carnivores are often extirpated by anthropogenic habitat modification or direct persecution by people. Persecution is especially likely when carnivores threaten human lives or property. Habitat loss and conflict with people have been identified as top threats to conservation of cougars in North America. We studied cougar habitat selection and human perception of cougars in west-central Alberta, Canada. Cougars varied in the degree of avoidance they exhibited to human development. Individuals exposed to higher levels of anthropogenic development within their home range exhibited less avoidance of anthropogenic features than cougars with limited exposure to development. Additionally, cougars altered habitat use temporally to accommodate diel variation in human activity. Survey results indicated that nearly 40% of west-central Albertans would shoot a cougar on sight if it was seen near their home and respondents substantially overestimated the risk cougars pose to human safety. Nevertheless, respondents valued the persistence of cougars in Alberta, provided cougars did not occur in their “backyard” and remained in wilderness areas. Tolerance for cougar-human coexistence in rural areas was lowest amongst older members of the community, hunters, and ranchers and was positively correlated with education. Our results suggest that persistence of cougars in moderately developed rural and exurban landscapes hinges more on the tolerance of local residents than on habitat constraints resulting from development. Addressing conflicts in conjunction with education programs designed to promote value for cougars will be critical for cougar conservation on increasingly human-dominated rural and exurban landscapes.
Session 7: Corridors, Habitat Use and the Urban Interface (cont.)
194
Cougar Behavioral Response to Anthropogenic Activities and Landscapes: Evidence of Ambivalence? David C. Stoner, Utah State University, Dept. of Wildland Resources, 5230 Old Main Hill
Logan, UT 84322-5230, USA, [email protected] (presenter) Michael L. Wolfe, Utah State University, Dept. of Wildland Resources, 5230 Old Main Hill
Logan, UT 84322-5230, USA, [email protected] Abstract. Recent developments in theoretical and applied research have elucidated the tenuous balance between predation risk and resource acquisition in habitat selection behavior of carnivores. Cougars (Puma concolor) are obligate carnivores distributed over much of the West and several investigators have hypothesized that cougars avoid landscapes associated with human activities. In addition to survival costs, anthropogenic landscapes present cougars with highly predictable foraging opportunities. Therefore, our goal was to evaluate the hypothesis that cougars are wilderness obligates by addressing three constituent questions: 1) how do cougars respond to human altered landscapes, 2) do cougars make trade-offs in habitat selection based on anthropogenic inputs, and 3) do peri-urban cougar populations act as de facto sinks? We employed GPS collars to study cougar movement and predation behavior in the Oquirrh Mountains near Salt Lake City, Utah. From 2002-2009 we instrumented 21 individuals and measured their response to four human land-use types comprising the urban-wildland interface (UWI) at two scales. At the macro scale response was generally defined by avoidance, as all individuals used to anthropogenic landscapes less than available. At the micro-scale however, cougar response varied by demographic class and land-use type. Contrary to our predictions, maternal females did not make habitat selection trade-offs, but used risky habitats within the UWI at greater frequencies than their non-maternal counterparts. Human-caused mortality on the UWI disproportionately affected dispersing males and senescent females. Animals capitalizing on anthropogenic food resources tended to be inefficient hunters, best exemplified by the very young and the very old, lending little support to the de facto sink hypothesis. We argue that cougar response to anthropogenic landscapes is best described as one of ambivalence; they appear sufficiently flexible to exploit opportunities provided by human activity, but their nocturnal, reclusive, and non-gregarious behavior partially ameliorate potential conflicts. Rather than viewed as either a wilderness obligate or synanthropic, cougars are best characterized as a behaviorally plastic, disturbance-adapted species.
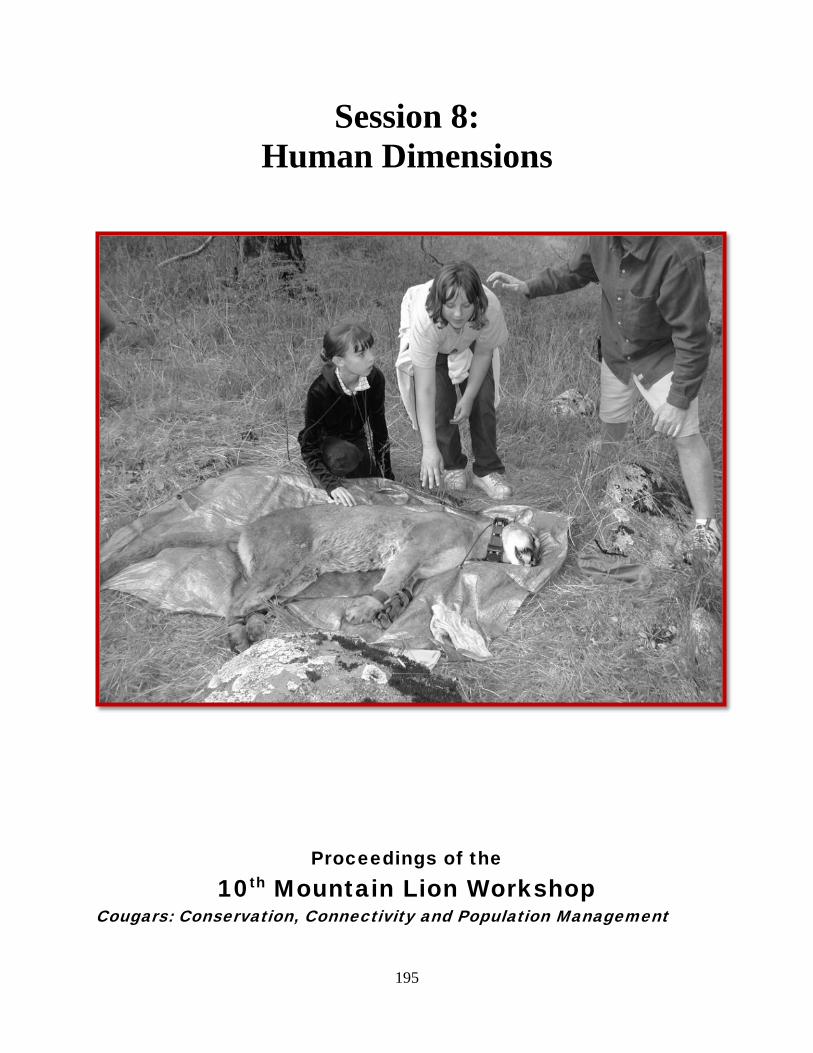
195
Session 8: Human Dimensions
Proceedings of the 10th Mountain Lion Workshop
Cougars: Conservation, Connectivity and Population Management
Session 8: Human Dimensions
196
Florida Gulf Coast University Promotes Florida Panther Conservation through a Unique Environmental Education Program Ricky Pires, Director/FGCU “Wings of Hope” Environmental Education Program, 10501 FGCU
Blvd. South/Reed Hall 213, USA [email protected] (presenter) Abstract: Elementary students are bused in their yellow limo (school bus) to the FGCU campus, and participate in a science based Florida Panther Posse program, in a classroom transformed into a learning center focused on the Florida panther. The FGCU “Wings of Hope” program is an integral part of the Environmental Humanities curriculum and service learning at Florida Gulf Coast University (FGCU). University students from diverse majors are introduced to native South Florida wildlife species, with a focus on the Florida panther. The elementary students become a Panther Posse and rotate through five challenges, where FGCU students teach them about Florida panther natural history and panther signs (becoming a “panther tracker”), Florida panther kittens, wildlife that lives with the Florida panther, water conservation, and the Florida panther research. The program involves hands-on activities, note-taking in a specially designed science journal, and examination of scientific instruments used for research. The challenges build confidence and help all participants to understand, protect, and save the Florida panther and the natural world. Back at their individual elementary schools, the young students in each Posse collect “Pennies for Panthers” in their classroom, used to purchase infrared motion cameras. The Posses cameras are mounted around South Florida panther habitat. These images provide all students a better appreciation of the Florida panther. The FGCU “Wings of Hope” program focuses on bringing back a sense of place within our family, community and the environment. Each elementary school and college student takes the information they learn and educates at least two other people about the Florida panther and the natural world. Over 8,000 additional people are educated each year about this endangered species. For the past 10 years the FGCU Florida Panther Posse program has built bridges of hope for the endangered Florida panther and its habitat with environmental education and awareness to thousands of individuals in South Florida.
Session 8: Human Dimensions
197
The Feasibility of The Northeastern U.S. Supporting The Return Of Cougars (Puma Concolor) John W. Laundré, Department of Biological Sciences, SUNY Oswego, Oswego, NY
13126/Cougar Rewilding Foundation, PO Box 300, Harman, WV, 26270 (presenter) Abstract: Cougars (Puma concolor) were part of the pre-European fauna of northeastern United States. They were extirpated in the late 1800’s and since the late 1900’s there has been discussions concerning their reintroduction into the region. One site mentioned is Adirondack State Park in upstate New York. In 1981, an assessment of the feasibility of returning cougars concluded the Park could biologically support a small population of cougars. However conflicts with humans would cause the demise of this population in 10 years. Thus, reintroduction at that time was not advised. Since that time, knowledge of cougar ecology and cougars’ relationship with humans has increased substantially. Based on information compiled since the 1980’s, I conducted a GIS analysis to assess if cougars could live in the Park. Results indicate that cougars could occupy approximately 13,700 to 19, 500 km2 (57-79%) of the Park with minimal contact with human habitation. Based on common cougar densities, the Park could support 190-390 cougars. These cougars would consume < 10% of the adult deer population annually and that fawn production is sufficient to replace these loses. Politically, the Park has similar human and road densities of the Black Hills, South Dakota region and the Big Cypress Swamp region of Southern Florida, both of which have viable populations of cougars. I concluded that the Adirondack Park could both biologically and politically support a population of cougars. What remains to be seen is if there is human will to bring them back.
Session 8: Human Dimensions
198
The Discourses of Incidents: Cougars on Mt. Elden and in Sabino Canyon, Arizona David J. Mattson, U.S. Geological Survey (USGS) Southwest Biological Science Center, P.O.
Box 5614, Northern Arizona University, Flagstaff, AZ 86011, USA, [email protected] (presenter)
Susan G. Clark, School of Forestry & Environmental Studies, and Institution for Social & Policy
Studies, Yale University, Kroon Hall, 195 Prospect Street, New Haven, CT 06511, USA, [email protected]
Abstract: Incidents are relatively short periods of intensified discourse arising from public responses to symbolically important actions by public officials. We applied a framework for the analysis of international incidents to events during 2001-2004 in Arizona precipitated by the removal or intended removal of cougars (Puma concolor) by state and federal agencies in response to public safety concerns. Our objectives were to elucidate elements of key narratives, alliances of participants, and differences in narrative focus between incident and background periods. Cougars were mentioned in newspaper articles 13 to 33 times more often during incidents compared to background periods. During incidents, discourses focused on describing problematic human behaviors and advocating related solutions. State wildlife agency commissioners and hunters consistently shared a narrative that featured killing cougars to solve problems, making cougars and those who promoted the intrinsic value of cougars culpable, and retaining power to define and solve cougar-related problems. Personnel from affected state and federal agencies shared a similar narrative. Most other participants shared a narrative that defined “the problem” primarily in terms of peoples’ behaviors, whether when around cougars or, relative to agency personnel, when formulating and implementing policies. This narrative also advocated decentralization of power over cougar management. We concluded that differences in perspectives were organized around differences in allocations of responsibility and preferences for lethal versus non-lethal methods, which aligned with whether participants were enfranchised or disenfranchised by current state-level management power arrangements. Common ground was evident in shared concerns about habitat and a preference for solutions that featured education.
Session 8: Human Dimensions
199
Mountain Lion Policy Process in Three States: an Advocate’s Viewpoint Wendy Keefover, WildEarth Guardians, P.O. Box 1471, Broomfield, CO 80038, USA,
303.573.4898, Ext. 1162, [email protected] (presenter) When a wildlife-management agency and stakeholders with divergent points of view can find
common cause, decision-making becomes better informed by science and acrimony dissipates.
WildEarth Guardians has advocated in three states for maintaining ecologically functional
populations of mountain lions. Results have varied. In Colorado, mountain lions benefited from
substantial policy reforms as a result of a decision-making process that became more inclusive
over time—but only after divergent stakeholders came to agreement among themselves first. In
comparison, New Mexico and Montana have held less inclusive stakeholder forums. As a result,
the policy outcomes in those states reflect a disregard for the best available science, which has
resulted in increasing lion-hunting quotas, which we believe are neither justified nor sustainable.
Below we summarize some of the greatest obstacles to achieving policy reforms for
mountain lions and then give a brief description of our campaign work in three states for
mountain lions.
The problem:
As politicized institutions, wildlife agencies often adopt policies that are uninformed by the best
available science, especially regarding the principles of conservation biology. Because hunters,
the key stakeholder group of the wildlife agencies, have held historical relationships with, and
provide benefits to, wildlife agencies through the user-pay model, unsustainable and
scientifically unjustified mountain lion hunting-permit levels have been instituted—despite the
fact that wildlife belong to no one and are held in a public trust for all (see e.g., Horner 2000,

Session 8: Human Dimensions
200
Jacobson et al. 2010). Additionally, wildlife agencies in the West have catered to concerns held
by those in agribusiness but not the entire public, which also results in detrimental outcomes for
wildlife.
In 1982, hunters in 10 Western states killed a total of 931 mountain lions. By the mid-
1990s, however, lion hunting increased three-fold, peaking at 3,454 in 2001. Since that time,
hunter kill of lions has declined by about 1,000 in those states—perhaps because of overkill.
Native carnivores such as mountain lions are largely killed because of misperceptions
that they compete with humans for food or make humans and livestock safer (Baker et al. 2008).
Arguably, a high level of lion hunting appeases both hunters and the state wildlife agencies.
The former because of concerns about resource competition over big game prey, but also
because this group can profit from guiding others, who do not own lion-hunting dogs.
A high level of lion hunting benefits state wildlife agencies because states derive license
revenues from both lion and ungulate hunters. State agencies’ key constituents are appeased
because it appears the state has allowed greater hunting opportunities for both lion and ungulate
hunters. Furthermore, by keeping lion quotas high, states can claim they are helping to prevent
future conflicts between lions and humans, livestock, and pets. We dispute each of these notions
in turn.
Mountain lions and other native carnivores kill few livestock. The National Agricultural
Statistics Service (NASS), an arm of the US Department of Agriculture (USDA), issues bi-
decadal reports on livestock losses. It released the newest cattle inventory and loss report in May
2011, and the sheep figures the year before. In 2010, the cattle inventory numbered 94 million
head (NASS 2011). Of that figure, 219,900 cattle, or 0.23% of the total US cattle inventory,
Session 8: Human Dimensions
201
were killed by native carnivores and domestic dogs. Felids (pumas, bobcats, and lynx) preyed on
18,900 cattle, or 0.02% of the 2010 cattle inventory (NASS 2011).
In comparison, weather, health, and theft losses totaled nearly four million cattle, or 4%
of the cattle inventory (NASS 2011). The top five killers of cattle came from respiratory
problems (over one million); digestive problems (505,000); complications while calving
(494,000); weather (489,000); and “unknown” causes (435,000).
In 2009, sheep producers raised 5.7 million animals (NASS 2010b). Of that figure, native
carnivores and domestic dogs killed 4% of the total production (NASS 2010a). In comparison,
7% of sheep died from poor health, weather events, or other causes (NASS 2010a).
As the data prove, a miniscule number of cattle and sheep are lost to predation. Livestock
growers face threats from disease, calving, and weather, but numerically few from native
carnivores and dogs.
Mountain lions and other native carnivores are also implicated by some for eating native
prey such as deer, elk, or bighorn sheep. Yet, the largest threat to ungulates (and indeed, all
mammals) is human hunters (Collins and Kays 2011). Nevertheless, wildlife agencies jealously
guard against ungulate consumption by native carnivores, because they see carnivores as a
potential threat to their revenue streams, which is largely derived from the sale of elk and deer
licenses. In recent years, the Department of Interior has found that the number of hunters has
declined; yet, states have yet not broadened their economic portfolios to capture monies from
other stakeholders, because to do so would encourage a more participatory process, and, in our
experience, states have been resistant to engage in democratic decision making processes.
Furthermore, few people have been attacked or killed by mountain lions. Eighteen
people have died in the U.S. from lion attacks in the period between 1890 and May 2011 (Beier
Session 8: Human Dimensions
202
1991, 1992, Fitzhugh 2003). Some parties routinely use exaggerated human-safety fears to
invoke large carnivore extermination campaigns (Schwartz et al. 2003). Decision makers have
persisted in calls for elevated lion killing in the assumption that it will make people safer. Yet,
there is “no scientific evidence” that sport hunting reduces the risk of lion attacks on humans
(Cougar Management Guidelines 2005). And as we learned at this conference, high-hunting
pressures on lion populations change their social structure—releasing more sub-adult males,
which can create both social and ecological chaos.
Conservationists, not the paying clientele of wildlife agencies, are marginalized, even
when conservation biology decisions should prevail—decisions based on the best available
science not only benefit the public trust but also ecological systems. WildEarth Guardians’
success in obtaining mountain lion management reform, that is, getting states to adopt science
into policy-making, has been uneven in the face of states’ institutionalized barriers as follows.
The Colorado Case:
In 2001, WildEarth Guardians (then known as “Sinapu”) raised concerns about Colorado’s
mountain lion population when we saw that the quota and hunter kill of lions had jumped by
219% and 442%, respectively, over a period of two decades. Beginning that year, and until
2008, we annually petitioned the Colorado Wildlife Commission seeking redress, such as calling
for the establishment of hunt-free refugia (a robust conservation biology concept), protections for
breeding females and their dependent young (hunter education and sub-quotas), and reductions
in the lion-hunting quota.
Session 8: Human Dimensions
203
We also used both public and private spheres to call for reforms. Public sphere forums
included providing public testimony at commission hearings, using the media—both earned and
paid—and presenting our mountain lion slide shows to public audiences around the state. The
result was that we were able to generate thousands of letters over time to the agency and gain a
public that was more engaged and educated about the wildlife-management policy process.
In the private sphere, we interacted individually with wildlife commissioners, most often
at commission hearings. Additionally, at those forums, we talked to houndsmen and outfitters.
We also interacted frequently with Colorado Division of Wildlife (DOW) officials – both at
hearing spaces, at meetings at their offices, or by individual communication (i.e., phone and
Internet).
WildEarth Guardians met with considerable resistance from the agency, the Wildlife
Commission, and most other stakeholders. Nevertheless, early on, we convinced commissioners
that the DOW had no credible population data for mountain lions and that it could not show that
a 400% increase in the level of lion hunting was sustainable—despite the DOW’s public
assurances to the contrary.
In 2002, while our petition was ignored, the Wildlife Commission called for the hire of a
new carnivore biologist to study Colorado’s lion population and to document the effects of
hunting. In 2003, Ken Logan, PhD and co-author of Desert Puma (2001), was hired to
commence a 10-year study of the effects of lion hunting on a population.
In 2004, because we had effectively been shut out of public policy process by the DOW
and the commission for three years, WildEarth Guardians brought our message to the public.
That year and for several years after, we began giving a multitude of mountain lion talks about
the natural history, co-existence, and management of mountain lions around Colorado, often in
Session 8: Human Dimensions
204
less urbanized areas. In 2004, the houndsmen responded by sponsoring Dr. Logan, who gave five
lion talks to stakeholders around the state.
Inspired by the Logan-houndsmen tour, our 2004 petition to the Wildlife Commission
solely requested that protections for females and kittens be instituted through a formalized hunter
education program—so that hunters could reliably distinguish between the sexes, thus sparing
breeding females and their dependent young. In addition to our statewide public forums, we
earned a good deal of statewide media. At the Commission’s hearing, we presented 2,000 letters
to the Commission.
Also, that year, the DOW produced a greatly improved mountain lion management plan,
which had used GIS mapping and modeling. After seeing their own results, the DOW revised its
earlier estimate of the lion population, from 3,000 to 7,000, to a more substantiated number,
4,500 to 5,500 mountain lions. The new population estimate caused the DOW to recommend
that the Wildlife Commission reduce the quota from 791 to 567, and in 2004, the Commission
voted to reduce the quota by a dramatic 30%.
Todd Malmsbury, the DOW spokesman, stated to the Rocky Mountain News: “The
Wildlife Commission agreed to change [the quota] because both the lion hunters and Sinapu
came to an agreement on the number,” (Gary Gerhardt, “Wildlife panel lowers cougar hunting
quota” 11/18/04). Sinapu and the houndsmen agreed to the quota number developed by the
DOW. That number, for the first time, had a scientific basis. This marked a turning point for the
policy process. At this moment, the DOW had begun to “listen” to all stakeholders.
In 2005, we again conducted a public campaign and gave talks in 22 venues. To elevate
our profile in some of the towns where we gave talks, we bought newspaper ads depicting a
female lion with a kitten captioned, “Pumas don’t have orphanages.” Our petition that year
Session 8: Human Dimensions
205
again called for a mandatory hunter education program, so that hunters could distinguish
between the sexes in order to protect breeding females and kittens. To our surprise, ten days
later the Colorado Outfitters Association made the same request.
At the 2005 Colorado Wildlife Commission hearing, the houndsmen, agriculturalists, and
the DOW itself testified in opposition to the hunter education program. However, as a result of
the outfitters and our common wish, the Wildlife Commission ordered that the DOW develop an
online hunter education program with an emphasis on distinguishing between males and females
and promoting the conservation of breeding females and their dependent kittens.
Despite its initial public opposition, the DOW, to its enormous credit, devised a program
that was then vetted through a public stakeholder process and informed by the best available
science. The program has since become a model for other states—thus, we were able to bring it
to both New Mexico and Montana, where it has been adopted.
In Colorado, the lion hunter education program has caused a decline in the number of
females in the hunter kill. From 1991 to 2004, the average percent of females in the hunter kill
was 43%. From 2005 to 2011, the average percent of females in the hunter kill equals 36%.
In short, the Colorado process resulted in a win-win-win outcome for lion hunters,
conservationists, the DOW, and arguably, most important for lion conservation. While the
agency was initially adverse to robust input from all stakeholders, eventually, it came to
appreciate participatory mechanisms during the mountain lion policy process; it has been open to
hearing input from diverse stakeholders on mountain lion issues over the last few years; the
agency has engaged in this process—generally through informal communications. As a result,
the quota has remained roughly static, and the number of females in the hunter kill has declined.
The debate in the public sphere has also subsided.

Session 8: Human Dimensions
206
New Mexico Case:
WildEarth Guardians along with our colleagues, Sierra Club and Animal Protection of New
Mexico, has worked on a multi-year campaign to better mountain lion conservation in New
Mexico. We gained some achievements in 2006 and 2008 such as the establishment of female
subquotas in some units and the adoption of the mandatory hunter education program.
In July 2010, the New Mexico Department of Game & Fish (NMDGF) reversed that
progress when it proposed a 140% increase (490 to 1,190) in the annual cougar mortality for the
years 2011-15. At the same time it called for an enormous quota increase, it shuttered the public
rulemaking process for mountain lions from a two-year to a four-year cycle. The agency claimed
that it needed to see trends in the lion mortality before the public could again be entrusted with
weighing in on lion quotas.
To justify its new quota system, the NMDGF threw out the 10-year Logan and Sweanor
study (2001), and instead adopted an unpublished, one-year masters student’s study. That study
was conducted in an unusually biologically rich area of New Mexico. NMDGF then took the
highest density estimate produced by that study and applied it statewide.
Our groups lead a vociferous public campaign over a few short months in the summer of
2010. As a result, thousands of people sent correspondence to the Game Commission, and we
earned a steady drumbeat of statewide media. At the hearing, one NMDGF official dismissed
our letters and emails as “robo” mail during public testimony.
Yet, as a result of the public outcry, NMDGF at the eleventh hour reduced its proposed
July quota of 1,190 to 745 in October 2010. The new quota for the next four years represents a
52% increase from 2008-10 figure of 490. The New Mexico Game Commission also instituted
Session 8: Human Dimensions
207
the agency’s recommendation of a 137% increase in the female subquota from 126 to 299. These
increases have no credible biological basis.
In sum, the NMDGF advanced an extremist agenda, which resulted in detrimental
outcomes for everyone, including itself. The agency has damaged its own credibility with the
public.
Montana Case:
In 2009 in Montana, WildEarth Guardians worked with individual houndsmen on its campaign to
maintain ecologically functional populations of mountain lions. We also immediately invited
Montana Fish, Wildlife & Parks (FWP) officials to attend and speak at all of our public forums
which we held across the state in 2009. The outcome of our 2009 campaign: We developed a
strong trust with some houndsmen, and potentially a few agents within FWP. Houndsmen and
state officials presented at a few of the public forums.
While Montana immediately adopted the online hunter education program as a result of
our collective work, we have been dismayed to see quotas—and particularly female subquotas—
increase. In 2008, the statewide quota equaled 411 with a female subquota of 136. By 2010, the
statewide quotas increased to 562 and female subquota to 174, a 37% and 28% increase,
respectively. Like New Mexico, these jumps in the quota are neither gradual nor biologically
justifiable.
In many parts of Montana, the most current understanding of science fails to drive the
decision making process, including mountain lions’ effects on prey and exaggerated anxieties
over human safety. As a result, even a lion researcher who had called for conservation measures
was ignored and even ridiculed at a commission hearing by one commissioner. In Montana, an
Session 8: Human Dimensions
208
open arena for all stakeholders to mountain lion management has not yet been instituted, which
will have detrimental outcomes for large carnivore conservation.
In conclusion, because of our campaign, and because the DOW was willing to adopt a
more robust stakeholder process, several positive steps for mountain lions have been achieved in
Colorado. In 2004, the DOW produced a defensible mountain lion management plan that was
informed by GIS technology and population modeling. The estimated lion population was
deduced, which lead to a 30% reduction in the lion-hunting quota. The reduction in the quota, in
turn, has lead to a reduction in the hunter kill of lions. In the last two years, however, the lion
kill has climbed, which concerns us. Second, the DOW has hired two carnivore biologists to
study mountain lions. Dr. Logan studies the effects of hunting on a lion population on the
Uncompahgre Plateau of western Colorado, while Dr. Mat Alldredge studies human-lion
interactions in the urban-rural interface on the Front Range (Denver-Boulder corridor). Next, the
hunter education program, which found its genesis in the Logan-houndsmen talks of 2004, went
online in 2005. In 2007 the program became mandatory. The result has been a decline of females
in the hunter kill. The program has since been exported to other states. A less tangible
measurement has been increasing public awareness about mountain lions –both on co-existence
issues and on management. Moreover, the media had been engaged throughout the policy
process. The final result in Colorado over time has been a developing trust between the DOW,
hunters, outfitters, and conservationists.
The similar level of trust and communication has not been developed in either New
Mexico or Montana. We urge that state agencies, in the absence of scientific evidence, use the
precautionary principle when setting hunting quotas. Not to do so can damage lion
subpopulations. We also urge all state agencies to begin to broaden their economic portfolio—so
Session 8: Human Dimensions
209
that science, not politics, informs decision-making. Not only is this good policy, it is expedient
given that the numbers of hunters is in decline. The public interest in large carnivore
conservation is increasing and those resources should be tapped to maintain ecologically
functional populations of mountain lions.
LITERATURE CITED
Baker, P. J., B. Luigi, S. Harris, G. Saunders, and P. C. L. White. 2008. Terrestrial carnivores and human food production: impact and management. Mammal Review 38:123-166.
Beier, P. 1991. Cougar Attacks on Humans in the United States and Canada. Wildlife Society Bulletin 19:403-412.
Beier, P. 1992. Cougar Attacks on Humans: An Update and Some Further Reflections. Pages 365-366 in 15th Vertebrate Pest Conference. University of California, Davis.
Collins, C. and R. Kays. 2011. Causes of mortality in North American populations of large- and medium-sized mammals. Animal Conservation DOI: 10.1111/j.1469-1795.2011.00458.x:1-10.
Cougar Management Guidelines. 2005. Cougar Management Guidelines. WildFutures, Bainbridge Island, WA.
Fitzhugh, E. L. 2003. Lessening the Impact of a Puma Attack on a Human.in Seventh Mountain Lion Workshop, Jackson, WY.
Horner, S. M. 2000. Embryo, Not Fossil: Breathing Life into the Public Trust in Wildlife. Land and Water Review 35:23-75.
Jacobson, C., J. F. Organ, D. Decker, G. R. Batcheller, and L. Carpenter. 2010. A Conservation Institution for the 21st Century: Implications for State Wildlife Agencies. Journal of Wildlife Management 74:203-209.
Logan, K. A. and L. L. Sweanor. 2001. Desert puma: evolutionary ecology and conservation of an enduring carnivore. Island Press, Washington, DC.
Schwartz, C. C., S. D. Miller, and M. A. Haroldson. 2003. Grizzly Bear (Ursus arctos).in G. A. Feldhamer, B. C. Thompson, and J. A. Chapman, editors. Wild Mammals of North America: Biology, Management, and Conservation. Johns Hopkins University Press, Baltimore.

Session 8: Human Dimensions
210
U.S. Department of Agriculture - National Agricultural Statistics Service. 2010a. Sheep & Lamb Losses. www.nass.usda.gov.
U.S. Department of Agriculture - National Agricultural Statistics Service. 2010b. Sheep and Goats. http://usda.mannlib.cornell.edu/MannUsda/viewDocumentInfo.do?documentID=1145.
U.S. Department of Agriculture - National Agricultural Statistics Service. 2011. Cattle Death Loss. http://usda.mannlib.cornell.edu/MannUsda/viewDocumentInfo.do?documentID=1625.
Session 8: Human Dimensions
211
An Explanation of Cougar-Related Behaviors and Behavioral Intentions among Northern Arizona Residents
Elizabeth J. Ruther, Oregon Department of Fish & Wildlife, North Willamette Watershed
District, 17330 SE Evelyn St, Clackamas, OR 97015, USA, [email protected] David J. Mattson, U.S. Geological Survey (USGS) Southwest Biological Science Center, P.O.
Box 5614, Northern Arizona University, Flagstaff, AZ 86011, USA, [email protected] (presenter)
Abstract: Management of cougars (Puma concolor) in the American West is typified by conflict among stakeholders that is plausibly rooted in life experiences and worldviews. We used a self-administered mail questionnaire to assess demographics, views of nature, life experiences, cougar-related behaviors, and support for cougar-related policies among 693 permanent residents of forested regions in northern Arizona. Questionnaire responses were the basis for models explaining behaviors and support for policies. We employed a modified version of Kellert’s (1996) schematic of values to assess respondents’ natureviews. Natureviews and life experiences performed far better than demographics alone in explaining behaviors and support for policies. The Utilitarian/Dominionistic natureview had the strongest effect of any variable in six of seven models, and was associated with behaviors involving firearms and opposition to policies that would limit killing cougars. The Humanistic/Moralistic natureview had thematically opposite effects in five models. Sex had the strongest effect of any demographic variable in our best models. Controlling for natureviews, male sex was positively associated with behaviors involving firearms. The degree to which people orientated toward dominance of nature and related lethal behaviors offered a robust explanation for their support of cougar-related policies.
212
Session 9: Harvest
Proceedings of the 10th Mountain Lion Workshop
Cougars: Conservation, Connectivity and Population Management
Session 9: Harvest
213
Assessing Selectivity and Harvest Composition of Cougar Hunters in Wyoming Daniel J. Thompson, Wyoming Game and Fish Department, 260 Buena Vista Dr., Lander, WY
82520, USA; [email protected] (presenter) Charles R. Anderson, Jr., Colorado Division of Wildlife, 711 Independent Avenue,
Grand Junction, CO 81505, USA Abstract: Assessing hunter selectivity and how it relates to sex/age composition of harvested cougars (Puma concolor) is beneficial for evaluating efficacy of management scenarios for statewide management programs. We examined Wyoming cougar harvest data from September 2000 through March 2009 (9 harvest years) to assess potential differences between hunters who reported being selective while hunting and those who reported no selectivity. We also separated harvest by method (i.e., use of dogs, opportunistic, outfitted hunts) to evaluate differences between sex/age structure of harvest depending on method of take and whether hunts were outfitted. The strong majority of successful hunters (89.2 %; n = 1,741) used dogs to harvest cougars versus other methods (n = 175). Hunters using dogs harvested a lower proportion of females (42.7%), than those using other methods (56.0 % female harvest). To further assess selectivity, we analyzed data from hunters using dogs only. Hunters who stated they were selective harvested fewer (31.1 %) and older (mean age = 4.2 yrs) females (P < 0.05) than those who were not selective (51.0% female harvest, mean age = 3.7 yrs) and spent more time hunting (1.9 days annually; P < 0.01) to successfully harvest a cougar. Whether hunts were outfitted or not had no effect on sex/age composition of harvest. Hunting with trained dogs allowed for the most selectivity; however, results suggest that other factors such as harvest vulnerability, weather conditions, and quota status may be as important as hunters’ perspective of selectivity when evaluating composition of cougar harvests. Hunter selectivity, method of take, relative harvest vulnerability, and the impact of differing management regimes (i.e., liberal vs. conservative mortality limits) should be considered when assessing sex/age composition of cougar harvest, and the methods which may be best suited to achieve specific management objectives.
Session 9: Harvest
214
Landscape Context Influences Spatial Population Dynamics: Pumas under Varying Levels of Human-Induced Mortality Jesse R. Newby, Teton Cougar Project, P.O. Box 34, Kelly, WY 83011, USA (presenter) L. Scott Mills, Wildlife Biology Program, Univ. of Montana, Missoula, MT 59812, USA Toni K. Ruth, Hornocker Wildlife Institute/Wildlife Conservation Society, 301 N Wilson
Avenue, Bozeman, MT 59715, USA Daniel H. Pletscher, Wildlife Biology Program, Univ. of Montana, Missoula, MT 59812, USA Howard B. Quigley, Panthera Jaguar Program, 8 W 40th St, 18th Floor, New York, NY 10018,
USA Michael S. Mitchell, Montana Cooperative Wildlife Research Unit, Univ. of Montana, Missoula,
MT 59812, USA Kerry M. Murphy, Bridger-Teton National Forest, 340 N Cache, Jackson, WY 83001, USA Rich DeSimone, Montana Fish, Wildlife & Parks, Helena, MT 59620, USA Abstract: Appreciation of both population spatial structuring and landscape effects on within-population vital rates are well established. However, the effects of landscape context on inter-population vital rates and the consequences for multi-population dynamics are less well known. An understanding of how stressors affect both individual disperser attributes and the contribution of single populations to metapopulation dynamics are of immediate value to basic and applied ecology. Pumas (Puma concolor) provide an example of a carnivore with population characteristics largely driven by inter-population movements, and are susceptible to human-induced source-sink dynamics. Using long-term, detailed data from a high mortality landscape in the Garnet Mountains of western Montana and a relatively secure landscape in the Northern Greater Yellowstone Ecosystem (NGYE), we quantified the contributive roles of the populations. The NGYE puma population depended on inter-population movements for its own growth as well as its ability to make a net contribution to the metapopulation. The Garnet area under heavy hunting pressure was a sink with a declining population until hunting was partially restricted, at which point it became a source with positive intrinsic growth and a 16x increase in emigration. In both systems we examined the spatial and temporal landscape effects on individual dispersal attributes (emigration, dispersal distance, establishment success) of subadult pumas (N=126). Human-induced mortality regimes modulated all three dispersal components, reducing inter-population vital rate for males and females in different ways. Male inter-population exchange was reduced directly through elevated pre- and post-emigration mortality. Indirect effects were more evident for females, which displayed reduced emigration propensity and dispersal distance in high risk landscapes. Human-induced mortality and other landscape effects, acting on inter-population vital rates, will determine the ability of local populations to contribute to other subpopulations. In spatially structured populations these effects will have important consequences for population ecology and management.
Session 9: Harvest
215
Mountain Lions of the Great Basin: Identification of Source-Sink Dynamics using Bayesian Genetic Techniques Alyson M. Andreasen, Program in Ecology, Evolution and Conservation Biology, University of
Nevada, 1664 N. Virginia Street, Stop 314, Reno, Nevada 89557, USA, [email protected] (presenter)
Kelley M. Stewart, Department of Natural Resources and Environmental Sciences, University of
Nevada, 1000 Valley Road, Stop 186, Reno, Nevada 89503, USA [email protected]
William Longland, USDA, Agricultural Research Service, University of Nevada, Reno, 920
Valley Road, Reno, Nevada 89512, USA, [email protected] Jon P. Beckmann, Wildlife Conservation Society, North America Program, 301 N. Willson Ave.,
Bozeman, MT 59715, USA, [email protected] Matthew Forister, Biology Department, University of Nevada, 1664 N. Virginia Street, Stop
314, Reno, Nevada 89557, USA, [email protected] Abstract: An increasing number of demographic studies suggest that mountain lion populations operate as source-sink systems. Failure to understand such population dynamics, especially in hunted populations, could lead to detrimental management decisions if a constant level of harvest is assumed to be sustainable across the entire landscape without considering the role of immigration sustaining populations in different areas. However, in many systems it is not logistically feasible to examine mountain lion movement rates in the field at the scale at which source-sink dynamics operate. Nonetheless, recent advances in multilocus Bayesian genetic techniques allow the estimation of population genetic structure and movement rates necessary to model source-sink systems at large scales. Thirteen microsatellite loci were analyzed for 776 mountain lions using muscle tissue samples from individuals in the Great Basin and the eastern Sierra Nevada mountain range. We used a combination of spatial (TESS software) and non-spatial (STRUCTURE software) model-based Bayesian clustering methods to first identify genetically distinct populations. We then used a recently developed Bayesian multilocus genotyping method (BIMr software) to estimate asymmetrical rates of movement between those sub-populations and identify source and sink populations. We identified two populations at the highest level of genetic structuring with a total of 5 subpopulations in the Great Basin of Nevada and the eastern Sierra Nevada Mountains. Our results indicate that source populations are those under relatively less hunting pressure and comprised of refugia for mountain lions. Results from these types of analyses could be used by managers to create biologically meaningful management boundaries and harvest quotas that take into consideration the amount of immigration sustaining populations in different areas.
Session 9: Harvest
216
Beyond Cougar Source-Sink Management: Distributing Hunt Effort to Preserve Social Stability Richard A. Beausoleil, Washington Department of Fish and Wildlife, 3515 State Highway 97A,
Wenatchee, WA 98801, USA, [email protected] (presenter) Gary M. Koehler: Washington Department of Fish and Wildlife, 2218 Stephanie Brooke,
Wenatchee, WA 98801, USA, [email protected] Abstract: Wildlife agencies use a variety of techniques to regulate cougar (Puma concolor) harvest and achieve management objectives; these include general hunt seasons, limited entry hunts, harvest quotas, and bag limits. These techniques are often executed using a zone management (Logan and Sweanor 2001) and/or source-sink metapopulation approach (Laundré and Clark 2003). Zones incorporate large-scale geographic areas typically made up of multiple game management units (GMU’s) and are designated as cougar population sources (low harvest) or sinks (high harvest). However, we believe it is important to maintain the natural, self-regulating mechanism of territoriality that cougars have evolved through eons of evolution and management should strive to mimic this natural dynamic when implementing hunts. The role of evolution is recognized in ungulate management and helps guide trophy management and quality hunt programs. However, a similar philosophy has not yet been considered for managing carnivores. Just as maintaining mature individuals is important for managing ungulates, maintaining resident adult cougars, which influences reproduction, rates of immigration and emigration, and density, mandates management attention. To avoid altering the natural regulating function of cougar social organization, we advocate a hunt system that preserves social stability. To accomplish this, our philosophy is to equitably distribute harvest across the jurisdiction using a limited entry draw hunt, reducing the hunt zone size to the individual GMU level, and limiting removals to 10% of the GMU’s cougar population. This would avoid excessive removals in selected GMU's where human access is high and cats are most vulnerable. We also propose an increased license fee, comparable to that of other big game species. Benefits to this system may include a stable age structure, maintained or increased agency revenue, more efficient wildlife enforcement, less human conflict, and because older animals would be more plentiful, a quality hunt experience for the hunter.
Session 9: Harvest
217
Comparison of Cougar Survival and Mortality Patterns in Exploited and Quasi-Protected Population Michael L. Wolfe, Dept. of Wildland Resources, 5230 Old Main Hill, Utah State University,
Logan, UT 84322, USA, [email protected] (presenter) David C. Stoner, Dept. of Wildland Resources, 5230 Old Main Hill, Utah State University,
Logan, UT 84322, USA, [email protected] Lise M. Aubry, Dept. of Wildland Resources, 5230 Old Main Hill, Utah State University, Logan,
UT 84322, USA & The Berryman Institute Logan, UT 84322, USA, [email protected]
David M. Choate, School of Life Sciences, University of Nevada, Las Vegas, 4505 Maryland
Parkway, Las Vegas, NV 89154, USA, & The USGS Western Ecological Research Station, Henderson, NV 89074, USA, [email protected]
Abstract: Using information from a 14-year (1996-2009) study of radio-collared animals (n = 139) within a BACI framework, we analyzed cause-specific mortality and survival rates for two Utah cougar (Puma concolor) populations subject to differing levels of exploitation. The Monroe (exploited) and Oquirrh Mountain (semi-protected) populations were located in wildland and peri-urban (population >1 million) settings, respectively. We investigated whether: (1) survival was independent of hunting regime; (2) survival changed either annually or periodically (hunting and non-hunting seasons),; or both; and (3) harvest-specific survival differed by sex. We used known-fate survival analysis to estimate location-, sex-, time-, and harvest-specific survival rates, and Cox Proportional Hazard models to compare the impact of anthropogenic and other causes of mortality (intra-specific strife, malnutrition and injury). Males and females from both locations experienced enhanced survival following relaxation of hunting pressure on the exploited population in 2002. Survival probabilities did not differ seasonally, but males sustained greater declines in survival during the hunting season (January to June) compared to females. Female survival rates between populations were comparable (S = 0.892 ± 0.03 and S = 0.877 ± 0.034, respectively), whereas male survival was lower in both the Oquirrh (S = 0.760 ± 0.085), and Monroe (S = 0.640 ± 0.093) populations. Anthropogenic agency (hunting, poaching, highway mortality and depredation control) accounted for 72.9% and 33.3% of the overall mortality in the Monroe and Oquirrh populations, respectively, but the latter showed a relatively high incidence (30.7% of human-caused losses) of highway mortality. Overall Disease and intra-specific strife were the main drivers of cougar mortality in the Oquirrh population (28.2% and 23.1% respectively), especially among females. These data suggest that human exploitation and other causes of mortality might be additive, but confirmation of this assumption will require formal testing.
Session 9: Harvest
218
Effects of Sport Hunting on Cougar Population, Community, and Landscape Ecology
Robert B. Wielgus, Large Carnivore Conservation Lab, Dept. Natural Resource Sciences,
Washington State University, Pullman, WA 99164-6410, USA, [email protected] (presenter)
Catherine Lambert Koizumi, Hilary S. Cooley, Benjamin T. Maletzke, Jon N. Keehner, Kevin S. White, Dana E. Morrison, and Kaylie Peebles. Large Carnivore Conservation Lab, Dept. Natural Resource Sciences, Washington State University, Pullman, WA 99164-6410, USA
Brian Kertsen, College of Forest Resources, University of Washington, Seattle, WA 98195-2100
Gary M. Koehler and Rich Beausoleil, Washington Department of Fish and Wildlife, 600 Capital
Way North, Olympia, WA 98501-1091 Abstract: Cougars (puma concolor) are managed on the traditional density dependent, compensatory mortality, game management model (same as deer and elk). In population ecology, hunting is believed to result in reduced numbers of cougars and increased female reproductive success, population growth, and sustained yield. In community and landscape ecology, hunting is believed to result in reduced predation on game animals, a decreased “footprint” of cougars, and reduced conflicts with humans. We conducted a series of field experiments from 1998 to 2011 (13 years, 16 papers) in 6 areas of WA to test the traditional game management model for cougars. Increased complaints, livestock depredations, and high predation on mule deer did not correspond with increasing numbers of cougars. Cougars were declining or stable where complaints and livestock depredations were high and were increasing where complaints and depredations were low. High hunting mortality of males resulted in compensatory immigration by males, decreased kitten survival (increased infanticide?), female decline, and male increase – resulting in no net change in total cougars and non-sustainable females. Low hunting mortality of males resulted in compensatory emigration by males, high kitten survival, female increase, and male stability – resulting in no net change and sustainable females. Heavy hunting reduced female population growth by 34%. Females with kittens were the main cause of mule deer declines in heavily hunted areas - because high hunting of males resulted in increased predation on mule deer by females. Females switched from numerous white-tailed deer at low elevations to sparse mule deer at high elevations to avoid potentially infanticidal immigrant males in heavily hunted areas. Only high harvest of females reversed high predation on mule deer. High hunting mortality resulted in a doubling of home range size and overlap (footprint size) for immigrant males. Large home ranges and movements outside a defined study boundary also resulted in a 2-3 X overestimate in population size. Younger animals used human-occupied areas more than older animals. Increased hunting of cougars did not reduce cougar complaints and livestock depredations. Our results suggest that the traditional game management model does not apply to solitary territorial predators such as cougars.
219
Sponsors