Embed Size (px)
DESCRIPTION
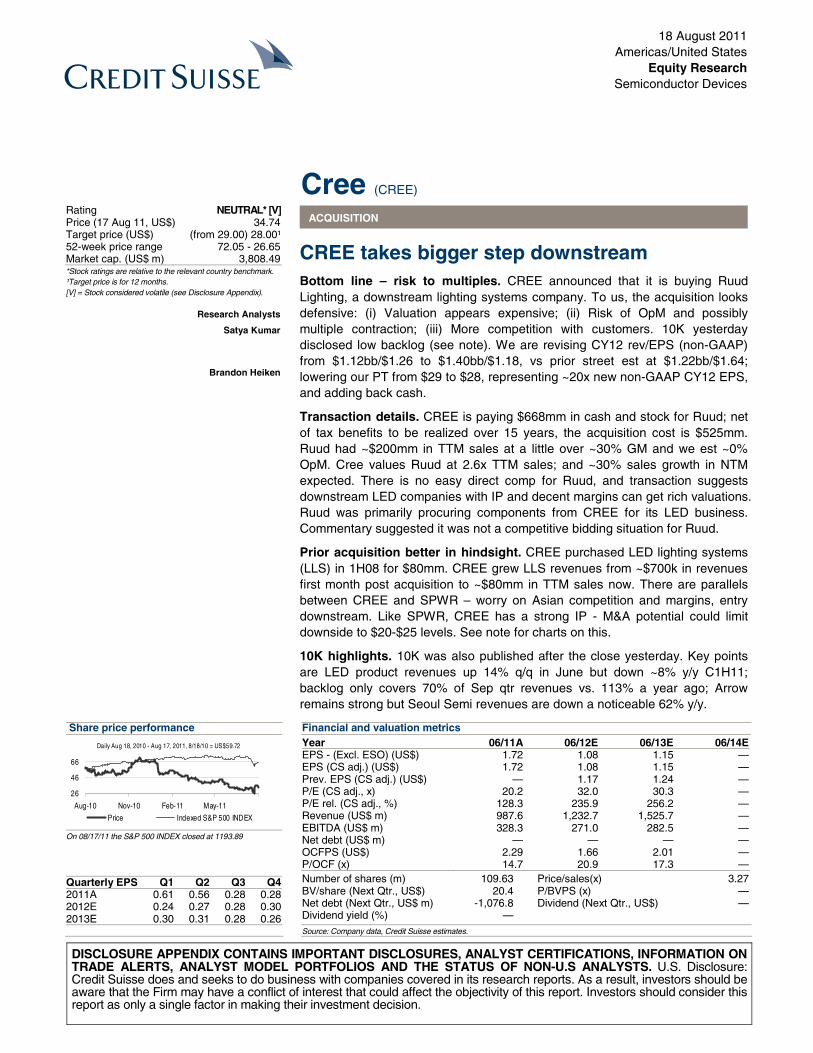
Research Analysts Satya Kumar ACQUISITION Share price performance Aug-10 Nov-10 Feb-11 May-11 Brandon Heiken *Stock ratings are relative to the relevant country benchmark. ¹Target price is for 12 months. [V] = Stock considered volatile (see Disclosure Appendix). Price Indexed S&P 500 INDEX Source: Company data, Credit Suisse estimates. On 08/17/11 the S&P 500 INDEX closed at 1193.89 26 46 66 Daily Aug 18, 2010 - Aug 17, 2011, 8/18/10 = US$59.72
Citation preview
DISCLOSURE APPENDIX CONTAINS IMPORTANT DISCLOSURES, ANALYST CERTIFICATIONS, INFORMATION ON TRADE ALERTS, ANALYST MODEL PORTFOLIOS AND THE STATUS OF NON-U.S ANALYSTS. U.S. Disclosure: Credit Suisse does and seeks to do business with companies covered in its research reports. As a result, investors should be aware that the Firm may have a conflict of interest that could affect the objectivity of this report. Investors should consider this report as only a single factor in making their investment decision.
18 August 2011Americas/United States
Equity ResearchSemiconductor Devices
Cree (CREE) ACQUISITION
CREE takes bigger step downstream Bottom line – risk to multiples. CREE announced that it is buying Ruud Lighting, a downstream lighting systems company. To us, the acquisition looks defensive: (i) Valuation appears expensive; (ii) Risk of OpM and possibly multiple contraction; (iii) More competition with customers. 10K yesterday disclosed low backlog (see note). We are revising CY12 rev/EPS (non-GAAP) from $1.12bb/$1.26 to $1.40bb/$1.18, vs prior street est at $1.22bb/$1.64; lowering our PT from $29 to $28, representing ~20x new non-GAAP CY12 EPS, and adding back cash.
Transaction details. CREE is paying $668mm in cash and stock for Ruud; net of tax benefits to be realized over 15 years, the acquisition cost is $525mm. Ruud had ~$200mm in TTM sales at a little over ~30% GM and we est ~0% OpM. Cree values Ruud at 2.6x TTM sales; and ~30% sales growth in NTM expected. There is no easy direct comp for Ruud, and transaction suggests downstream LED companies with IP and decent margins can get rich valuations. Ruud was primarily procuring components from CREE for its LED business. Commentary suggested it was not a competitive bidding situation for Ruud.
Prior acquisition better in hindsight. CREE purchased LED lighting systems (LLS) in 1H08 for $80mm. CREE grew LLS revenues from ~$700k in revenues first month post acquisition to ~$80mm in TTM sales now. There are parallels between CREE and SPWR – worry on Asian competition and margins, entry downstream. Like SPWR, CREE has a strong IP - M&A potential could limit downside to $20-$25 levels. See note for charts on this.
10K highlights. 10K was also published after the close yesterday. Key points are LED product revenues up 14% q/q in June but down ~8% y/y C1H11; backlog only covers 70% of Sep qtr revenues vs. 113% a year ago; Arrow remains strong but Seoul Semi revenues are down a noticeable 62% y/y.
Share price performance
26
46
66
Aug-10 Nov-10 Feb-11 May-11
Daily Aug 18, 2010 - Aug 17, 2011, 8/18/10 = US$59.72
Price Indexed S&P 500 INDEX
On 08/17/11 the S&P 500 INDEX closed at 1193.89
Quarterly EPS Q1 Q2 Q3 Q4 2011A 0.61 0.56 0.28 0.28 2012E 0.24 0.27 0.28 0.30 2013E 0.30 0.31 0.28 0.26
Financial and valuation metrics
Year 06/11A 06/12E 06/13E 06/14EEPS - (Excl. ESO) (US$) 1.72 1.08 1.15 —EPS (CS adj.) (US$) 1.72 1.08 1.15 —Prev. EPS (CS adj.) (US$) — 1.17 1.24 —P/E (CS adj., x) 20.2 32.0 30.3 —P/E rel. (CS adj., %) 128.3 235.9 256.2 —Revenue (US$ m) 987.6 1,232.7 1,525.7 —EBITDA (US$ m) 328.3 271.0 282.5 —Net debt (US$ m) — — — —OCFPS (US$) 2.29 1.66 2.01 —P/OCF (x) 14.7 20.9 17.3 —
Number of shares (m) 109.63 Price/sales(x) 3.27BV/share (Next Qtr., US$) 20.4 P/BVPS (x) —Net debt (Next Qtr., US$ m) -1,076.8 Dividend (Next Qtr., US$) —Dividend yield (%) —
Source: Company data, Credit Suisse estimates.
Rating NEUTRAL* [V] Price (17 Aug 11, US$) 34.74 Target price (US$) (from 29.00) 28.00¹ 52-week price range 72.05 - 26.65 Market cap. (US$ m) 3,808.49 *Stock ratings are relative to the relevant country benchmark. ¹Target price is for 12 months. [V] = Stock considered volatile (see Disclosure Appendix).
Research Analysts
Satya Kumar
Brandon Heiken
18 August 2011
Cree (CREE) 2
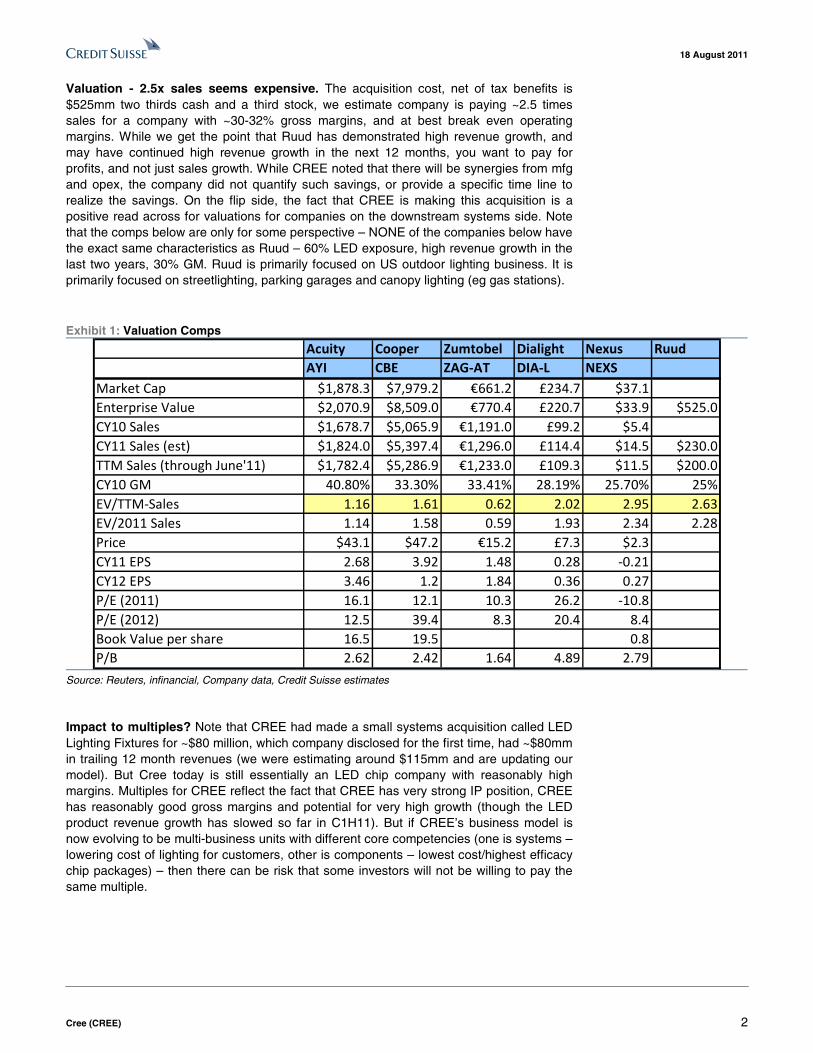
Valuation - 2.5x sales seems expensive. The acquisition cost, net of tax benefits is $525mm two thirds cash and a third stock, we estimate company is paying ~2.5 times sales for a company with ~30-32% gross margins, and at best break even operating margins. While we get the point that Ruud has demonstrated high revenue growth, and may have continued high revenue growth in the next 12 months, you want to pay for profits, and not just sales growth. While CREE noted that there will be synergies from mfg and opex, the company did not quantify such savings, or provide a specific time line to realize the savings. On the flip side, the fact that CREE is making this acquisition is a positive read across for valuations for companies on the downstream systems side. Note that the comps below are only for some perspective – NONE of the companies below have the exact same characteristics as Ruud – 60% LED exposure, high revenue growth in the last two years, 30% GM. Ruud is primarily focused on US outdoor lighting business. It is primarily focused on streetlighting, parking garages and canopy lighting (eg gas stations).
Exhibit 1: Valuation Comps
Acuity Cooper Zumtobel Dialight Nexus RuudAYI CBE ZAG-AT DIA-L NEXS
Market Cap $1,878.3 $7,979.2 �661.2 £234.7 $37.1Enterprise Value $2,070.9 $8,509.0 �770.4 £220.7 $33.9 $525.0CY10 Sales $1,678.7 $5,065.9 �1,191.0 £99.2 $5.4CY11 Sales (est) $1,824.0 $5,397.4 �1,296.0 £114.4 $14.5 $230.0TTM Sales (through June'11) $1,782.4 $5,286.9 �1,233.0 £109.3 $11.5 $200.0CY10 GM 40.80% 33.30% 33.41% 28.19% 25.70% 25%EV/TTM-Sales 1.16 1.61 0.62 2.02 2.95 2.63EV/2011 Sales 1.14 1.58 0.59 1.93 2.34 2.28Price $43.1 $47.2 �15.2 £7.3 $2.3CY11 EPS 2.68 3.92 1.48 0.28 -0.21CY12 EPS 3.46 1.2 1.84 0.36 0.27P/E (2011) 16.1 12.1 10.3 26.2 -10.8P/E (2012) 12.5 39.4 8.3 20.4 8.4Book Value per share 16.5 19.5 0.8P/B 2.62 2.42 1.64 4.89 2.79
Source: Reuters, infinancial, Company data, Credit Suisse estimates
Impact to multiples? Note that CREE had made a small systems acquisition called LED Lighting Fixtures for ~$80 million, which company disclosed for the first time, had ~$80mm in trailing 12 month revenues (we were estimating around $115mm and are updating our model). But Cree today is still essentially an LED chip company with reasonably high margins. Multiples for CREE reflect the fact that CREE has very strong IP position, CREE has reasonably good gross margins and potential for very high growth (though the LED product revenue growth has slowed so far in C1H11). But if CREE’s business model is now evolving to be multi-business units with different core competencies (one is systems – lowering cost of lighting for customers, other is components – lowest cost/highest efficacy chip packages) – then there can be risk that some investors will not be willing to pay the same multiple.
18 August 2011
Cree (CREE) 3
Exhibit 2: Ruud impact to Sep estimates
Mid-Pt of Prior Guidance
Mid-Pt of New Guidance
Implied Contribution from Ruud (Non-GAAP)
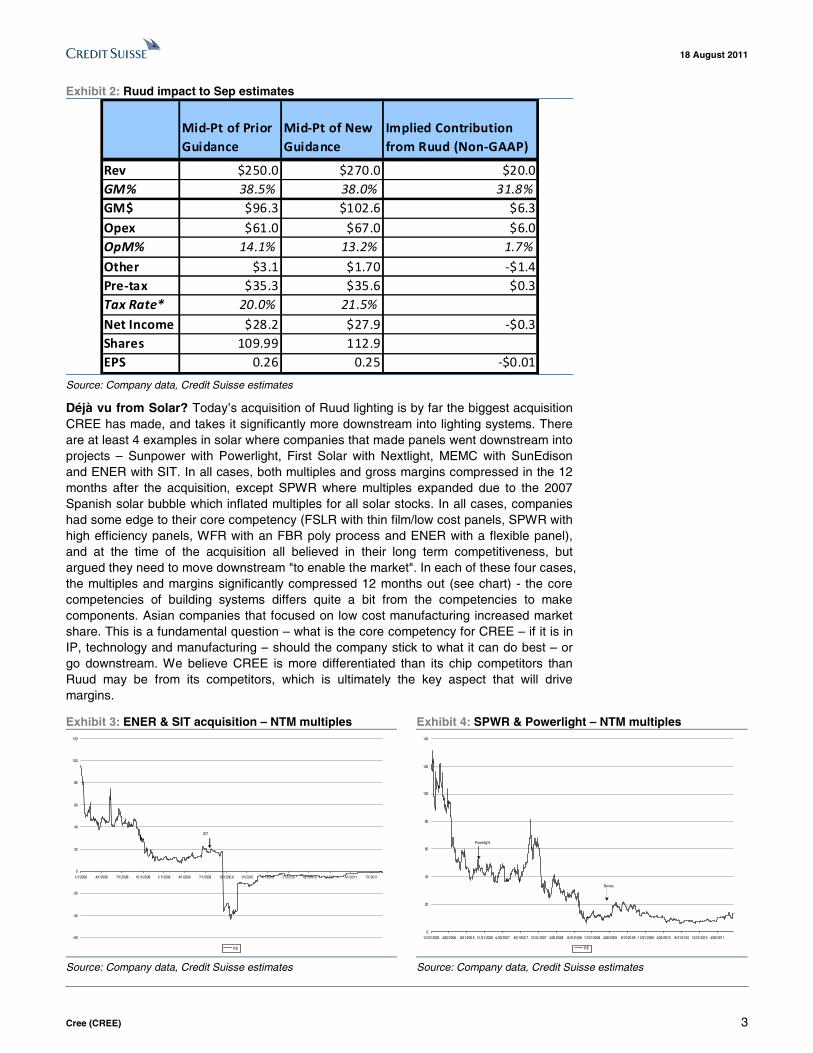
Rev $250.0 $270.0 $20.0GM% 38.5% 38.0% 31.8%GM$ $96.3 $102.6 $6.3Opex $61.0 $67.0 $6.0OpM% 14.1% 13.2% 1.7%Other $3.1 $1.70 -$1.4Pre-tax $35.3 $35.6 $0.3Tax Rate* 20.0% 21.5%Net Income $28.2 $27.9 -$0.3Shares 109.99 112.9EPS 0.26 0.25 -$0.01
Source: Company data, Credit Suisse estimates
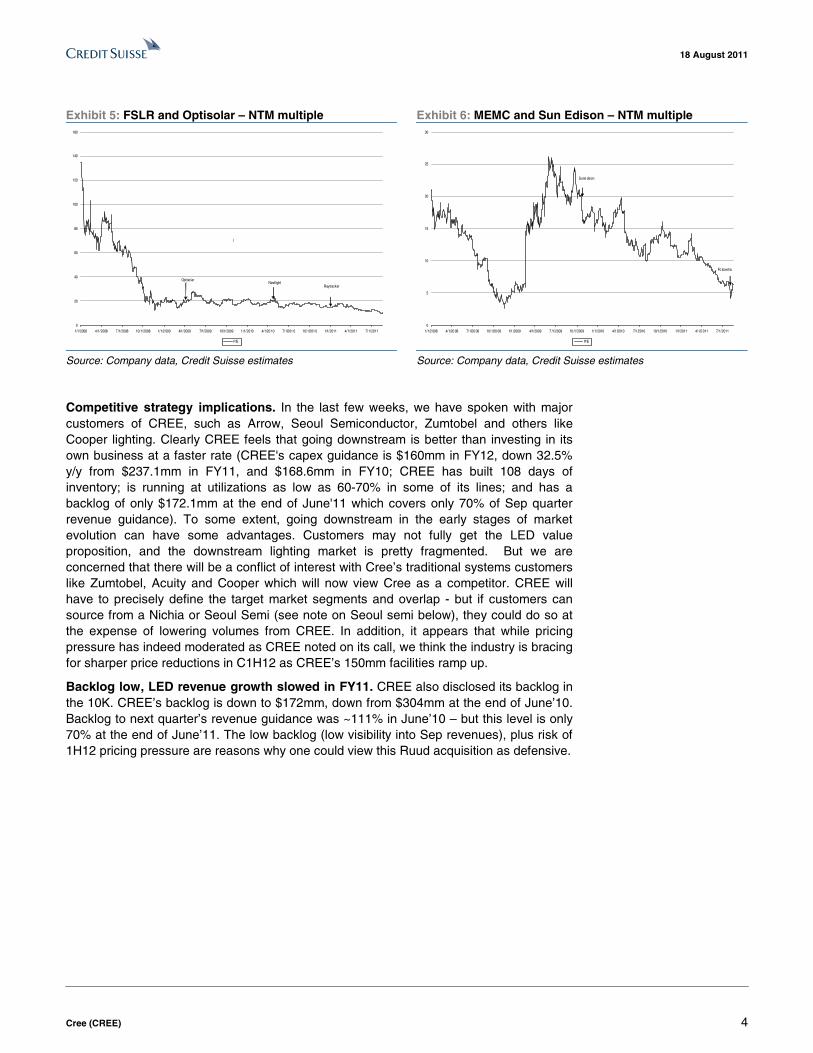
Déjà vu from Solar? Today’s acquisition of Ruud lighting is by far the biggest acquisition CREE has made, and takes it significantly more downstream into lighting systems. There are at least 4 examples in solar where companies that made panels went downstream into projects – Sunpower with Powerlight, First Solar with Nextlight, MEMC with SunEdison and ENER with SIT. In all cases, both multiples and gross margins compressed in the 12 months after the acquisition, except SPWR where multiples expanded due to the 2007 Spanish solar bubble which inflated multiples for all solar stocks. In all cases, companies had some edge to their core competency (FSLR with thin film/low cost panels, SPWR with high efficiency panels, WFR with an FBR poly process and ENER with a flexible panel), and at the time of the acquisition all believed in their long term competitiveness, but argued they need to move downstream "to enable the market". In each of these four cases, the multiples and margins significantly compressed 12 months out (see chart) - the core competencies of building systems differs quite a bit from the competencies to make components. Asian companies that focused on low cost manufacturing increased market share. This is a fundamental question – what is the core competency for CREE – if it is in IP, technology and manufacturing – should the company stick to what it can do best – or go downstream. We believe CREE is more differentiated than its chip competitors than Ruud may be from its competitors, which is ultimately the key aspect that will drive margins.
Exhibit 3: ENER & SIT acquisition – NTM multiples Exhibit 4: SPWR & Powerlight – NTM multiples
-60
-40
-20
0
20
40
60
80
100
120
1/1/2008 4/1/2008 7/1/2008 10 /1/2008 1/1/2009 4/1 /2009 7/1 /2009 10/1 /200 9 1/1/2010 4/1/2010 7/1/2 010 10/1/2 010 1/1/201 1 4/1/2011 7/1/2011
P/E
SIT
0
20
40
60
80
100
120
140
12/31/2005 4/30/2006 8/3 1/200 6 12/31/2006 4 /30/2007 8/3 1/200 7 12/31/2007 4/30 /2008 8/31/2 008 12/31/2008 4/30/2009 8/31/20 09 12/31/2009 4/30 /2010 8/31/2010 12/31/2010 4/30/2011
P/E
Sun ra y
Powerlight
Source: Company data, Credit Suisse estimates Source: Company data, Credit Suisse estimates
18 August 2011
Cree (CREE) 4
Exhibit 5: FSLR and Optisolar – NTM multiple Exhibit 6: MEMC and Sun Edison – NTM multiple
0
20
40
60
80
100
120
140
160
1/1/2008 4/1/2008 7/1/2008 10/1/2008 1/1/2 009 4/1/2009 7/1/2009 10/1/2009 1/1/2010 4/1/20 10 7/1/201 0 10/1/2010 1/1/2011 4/1/2011 7/1/2011
P/E
(
Raytracker
Optiso larNext light
0
5
10
15
20
25
30
1/1/2 008 4/1/20 08 7/1/20 08 10/1/20 08 1/1 /2009 4/1/2009 7 /1/2009 10 /1/2009 1/1/2010 4/1 /2010 7/1 /2010 10/1 /2010 1/1/2011 4/1/2011 7/1/2011
P/E
Fotowotia
Sune dison
Source: Company data, Credit Suisse estimates Source: Company data, Credit Suisse estimates
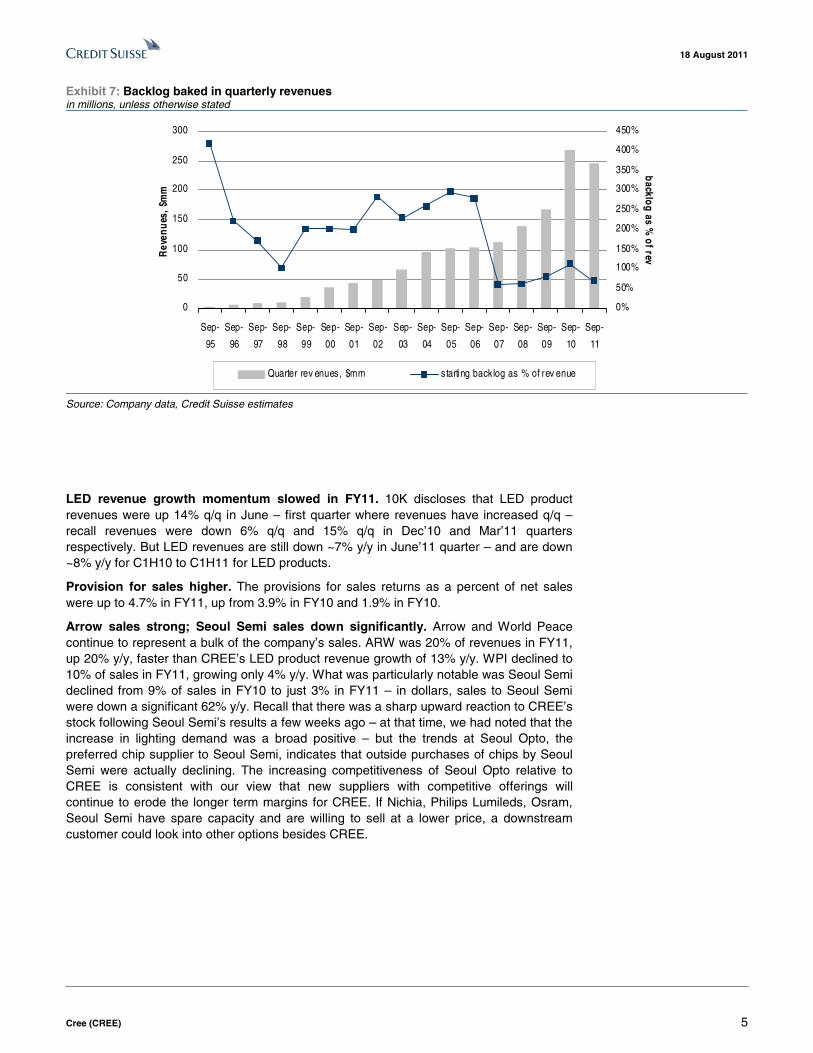
Competitive strategy implications. In the last few weeks, we have spoken with major customers of CREE, such as Arrow, Seoul Semiconductor, Zumtobel and others like Cooper lighting. Clearly CREE feels that going downstream is better than investing in its own business at a faster rate (CREE's capex guidance is $160mm in FY12, down 32.5% y/y from $237.1mm in FY11, and $168.6mm in FY10; CREE has built 108 days of inventory; is running at utilizations as low as 60-70% in some of its lines; and has a backlog of only $172.1mm at the end of June'11 which covers only 70% of Sep quarter revenue guidance). To some extent, going downstream in the early stages of market evolution can have some advantages. Customers may not fully get the LED value proposition, and the downstream lighting market is pretty fragmented. But we are concerned that there will be a conflict of interest with Cree’s traditional systems customers like Zumtobel, Acuity and Cooper which will now view Cree as a competitor. CREE will have to precisely define the target market segments and overlap - but if customers can source from a Nichia or Seoul Semi (see note on Seoul semi below), they could do so at the expense of lowering volumes from CREE. In addition, it appears that while pricing pressure has indeed moderated as CREE noted on its call, we think the industry is bracing for sharper price reductions in C1H12 as CREE’s 150mm facilities ramp up.
Backlog low, LED revenue growth slowed in FY11. CREE also disclosed its backlog in the 10K. CREE’s backlog is down to $172mm, down from $304mm at the end of June’10. Backlog to next quarter’s revenue guidance was ~111% in June’10 – but this level is only 70% at the end of June’11. The low backlog (low visibility into Sep revenues), plus risk of 1H12 pricing pressure are reasons why one could view this Ruud acquisition as defensive.
18 August 2011
Cree (CREE) 5
Exhibit 7: Backlog baked in quarterly revenues in millions, unless otherwise stated
0
50
100
150
200
250
300
Sep-
95
Sep-
96
Sep-
97
Sep-
98
Sep-
99
Sep-
00
Sep-
01
Sep-
02
Sep-
03
Sep-
04
Sep-
05
Sep-
06
Sep-
07
Sep-
08
Sep-
09
Sep-
10
Sep-
11
Rev
enue
s, $
mm
0%
50%
100%
150%
200%
250%
300%
350%
400%
450%
backlog as % of rev
Quarter rev enues, $mm starting backlog as % of rev enue
Source: Company data, Credit Suisse estimates
LED revenue growth momentum slowed in FY11. 10K discloses that LED product revenues were up 14% q/q in June – first quarter where revenues have increased q/q – recall revenues were down 6% q/q and 15% q/q in Dec’10 and Mar’11 quarters respectively. But LED revenues are still down ~7% y/y in June’11 quarter – and are down ~8% y/y for C1H10 to C1H11 for LED products.
Provision for sales higher. The provisions for sales returns as a percent of net sales were up to 4.7% in FY11, up from 3.9% in FY10 and 1.9% in FY10.
Arrow sales strong; Seoul Semi sales down significantly. Arrow and World Peace continue to represent a bulk of the company’s sales. ARW was 20% of revenues in FY11, up 20% y/y, faster than CREE’s LED product revenue growth of 13% y/y. WPI declined to 10% of sales in FY11, growing only 4% y/y. What was particularly notable was Seoul Semi declined from 9% of sales in FY10 to just 3% in FY11 – in dollars, sales to Seoul Semi were down a significant 62% y/y. Recall that there was a sharp upward reaction to CREE’s stock following Seoul Semi’s results a few weeks ago – at that time, we had noted that the increase in lighting demand was a broad positive – but the trends at Seoul Opto, the preferred chip supplier to Seoul Semi, indicates that outside purchases of chips by Seoul Semi were actually declining. The increasing competitiveness of Seoul Opto relative to CREE is consistent with our view that new suppliers with competitive offerings will continue to erode the longer term margins for CREE. If Nichia, Philips Lumileds, Osram, Seoul Semi have spare capacity and are willing to sell at a lower price, a downstream customer could look into other options besides CREE.
18 August 2011
Cree (CREE) 6
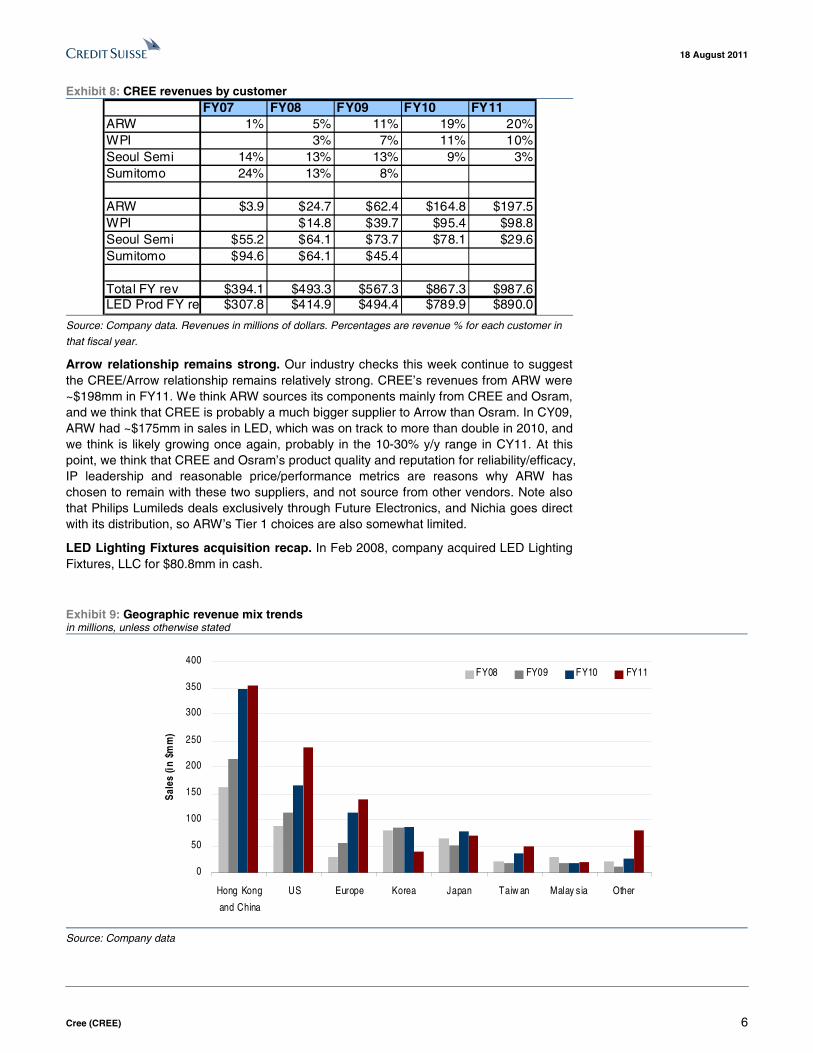
Exhibit 8: CREE revenues by customer FY07 FY08 FY09 FY10 FY11
ARW 1% 5% 11% 19% 20%WPI 3% 7% 11% 10%Seoul Semi 14% 13% 13% 9% 3%Sumitomo 24% 13% 8%
ARW $3.9 $24.7 $62.4 $164.8 $197.5WPI $14.8 $39.7 $95.4 $98.8Seoul Semi $55.2 $64.1 $73.7 $78.1 $29.6Sumitomo $94.6 $64.1 $45.4
Total FY rev $394.1 $493.3 $567.3 $867.3 $987.6LED Prod FY re $307.8 $414.9 $494.4 $789.9 $890.0
Source: Company data. Revenues in millions of dollars. Percentages are revenue % for each customer in
that fiscal year.
Arrow relationship remains strong. Our industry checks this week continue to suggest the CREE/Arrow relationship remains relatively strong. CREE’s revenues from ARW were ~$198mm in FY11. We think ARW sources its components mainly from CREE and Osram, and we think that CREE is probably a much bigger supplier to Arrow than Osram. In CY09, ARW had ~$175mm in sales in LED, which was on track to more than double in 2010, and we think is likely growing once again, probably in the 10-30% y/y range in CY11. At this point, we think that CREE and Osram’s product quality and reputation for reliability/efficacy, IP leadership and reasonable price/performance metrics are reasons why ARW has chosen to remain with these two suppliers, and not source from other vendors. Note also that Philips Lumileds deals exclusively through Future Electronics, and Nichia goes direct with its distribution, so ARW’s Tier 1 choices are also somewhat limited.
LED Lighting Fixtures acquisition recap. In Feb 2008, company acquired LED Lighting Fixtures, LLC for $80.8mm in cash.
Exhibit 9: Geographic revenue mix trends in millions, unless otherwise stated
0
50
100
150
200
250
300
350
400
Hong Kong
and China
US Europe Korea Japan Taiw an Malay sia Other
Sale
s (in
$m
m)
FY08 FY09 FY10 FY11
Source: Company data
18 August 2011
Cree (CREE) 7
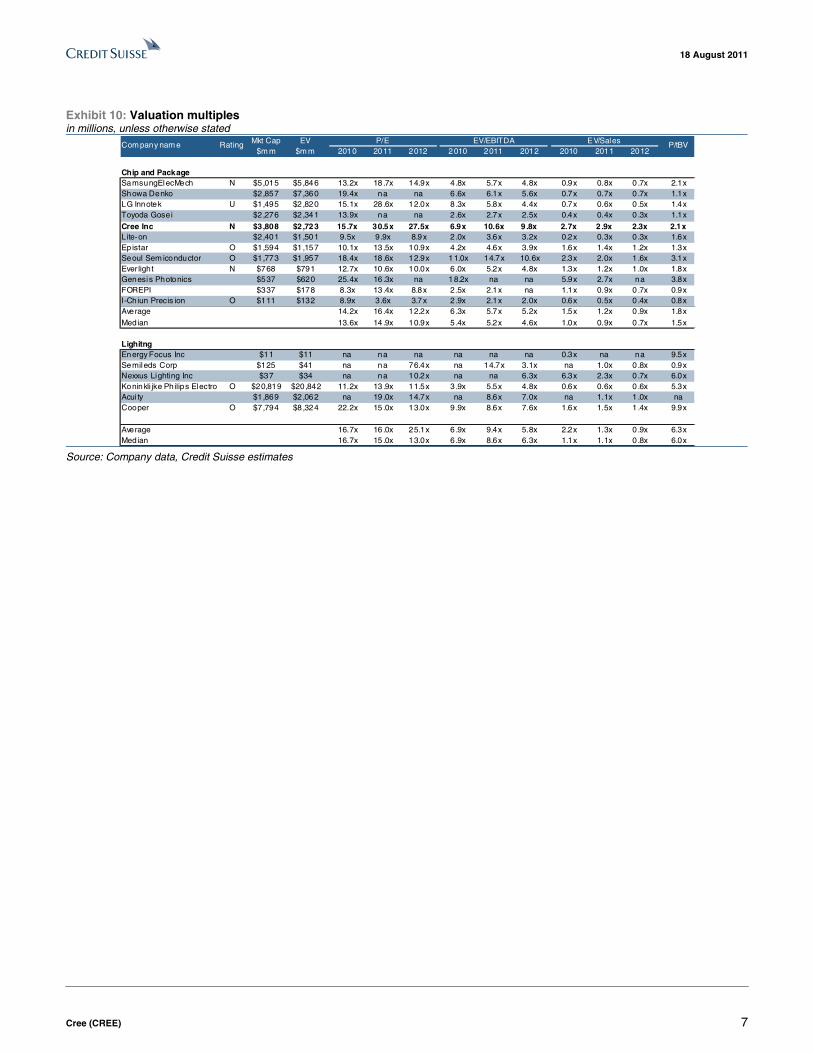
Exhibit 10: Valuation multiples in millions, unless otherwise stated
2010 2011 2012 2010 2011 2012 2010 2011 2012
1 6 7 9 10 11 13 14 15 17 18 19 21Chip and PackageSamsungElecMech N $5,015 $5 ,846 13.2x 18 .7x 14.9x 4 .8x 5.7x 4.8x 0.9x 0.8x 0 .7x 2.1xShowa Denko $2,857 $7 ,360 19.4x na na 6 .6x 6.1x 5.6x 0.7x 0.7x 0 .7x 1.1xLG Innotek U $1,495 $2 ,820 15.1x 28 .6x 12.0x 8 .3x 5.8x 4.4x 0.7x 0.6x 0 .5x 1.4xToyoda Gosei $2,276 $2 ,341 13.9x na na 2 .6x 2.7x 2.5x 0.4x 0.4x 0 .3x 1.1x
Cree Inc N $3,808 $2 ,723 15.7x 30.5x 27.5x 6.9x 10.6x 9 .8x 2.7x 2 .9x 2.3x 2.1xLite-on $2,401 $1 ,501 9.5x 9.9x 8.9x 2 .0x 3.6x 3.2x 0.2x 0.3x 0 .3x 1.6xEp istar O $1,594 $1 ,157 10.1x 13 .5x 10.9x 4 .2x 4.6x 3.9x 1.6x 1.4x 1 .2x 1.3xSeoul Sem iconductor O $1,773 $1 ,957 18.4x 18 .6x 12.9x 11.0x 14.7x 10.6x 2.3x 2.0x 1 .6x 3.1xEver light N $768 $791 12.7x 10 .6x 10.0x 6 .0x 5.2x 4.8x 1.3x 1.2x 1 .0x 1.8xGenesis Photonics $537 $620 25.4x 16 .3x na 18.2x na na 5.9x 2.7x na 3.8xFOREPI $337 $178 8.3x 13 .4x 8.8x 2 .5x 2.1x na 1.1x 0.9x 0 .7x 0.9xI-Chiun Precis ion O $111 $132 8.9x 3.6x 3.7x 2 .9x 2.1x 2.0x 0.6x 0.5x 0 .4x 0.8xAverage 14.2x 16 .4x 12.2x 6 .3x 5.7x 5.2x 1.5x 1.2x 0 .9x 1.8xMedian 13.6x 14 .9x 10.9x 5 .4x 5.2x 4.6x 1.0x 0.9x 0 .7x 1.5x
LighitngEnergy Focus Inc $11 $11 na na na na na na 0.3x na na 9.5xSemileds Corp $125 $41 na na 76.4x na 14.7x 3.1x na 1.0x 0 .8x 0.9xNexxus Lighting Inc $37 $34 na na 10.2x na na 6.3x 6.3x 2.3x 0 .7x 6.0xKoninkli jke Philips Electro O $20,819 $20,842 11.2x 13 .9x 11.5x 3 .9x 5.5x 4.8x 0.6x 0.6x 0 .6x 5.3xAcui ty $1,869 $2 ,062 na 19 .0x 14.7x na 8.6x 7.0x na 1.1x 1 .0x naCooper O $7,794 $8 ,324 22.2x 15 .0x 13.0x 9 .9x 8.6x 7.6x 1.6x 1.5x 1 .4x 9.9x
Average 16.7x 16 .0x 25.1x 6 .9x 9.4x 5.8x 2.2x 1.3x 0 .9x 6.3xMedian 16.7x 15 .0x 13.0x 6 .9x 8.6x 6.3x 1.1x 1.1x 0 .8x 6.0x
P/E EV/EBITDA EV/Sales P/tBVMkt Cap $m m
EV$m m
Com pany nam e Rating
Source: Company data, Credit Suisse estimates
18 Au
gu
st 2011
Cree (C
RE
E)
8
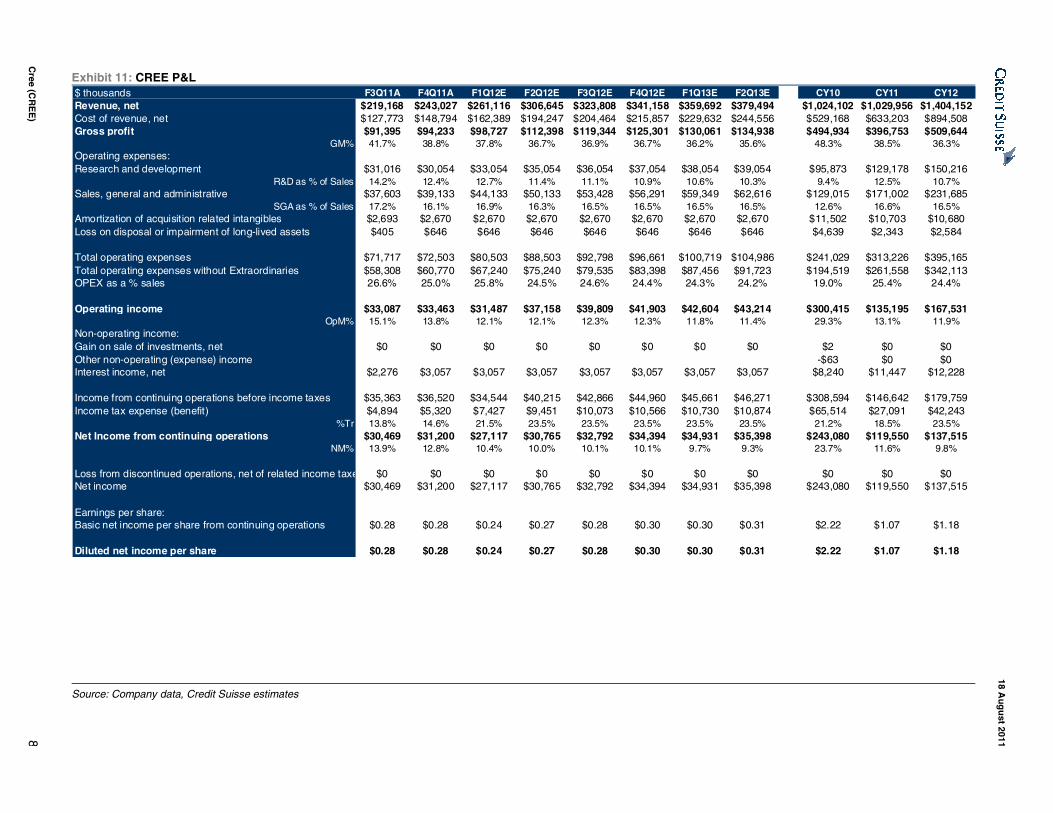
Exhibit 11: CREE P&L $ thousands F3Q11A F4Q11A F1Q12E F2Q12E F3Q12E F4Q12E F1Q13E F2Q13E CY10 CY11 CY12Revenue, net $219,168 $243,027 $261,116 $306,645 $323,808 $341,158 $359,692 $379,494 $1,024,102 $1,029,956 $1,404,152Cost of revenue, net $127,773 $148,794 $162,389 $194,247 $204,464 $215,857 $229,632 $244,556 $529,168 $633,203 $894,508Gross profit $91,395 $94,233 $98,727 $112,398 $119,344 $125,301 $130,061 $134,938 $494,934 $396,753 $509,644
GM% 41.7% 38.8% 37.8% 36.7% 36.9% 36.7% 36.2% 35.6% 48.3% 38.5% 36.3%Operating expenses:Research and development $31,016 $30,054 $33,054 $35,054 $36,054 $37,054 $38,054 $39,054 $95,873 $129,178 $150,216
R&D as % of Sales 14.2% 12.4% 12.7% 11.4% 11.1% 10.9% 10.6% 10.3% 9.4% 12.5% 10.7%Sales, general and administrative $37,603 $39,133 $44,133 $50,133 $53,428 $56,291 $59,349 $62,616 $129,015 $171,002 $231,685
SGA as % of Sales 17.2% 16.1% 16.9% 16.3% 16.5% 16.5% 16.5% 16.5% 12.6% 16.6% 16.5%Amortization of acquisition related intangibles $2,693 $2,670 $2,670 $2,670 $2,670 $2,670 $2,670 $2,670 $11,502 $10,703 $10,680Loss on disposal or impairment of long-lived assets $405 $646 $646 $646 $646 $646 $646 $646 $4,639 $2,343 $2,584
Total operating expenses $71,717 $72,503 $80,503 $88,503 $92,798 $96,661 $100,719 $104,986 $241,029 $313,226 $395,165Total operating expenses without Extraordinaries $58,308 $60,770 $67,240 $75,240 $79,535 $83,398 $87,456 $91,723 $194,519 $261,558 $342,113OPEX as a % sales 26.6% 25.0% 25.8% 24.5% 24.6% 24.4% 24.3% 24.2% 19.0% 25.4% 24.4%
Operating income $33,087 $33,463 $31,487 $37,158 $39,809 $41,903 $42,604 $43,214 $300,415 $135,195 $167,531OpM% 15.1% 13.8% 12.1% 12.1% 12.3% 12.3% 11.8% 11.4% 29.3% 13.1% 11.9%
Non-operating income:Gain on sale of investments, net $0 $0 $0 $0 $0 $0 $0 $0 $2 $0 $0Other non-operating (expense) income -$63 $0 $0Interest income, net $2,276 $3,057 $3,057 $3,057 $3,057 $3,057 $3,057 $3,057 $8,240 $11,447 $12,228
Income from continuing operations before income taxes $35,363 $36,520 $34,544 $40,215 $42,866 $44,960 $45,661 $46,271 $308,594 $146,642 $179,759Income tax expense (benefit) $4,894 $5,320 $7,427 $9,451 $10,073 $10,566 $10,730 $10,874 $65,514 $27,091 $42,243
%Tr 13.8% 14.6% 21.5% 23.5% 23.5% 23.5% 23.5% 23.5% 21.2% 18.5% 23.5%Net Income from continuing operations $30,469 $31,200 $27,117 $30,765 $32,792 $34,394 $34,931 $35,398 $243,080 $119,550 $137,515
NM% 13.9% 12.8% 10.4% 10.0% 10.1% 10.1% 9.7% 9.3% 23.7% 11.6% 9.8%
Loss from discontinued operations, net of related income taxe $0 $0 $0 $0 $0 $0 $0 $0 $0 $0 $0Net income $30,469 $31,200 $27,117 $30,765 $32,792 $34,394 $34,931 $35,398 $243,080 $119,550 $137,515
Earnings per share:Basic net income per share from continuing operations $0.28 $0.28 $0.24 $0.27 $0.28 $0.30 $0.30 $0.31 $2.22 $1.07 $1.18
Diluted net income per share $0.28 $0.28 $0.24 $0.27 $0.28 $0.30 $0.30 $0.31 $2.22 $1.07 $1.18
Source: Company data, Credit Suisse estimates
Cree (C
RE
E)
9
Companies Mentioned (Price as of 18 Aug 11) Acuity Brands, Inc. (AYI, $43.13) Arrow Electronics, Inc. (ARW, $31.85, NEUTRAL, TP $39.00) Cooper Industries PLC (CBE, $47.24, OUTPERFORM, TP $65.00) Cree (CREE, $34.74, NEUTRAL [V], TP $29.00) Energy Conversion Devices (ENER, $0.81, NEUTRAL [V], TP $1.50) Epistar Corporation (2448.TW, NT$54.00, OUTPERFORM [V], TP NT$88.00) Everlight Electronics Co Ltd (2393.TW, NT$50.80, NEUTRAL, TP NT$69.00) First Solar (FSLR, $99.46, NEUTRAL, TP $135.00) Formosa EPI (3061.TW) Genesis Photonics (3383.TW) Koninklijke Philips Electronics (PHG.N) LG Innotek (011070.KS, W75,400, UNDERPERFORM [V], TP W72,000) Lite-On Technology Corp (2301.TW, NT$28.85) MEMC Electronic Materials Inc. (WFR, $6.40, RESTRICTED [V]) Nichias (5393, ¥453) Samsung Electro-Mechanics (009150.KS, W66,600, NEUTRAL, TP W95,000) Sanan Optoelectonics (6007033.SS) SemiLEDs (LEDS) Seoul Semiconductor Co Ltd (046890.KQ, W30,500, OUTPERFORM [V], TP W40,000) Showa Denko (4004.T) Sumitomo Corp (8053, ¥975, OUTPERFORM, TP ¥1,300, OVERWEIGHT) SunPower Corp. (SPWRA, $15.57, NEUTRAL [V], TP $17.00) World Peace (2416.TW) Zumtobel (ZUMV.VI)
Disclosure Appendix
Important Global Disclosures Satya Kumar & Brandon Heiken each certify, with respect to the companies or securities that he or she analyzes, that (1) the views expressed in this report accurately reflect his or her personal views about all of the subject companies and securities and (2) no part of his or her compensation was, is or will be directly or indirectly related to the specific recommendations or views expressed in this report.
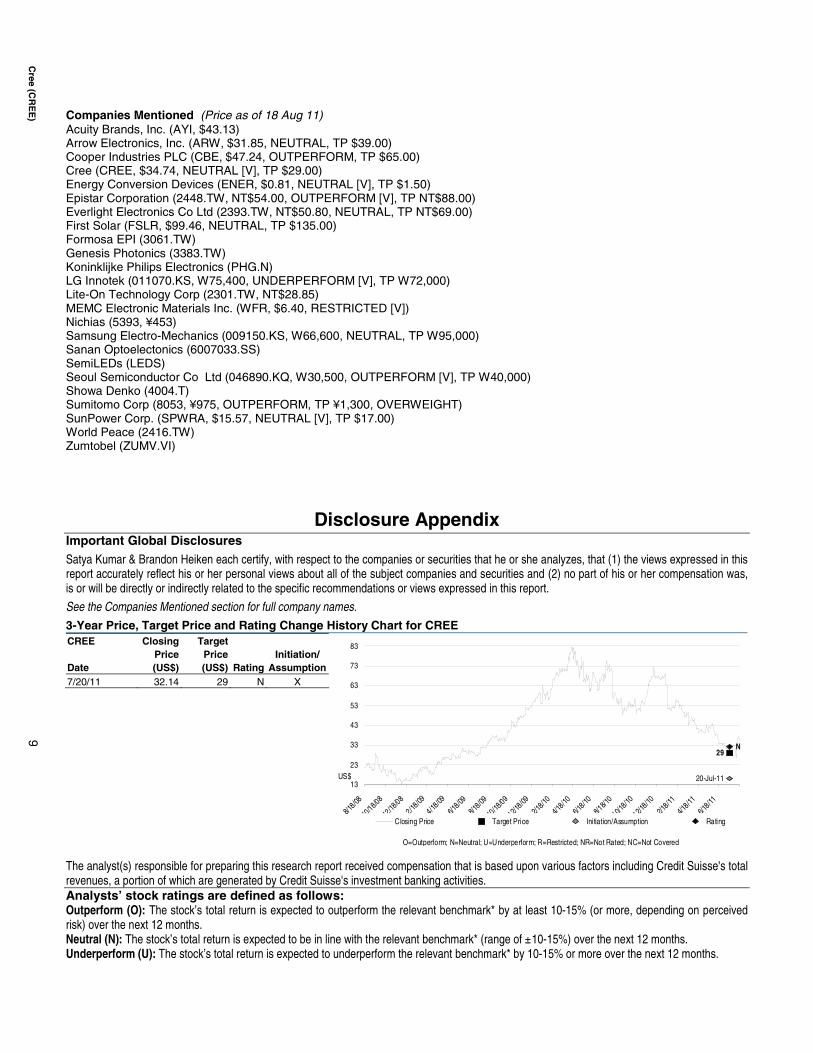
See the Companies Mentioned section for full company names. 3-Year Price, Target Price and Rating Change History Chart for CREE CREE Closing
Price Target
Price
Initiation/ Date (US$) (US$) Rating Assumption 7/20/11 32.14 29 N X
29
20-Jul-11
N
13
23
33
43
53
63
73
83
8/18/08
10/18/08
12/18
/08
2/18/09
4/18/09
6/18/09
8/18/09
10/18
/09
12/18/09
2/18/10
4/18/10
6/18/10
8/18/1
0
10/18/10
12/18/10
2/18/11
4/18/11
6/18/11
Closing Price Target Price Initiation/Assumption Rating
US$
O=Outperform; N=Neutral; U=Underperform; R=Restricted; NR=Not Rated; NC=Not Covered
The analyst(s) responsible for preparing this research report received compensation that is based upon various factors including Credit Suisse's total revenues, a portion of which are generated by Credit Suisse's investment banking activities. Analysts’ stock ratings are defined as follows: Outperform (O): The stock’s total return is expected to outperform the relevant benchmark* by at least 10-15% (or more, depending on perceived risk) over the next 12 months. Neutral (N): The stock’s total return is expected to be in line with the relevant benchmark* (range of ±10-15%) over the next 12 months. Underperform (U): The stock’s total return is expected to underperform the relevant benchmark* by 10-15% or more over the next 12 months.
Cree (C
RE
E)
10
*Relevant benchmark by region: As of 29th May 2009, Australia, New Zealand, U.S. and Canadian ratings are based on (1) a stock’s absolute total return potential to its current share price and (2) the relative attractiveness of a stock’s total return potential within an analyst’s coverage universe**, with Outperforms representing the most attractive, Neutrals the less attractive, and Underperforms the least attractive investment opportunities. Some U.S. and Canadian ratings may fall outside the absolute total return ranges defined above, depending on market conditions and industry factors. For Latin American, Japanese, and non-Japan Asia stocks, ratings are based on a stock’s total return relative to the average total return of the relevant country or regional benchmark; for European stocks, ratings are based on a stock’s total return relative to the analyst's coverage universe**. For Australian and New Zealand stocks, 12-month rolling yield is incorporated in the absolute total return calculation and a 15% and a 7.5% threshold replace the 10-15% level in the Outperform and Underperform stock rating definitions, respectively. The 15% and 7.5% thresholds replace the +10-15% and -10-15% levels in the Neutral stock rating definition, respectively. **An analyst's coverage universe consists of all companies covered by the analyst within the relevant sector. Restricted (R): In certain circumstances, Credit Suisse policy and/or applicable law and regulations preclude certain types of communications, including an investment recommendation, during the course of Credit Suisse's engagement in an investment banking transaction and in certain other circumstances. Volatility Indicator [V]: A stock is defined as volatile if the stock price has moved up or down by 20% or more in a month in at least 8 of the past 24 months or the analyst expects significant volatility going forward.
Analysts’ coverage universe weightings are distinct from analysts’ stock ratings and are based on the expected performance of an analyst’s coverage universe* versus the relevant broad market benchmark**: Overweight: Industry expected to outperform the relevant broad market benchmark over the next 12 months. Market Weight: Industry expected to perform in-line with the relevant broad market benchmark over the next 12 months. Underweight: Industry expected to underperform the relevant broad market benchmark over the next 12 months. *An analyst’s coverage universe consists of all companies covered by the analyst within the relevant sector. **The broad market benchmark is based on the expected return of the local market index (e.g., the S&P 500 in the U.S.) over the next 12 months. Credit Suisse’s distribution of stock ratings (and banking clients) is:
Global Ratings Distribution Outperform/Buy* 48% (62% banking clients) Neutral/Hold* 39% (57% banking clients) Underperform/Sell* 10% (51% banking clients) Restricted 2%
*For purposes of the NYSE and NASD ratings distribution disclosure requirements, our stock ratings of Outperform, Neutral, and Underperform most closely correspond to Buy, Hold, and Sell, respectively; however, the meanings are not the same, as our stock ratings are determined on a relative basis. (Please refer to definitions above.) An investor's decision to buy or sell a security should be based on investment objectives, current holdings, and other individual factors.
Credit Suisse’s policy is to update research reports as it deems appropriate, based on developments with the subject company, the sector or the market that may have a material impact on the research views or opinions stated herein.
Credit Suisse's policy is only to publish investment research that is impartial, independent, clear, fair and not misleading. For more detail please refer to Credit Suisse's Policies for Managing Conflicts of Interest in connection with Investment Research: http://www.csfb.com/research-and-analytics/disclaimer/managing_conflicts_disclaimer.html
Credit Suisse does not provide any tax advice. Any statement herein regarding any US federal tax is not intended or written to be used, and cannot be used, by any taxpayer for the purposes of avoiding any penalties.
See the Companies Mentioned section for full company names. Price Target: (12 months) for (CREE) Method: We are using a price to earnings valuation method for CREE. Our target price of $28 represents an industry premium ~20x CY12 EPS, adjusted for net cash. We are using an industry premium due to CREE's premium margins from its technological advantages. Risks: Risks to our target price of $28 for CREE are: (i) LED lighting adoption occurs more slowly than anticipated; (ii) government subsidies for consumers of LED lighting fail to materialize; (iii) cost reduction efforts are unsuccessful or less successful than expected; (iv) prices fall more rapidly than expected; (v) China subsidies for MOCVD equipment continue longer than expected fueling more oversupply and price declines of LED chips; (vi) CREE's level of innovation stagnates; (vii) other lighting technologies improve and out compete LED lighting; and (viii) currency risk. Please refer to the firm's disclosure website at www.credit-suisse.com/researchdisclosures for the definitions of abbreviations typically used in the target price method and risk sections.
See the Companies Mentioned section for full company names. The subject company (CREE) currently is, or was during the 12-month period preceding the date of distribution of this report, a client of Credit Suisse. Credit Suisse provided investment banking services to the subject company (CREE) within the past 12 months. Credit Suisse expects to receive or intends to seek investment banking related compensation from the subject company (CREE) within the next 3 months. As of the date of this report, Credit Suisse Securities (USA) LLC makes a market in the securities of the subject company (CREE). Important Regional Disclosures Singapore recipients should contact a Singapore financial adviser for any matters arising from this research report.
Cree (C
RE
E)
11
The analyst(s) involved in the preparation of this report have not visited the material operations of the subject company (CREE) within the past 12 months.
Restrictions on certain Canadian securities are indicated by the following abbreviations: NVS--Non-Voting shares; RVS--Restricted Voting Shares; SVS--Subordinate Voting Shares. Individuals receiving this report from a Canadian investment dealer that is not affiliated with Credit Suisse should be advised that this report may not contain regulatory disclosures the non-affiliated Canadian investment dealer would be required to make if this were its own report. For Credit Suisse Securities (Canada), Inc.'s policies and procedures regarding the dissemination of equity research, please visit http://www.csfb.com/legal_terms/canada_research_policy.shtml.
As of the date of this report, Credit Suisse acts as a market maker or liquidity provider in the equities securities that are the subject of this report.
Principal is not guaranteed in the case of equities because equity prices are variable. Commission is the commission rate or the amount agreed with a customer when setting up an account or at anytime after that.
CS may have issued a Trade Alert regarding this security. Trade Alerts are short term trading opportunities identified by an analyst on the basis of market events and catalysts, while stock ratings reflect an analyst's investment recommendations based on expected total return over a 12-month period relative to the relevant coverage universe. Because Trade Alerts and stock ratings reflect different assumptions and analytical methods, Trade Alerts may differ directionally from the analyst's stock rating. The author(s) of this report maintains a CS Model Portfolio that he/she regularly adjusts. The security or securities discussed in this report may be a component of the CS Model Portfolio and subject to such adjustments (which, given the composition of the CS Model Portfolio as a whole, may differ from the recommendation in this report, as well as opportunities or strategies identified in Trading Alerts concerning the same security). The CS Model Portfolio and important disclosures about it are available at www.credit-suisse.com/ti. Taiwanese Disclosures: Reports written by Taiwan-based analysts on non-Taiwan listed companies are not considered recommendations to buy or sell securities under Taiwan Stock Exchange Operational Regulations Governing Securities Firms Recommending Trades in Securities to Customers.
To the extent this is a report authored in whole or in part by a non-U.S. analyst and is made available in the U.S., the following are important disclosures regarding any non-U.S. analyst contributors: The non-U.S. research analysts listed below (if any) are not registered/qualified as research analysts with FINRA. The non-U.S. research analysts listed below may not be associated persons of CSSU and therefore may not be subject to the NASD Rule 2711 and NYSE Rule 472 restrictions on communications with a subject company, public appearances and trading securities held by a research analyst account. For Credit Suisse disclosure information on other companies mentioned in this report, please visit the website at www.credit-suisse.com/researchdisclosures or call +1 (877) 291-2683. Disclaimers continue on next page.
18 August 2011Americas/United States
Equity Research
SCREE08182011_v3.doc
This report is not directed to, or intended for distribution to or use by, any person or entity who is a citizen or resident of or located in any locality, state, country or other jurisdiction where such distribution, publication, availability or use would be contrary to law or regulation or which would subject Credit Suisse AG, the Swiss bank, or its subsidiaries or its affiliates (“CS”) to any registration or licensing requirement within such jurisdiction. All material presented in this report, unless specifically indicated otherwise, is under copyright to CS. None of the material, nor its content, nor any copy of it, may be altered in any way, transmitted to, copied or distributed to any other party, without the prior express written permission of CS. All trademarks, service marks and logos used in this report are trademarks or service marks or registered trademarks or service marks of CS or its affiliates. The information, tools and material presented in this report are provided to you for information purposes only and are not to be used or considered as an offer or the solicitation of an offer to sell or to buy or subscribe for securities or other financial instruments. CS may not have taken any steps to ensure that the securities referred to in this report are suitable for any particular investor. CS will not treat recipients as its customers by virtue of their receiving the report. The investments or services contained or referred to in this report may not be suitable for you and it is recommended that you consult an independent investment advisor if you are in doubt about such investments or investment services. Nothing in this report constitutes investment, legal, accounting or tax advice or a representation that any investment or strategy is suitable or appropriate to your individual circumstances or otherwise constitutes a personal recommendation to you. CS does not offer advice on the tax consequences of investment and you are advised to contact an independent tax adviser. Please note in particular that the bases and levels of taxation may change. CS believes the information and opinions in the Disclosure Appendix of this report are accurate and complete. Information and opinions presented in the other sections of the report were obtained or derived from sources CS believes are reliable, but CS makes no representations as to their accuracy or completeness. Additional information is available upon request. CS accepts no liability for loss arising from the use of the material presented in this report, except that this exclusion of liability does not apply to the extent that liability arises under specific statutes or regulations applicable to CS. This report is not to be relied upon in substitution for the exercise of independent judgment. CS may have issued, and may in the future issue, a trading call regarding this security. Trading calls are short term trading opportunities based on market events and catalysts, while stock ratings reflect investment recommendations based on expected total return over a 12-month period as defined in the disclosure section. Because trading calls and stock ratings reflect different assumptions and analytical methods, trading calls may differ directionally from the stock rating. In addition, CS may have issued, and may in the future issue, other reports that are inconsistent with, and reach different conclusions from, the information presented in this report. Those reports reflect the different assumptions, views and analytical methods of the analysts who prepared them and CS is under no obligation to ensure that such other reports are brought to the attention of any recipient of this report. CS is involved in many businesses that relate to companies mentioned in this report. These businesses include specialized trading, risk arbitrage, market making, and other proprietary trading. Past performance should not be taken as an indication or guarantee of future performance, and no representation or warranty, express or implied, is made regarding future performance. Information, opinions and estimates contained in this report reflect a judgement at its original date of publication by CS and are subject to change without notice. The price, value of and income from any of the securities or financial instruments mentioned in this report can fall as well as rise. The value of securities and financial instruments is subject to exchange rate fluctuation that may have a positive or adverse effect on the price or income of such securities or financial instruments. Investors in securities such as ADR’s, the values of which are influenced by currency volatility, effectively assume this risk. Structured securities are complex instruments, typically involve a high degree of risk and are intended for sale only to sophisticated investors who are capable of understanding and assuming the risks involved. The market value of any structured security may be affected by changes in economic, financial and political factors (including, but not limited to, spot and forward interest and exchange rates), time to maturity, market conditions and volatility, and the credit quality of any issuer or reference issuer. Any investor interested in purchasing a structured product should conduct their own investigation and analysis of the product and consult with their own professional advisers as to the risks involved in making such a purchase. Some investments discussed in this report have a high level of volatility. High volatility investments may experience sudden and large falls in their value causing losses when that investment is realised. Those losses may equal your original investment. Indeed, in the case of some investments the potential losses may exceed the amount of initial investment, in such circumstances you may be required to pay more money to support those losses. Income yields from investments may fluctuate and, in consequence, initial capital paid to make the investment may be used as part of that income yield. Some investments may not be readily realisable and it may be difficult to sell or realise those investments, similarly it may prove difficult for you to obtain reliable information about the value, or risks, to which such an investment is exposed. This report may provide the addresses of, or contain hyperlinks to, websites. Except to the extent to which the report refers to website material of CS, CS has not reviewed the linked site and takes no responsibility for the content contained therein. Such address or hyperlink (including addresses or hyperlinks to CS’s own website material) is provided solely for your convenience and information and the content of the linked site does not in any way form part of this document. Accessing such website or following such link through this report or CS’s website shall be at your own risk. This report is issued and distributed in Europe (except Switzerland) by Credit Suisse Securities (Europe) Limited, One Cabot Square, London E14 4QJ, England, which is regulated in the United Kingdom by The Financial Services Authority (“FSA”). This report is being distributed in Germany by Credit Suisse Securities (Europe) Limited Niederlassung Frankfurt am Main regulated by the Bundesanstalt fuer Finanzdienstleistungsaufsicht ("BaFin"). This report is being distributed in the United States by Credit Suisse Securities (USA) LLC ; in Switzerland by Credit Suisse AG; in Canada by Credit Suisse Securities (Canada), Inc.; in Brazil by Banco de Investimentos Credit Suisse (Brasil) S.A. or its affiliates; in Mexico by Banco Credit Suisse (México), S.A. (transactions related to the securities mentioned in this report will only be effected in compliance with applicable regulation); in Japan by Credit Suisse Securities (Japan) Limited, Financial Instrument Firm, Director-General of Kanto Local Finance Bureau (Kinsho) No. 66, a member of Japan Securities Dealers Association, The Financial Futures Association of Japan, Japan Securities Investment Advisers Association, Type II Financial Instruments Firms Association; elsewhere in Asia/Pacific by whichever of the following is the appropriately authorised entity in the relevant jurisdiction: Credit Suisse (Hong Kong) Limited, Credit Suisse Equities (Australia) Limited , Credit Suisse Securities (Thailand) Limited, Credit Suisse Securities (Malaysia) Sdn Bhd, Credit Suisse AG, Singapore Branch, Credit Suisse Securities (India) Private Limited regulated by the Securities and Exchange Board of India (registration Nos. INB230970637; INF230970637; INB010970631; INF010970631), having registered address at 9th Floor, Ceejay House,Dr.A.B. Road, Worli, Mumbai - 18, India, T- +91-22 6777 3777, Credit Suisse Securities (Europe) Limited, Seoul Branch, Credit Suisse AG, Taipei Securities Branch, PT Credit Suisse Securities Indonesia, Credit Suisse Securities (Philippines ) Inc., and elsewhere in the world by the relevant authorised affiliate of the above. Research on Taiwanese securities produced by Credit Suisse AG, Taipei Securities Branch has been prepared by a registered Senior Business Person. Research provided to residents of Malaysia is authorised by the Head of Research for Credit Suisse Securities (Malaysia) Sdn. Bhd., to whom they should direct any queries on +603 2723 2020. In jurisdictions where CS is not already registered or licensed to trade in securities, transactions will only be effected in accordance with applicable securities legislation, which will vary from jurisdiction to jurisdiction and may require that the trade be made in accordance with applicable exemptions from registration or licensing requirements. Non-U.S. customers wishing to effect a transaction should contact a CS entity in their local jurisdiction unless governing law permits otherwise. U.S. customers wishing to effect a transaction should do so only by contacting a representative at Credit Suisse Securities (USA) LLC in the U.S. Please note that this report was originally prepared and issued by CS for distribution to their market professional and institutional investor customers. Recipients who are not market professional or institutional investor customers of CS should seek the advice of their independent financial advisor prior to taking any investment decision based on this report or for any necessary explanation of its contents. This research may relate to investments or services of a person outside of the UK or to other matters which are not regulated by the FSA or in respect of which the protections of the FSA for private customers and/or the UK compensation scheme may not be available, and further details as to where this may be the case are available upon request in respect of this report. Any Nielsen Media Research material contained in this report represents Nielsen Media Research's estimates and does not represent facts. NMR has neither reviewed nor approved this report and/or any of the statements made herein. If this report is being distributed by a financial institution other than Credit Suisse AG, or its affiliates, that financial institution is solely responsible for distribution. Clients of that institution should contact that institution to effect a transaction in the securities mentioned in this report or require further information. This report does not constitute investment advice by Credit Suisse to the clients of the distributing financial institution, and neither Credit Suisse AG, its affiliates, and their respective officers, directors and employees accept any liability whatsoever for any direct or consequential loss arising from their use of this report or its content. Copyright 2011 CREDIT SUISSE AG and/or its affiliates. All rights reserved.
CREDIT SUISSE SECURITIES (USA) LLC United States of America: