Embed Size (px)
Citation preview
11-16 July, 1999 © 2001 Earthworks Environment & Resources Ltd. All Rights Reserved 1
Post-Processing Geostatistical Realisations - the Spillpoint
http://www.sorviodvnvm.co.ukPresented at SEG Development & Production Forum,
11-16th July 1999, Kananaskis, Calgary, Canada

11-16 July, 1999 © 2001 Earthworks Environment & Resources Ltd. All Rights Reserved 2
Prospect Generation
• Interpret 2D seismic - horizon and faults
• Map TWT
• Map Stacking Velocity
• Depth Convert
• Find lowest closing contour
• Report volumes
• Propose well location

11-16 July, 1999 © 2001 Earthworks Environment & Resources Ltd. All Rights Reserved 3
Variograms
Stacking Velocity Variogram
0
500
1000
1500
2000
2500
3000
3500
4000
0 10000 20000 30000 40000 50000
Separation (m )V
aria
bili
ty (
m/s
^2)
Seismic Horizon Time Variogram
0
1000
2000
3000
4000
5000
6000
7000
8000
9000
10000
0 5000 10000 15000 20000 25000 30000
Separation (m )
Var
iab
ility
(m
s^2)

11-16 July, 1999 © 2001 Earthworks Environment & Resources Ltd. All Rights Reserved 4
Observed VariogramsTime Velocity Depth
X =

11-16 July, 1999 © 2001 Earthworks Environment & Resources Ltd. All Rights Reserved 5
Observed VariogramsProspect Analysis
• Spillpoint : 1844 m
• Volume :882.2 x 10⁶ m3
• Area : 34.7 x 10⁶ m2
• Thickness: 25.4 m
• Prognosis : 1775 m
• Connection: 100%?

11-16 July, 1999 © 2001 Earthworks Environment & Resources Ltd. All Rights Reserved 6
Observed VariogramsConditional Simulation/Spillpoint

11-16 July, 1999 © 2001 Earthworks Environment & Resources Ltd. All Rights Reserved 7
Observed VariogramsIsoprobability Map/GRV Curve
• Spillpoint : 1834 m
• Volume :717.3 x 10⁶ m3
• Area : 23.1 x 10⁶ m2
• Thickness: 30.4 m
• Prognosis : 1776 m
• Connection: 79%GRV Distribution (Observed Variogram)
0%10%
20%30%40%50%
60%70%80%
90%100%
0 500 1000 1500 2000
GRV (m ^3 x 10^6)
Cu
mu
lati
ve P
rob
abili
ty (
%)

11-16 July, 1999 © 2001 Earthworks Environment & Resources Ltd. All Rights Reserved 8
Observed VariogramsIsoprobability Map/GRV Curve (all)
• Spillpoint : 1834 m
• Volume :791.5 x 10⁶ m3
• Area : 25.8 x 10⁶ m2
• Thickness: 30.1 m
• Prognosis : 1776 m
• Connection: 79%GRV Distribution (Observed Variogram)
0%10%
20%30%40%50%
60%70%80%
90%100%
0 500 1000 1500 2000
GRV (m ^3 x 10^6)
Cu
mu
lati
ve P
rob
abili
ty (
%)

11-16 July, 1999 © 2001 Earthworks Environment & Resources Ltd. All Rights Reserved 9
Variogram Problems
• Horizon time data - Gaussian model variogram?– Parabolic variogram behaviour at origin
– Horizon times continuous surfaces?
– Fresnel zone spatial averaging - “support effect”
• Stacking velocity data is noisy– Large nugget component on variogram
– Expect Stacking Velocities to be noisy
– Nugget inferred to be random error
– Filter nugget during kriging or simulation

11-16 July, 1999 © 2001 Earthworks Environment & Resources Ltd. All Rights Reserved 10
DEM DATA for SE England
(Data courtesy Nigel Press Associates. EuroDEM ©NPA 1997)

11-16 July, 1999 © 2001 Earthworks Environment & Resources Ltd. All Rights Reserved 11
DEM Variogram
Raw Data
0
500
1000
1500
2000
2500
3000
0 10000 20000 30000 40000 50000
Lag (h)
Gam
ma
(h)
E-W
N-S
Smoothed Data
0
500
1000
1500
2000
2500
3000
0 10000 20000 30000 40000 50000
Lag (h)
Gam
ma
(h)
E-W
N-S

11-16 July, 1999 © 2001 Earthworks Environment & Resources Ltd. All Rights Reserved 12
DEM Variogram (Detail)
Raw Data
0
50
100
150
200
250
300
0 500 1000 1500 2000
Lag (h)
Gam
ma
(h)
E-W
N-S
Smoothed Data
0
50
100
150
200
250
300
0 500 1000 1500 2000
Lag (h)
Gam
ma
(h)
E-W
N-S

11-16 July, 1999 © 2001 Earthworks Environment & Resources Ltd. All Rights Reserved 13
DEM Smoothing Correction
Correcting for Smoothing
0
500
1000
1500
2000
2500
3000
0 10000 20000 30000 40000 50000
Lag (h)
Ga
mm
a (
h)
Adjusted N-S
Adjusted E-W
Raw E-W
Raw N-S
Smoothed E-W
Smoothed N-S

11-16 July, 1999 © 2001 Earthworks Environment & Resources Ltd. All Rights Reserved 14
DEM Smoothing Correction (detail)
Correcting for Smoothing
0
200
400
600
800
1000
1200
0 1000 2000 3000 4000 5000
Lag (h)
Ga
mm
a (
h)
Adjusted N-S
Adjusted E-W
Raw E-W
Raw N-S
Smoothed E-W
Smoothed N-S
11-16 July, 1999 © 2001 Earthworks Environment & Resources Ltd. All Rights Reserved 15
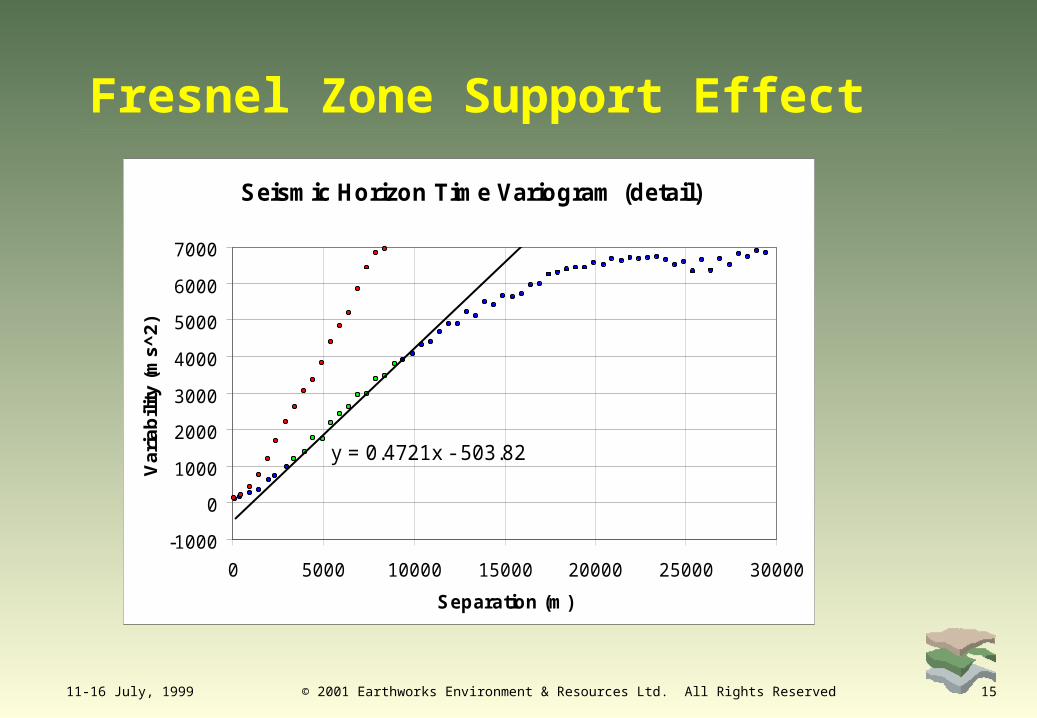
Fresnel Zone Support Effect
Seismic Horizon Time Variogram (detail)
y = 0.4721x - 503.82
-1000
0
1000
2000
3000
4000
5000
6000
7000
0 5000 10000 15000 20000 25000 30000
Separation (m)
Va
ria
bili
ty (
ms
^2
)

11-16 July, 1999 © 2001 Earthworks Environment & Resources Ltd. All Rights Reserved 16
“Support” Effect
• Support is a sample volume concept
• Variance decreases with increasing sample volume
• “Regularisation” - no overlap between samples
• Fresnel zone/Vertical resolution is spatial mixing
• Not strictly “support”.

11-16 July, 1999 © 2001 Earthworks Environment & Resources Ltd. All Rights Reserved 17
Time Variogram CorrectedTime Velocity Depth
X =

11-16 July, 1999 © 2001 Earthworks Environment & Resources Ltd. All Rights Reserved 18
Time Variogram CorrectedProspect Analysis
• Spillpoint : 1844 m
• Volume :886.6 x 10⁶ m3
• Area : 34.7 x 10⁶ m2
• Thickness: 25.5 m
• Prognosis : 1775 m
• Connection: 100%?

11-16 July, 1999 © 2001 Earthworks Environment & Resources Ltd. All Rights Reserved 19
Time Variogram CorrectedConditional Simulation/Spillpoint

11-16 July, 1999 © 2001 Earthworks Environment & Resources Ltd. All Rights Reserved 20
Time Variogram CorrectedIsoprobability Map/GRV Curve
• Spillpoint : 1834 m
• Volume :654.8 x 10⁶ m3
• Area : 20.6 x 10⁶ m2
• Thickness: 31.4 m
• Prognosis : 1774 m
• Connection: 68%GRV Distribution (Time Variogram Corrected)
0%10%
20%30%40%50%
60%70%80%
90%100%
0 500 1000 1500 2000
GRV (m ^3 x 10^6)
Cu
mu
lati
ve P
rob
abili
ty (
%)

11-16 July, 1999 © 2001 Earthworks Environment & Resources Ltd. All Rights Reserved 21
Time Variogram CorrectedIsoprobability Map/GRV Curve (All)
• Spillpoint : 1834 m
• Volume :802.0 x 10⁶ m3
• Area : 25.5 x 10⁶ m2
• Thickness: 30.8 m
• Prognosis : 1774 m
• Connection: 68%GRV Distribution (Time Variogram Corrected)
0%10%
20%30%40%50%
60%70%80%
90%100%
0 500 1000 1500 2000
GRV (m ^3 x 10^6)
Cu
mu
lati
ve P
rob
abili
ty (
%)

11-16 July, 1999 © 2001 Earthworks Environment & Resources Ltd. All Rights Reserved 22
Time/velocity Variograms CorrectedTime Velocity Depth
X =
11-16 July, 1999 © 2001 Earthworks Environment & Resources Ltd. All Rights Reserved 23
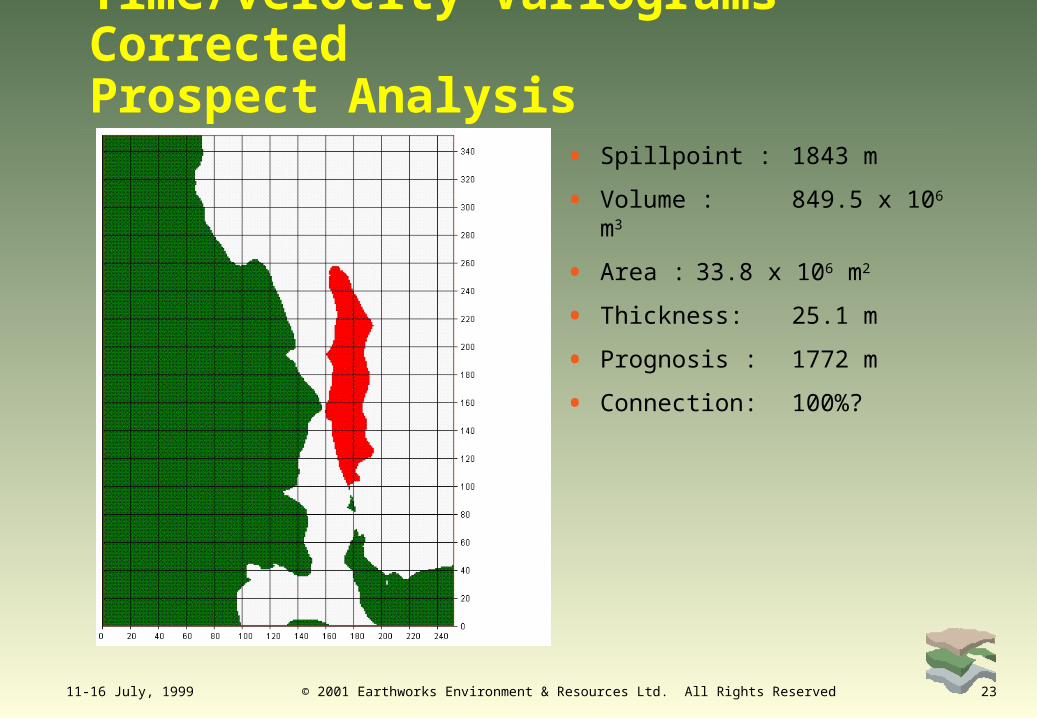
Time/velocity Variograms CorrectedProspect Analysis
• Spillpoint : 1843 m
• Volume :849.5 x 10⁶ m3
• Area : 33.8 x 10⁶ m2
• Thickness: 25.1 m
• Prognosis : 1772 m
• Connection: 100%?
11-16 July, 1999 © 2001 Earthworks Environment & Resources Ltd. All Rights Reserved 24
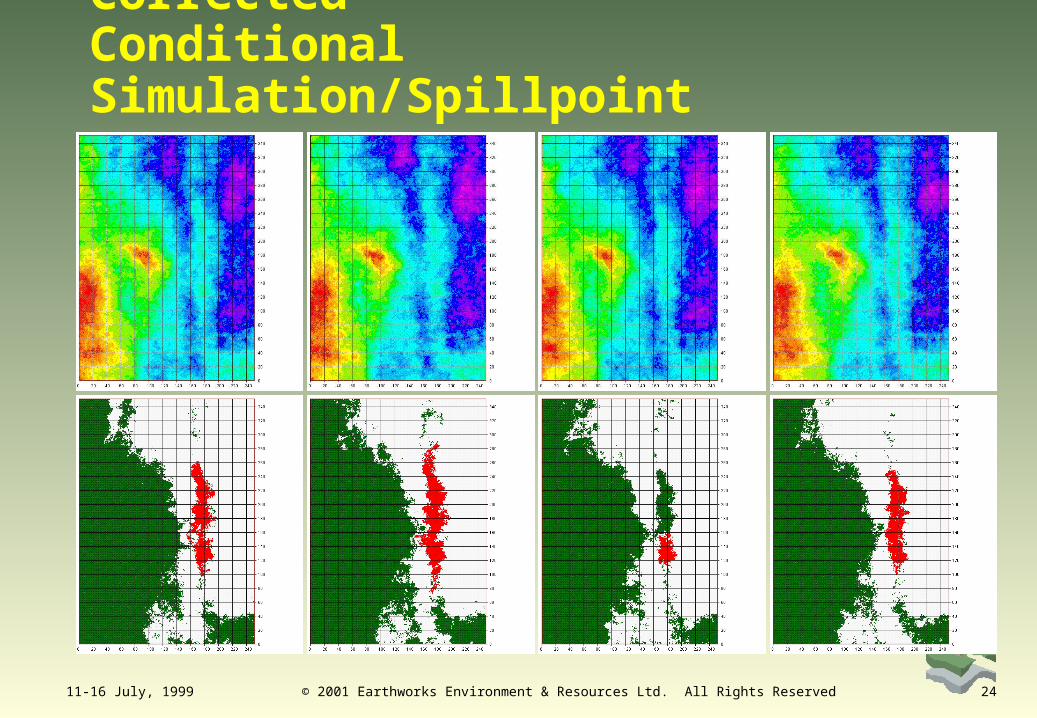
Time/velocity Variograms CorrectedConditional Simulation/Spillpoint

11-16 July, 1999 © 2001 Earthworks Environment & Resources Ltd. All Rights Reserved 25
Time/velocity Variograms CorrectedIsoprobability Map/GRV Curve
• Spillpoint : 1839 m
• Volume :807.8 x 10⁶ m3
• Area : 28.9 x 10⁶ m2
• Thickness: 27.5 m
• Prognosis : 1774 m
• Connection: 92%GRV Distribution (Time/velocity Variograms Corrected)
0%10%
20%30%40%50%
60%70%80%
90%100%
0 500 1000 1500 2000
GRV (m ^3 x 10^6)
Cu
mu
lati
ve P
rob
abili
ty (
%)

11-16 July, 1999 © 2001 Earthworks Environment & Resources Ltd. All Rights Reserved 26
Time/velocity Variograms CorrectedIsoprobability Map/GRV Curve (All)
• Spillpoint : 1939 m
• Volume :844.2 x 10⁶ m3
• Area : 30.3 x 10⁶ m2
• Thickness: 27.5 m
• Prognosis : 1774 m
• Connection: 92%GRV Distribution (Time/velocity Variograms Corrected)
0%10%
20%30%40%50%
60%70%80%
90%100%
0 500 1000 1500 2000
GRV (m ^3 x 10^6)
Cu
mu
lati
ve P
rob
abili
ty (
%)

11-16 July, 1999 © 2001 Earthworks Environment & Resources Ltd. All Rights Reserved 27
Volume Summary
Seed Variogram P90 P10 Mean ChangeKriged Any Observed n/a n/a 882.2 0.0%Kriged Any Time n/a n/a 886.6 0.5%Kriged Any Time + Velocity n/a n/a 849.5 -3.7%Simulation single Observed 190.3 1132.6 717.3 -18.7%Simulation single Time 218.3 1133.1 654.8 -25.8%Simulation single Time + Velocity 515.9 1125.5 807.8 -8.4%Simulation independent Observed 510.2 1132.6 791.5 -10.3%Simulation independent Time 508.6 1151.2 802.0 -9.1%Simulation independent Time + Velocity 607.5 1125.5 844.2 -4.3%

11-16 July, 1999 © 2001 Earthworks Environment & Resources Ltd. All Rights Reserved 28
Recovering the Variogram
• Smoothing will be a function of:– Frequency/Bandwidth
– Migration (Collapse of Fresnel zone)
• Smoothing effect is “locked in” to data set.
• Correction is not a nugget - additional variance is spatially correlated
• Effect of smoothing is quite small in this example
• Effect of spillpoint criteria is more significant

11-16 July, 1999 © 2001 Earthworks Environment & Resources Ltd. All Rights Reserved 29
How can we condition to a known hydrocarbon contact?
• Discard realisations with “wrong” spillpoint?– Discard all realisations? (Precision)
• Discard realisations with too deep spillpoint?
• Discard realisations with too shallow spillpoint?
• Condition to a spillpoint level?
• How do we know the control on spillpoint?