Embed Size (px)
Citation preview
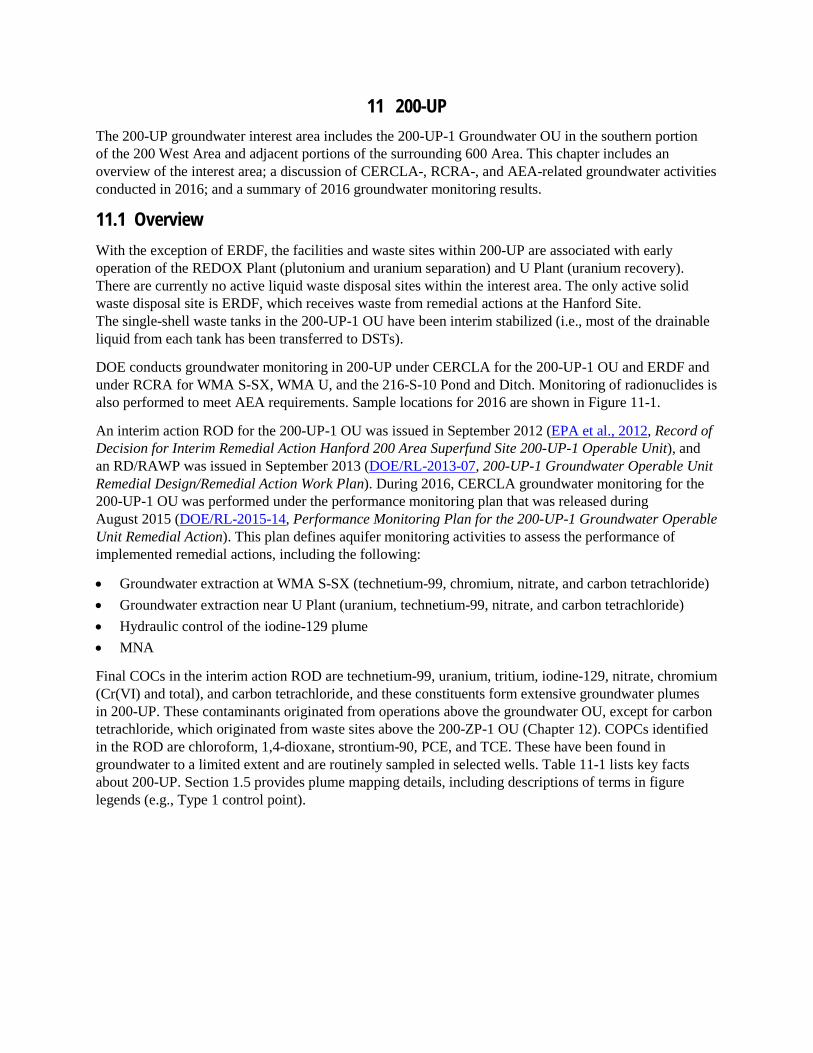
11 200-UP The 200-UP groundwater interest area includes the 200-UP-1 Groundwater OU in the southern portion of the 200 West Area and adjacent portions of the surrounding 600 Area. This chapter includes an overview of the interest area; a discussion of CERCLA-, RCRA-, and AEA-related groundwater activities conducted in 2016; and a summary of 2016 groundwater monitoring results.
11.1 Overview With the exception of ERDF, the facilities and waste sites within 200-UP are associated with early operation of the REDOX Plant (plutonium and uranium separation) and U Plant (uranium recovery). There are currently no active liquid waste disposal sites within the interest area. The only active solid waste disposal site is ERDF, which receives waste from remedial actions at the Hanford Site. The single-shell waste tanks in the 200-UP-1 OU have been interim stabilized (i.e., most of the drainable liquid from each tank has been transferred to DSTs).
DOE conducts groundwater monitoring in 200-UP under CERCLA for the 200-UP-1 OU and ERDF and under RCRA for WMA S-SX, WMA U, and the 216-S-10 Pond and Ditch. Monitoring of radionuclides is also performed to meet AEA requirements. Sample locations for 2016 are shown in Figure 11-1.
An interim action ROD for the 200-UP-1 OU was issued in September 2012 (EPA et al., 2012, Record of Decision for Interim Remedial Action Hanford 200 Area Superfund Site 200-UP-1 Operable Unit), and an RD/RAWP was issued in September 2013 (DOE/RL-2013-07, 200-UP-1 Groundwater Operable Unit Remedial Design/Remedial Action Work Plan). During 2016, CERCLA groundwater monitoring for the 200-UP-1 OU was performed under the performance monitoring plan that was released during August 2015 (DOE/RL-2015-14, Performance Monitoring Plan for the 200-UP-1 Groundwater Operable Unit Remedial Action). This plan defines aquifer monitoring activities to assess the performance of implemented remedial actions, including the following:
• Groundwater extraction at WMA S-SX (technetium-99, chromium, nitrate, and carbon tetrachloride) • Groundwater extraction near U Plant (uranium, technetium-99, nitrate, and carbon tetrachloride) • Hydraulic control of the iodine-129 plume • MNA
Final COCs in the interim action ROD are technetium-99, uranium, tritium, iodine-129, nitrate, chromium (Cr(VI) and total), and carbon tetrachloride, and these constituents form extensive groundwater plumes in 200-UP. These contaminants originated from operations above the groundwater OU, except for carbon tetrachloride, which originated from waste sites above the 200-ZP-1 OU (Chapter 12). COPCs identified in the ROD are chloroform, 1,4-dioxane, strontium-90, PCE, and TCE. These have been found in groundwater to a limited extent and are routinely sampled in selected wells. Table 11-1 lists key facts about 200-UP. Section 1.5 provides plume mapping details, including descriptions of terms in figure legends (e.g., Type 1 control point).
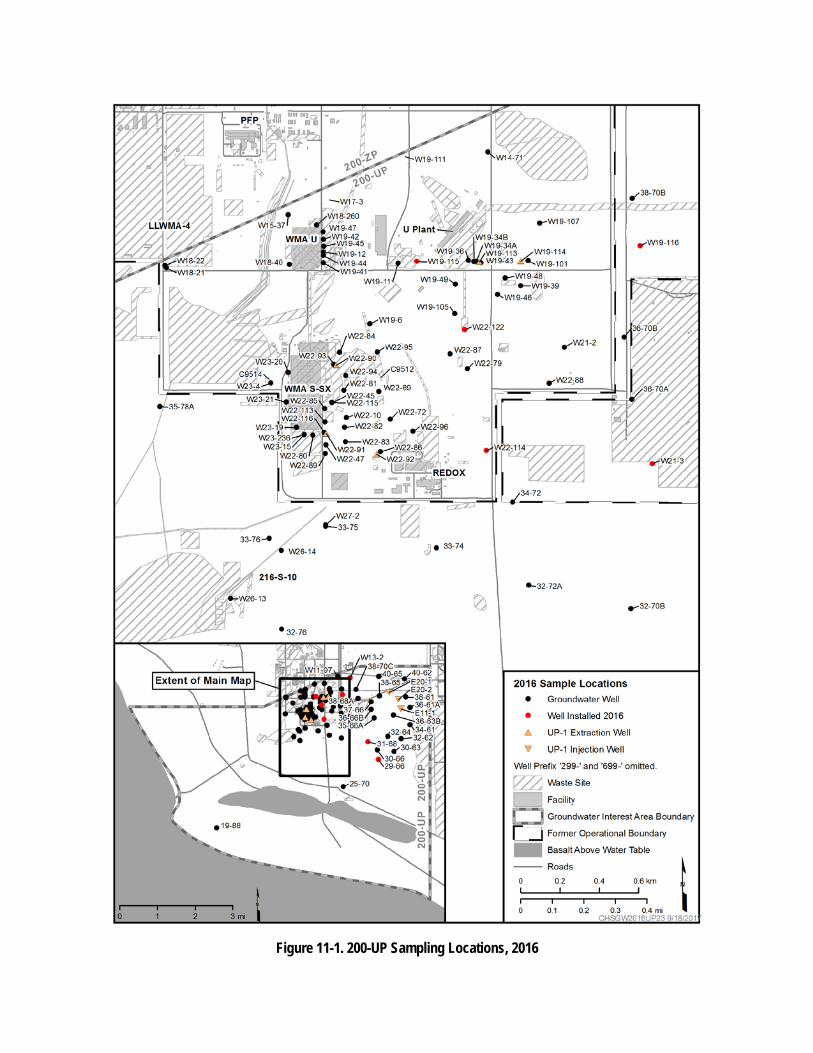
Figure 11-1. 200-UP Sampling Locations, 2016
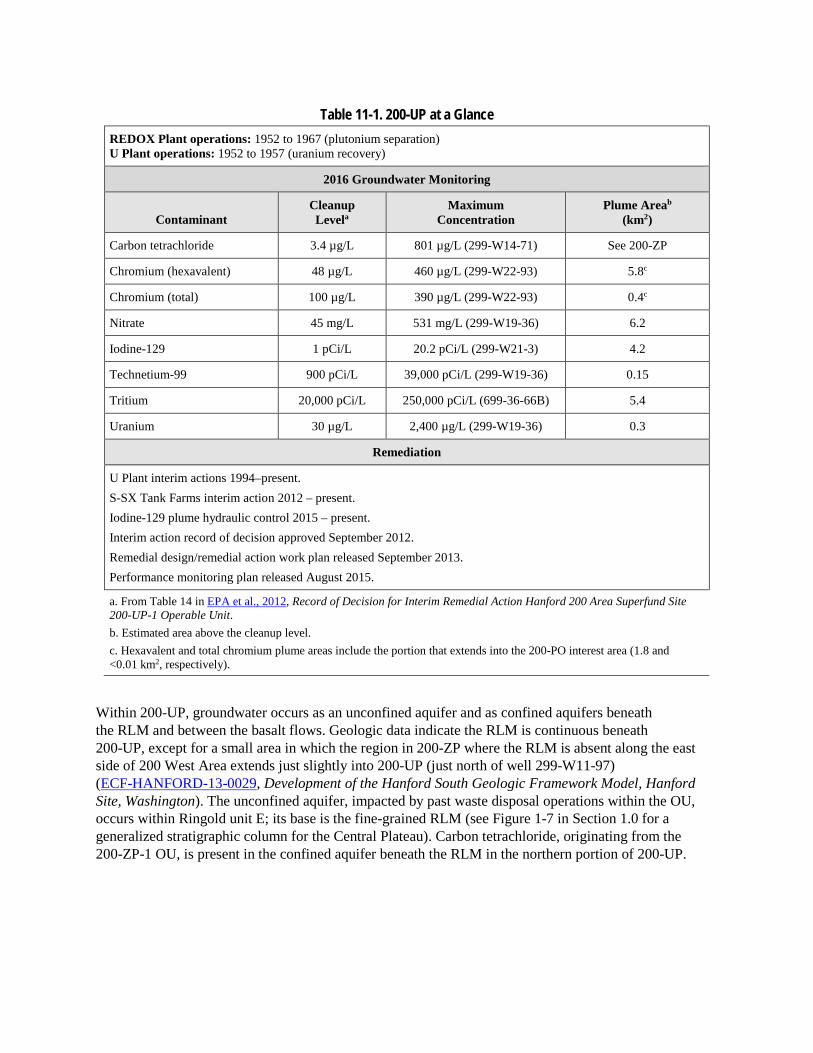
Table 11-1. 200-UP at a Glance REDOX Plant operations: 1952 to 1967 (plutonium separation) U Plant operations: 1952 to 1957 (uranium recovery)
2016 Groundwater Monitoring
Contaminant Cleanup Levela
Maximum Concentration
Plume Areab
(km2)
Carbon tetrachloride 3.4 µg/L 801 µg/L (299-W14-71) See 200-ZP
Chromium (hexavalent) 48 µg/L 460 µg/L (299-W22-93) 5.8c
Chromium (total) 100 µg/L 390 µg/L (299-W22-93) 0.4c
Nitrate 45 mg/L 531 mg/L (299-W19-36) 6.2
Iodine-129 1 pCi/L 20.2 pCi/L (299-W21-3) 4.2
Technetium-99 900 pCi/L 39,000 pCi/L (299-W19-36) 0.15
Tritium 20,000 pCi/L 250,000 pCi/L (699-36-66B) 5.4
Uranium 30 µg/L 2,400 µg/L (299-W19-36) 0.3
Remediation
U Plant interim actions 1994–present. S-SX Tank Farms interim action 2012 – present. Iodine-129 plume hydraulic control 2015 – present. Interim action record of decision approved September 2012. Remedial design/remedial action work plan released September 2013. Performance monitoring plan released August 2015.
a. From Table 14 in EPA et al., 2012, Record of Decision for Interim Remedial Action Hanford 200 Area Superfund Site 200-UP-1 Operable Unit. b. Estimated area above the cleanup level. c. Hexavalent and total chromium plume areas include the portion that extends into the 200-PO interest area (1.8 and <0.01 km2, respectively).
Within 200-UP, groundwater occurs as an unconfined aquifer and as confined aquifers beneath the RLM and between the basalt flows. Geologic data indicate the RLM is continuous beneath 200-UP, except for a small area in which the region in 200-ZP where the RLM is absent along the east side of 200 West Area extends just slightly into 200-UP (just north of well 299-W11-97) (ECF-HANFORD-13-0029, Development of the Hanford South Geologic Framework Model, Hanford Site, Washington). The unconfined aquifer, impacted by past waste disposal operations within the OU, occurs within Ringold unit E; its base is the fine-grained RLM (see Figure 1-7 in Section 1.0 for a generalized stratigraphic column for the Central Plateau). Carbon tetrachloride, originating from the 200-ZP-1 OU, is present in the confined aquifer beneath the RLM in the northern portion of 200-UP.
Depth from land surface to the water table ranges from 64 to 106 m (210 to 348 ft), with the largest depths occurring in the northeastern portion of the OU. The thickness of the unconfined aquifer varies from 70 m (230 ft) in the western portion of the OU to near zero north of the OU boundary where the top of the RLM has been extrapolated to occur above the water table. The water table elevation and groundwater gradients in the 200 West Area have been historically affected by large-volume wastewater discharges (DOE/RL-2008-01; PNNL-13080, Hanford Site Groundwater Monitoring: Setting, Sources and Methods; SGW-60338, Historical Changes in Water Table Elevation and Groundwater Flow Direction at Hanford: 1944 to 2014) and are currently affected by groundwater P&T and hydraulic control remedial actions. Groundwater flow in the unconfined aquifer is toward the east within the southern 200 West Area and toward the east-northeast in the eastern and northern portion of the 200-UP interest area (Figure 11-2).
Some of the contaminants in 200 West Area groundwater (particularly carbon tetrachloride and TCE) are unevenly distributed vertically; in some locations the greatest concentrations occur near the bottom of the aquifer. The plume maps presented in this chapter are generally based on data from all wells, not only those screened in the upper part of the aquifer. If wells are paired (shallow/deep), the greater concentration is used for plume mapping.
Areal extents of the plumes over time is shown in Figure 11-3. The decline in areal extent for chromium from 2010 to 2011 was a result of the plume mapping methodology change from hand contouring in 2010 to kriging in 2011. This resulted in halving the areal extent of the southeast chromium plume.
11.2 Technetium-99 Within 200-UP, technetium-99 concentrations exceed the 900 pCi/L cleanup level downgradient of WMA S-SX, the 216-U-1 and 216-U-2 Cribs (near U Plant), and WMA U (Figure 11-4).
11.2.1 Waste Management Area S-SX Technetium-99 plumes occur downgradient of both the S and SX Tank Farms. The plume from the SX Tank Farm is attributed primarily to a 190,000 L (51,000 gal) leak from tank SX-115 during 1965 (Section 4.3 of RPP-ENV-39658, Hanford SX-Farm Leak Assessments Report). The highest concentrations in this plume occur at well 299-W23-19, located next to tank SX-115 inside the SX Tank Farm fence line. During 2016, concentrations fluctuated between 12,600 and 16,800 pCi/L (Figure 11-5). The average concentration was 15,300 pCi/L, a decline from an average of 15,900 pCi/L during 2015. The declining trend is attributed to a groundwater extraction system that began operating in July 2012. The nearest extraction well (299-W22-91) is located 155 m (509 ft) east-southeast of well 299-W23-19 (Figure 11-1).
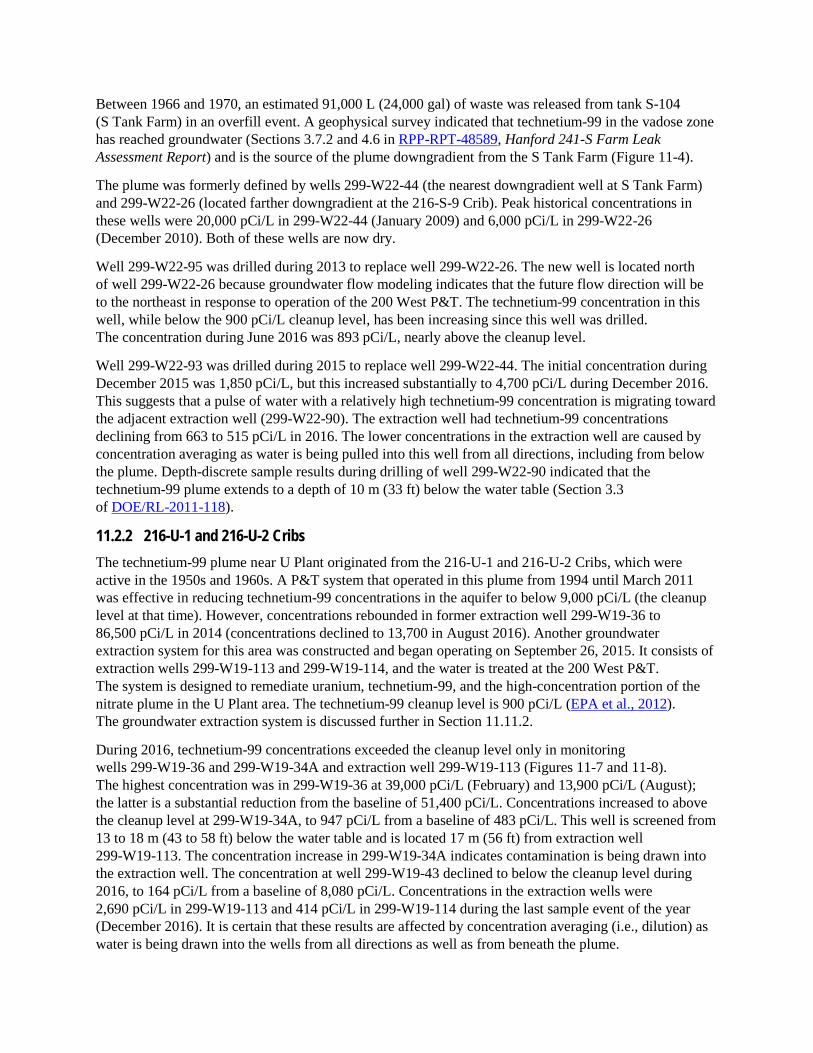
Technetium-99 concentrations in many wells downgradient of the SX Tank Farm are declining due to operation of the groundwater extraction system (Figure 11-6). Since startup in 2012, concentrations have declined to below the 900 pCi/L cleanup level in wells 299-W22-47 and 299-W22-113 (replacement well for 299-W22-49, which is dry). Concentrations are above the cleanup level in six other monitoring wells in the plume from the SX Tank Farm. Concentrations are declining in all but two of these wells. Concentrations have increased at 299-W22-116 (to 11,200 pCi/L) near extraction well 299-W22-91, indicating that contamination is being drawn into the extraction well. Concentrations have also increased at well 299-W22-96 (to 2,580 pCi/L) as the portion of the plume not being captured migrates and disperses downgradient. Depth-discrete sample results indicate this plume is in the upper 20 m (66 ft) of the aquifer at concentrations above the cleanup level (DOE/RL-2009-122, Remedial Investigation/Feasibility Study for the 200-UP-1 Groundwater Operable Unit).
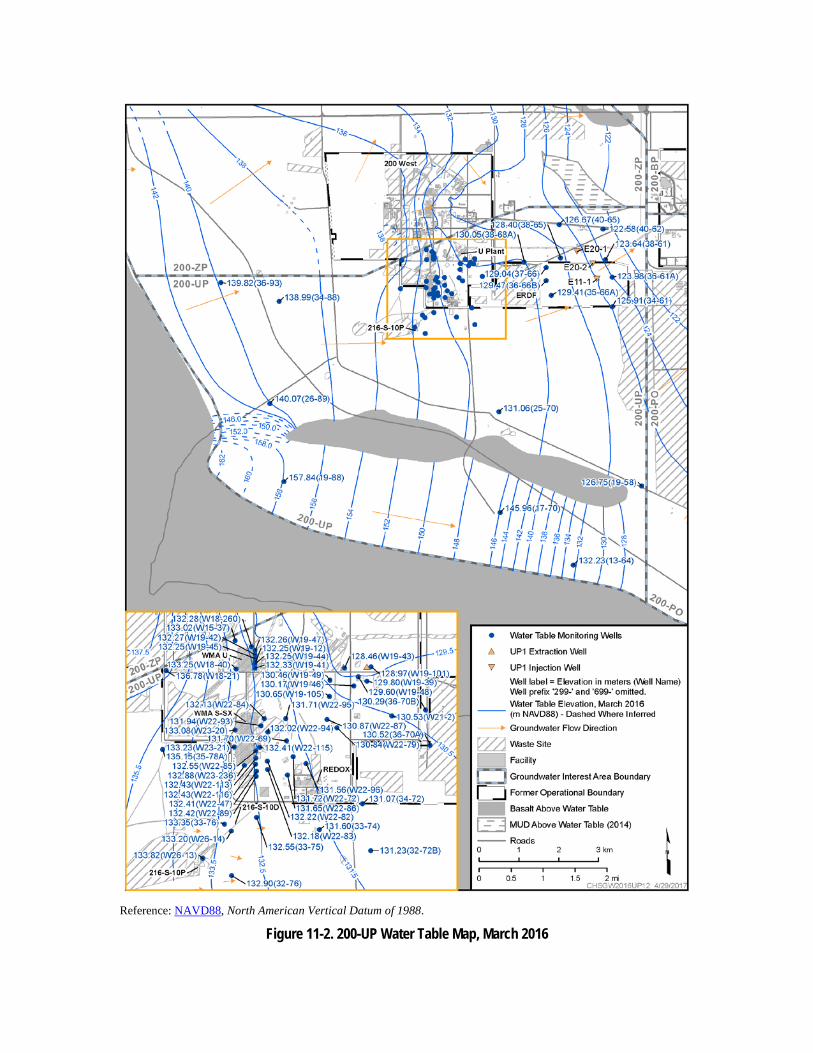
Reference: NAVD88, North American Vertical Datum of 1988.
Figure 11-2. 200-UP Water Table Map, March 2016
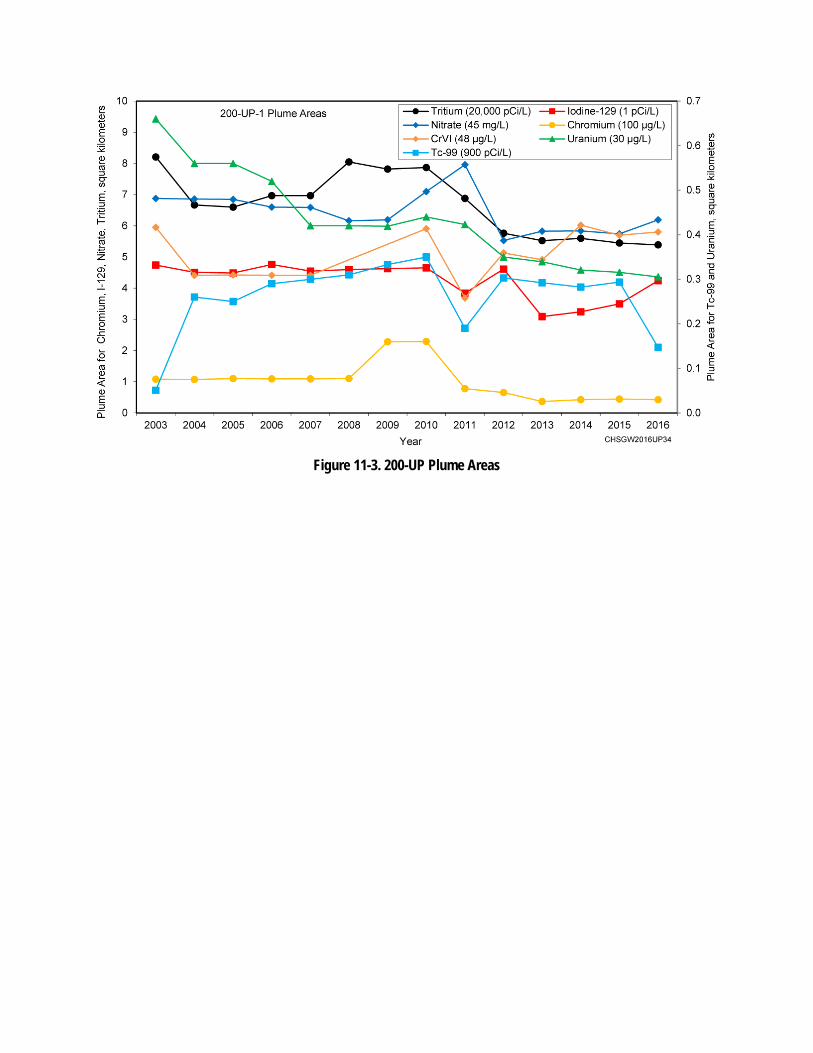
Figure 11-3. 200-UP Plume Areas
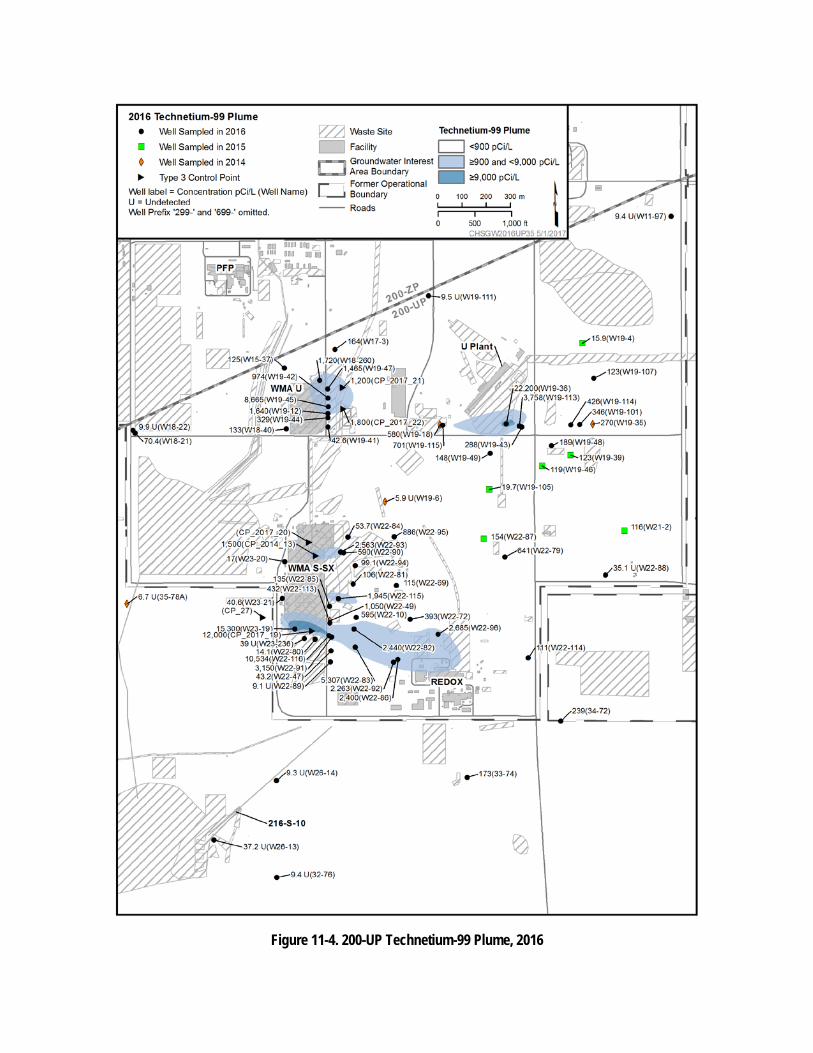
Figure 11-4. 200-UP Technetium-99 Plume, 2016
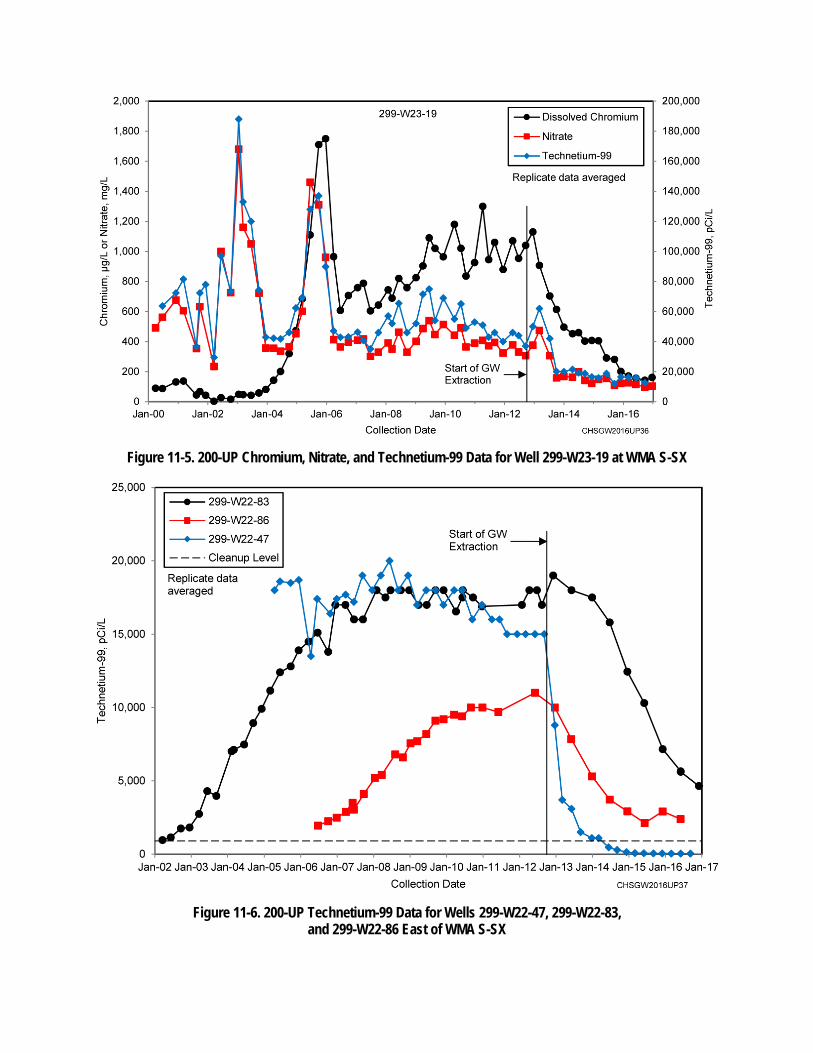
Figure 11-5. 200-UP Chromium, Nitrate, and Technetium-99 Data for Well 299-W23-19 at WMA S-SX
Figure 11-6. 200-UP Technetium-99 Data for Wells 299-W22-47, 299-W22-83, and 299-W22-86 East of WMA S-SX
Between 1966 and 1970, an estimated 91,000 L (24,000 gal) of waste was released from tank S-104 (S Tank Farm) in an overfill event. A geophysical survey indicated that technetium-99 in the vadose zone has reached groundwater (Sections 3.7.2 and 4.6 in RPP-RPT-48589, Hanford 241-S Farm Leak Assessment Report) and is the source of the plume downgradient from the S Tank Farm (Figure 11-4).
The plume was formerly defined by wells 299-W22-44 (the nearest downgradient well at S Tank Farm) and 299-W22-26 (located farther downgradient at the 216-S-9 Crib). Peak historical concentrations in these wells were 20,000 pCi/L in 299-W22-44 (January 2009) and 6,000 pCi/L in 299-W22-26 (December 2010). Both of these wells are now dry.
Well 299-W22-95 was drilled during 2013 to replace well 299-W22-26. The new well is located north of well 299-W22-26 because groundwater flow modeling indicates that the future flow direction will be to the northeast in response to operation of the 200 West P&T. The technetium-99 concentration in this well, while below the 900 pCi/L cleanup level, has been increasing since this well was drilled. The concentration during June 2016 was 893 pCi/L, nearly above the cleanup level.
Well 299-W22-93 was drilled during 2015 to replace well 299-W22-44. The initial concentration during December 2015 was 1,850 pCi/L, but this increased substantially to 4,700 pCi/L during December 2016. This suggests that a pulse of water with a relatively high technetium-99 concentration is migrating toward the adjacent extraction well (299-W22-90). The extraction well had technetium-99 concentrations declining from 663 to 515 pCi/L in 2016. The lower concentrations in the extraction well are caused by concentration averaging as water is being pulled into this well from all directions, including from below the plume. Depth-discrete sample results during drilling of well 299-W22-90 indicated that the technetium-99 plume extends to a depth of 10 m (33 ft) below the water table (Section 3.3 of DOE/RL-2011-118).
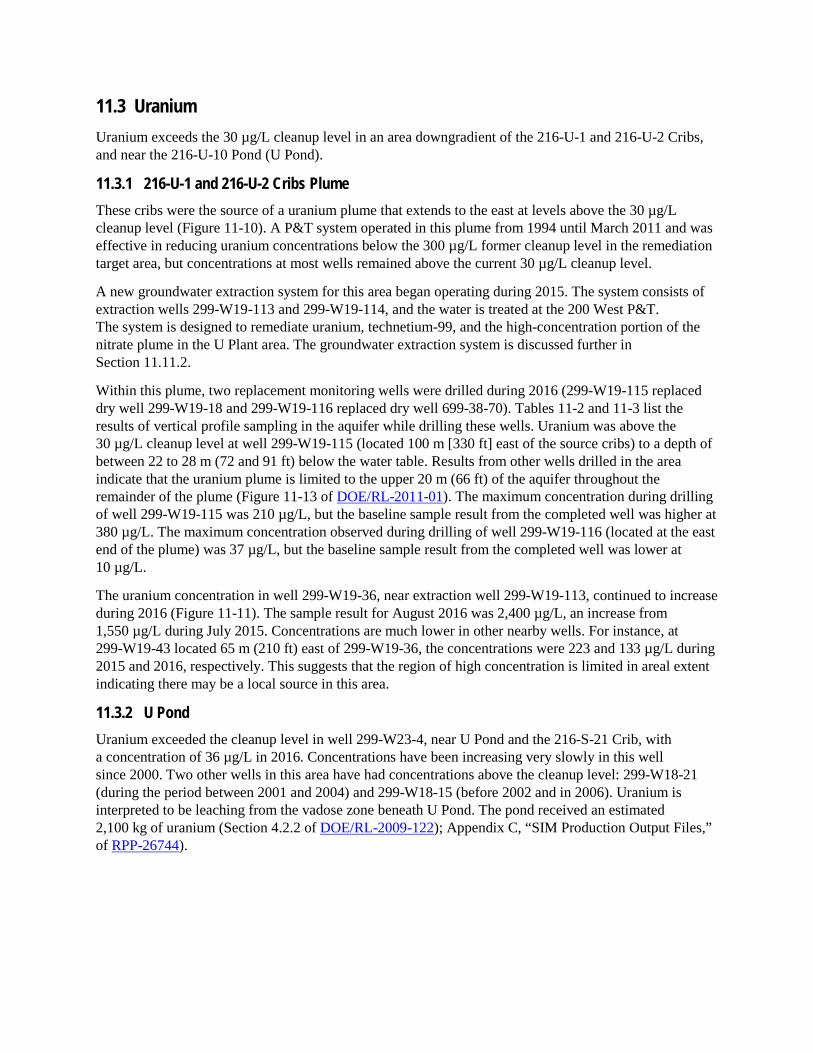
11.2.2 216-U-1 and 216-U-2 Cribs The technetium-99 plume near U Plant originated from the 216-U-1 and 216-U-2 Cribs, which were active in the 1950s and 1960s. A P&T system that operated in this plume from 1994 until March 2011 was effective in reducing technetium-99 concentrations in the aquifer to below 9,000 pCi/L (the cleanup level at that time). However, concentrations rebounded in former extraction well 299-W19-36 to 86,500 pCi/L in 2014 (concentrations declined to 13,700 in August 2016). Another groundwater extraction system for this area was constructed and began operating on September 26, 2015. It consists of extraction wells 299-W19-113 and 299-W19-114, and the water is treated at the 200 West P&T. The system is designed to remediate uranium, technetium-99, and the high-concentration portion of the nitrate plume in the U Plant area. The technetium-99 cleanup level is 900 pCi/L (EPA et al., 2012). The groundwater extraction system is discussed further in Section 11.11.2.
During 2016, technetium-99 concentrations exceeded the cleanup level only in monitoring wells 299-W19-36 and 299-W19-34A and extraction well 299-W19-113 (Figures 11-7 and 11-8). The highest concentration was in 299-W19-36 at 39,000 pCi/L (February) and 13,900 pCi/L (August); the latter is a substantial reduction from the baseline of 51,400 pCi/L. Concentrations increased to above the cleanup level at 299-W19-34A, to 947 pCi/L from a baseline of 483 pCi/L. This well is screened from 13 to 18 m (43 to 58 ft) below the water table and is located 17 m (56 ft) from extraction well 299-W19-113. The concentration increase in 299-W19-34A indicates contamination is being drawn into the extraction well. The concentration at well 299-W19-43 declined to below the cleanup level during 2016, to 164 pCi/L from a baseline of 8,080 pCi/L. Concentrations in the extraction wells were 2,690 pCi/L in 299-W19-113 and 414 pCi/L in 299-W19-114 during the last sample event of the year (December 2016). It is certain that these results are affected by concentration averaging (i.e., dilution) as water is being drawn into the wells from all directions as well as from beneath the plume.
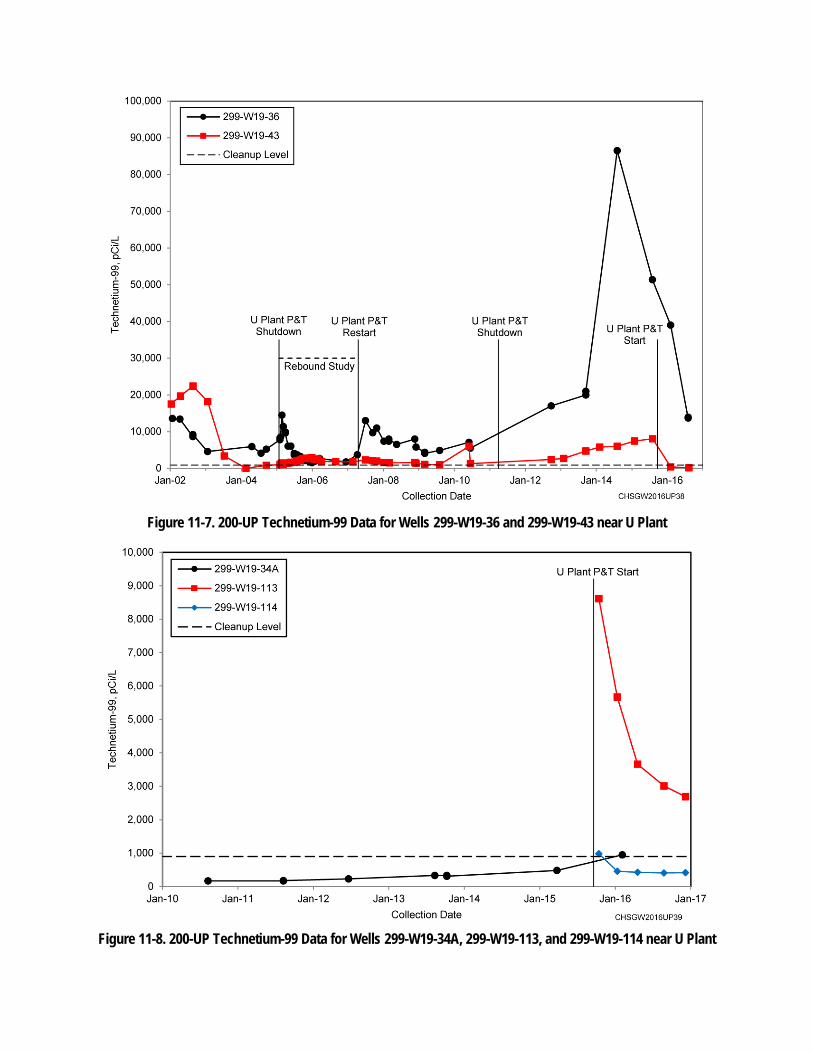
Figure 11-7. 200-UP Technetium-99 Data for Wells 299-W19-36 and 299-W19-43 near U Plant
Figure 11-8. 200-UP Technetium-99 Data for Wells 299-W19-34A, 299-W19-113, and 299-W19-114 near U Plant

In the 2015 annual report (DOE/RL-2016-09, Hanford Site Groundwater Monitoring Report for 2015), it was reported that the technetium-99 concentration at well 699-38-70C, located in the 600 Area (1.9 km [1.2 mi] east northeast of the 216-U-1 and 216-U-2 Cribs), increased to 981 pCi/L in 2015 (above the 900 pCi/L cleanup level). The 2016 sample result was lower at 590 pCi/L. It is now believed that the 2015 sample result was erroneous and the concentration at this location is not above the cleanup level.
11.2.3 Waste Management Area U WMA U is a source of technetium-99 groundwater contamination (PNNL-13282, Groundwater Quality Assessment for Waste Management Area U: First Determination). Concentrations in many downgradient wells are stable or slowly increasing, with the exception of 299-W19-45 in which concentrations have increased substantially since 2011 (Figure 11-9). During 2016, concentrations in this well increased to 8,730 pCi/L from the 2015 maximum of 6,950 pCi/L. During 2016, technetium-99 also exceeded the cleanup level in wells 299-W19-12, 299-W19-42, 299-W19-47, and 299-W18-260, with a maximum of 1,720 pCi/L in 299-W18-260. The groundwater contamination at WMA U is believed to result from multiple sources in the WMA (HNF-EP-0182). The contamination is within the 200 West P&T capture zone. Two additional wells are planned for drilling in 2018 downgradient from the tank farm to delineate the technetium-99 plume.
Figure 11-9. 200-UP Technetium-99 Data for Selected Wells at WMA U
11.3 Uranium Uranium exceeds the 30 µg/L cleanup level in an area downgradient of the 216-U-1 and 216-U-2 Cribs, and near the 216-U-10 Pond (U Pond).
11.3.1 216-U-1 and 216-U-2 Cribs Plume These cribs were the source of a uranium plume that extends to the east at levels above the 30 µg/L cleanup level (Figure 11-10). A P&T system operated in this plume from 1994 until March 2011 and was effective in reducing uranium concentrations below the 300 µg/L former cleanup level in the remediation target area, but concentrations at most wells remained above the current 30 µg/L cleanup level.
A new groundwater extraction system for this area began operating during 2015. The system consists of extraction wells 299-W19-113 and 299-W19-114, and the water is treated at the 200 West P&T. The system is designed to remediate uranium, technetium-99, and the high-concentration portion of the nitrate plume in the U Plant area. The groundwater extraction system is discussed further in Section 11.11.2.
Within this plume, two replacement monitoring wells were drilled during 2016 (299-W19-115 replaced dry well 299-W19-18 and 299-W19-116 replaced dry well 699-38-70). Tables 11-2 and 11-3 list the results of vertical profile sampling in the aquifer while drilling these wells. Uranium was above the 30 µg/L cleanup level at well 299-W19-115 (located 100 m [330 ft] east of the source cribs) to a depth of between 22 to 28 m (72 and 91 ft) below the water table. Results from other wells drilled in the area indicate that the uranium plume is limited to the upper 20 m (66 ft) of the aquifer throughout the remainder of the plume (Figure 11-13 of DOE/RL-2011-01). The maximum concentration during drilling of well 299-W19-115 was 210 µg/L, but the baseline sample result from the completed well was higher at 380 µg/L. The maximum concentration observed during drilling of well 299-W19-116 (located at the east end of the plume) was 37 µg/L, but the baseline sample result from the completed well was lower at 10 µg/L.
The uranium concentration in well 299-W19-36, near extraction well 299-W19-113, continued to increase during 2016 (Figure 11-11). The sample result for August 2016 was 2,400 µg/L, an increase from 1,550 µg/L during July 2015. Concentrations are much lower in other nearby wells. For instance, at 299-W19-43 located 65 m (210 ft) east of 299-W19-36, the concentrations were 223 and 133 µg/L during 2015 and 2016, respectively. This suggests that the region of high concentration is limited in areal extent indicating there may be a local source in this area.
11.3.2 U Pond Uranium exceeded the cleanup level in well 299-W23-4, near U Pond and the 216-S-21 Crib, with a concentration of 36 µg/L in 2016. Concentrations have been increasing very slowly in this well since 2000. Two other wells in this area have had concentrations above the cleanup level: 299-W18-21 (during the period between 2001 and 2004) and 299-W18-15 (before 2002 and in 2006). Uranium is interpreted to be leaching from the vadose zone beneath U Pond. The pond received an estimated 2,100 kg of uranium (Section 4.2.2 of DOE/RL-2009-122); Appendix C, “SIM Production Output Files,” of RPP-26744).
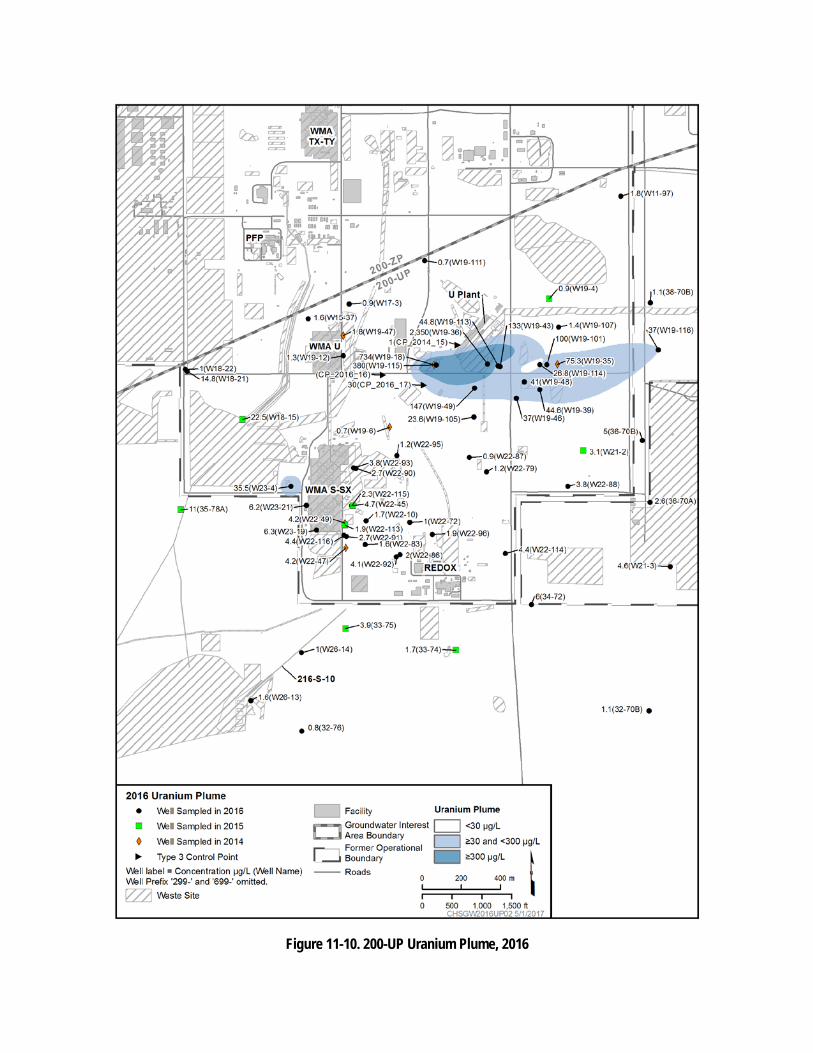
Figure 11-10. 200-UP Uranium Plume, 2016
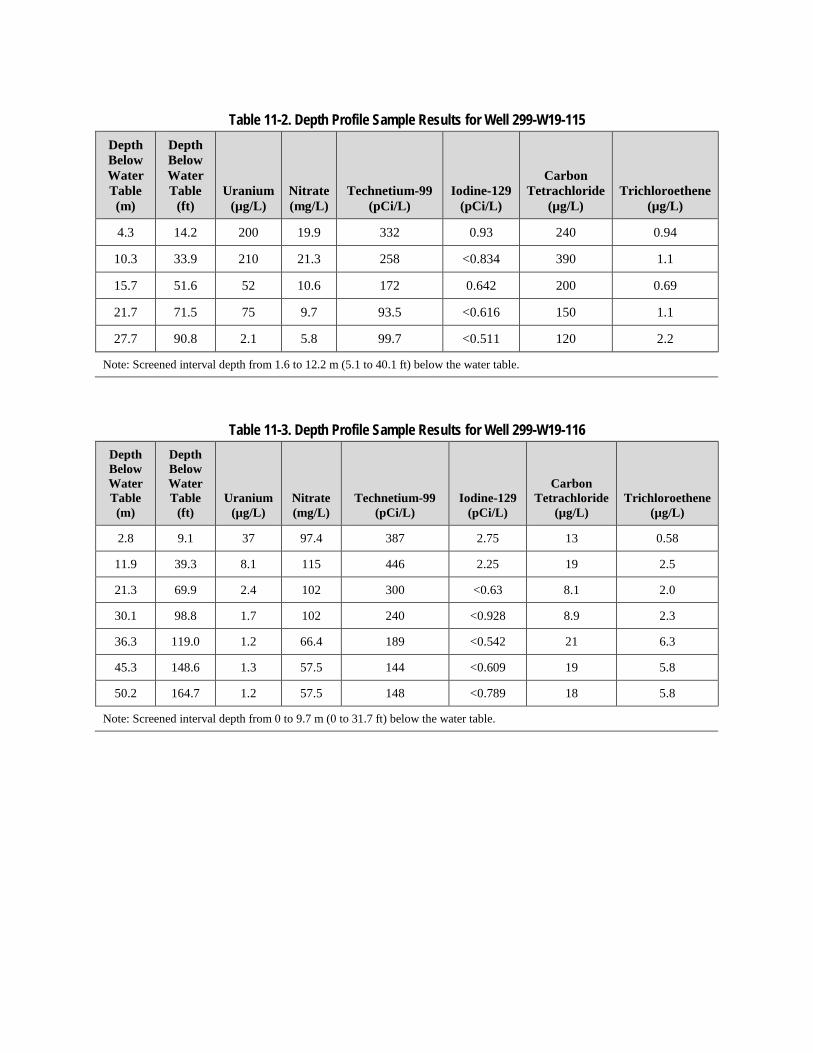
Table 11-2. Depth Profile Sample Results for Well 299-W19-115 Depth Below Water Table (m)
Depth Below Water Table
(ft) Uranium
(µg/L) Nitrate (mg/L)
Technetium-99 (pCi/L)
Iodine-129 (pCi/L)
Carbon Tetrachloride
(µg/L) Trichloroethene
(µg/L)
4.3 14.2 200 19.9 332 0.93 240 0.94
10.3 33.9 210 21.3 258 <0.834 390 1.1
15.7 51.6 52 10.6 172 0.642 200 0.69
21.7 71.5 75 9.7 93.5 <0.616 150 1.1
27.7 90.8 2.1 5.8 99.7 <0.511 120 2.2
Note: Screened interval depth from 1.6 to 12.2 m (5.1 to 40.1 ft) below the water table.
Table 11-3. Depth Profile Sample Results for Well 299-W19-116 Depth Below Water Table (m)
Depth Below Water Table
(ft) Uranium
(µg/L) Nitrate (mg/L)
Technetium-99 (pCi/L)
Iodine-129 (pCi/L)
Carbon Tetrachloride
(µg/L) Trichloroethene
(µg/L)
2.8 9.1 37 97.4 387 2.75 13 0.58
11.9 39.3 8.1 115 446 2.25 19 2.5
21.3 69.9 2.4 102 300 <0.63 8.1 2.0
30.1 98.8 1.7 102 240 <0.928 8.9 2.3
36.3 119.0 1.2 66.4 189 <0.542 21 6.3
45.3 148.6 1.3 57.5 144 <0.609 19 5.8
50.2 164.7 1.2 57.5 148 <0.789 18 5.8
Note: Screened interval depth from 0 to 9.7 m (0 to 31.7 ft) below the water table.

Figure 11-11. 200-UP Uranium Data for Wells 299-W19-18, 299-W19-115 (replacement for 299-W19-18), 299-W19-49, and 299-W19-36 near U Plant
11.4 Tritium Disposal facilities associated with the REDOX Plant, which operated from 1952 until 1967, were the primary sources of tritium in 200-UP. A large tritium plume from the REDOX Plant cribs extends 5 km (3.1 mi) toward the east and northeast at concentrations above the 20,000 pCi/L cleanup level (Figure 11-12). Smaller plumes are present near the 216-S-21 and 216-S-25 Cribs.
11.4.1 Eastern High-Concentration Area During 2016 several wells were drilled in and near the tritium plume east of the 200 West Area. As a result, the extent of the high-concentration center and the southern boundary of the plume were revised. High tritium concentrations historically occurred at now dry wells 699-35-70 and 299-W22-9. Replacement wells were drilled during 2016, and depth profile samples of the aquifer were collected during drilling (Tables 11-4 and 11-5). The maximum concentrations observed during drilling were lower than historical sample results. When 699-35-70 was last sampled in 2008, the concentration was 240,000 pCi/L, but the highest concentration in the replacement well (299-W21-3) was 133,000 pCi/L. When well 299-W22-9 was last sampled in 2005 the result was 1,020,000 pCi/L, but the highest concentration in the replacement well (299-W22-114) was only 35,500 pCi/L. These concentration declines are greater than would be expected due solely to radiological decay thus indicating movement and dispersion of the plume. The plume is relatively shallow at 299-W22-114; concentrations declined to below the 20,000 pCi/L cleanup level between 10 to 21 m (34 and 67 ft) below the water table. Concentrations above the cleanup level occur throughout the aquifer thickness at well 299-W21-3. One other well (699-36-63B) was drilled within the tritium plume during 2016. Concentrations in samples collected during drilling of this well ranged between 75,700 and 106,000 pCi/L (Table 11-6).
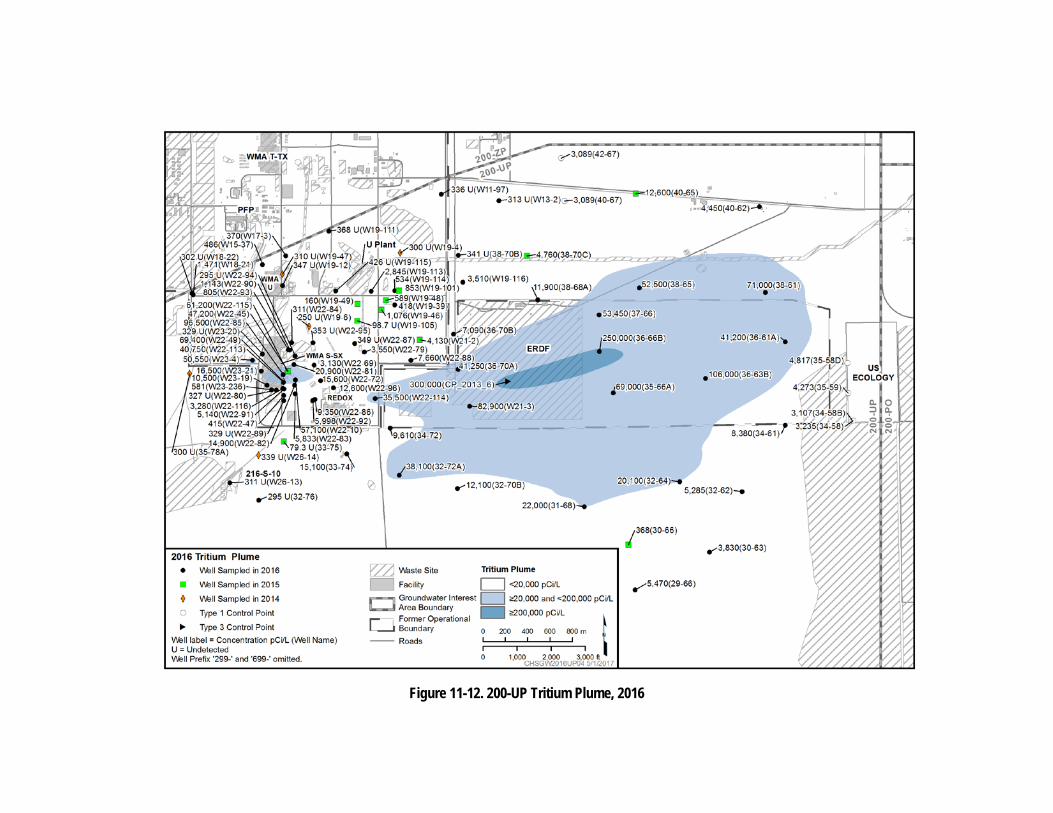
Figure 11-12. 200-UP Tritium Plume, 2016

Table 11-4. Depth Profile Sample Results for Well 299-W21-3 Depth Below Water Table
(m)
Depth Below Water Table
(ft) Iodine-129
(pCi/L) Tritium (pCi/L)
Nitrate (mg/L)
Technetium-99 (pCi/L)
Carbon Tetrachloride
(µg/L)
1.5 4.8 14.1 39,900 26.6 125 1.5
14.9 48.9 38.9 133,000 20.8 38 1.4
21.2 69.6 7.14 128,000 21.7 28.4 2.8
30.4 99.9 14.5 130,000 22.6 30.7 2.1
39.2 128.7 3.70 70,900 18.6 13.8 1.1
45.4 149.0 2.31 53,900 16.8 <9.06 1.0
Note: Screened interval depth from 11.6 to 17.7 m (38.1 to 58.1) ft below the water table.
Table 11-5. Depth Profile Sample Results for Well 299-W22-114 Depth Below Water Table
(m)
Depth Below Water Table
(ft) Iodine-129
(pCi/L) Tritium (pCi/L)
Nitrate (mg/L)
Technetium-99 (pCi/L)
Carbon Tetrachloride
(µg/L)
3.2 10.6 4.01 33,700 79.7 97.7 <0.3
10.4 34.1 1.73 35,500 5.3 18.7 2.1
20.5 67.4 1.49 11,200 4.4 30.5 2.1
29.8 97.7 <0.663 2,410 3.5 <9.53 10
39.8 127.6 <0.763 331 3.9 <9.59 7.7
54.1 177.6 <0.613 <326 6.2 <9.52 5.4
60.1 197.3 <0.422 <303 7.5 <9.89 5.7
Note: Screened interval depth from 0.04 to 10.7 m (0.13 to 35.1 ft) below the water table.
Table 11-6. Depth Profile Sample Results for Well 699-36-63B Depth Below Water Table
(m)
Depth Below Water Table
(ft) Iodine-129
(pCi/L) Tritium (pCi/L)
Nitrate (mg/L)
Chromium, Total (µg/L)
Hexavalent Chromium
(µg/L)
2.3 7.4 0.678 87,500 21.7 6.8 <1.5
5.2 17.2 <0.695 89,600 19.5 4.5 3.9
11.5 37.6 0.848 106,000 19.5 3.9 2.9
17.6 57.6 <0.53 102,000 19.5 4.0 4.3
23.7 77.8 <0.867 75,700 18.6 <1.1 <1.5
Note: Screened interval depth from 0 to 20.9 m (0 to 68.7 ft) below the water table.
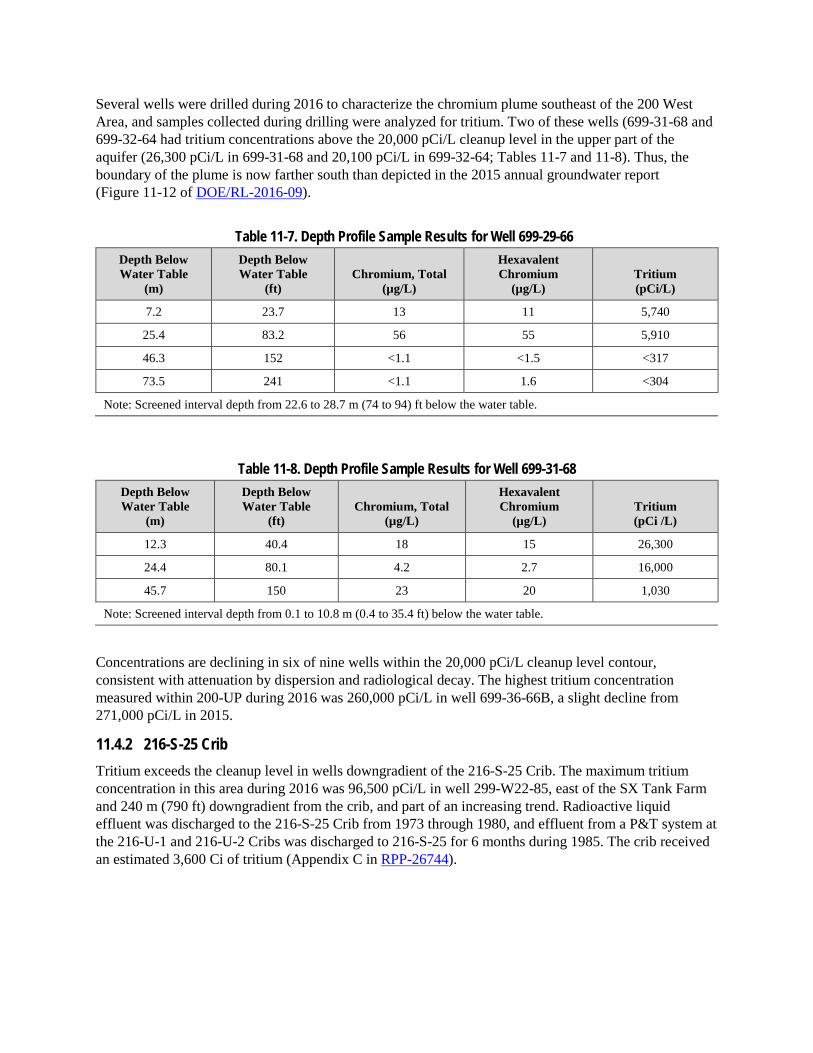
Several wells were drilled during 2016 to characterize the chromium plume southeast of the 200 West Area, and samples collected during drilling were analyzed for tritium. Two of these wells (699-31-68 and 699-32-64 had tritium concentrations above the 20,000 pCi/L cleanup level in the upper part of the aquifer (26,300 pCi/L in 699-31-68 and 20,100 pCi/L in 699-32-64; Tables 11-7 and 11-8). Thus, the boundary of the plume is now farther south than depicted in the 2015 annual groundwater report (Figure 11-12 of DOE/RL-2016-09).
Table 11-7. Depth Profile Sample Results for Well 699-29-66 Depth Below Water Table
(m)
Depth Below Water Table
(ft) Chromium, Total
(µg/L)
Hexavalent Chromium
(µg/L) Tritium (pCi/L)
7.2 23.7 13 11 5,740
25.4 83.2 56 55 5,910
46.3 152 <1.1 <1.5 <317
73.5 241 <1.1 1.6 <304
Note: Screened interval depth from 22.6 to 28.7 m (74 to 94) ft below the water table.
Table 11-8. Depth Profile Sample Results for Well 699-31-68 Depth Below Water Table
(m)
Depth Below Water Table
(ft) Chromium, Total
(µg/L)
Hexavalent Chromium
(µg/L) Tritium (pCi /L)
12.3 40.4 18 15 26,300
24.4 80.1 4.2 2.7 16,000
45.7 150 23 20 1,030
Note: Screened interval depth from 0.1 to 10.8 m (0.4 to 35.4 ft) below the water table.
Concentrations are declining in six of nine wells within the 20,000 pCi/L cleanup level contour, consistent with attenuation by dispersion and radiological decay. The highest tritium concentration measured within 200-UP during 2016 was 260,000 pCi/L in well 699-36-66B, a slight decline from 271,000 pCi/L in 2015.
11.4.2 216-S-25 Crib Tritium exceeds the cleanup level in wells downgradient of the 216-S-25 Crib. The maximum tritium concentration in this area during 2016 was 96,500 pCi/L in well 299-W22-85, east of the SX Tank Farm and 240 m (790 ft) downgradient from the crib, and part of an increasing trend. Radioactive liquid effluent was discharged to the 216-S-25 Crib from 1973 through 1980, and effluent from a P&T system at the 216-U-1 and 216-U-2 Cribs was discharged to 216-S-25 for 6 months during 1985. The crib received an estimated 3,600 Ci of tritium (Appendix C in RPP-26744).
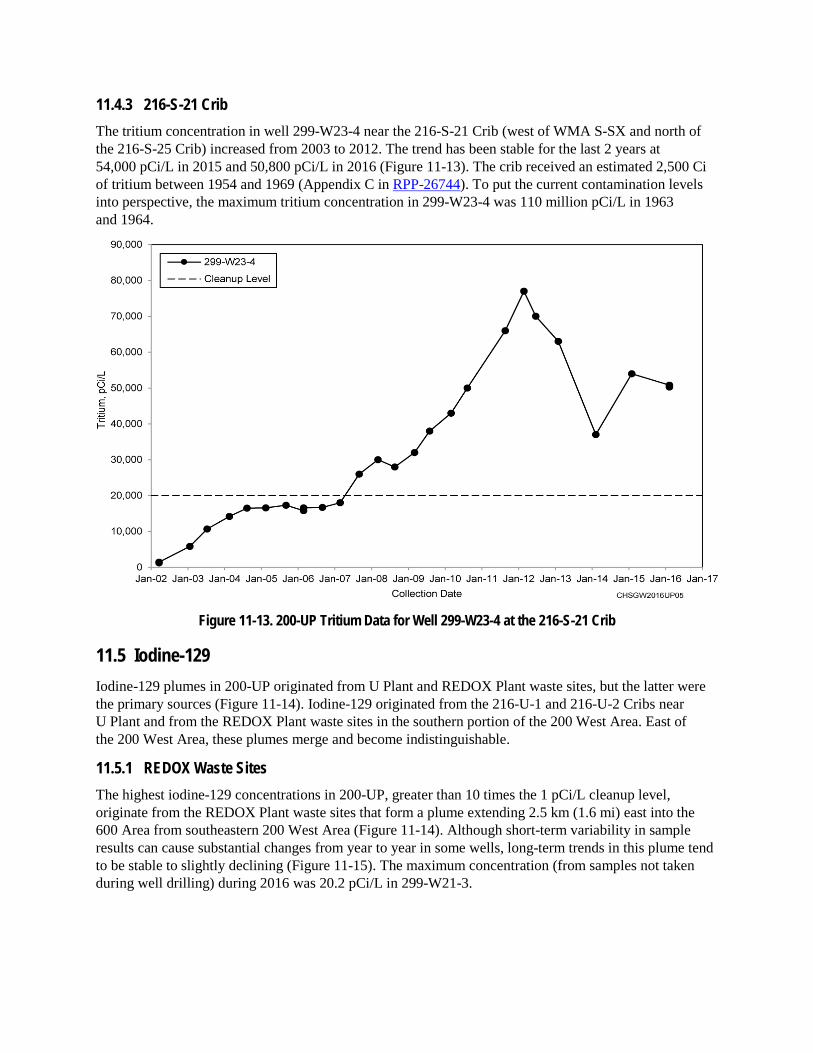
11.4.3 216-S-21 Crib The tritium concentration in well 299-W23-4 near the 216-S-21 Crib (west of WMA S-SX and north of the 216-S-25 Crib) increased from 2003 to 2012. The trend has been stable for the last 2 years at 54,000 pCi/L in 2015 and 50,800 pCi/L in 2016 (Figure 11-13). The crib received an estimated 2,500 Ci of tritium between 1954 and 1969 (Appendix C in RPP-26744). To put the current contamination levels into perspective, the maximum tritium concentration in 299-W23-4 was 110 million pCi/L in 1963 and 1964.
Figure 11-13. 200-UP Tritium Data for Well 299-W23-4 at the 216-S-21 Crib
11.5 Iodine-129 Iodine-129 plumes in 200-UP originated from U Plant and REDOX Plant waste sites, but the latter were the primary sources (Figure 11-14). Iodine-129 originated from the 216-U-1 and 216-U-2 Cribs near U Plant and from the REDOX Plant waste sites in the southern portion of the 200 West Area. East of the 200 West Area, these plumes merge and become indistinguishable.
11.5.1 REDOX Waste Sites The highest iodine-129 concentrations in 200-UP, greater than 10 times the 1 pCi/L cleanup level, originate from the REDOX Plant waste sites that form a plume extending 2.5 km (1.6 mi) east into the 600 Area from southeastern 200 West Area (Figure 11-14). Although short-term variability in sample results can cause substantial changes from year to year in some wells, long-term trends in this plume tend to be stable to slightly declining (Figure 11-15). The maximum concentration (from samples not taken during well drilling) during 2016 was 20.2 pCi/L in 299-W21-3.
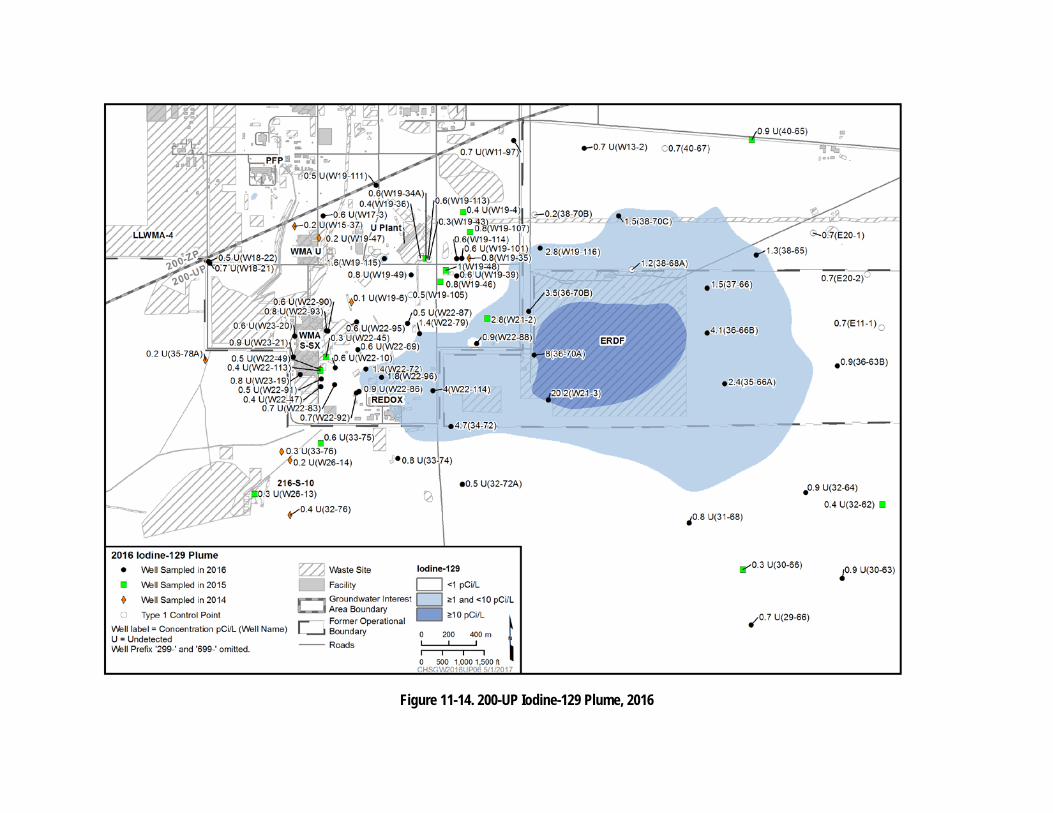
Figure 11-14. 200-UP Iodine-129 Plume, 2016

Figure 11-15. 200-UP Iodine-129 Data for Wells 299-W22-72, 699-36-66B, and 699-36-70A
Two replacement wells were drilled within the iodine-129 plume during 2016. Well 299-W21-3 replaced dry well 699-35-70, and well 299-W22-114 replaced dry well 299-W22-9. Depth profile samples of the aquifer were collected during drilling of the new wells, and the results are shown in Tables 11-4 and 11-5. At well 299-W22-114, the maximum concentration observed during drilling was 4.03 pCi/L in the uppermost sample collected 3.4 m (11 ft) below the water table. This is substantially lower than the 30.1 pCi/L result for the last sample collected from 299-W22-9 in 2005 before it became dry. Because the 2005 result continued to be used for plume mapping until the replacement well was drilled, the region of the plume greater than 10 pCi/L is now smaller than interpreted on previous plume maps (e.g., Figure 11-14 in DOE/RL-2016-09). Concentrations above the 1 pCi/L cleanup level occur in approximately the upper 20 m (70 ft) of the aquifer at well 299-W22-114.
Depth profile samples results for 299-W21-3 indicate that iodine-129 occurs above the 1 pCi/L cleanup level throughout the aquifer thickness (Table 11-4). The highest concentration observed during drilling was 38.9 pCi/L at 15 m (49 ft) below the water table, and the lowest was 2.31 pCi/L at 45.4 m (149 ft) below the water just above the lower mud unit. The maximum concentration is similar to the last sample result from 699-35-70 of 37.1 pCi/L collected in 2008 just before this well became dry. Well 299-W21-3 was screened at the depth of the highest concentration observed during drilling, and the first routine sample collected during December 2016 had a concentration of 20.2 pCi/L.
11.5.2 SX Tank Farm Iodine-129 was previously found to occur beneath the SX Tank Farm at concentrations slightly above the 1 pCi/L cleanup level. The iodine-129 concentration was 2.0 pCi/L in a sample December 2011 sample from well 299-W23-19, located within the tank farm. Concentrations have declined since startup of groundwater extraction in the area during July 2012. In June 2015, the iodine-129 concentration in well 299-W23-19 was 1.6 pCi/L. During 2016, no sample results from wells in this area exceeded the 1 pCi/L cleanup level (iodine-129 was not detected in 299-W23-19). Iodine-129 was detected above the cleanup level at 299-W22-26 (downgradient from the S Tank Farm) before this well became dry (2.8 pCi/L in 2011), but the source was the 216-S-9 Crib. 11.5.3 216-U-1 and 216-U-2 Cribs The maximum iodine-129 concentration downgradient from the 216-U-1 and 216-U-2 Cribs during 2016 was 2.75 pCi/L in the uppermost depth profile sample collected during drilling of well 299-W19-116. The only other well in this area with a concentration above the 1 pCi/L cleanup level during 2016 was well 299-W19-115 at 1.56 pCi/L. The plume from the 216-U-1 and 216-U-2 Cribs is typically at concentrations near 1 pCi/L, so this portion of the plume is interpreted as discontinuous at the 1 pCi/L level (Figure 11-14). The plume is interpreted to occur at a shallow depth near the source to well 299-W19-116, but deepens farther eastward. The plume is fully mixed vertically at well 699-38-70C, 1.8 km (1.1 mi) east of the cribs (this well is screened just above the lower mud unit and had a concentration of 1.51 pCi/L during 2016).
11.6 Nitrate Nitrate plumes in 200-UP originated from U Plant and REDOX Plant disposal facilities, although U Plant sources were more substantial (Appendix C in RPP-26744) (Figure 11-16). The cleanup level for nitrate is 45 mg/L.
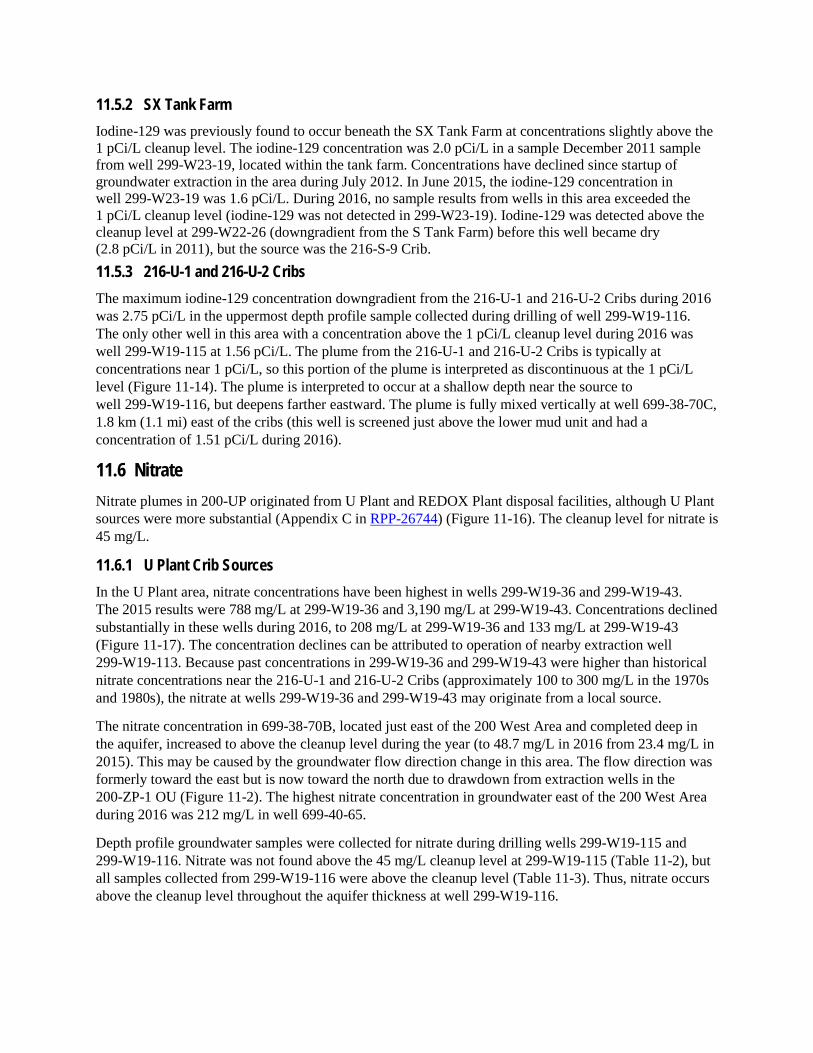
11.6.1 U Plant Crib Sources In the U Plant area, nitrate concentrations have been highest in wells 299-W19-36 and 299-W19-43. The 2015 results were 788 mg/L at 299-W19-36 and 3,190 mg/L at 299-W19-43. Concentrations declined substantially in these wells during 2016, to 208 mg/L at 299-W19-36 and 133 mg/L at 299-W19-43 (Figure 11-17). The concentration declines can be attributed to operation of nearby extraction well 299-W19-113. Because past concentrations in 299-W19-36 and 299-W19-43 were higher than historical nitrate concentrations near the 216-U-1 and 216-U-2 Cribs (approximately 100 to 300 mg/L in the 1970s and 1980s), the nitrate at wells 299-W19-36 and 299-W19-43 may originate from a local source.
The nitrate concentration in 699-38-70B, located just east of the 200 West Area and completed deep in the aquifer, increased to above the cleanup level during the year (to 48.7 mg/L in 2016 from 23.4 mg/L in 2015). This may be caused by the groundwater flow direction change in this area. The flow direction was formerly toward the east but is now toward the north due to drawdown from extraction wells in the 200-ZP-1 OU (Figure 11-2). The highest nitrate concentration in groundwater east of the 200 West Area during 2016 was 212 mg/L in well 699-40-65.
Depth profile groundwater samples were collected for nitrate during drilling wells 299-W19-115 and 299-W19-116. Nitrate was not found above the 45 mg/L cleanup level at 299-W19-115 (Table 11-2), but all samples collected from 299-W19-116 were above the cleanup level (Table 11-3). Thus, nitrate occurs above the cleanup level throughout the aquifer thickness at well 299-W19-116.

Figure 11-16. 200-UP Nitrate Plume, 2016
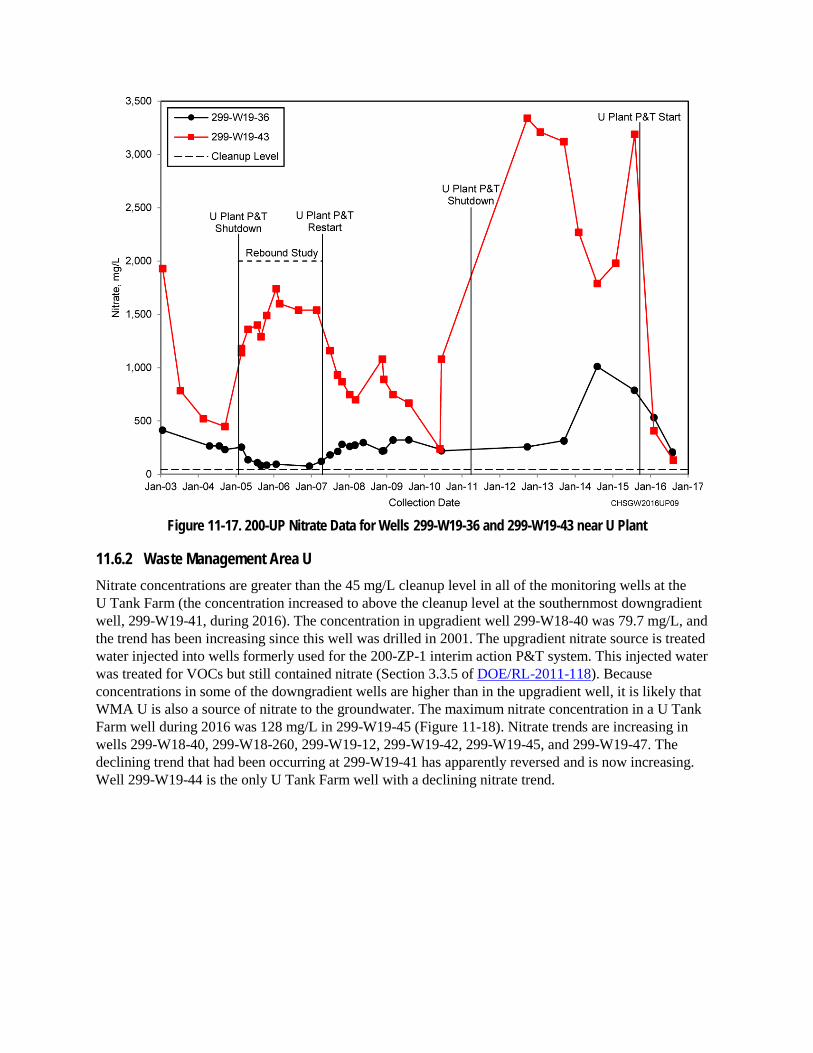
Figure 11-17. 200-UP Nitrate Data for Wells 299-W19-36 and 299-W19-43 near U Plant
11.6.2 Waste Management Area U Nitrate concentrations are greater than the 45 mg/L cleanup level in all of the monitoring wells at the U Tank Farm (the concentration increased to above the cleanup level at the southernmost downgradient well, 299-W19-41, during 2016). The concentration in upgradient well 299-W18-40 was 79.7 mg/L, and the trend has been increasing since this well was drilled in 2001. The upgradient nitrate source is treated water injected into wells formerly used for the 200-ZP-1 interim action P&T system. This injected water was treated for VOCs but still contained nitrate (Section 3.3.5 of DOE/RL-2011-118). Because concentrations in some of the downgradient wells are higher than in the upgradient well, it is likely that WMA U is also a source of nitrate to the groundwater. The maximum nitrate concentration in a U Tank Farm well during 2016 was 128 mg/L in 299-W19-45 (Figure 11-18). Nitrate trends are increasing in wells 299-W18-40, 299-W18-260, 299-W19-12, 299-W19-42, 299-W19-45, and 299-W19-47. The declining trend that had been occurring at 299-W19-41 has apparently reversed and is now increasing. Well 299-W19-44 is the only U Tank Farm well with a declining nitrate trend.
Figure 11-18. 200-UP Nitrate Data for Selected Wells at WMA U
11.6.3 Waste Management Area S-SX/216-S-25 Crib A nitrate plume from the 216-S-25 Crib merges with a plume from the SX Tank Farm. Nitrate concentrations are highest in 299-W23-19 in the SX Tank Farm but declined during the year from 128 mg/L in March to 106 mg/L in December (Figure 11-5). This decline is attributed to operation of the WMA S-SX groundwater extraction system. Nitrate from the WMA has been attributed primarily to a 190,000 L (51,000 gal) leak from tank SX-115 in 1965 (Section 4.3 of RPP-ENV-39658), although there may be contributions from other tank leaks.
A nitrate plume from the S Tank Farm had a 2016 maximum concentration of 102 mg/L at well 299-W22-93. This plume originated from an overfill event at tank S-104 between 1966 and 1970.
11.7 Chromium In 200-UP, two chromium plumes are present at WMA S-SX, and another larger plume is in the 600 Area east and southeast of the 200 West Area (known as the southeast chromium plume). Both total chromium and Cr(VI) are COCs for the 200-UP-1 OU. This section refers to them collectively as “chromium.” Plume maps and graphs show dissolved chromium (i.e., filtered, total chromium and Cr(VI) results). The 200-UP-1 cleanup level for total chromium is 100 µg/L and for Cr(VI) is 48 µg/L.
11.7.1 Waste Management Area S-SX Two chromium plumes are found at WMA S-SX: one downgradient from the SX Tank Farm and one downgradient from the S Tank Farm (Figure 11-19). Chromium concentrations in three wells in the SX Tank Farm plume exceeded the 48 µg/L cleanup level in 2016. The highest concentration was at 299-W23-19, where chromium fluctuated between 143 and 173 µg/L during 2016 (Figure 11-5). Concentrations have declined substantially in this well since the start of groundwater extraction (e.g., the concentration was as high as 1,150 µg/L during 2012). A declining trend was also noted at 299-W22-83, where the concentration was 73 µg/L during 2016, down from 181 µg/L during 2015 (Figure 11-20). These declining trends are attributed to operation of the WMA S-SX groundwater extraction system. Concentrations also exceeded the cleanup level in 299-W22-116 (129 µg/L), a replacement well for 299-W22-50 that was installed adjacent to extraction well 299-W22-91. Concentrations in extraction wells 299-W22-91 and 299-W22-92 are below the 48 µg/L cleanup level due to concentration averaging (i.e., dilution) as water is drawn into the extraction wells from below the plume. This plume is attributed primarily to a 190,000 L (51,000 gal) leak from tank SX-115 in 1965 (Section 4.3 of RPP-ENV-39658), although there may be contributions from other tank leaks.
The S Tank Farm chromium plume originated from an overfill event at tank S-104 between 1966 and 1970. At near-field downgradient well 299-W22-93, located adjacent to extraction well 299-W22-90, the chromium concentration during 2016 was 460 µg/L, an increase from 164 µg/L in 2015. Concentrations in the extraction well are below the 48 µg/L cleanup level due to concentration averaging. The extraction well captures the S Tank Farm chromium plume near the source. Farther downgradient, chromium increased to above the cleanup level at well 299-W22-95 (57.9 µg/L during December 2016) as the portion of the plume that is not captured continues to migrate downgradient. This portion of the plume is expected to disperse naturally to below the cleanup level.
11.7.2 Southeast Plume The southeast chromium plume (Figure 11-21) originated primarily from effluent disposed to the 216-S-20 Crib during the 1950s, although the REDOX Plant ponds and ditches south of the 200 West Area were also sources (Section 4.2.4 of DOE/RL-2009-122). An estimated 5,900 kg of chromium was disposed to the 216-S-20 Crib, and an estimated 3,000 kg was disposed to 216-S-10 Pond and Ditch (Appendix C in RPP-26744, “SIM Production Output Files”).
Historically, the extent of this plume was uncertain due to a lack of monitoring wells, particularly on the south side of the plume. Characterization activities to better define the plume vertical and horizontal extent to focus and optimize the remedial design are described in the 200-UP-1 RD/RAWP (DOE/RL-2013-07). This work was initiated in 2016. Ten wells are planned to be drilled to define the extent of contamination (Figure 11-21). Three of these wells were completed during 2016 (699-29-66, 699-30-57, and 699-31-68), and drilling of two others was in progress at year end (699-30-63 and 699-32-64). The remaining wells will be drilled during 2017.
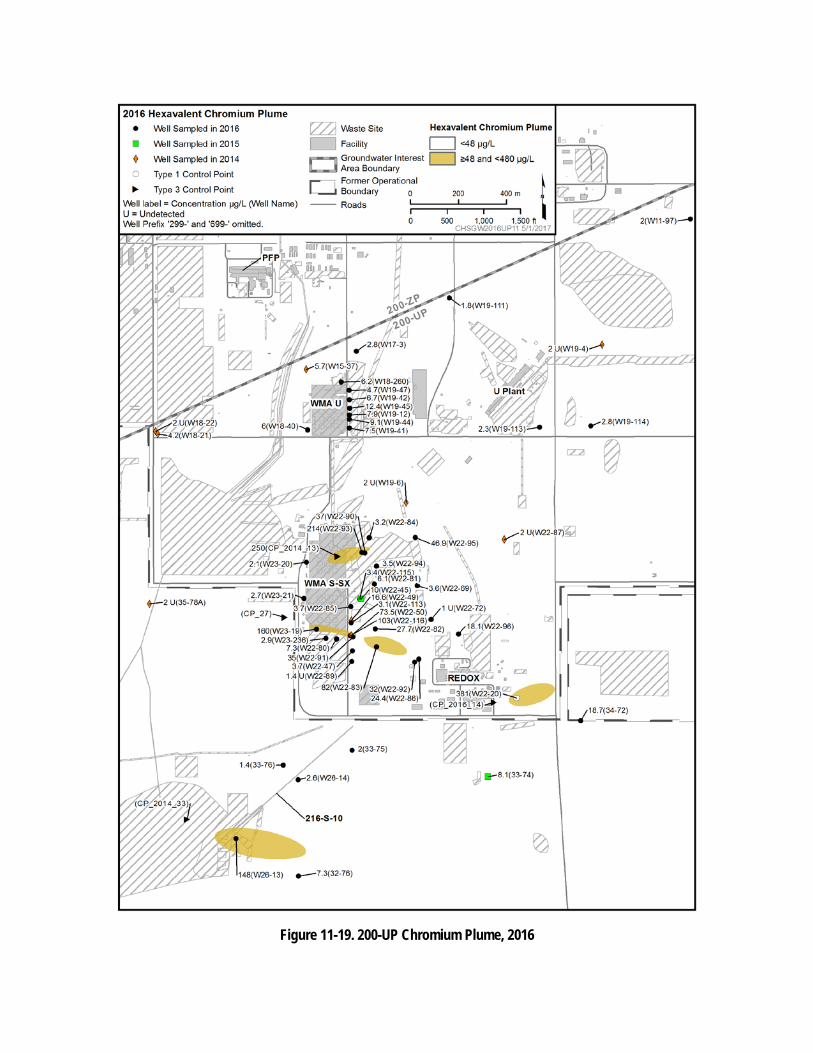
Figure 11-19. 200-UP Chromium Plume, 2016

Figure 11-20. 200-UP Chromium Data for Monitoring Wells 299-W22-47, 299-W22-83, 299-W22-86,
and 299-W22-116 East of WMA S-SX
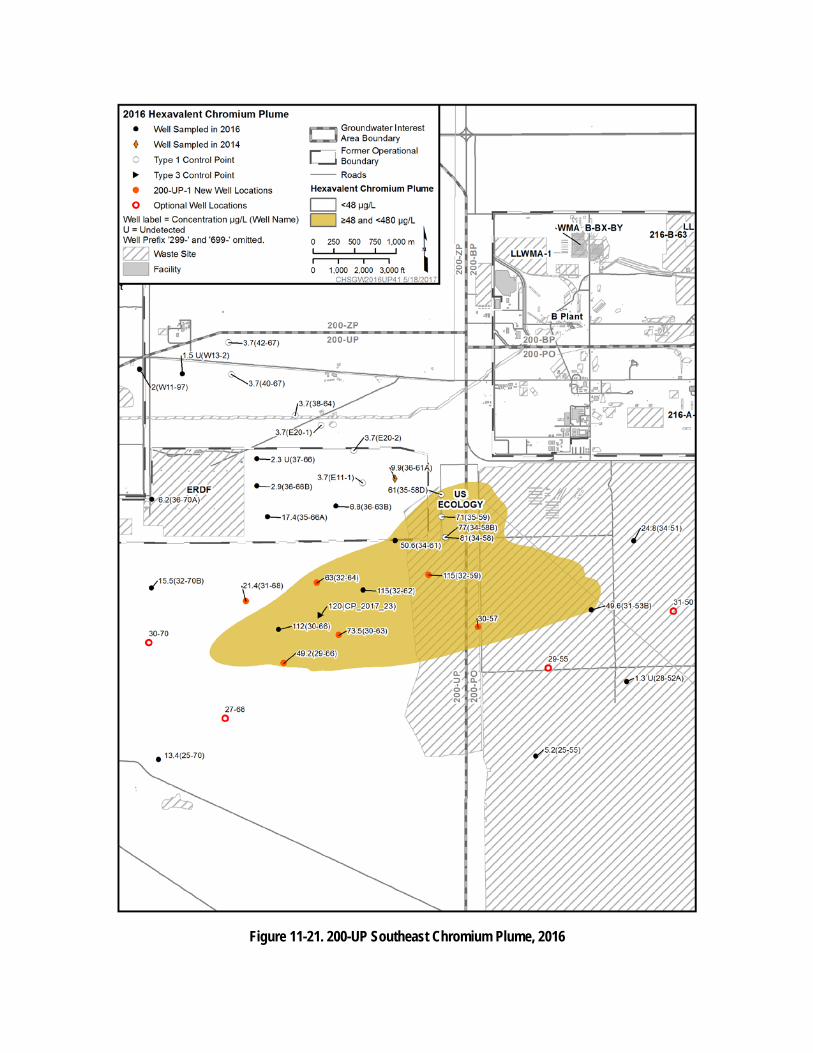
Figure 11-21. 200-UP Southeast Chromium Plume, 2016
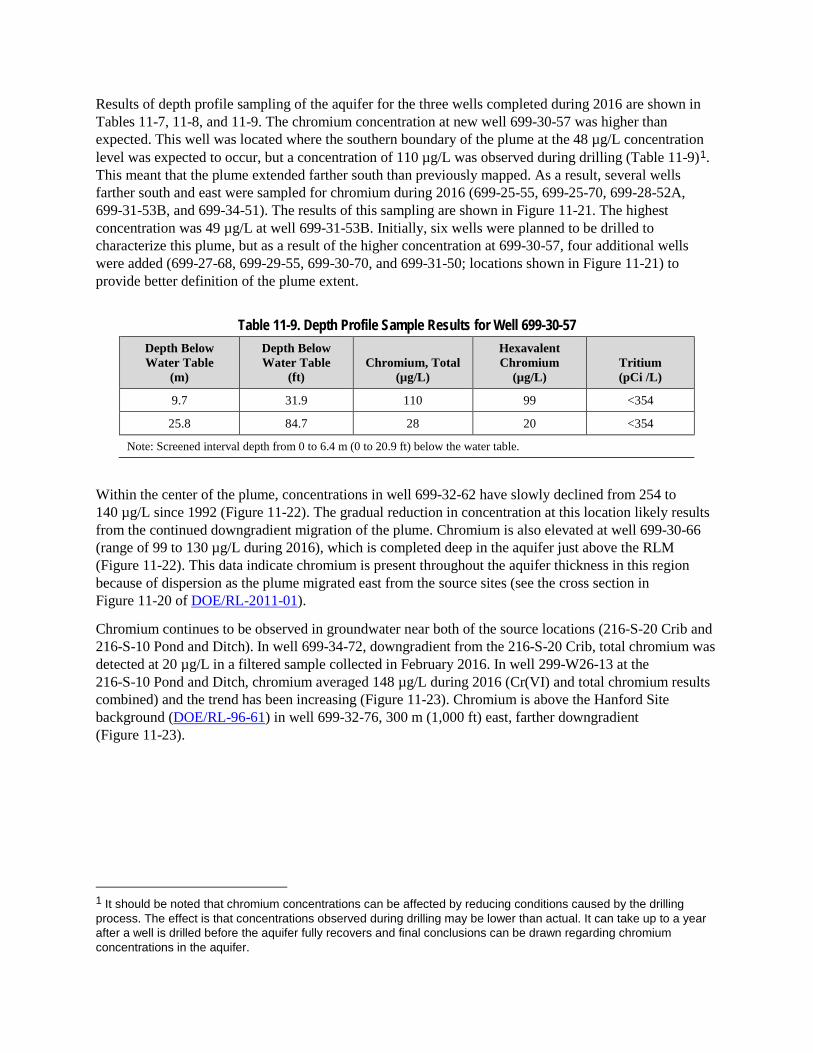
Results of depth profile sampling of the aquifer for the three wells completed during 2016 are shown in Tables 11-7, 11-8, and 11-9. The chromium concentration at new well 699-30-57 was higher than expected. This well was located where the southern boundary of the plume at the 48 µg/L concentration level was expected to occur, but a concentration of 110 µg/L was observed during drilling (Table 11-9)1. This meant that the plume extended farther south than previously mapped. As a result, several wells farther south and east were sampled for chromium during 2016 (699-25-55, 699-25-70, 699-28-52A, 699-31-53B, and 699-34-51). The results of this sampling are shown in Figure 11-21. The highest concentration was 49 µg/L at well 699-31-53B. Initially, six wells were planned to be drilled to characterize this plume, but as a result of the higher concentration at 699-30-57, four additional wells were added (699-27-68, 699-29-55, 699-30-70, and 699-31-50; locations shown in Figure 11-21) to provide better definition of the plume extent.
Table 11-9. Depth Profile Sample Results for Well 699-30-57 Depth Below Water Table
(m)
Depth Below Water Table
(ft) Chromium, Total
(µg/L)
Hexavalent Chromium
(µg/L) Tritium (pCi /L)
9.7 31.9 110 99 <354
25.8 84.7 28 20 <354
Note: Screened interval depth from 0 to 6.4 m (0 to 20.9 ft) below the water table.
Within the center of the plume, concentrations in well 699-32-62 have slowly declined from 254 to 140 µg/L since 1992 (Figure 11-22). The gradual reduction in concentration at this location likely results from the continued downgradient migration of the plume. Chromium is also elevated at well 699-30-66 (range of 99 to 130 µg/L during 2016), which is completed deep in the aquifer just above the RLM (Figure 11-22). This data indicate chromium is present throughout the aquifer thickness in this region because of dispersion as the plume migrated east from the source sites (see the cross section in Figure 11-20 of DOE/RL-2011-01).
Chromium continues to be observed in groundwater near both of the source locations (216-S-20 Crib and 216-S-10 Pond and Ditch). In well 699-34-72, downgradient from the 216-S-20 Crib, total chromium was detected at 20 µg/L in a filtered sample collected in February 2016. In well 299-W26-13 at the 216-S-10 Pond and Ditch, chromium averaged 148 µg/L during 2016 (Cr(VI) and total chromium results combined) and the trend has been increasing (Figure 11-23). Chromium is above the Hanford Site background (DOE/RL-96-61) in well 699-32-76, 300 m (1,000 ft) east, farther downgradient (Figure 11-23).
1 It should be noted that chromium concentrations can be affected by reducing conditions caused by the drilling process. The effect is that concentrations observed during drilling may be lower than actual. It can take up to a year after a well is drilled before the aquifer fully recovers and final conclusions can be drawn regarding chromium concentrations in the aquifer.
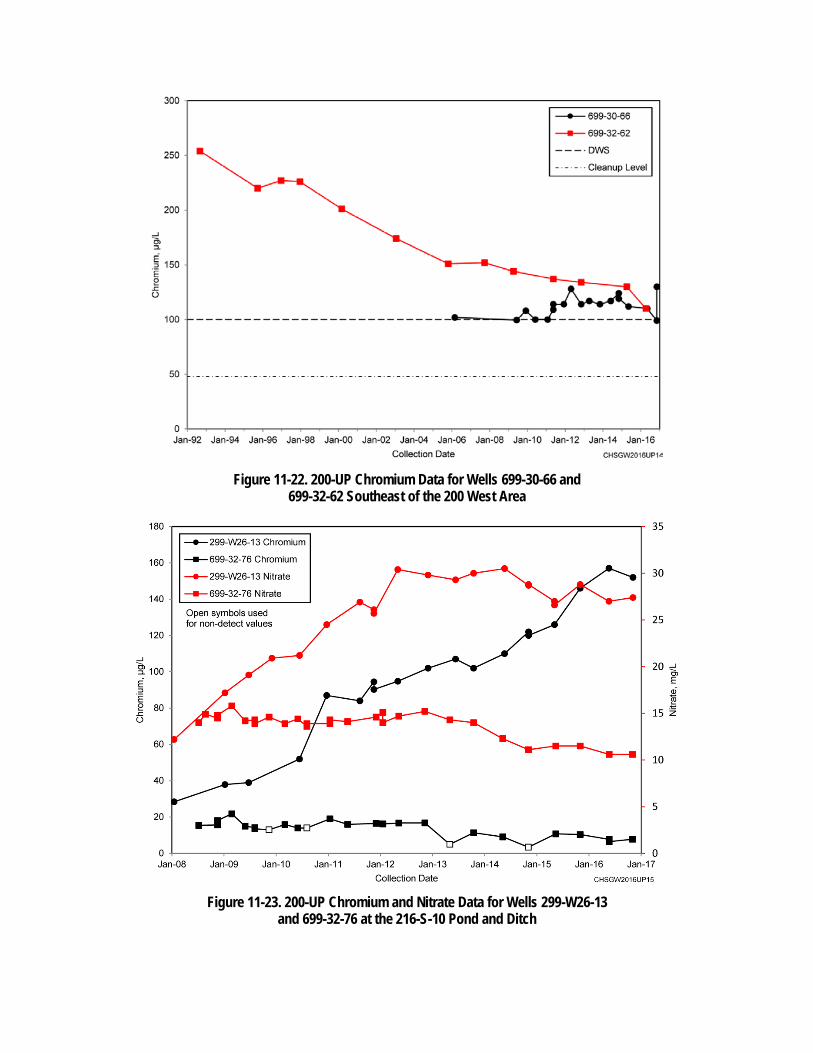
Figure 11-22. 200-UP Chromium Data for Wells 699-30-66 and 699-32-62 Southeast of the 200 West Area
Figure 11-23. 200-UP Chromium and Nitrate Data for Wells 299-W26-13
and 699-32-76 at the 216-S-10 Pond and Ditch

11.8 Carbon Tetrachloride Concentrations of carbon tetrachloride at concentrations above the 3.4 µg/L cleanup level are widespread in 200-UP groundwater. Concentrations were more than 10 times the cleanup level in 26 wells and were above the cleanup level in 43 of the 61 wells sampled for carbon tetrachloride in 2016. In the southern 200 West Area, the plume extends up to 1.7 km (1.1 mi) east into the 600 Area (Figure 11-24). The plume originated from PFP waste disposal sites in 200-ZP. Some of the ditches from PFP extended to U Pond, which may also have been a carbon tetrachloride source. In the eastern portion of the plume, concentrations increase with depth (Figure 11-21 in DOE/RL-2011-01). The highest carbon tetrachloride concentration in 200-UP during 2016 was 801 µg/L at well 299-W14-71, which is screened at the bottom of the unconfined aquifer. The second highest concentration was 490 µg/L in well 299-W17-3, an extraction well for the 200 West P&T. Chapter 12 provides additional information regarding carbon tetrachloride in the 200 West Area.
Chloroform is a degradation product of carbon tetrachloride and tends to be found in the same wells. This suggests that natural degradation of carbon tetrachloride may be occurring, although chloroform was also introduced to the aquifer from the 2607-Z Tile Field (Section 12.2.8 in DOE/RL-2011-01). During 2016, chloroform concentrations did not exceed the DWS (80 µg/L for total trihalomethanes) in 200-UP. The maximum concentration was 14 µg/L in well 299-W14-71. Depth-discrete sampling during well drilling showed that chloroform concentrations tend to increase with depth, similar to carbon tetrachloride.
11.9 Trichloroethene TCE is found in groundwater in the northern portion of 200-UP (Figure 11-25). Depth-discrete samples during well drilling show that TCE concentrations increase with depth, similar to carbon tetrachloride and chloroform. During 2016, TCE was detected in 29 wells in 200-UP, with concentrations exceeding the DWS (5 µg/L) only at wells 299-W14-71 (12.9 µg/L) and 699-38-70B (8.15 µg/L), and in the deeper samples collected during drilling of 299-W19-116 (maximum of 6.3 µg/L). Concentrations exceeded the 1 µg/L cleanup level for the 200-ZP-1 OU in 17 wells in 200-UP. Three of the four TCE degradation products, 1,1-DCE, 1,2-DCE (cis- and trans-), and chloromethane (i.e., vinyl chloride), were also analyzed but not detected during 2016.
11.10 Strontium-90 Well 299-W22-10, located near the 216-S-1 and 216-S-2 Cribs, was sampled for strontium-90 for the first time since 2005. The result was 15.3 pCi/L, above the 8 pCi/L DWS but lower than the previous result of 26.8 pCi/L in December 2005. Concentrations in this well have been declining since the result of 76.2 pCi/L in 2001. The 216-S-1 and 216-S-2 Cribs received highly acidic waste from the REDOX Plant between 1952 and 1956. In 1955, the waste is believed to have corroded the casing of a nearby well (299-W22-3) in 1955 that allowed the effluent to bypass the soil column and flow down the well directly into groundwater. This is the postulated pathway by which strontium-90 reached groundwater at this location.
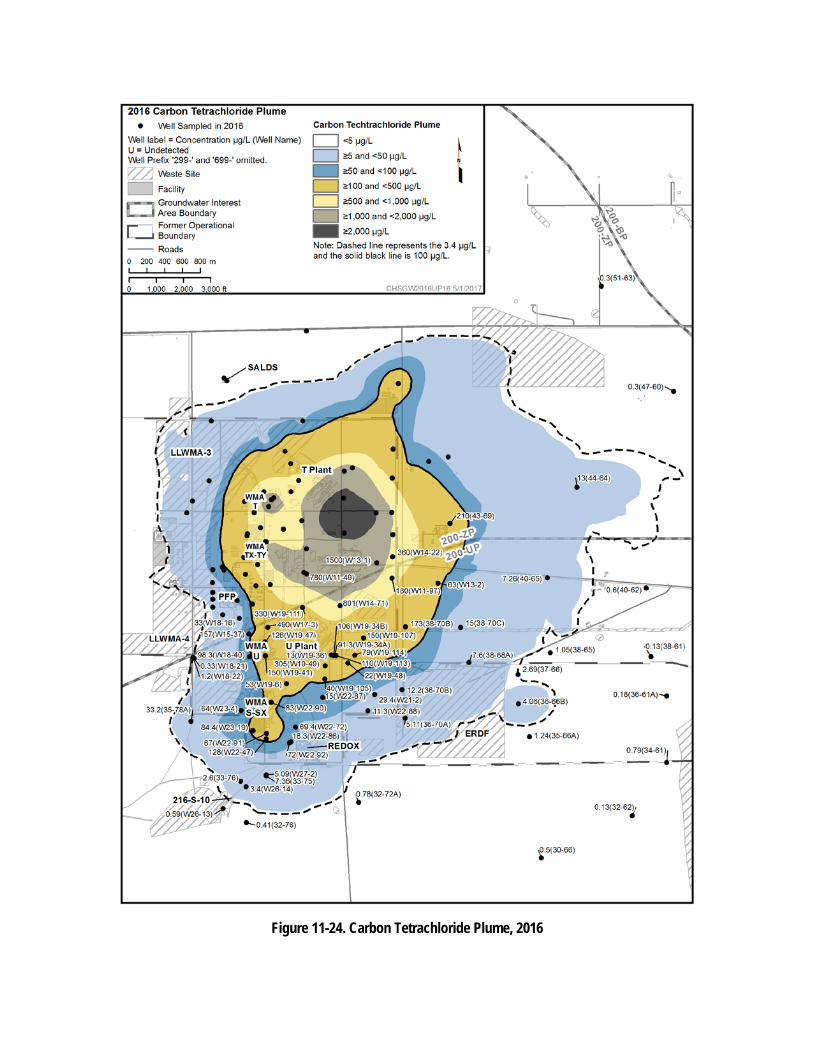
Figure 11-24. Carbon Tetrachloride Plume, 2016

Figure 11-25. 200-UP TCE Plume, 2016
11.11 CERCLA Remediation and Monitoring During 2016, the performance monitoring plan was implemented (sample locations are shown in Figure 11-1), four new monitoring wells were constructed to replace wells that had become dry, three wells were constructed to characterize the southeast chromium plume, two other wells in this plume were being drilled at year end, and construction of the ERDF leachate transfer line was completed. Table 11-10 provides a summary of the wells installed during 2016, including vadose zone wells overlying the 200-UP-1 OU.
Table A-13 in Appendix A lists the monitoring network and sampling status for 2016. The fourth CERCLA 5-year review (DOE/RL-2016-01) identified no issues pertaining to the 200-UP-1 OU.
Three active remedies operated in the 200-UP-1 OU during 2016: the WMA S-SX groundwater extraction system, the U Plant area P&T system, and the iodine-129 plume hydraulic control system (extraction and injection well locations are shown in Figure 11-1).
11.11.1 CERCLA Decision Documents and Plans An interim action ROD addressing uranium, technetium-99, total chromium, Cr(VI), carbon tetrachloride, and nitrate in the 200-UP-1 OU was published in September 2012 (EPA et al., 2012). The selected remedy in the ROD consists of the following components:
• Groundwater extraction and treatment with MNA for all COCs, except iodine-129 and tritium
• MNA for the entire tritium plume and parts of the nitrate and carbon tetrachloride plumes not captured by the groundwater extraction remedies
• Hydraulic containment for iodine-129 while treatment technologies are investigated
• Remedy performance monitoring
• Institutional controls
The RD/RAWP (DOE/RL-2013-07) describes implementation of the ROD and addresses the following topics:
• The approach to designing the P&T system for uranium and technetium-99 near U Plant, a P&T system for the chromium plume southeast of the 200 West Area, and an injection well system for hydraulic control of the iodine-129 plume while treatment technologies are investigated
• Continued operation of the groundwater extraction system at the S-SX Tank Farms
• Modifications to the 200 West P&T in 200-ZP to accommodate the additional water and treatment needs to support the 200-UP-1 remedies

Table 11-10. Wells and Boreholes Installed in 200-UP in 2016
Well Name Well ID Purpose
Construction Depth
(m bgs)
Construction Depth (ft bgs)
Drilled Depth
(m bgs)
Drilled Depth (ft bgs)
Acceptance or Decommission
Date Comment
299-W13-2 C9440 200-ZP Monitoringa 122.2 401.0 161.8 531.0 3/21/2016 Installed for 200-ZP-1 OU.
299-W19-115 C9414 Monitoringb 94.6 310.2 110.5 362.6 10/25/2016 --
299-W19-116 C9412 Monitoringb 99.2 325.4 138.0 452.8 6/15/2016 --
299-W21-3 C9415 Monitoringb 100.0 328.0 129.9 426.1 7/25/2016 --
299-W22-114 C9411 Monitoringb 87.8 288.1 140.1 459.8 12/8/2016 --
299-W22-122 C9520 Monitoringc 22.3 73.2 24.7 81.0 4/12/2016 Vadose zone well at 216-U-8 Crib.
699-29-66 C9413 Monitoringb 106.1 347.9 157.5 516.7 10/10/2016 --
699-30-57 C9417 Monitoringb 98.6 323.5 132.9 436.0 9/1/2016 Located in 200-PO; installed for 200-UP-1 OU.
699-31-68 C9416 Monitoringb 92.2 302.3 135.4 444.2 10/6/2016 --
C9512 C9512 200-DV-1 Characterizationd
N/A N/A 43.3 142.0 9/28/2016 Unsuccessful.e Decommissioned.
C9514 C9514 200-DV-1 Characterizationd
N/A N/A 38.9 127.6 9/28/2016 Decommissioned.
a. DOE/RL-2009-115, Performance Monitoring Plan for the 200-ZP-1 Groundwater Operable Unit Remedial Action b. DOE/RL-2014-27, Sampling and Analysis Plan for Remediation Wells in the 200-UP-1 Operable Unit. c. DOE/RL-2010-87, Field Test Plan for the Uranium Sequestration Pilot Test. d. DOE/RL-2011-104, Characterization Sampling and Analysis Plan for the 200-DV-1 Operable Unit. e. Borehole could not be drilled to desired depth. N/A = not applicable

Implementation of the RD/RAWP began in 2014, and the following activities were completed during 2016:
• A revision of the well drilling SAP (DOE/RL-2014-27, Sampling and Analysis Plan for Remediation Wells in the 200-UP-1 Operable Unit) was prepared to include new monitoring wells for remedy performance monitoring and wells to characterization the southeast chromium plume
• Continued operation of the U Plant area uranium/technetium-99 groundwater extraction system
• Continued operation of the iodine-129 plume hydraulic containment system
• Continued operation of the WMA S-SX technetium-99 groundwater extraction system
• Continued progress on finalizing the iodine-129 treatment technology evaluation plan
• Continued compilation of the iodine-129 plume conceptual model and related iodine species attenuation and transport characteristics
11.11.2 U Plant Area Pump and Treat This remedy addresses uranium, technetium-99, carbon tetrachloride, and nitrate contamination near U Plant. The system consists of two extraction wells (299-W19-113 and 299-W19-114) that began operating in September 2015. Flow rates during 2016 averaged 203 L/min (53.6 gal/min) for 299-W19-113 and 368 L/min (97.3 gal/min) at well 299-W19-114. A total of 301 million L (79.5 million gal) of groundwater was pumped during 2016. In addition, 9.9 kg of uranium, 0.47 Ci of technetium-99, 48,800 kg of nitrate, and 24.4 kg of carbon tetrachloride were removed from the aquifer. Since startup in 2015, 11.7 kg of uranium, 0.66 Ci of technetium-99, 71,100 kg of nitrate, and 29.7 kg of carbon tetrachloride have been removed from the aquifer (Table 11-11).
Table 11-11. 200-UP-1 Remedy Summary Iodine-129 Plume Hydraulic Containment (2015-2016)
Injection wells 3 Average flow rate in 2016, L/min (gal/min) 506 (134)
Monitored Natural Attenuation (2015-2016) Dispersion of all contaminants of concern Radioactive decay of tritium
Current P&T Systems P&T System Uranium Plume Extraction, 2016 S-SX Extraction, 2016 Design capacity (L/min [gal/min]) 568 (150) 303 (80) Extraction wells 2 3 Volume extracted (million L [million gal]) 301 (79.5) 167 (44.1) Mass of uranium removed, kg 9.9 N/A Mass (activity) of Tc-99 removed, g (Ci) 27.5 (0.47) 22.3 (0.38) Mass of nitrate removed, kg 71,100 4,190 Mass of carbon tetrachloride removed, kg 24.4 11.4 Mass of chromium removed, kg N/A 5.4
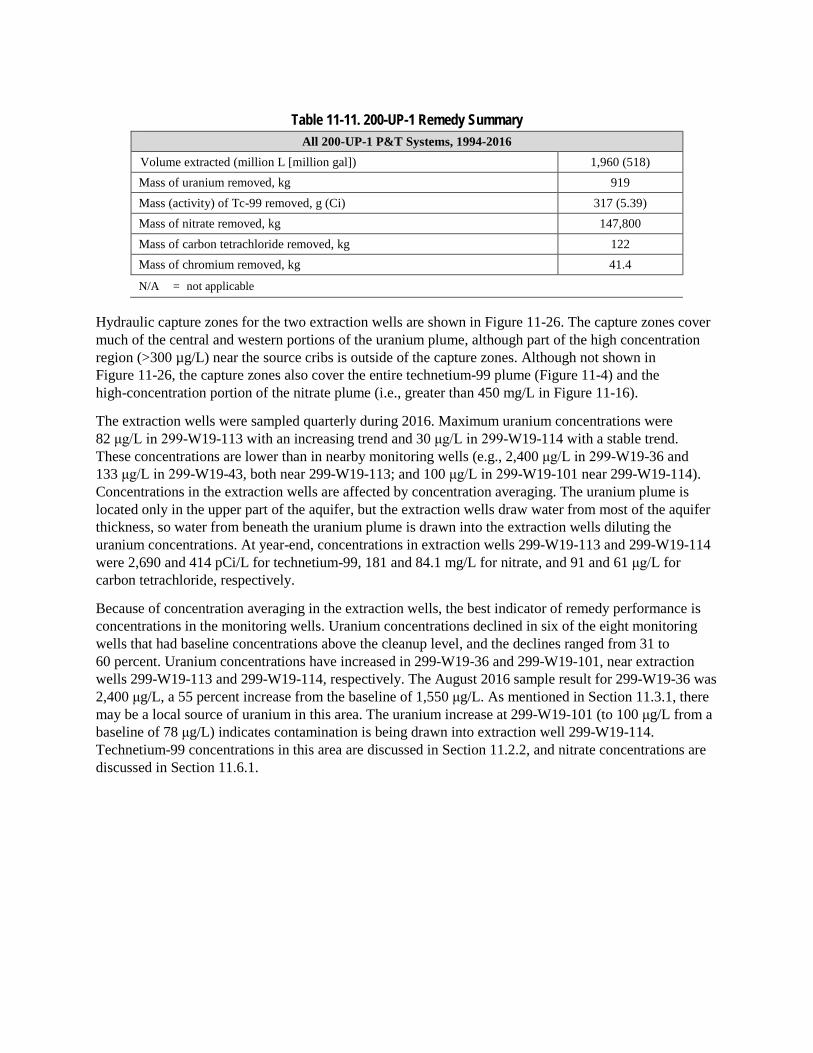
Table 11-11. 200-UP-1 Remedy Summary All 200-UP-1 P&T Systems, 1994-2016
Volume extracted (million L [million gal]) 1,960 (518) Mass of uranium removed, kg 919 Mass (activity) of Tc-99 removed, g (Ci) 317 (5.39) Mass of nitrate removed, kg 147,800 Mass of carbon tetrachloride removed, kg 122 Mass of chromium removed, kg 41.4
N/A = not applicable
Hydraulic capture zones for the two extraction wells are shown in Figure 11-26. The capture zones cover much of the central and western portions of the uranium plume, although part of the high concentration region (>300 µg/L) near the source cribs is outside of the capture zones. Although not shown in Figure 11-26, the capture zones also cover the entire technetium-99 plume (Figure 11-4) and the high-concentration portion of the nitrate plume (i.e., greater than 450 mg/L in Figure 11-16).
The extraction wells were sampled quarterly during 2016. Maximum uranium concentrations were 82 μg/L in 299-W19-113 with an increasing trend and 30 μg/L in 299-W19-114 with a stable trend. These concentrations are lower than in nearby monitoring wells (e.g., 2,400 μg/L in 299-W19-36 and 133 μg/L in 299-W19-43, both near 299-W19-113; and 100 μg/L in 299-W19-101 near 299-W19-114). Concentrations in the extraction wells are affected by concentration averaging. The uranium plume is located only in the upper part of the aquifer, but the extraction wells draw water from most of the aquifer thickness, so water from beneath the uranium plume is drawn into the extraction wells diluting the uranium concentrations. At year-end, concentrations in extraction wells 299-W19-113 and 299-W19-114 were 2,690 and 414 pCi/L for technetium-99, 181 and 84.1 mg/L for nitrate, and 91 and 61 μg/L for carbon tetrachloride, respectively.
Because of concentration averaging in the extraction wells, the best indicator of remedy performance is concentrations in the monitoring wells. Uranium concentrations declined in six of the eight monitoring wells that had baseline concentrations above the cleanup level, and the declines ranged from 31 to 60 percent. Uranium concentrations have increased in 299-W19-36 and 299-W19-101, near extraction wells 299-W19-113 and 299-W19-114, respectively. The August 2016 sample result for 299-W19-36 was 2,400 μg/L, a 55 percent increase from the baseline of 1,550 μg/L. As mentioned in Section 11.3.1, there may be a local source of uranium in this area. The uranium increase at 299-W19-101 (to 100 μg/L from a baseline of 78 μg/L) indicates contamination is being drawn into extraction well 299-W19-114. Technetium-99 concentrations in this area are discussed in Section 11.2.2, and nitrate concentrations are discussed in Section 11.6.1.

Figure 11-26. 200-UP Groundwater Capture Zones for the Uranium Plume Remedy

Drawdown of the water table due to startup of this groundwater extraction system in 2015 was analyzed to determine aquifer hydraulic properties. Drawdown was analyzed for the wells with automated water level recorders: 299-W19-36, 299-W19-48, 299-W19-101, and 299-W19-107. The average results were a transmissivity of 220 m2/day, a hydraulic conductivity of 4.7 m/day, and a specific yield of 0.12 (ECF-200UP1-16-0135, Determination of Unconfined Aquifer Hydraulic Properties from Startup of the U Plant Area Pump and Treat System). These results are within the ranges expected.
More details regarding the U Plant area groundwater extraction system are provided in the 2016 annual P&T system report (DOE/RL-2016-69). 11.11.3 S-SX Pump and Treat The WMA S-SX groundwater extraction system began operating in July 2012 and consists of extraction wells 299-W22-90, 299-W22-91, and 299-W22-92 (Figure 11-27). Extracted water is pumped to the 200 West P&T. During 2016, the combined flow rate from the extraction wells averaged 317 L/min (83.7 gal/min). A total of 167 million L (44.1 million gal) was pumped during 2016; and 0.38 Ci of technetium-99, 4,190 kg of nitrate, 5.4 kg of chromium, and 11.4 kg of carbon tetrachloride were removed from the aquifer (Table 11-11). Since startup, the system has extracted 677 million L (179 million gal) of groundwater and removed 2.56 Ci of technetium-99; 27,510 kg of nitrate; 41.4 kg of chromium; and 50.9 kg of carbon tetrachloride from the aquifer.
This system was specifically designed to capture the high-concentration portions of the technetium-99 plume. As shown by the hydraulic capture zones in Figure 11-27, the extraction wells are capturing almost all of the plume above 900 pCi/L near the sources in the S and SX Tank Farms. Because the plume from the S Tank Farm is smaller than the SX Tank Farm plume, 299-W22-90 (downgradient from the S Tank Farm) is pumped at a lower rate (average of 90.9 L/min [24.0 gal/min] when operating during 2016). Average pumping rates during 2016 for the extraction wells in the SX Tank Farm plume (299-W22-91 and 299-W22-92) when operating were 129 L/min (34.1 gal/min) and 125 L/min (33.1 gal/min), respectively.
Concentrations of chromium, nitrate, and technetium-99 in the extraction wells have declined since pumping began. The declines are due to a combination of removal of contaminant mass/activity from the aquifer and concentration averaging (i.e., dilution) as water is drawn into the extraction wells from outside the plumes (vertically and laterally). WMA S-SX extraction well screens are slightly longer than the monitoring wells (up to 15 m [50 ft] for the extraction wells versus 11 m [35 ft] for the monitoring wells). A more important factor in the dilution is the convergence of streamlines to the extraction well screens laterally and vertically from areas of lower concentration because the wells are actively pumping. For this reason, concentrations in the monitoring wells are the best indicator of remedy performance.
The groundwater extraction system has reduced chromium, nitrate, and technetium-99 concentrations in many of the monitoring wells. Considering those wells that had baseline concentrations above a cleanup level, chromium has declined in 4 of 6 wells, nitrate has declined in 10 of 12 wells, and technetium-99 has declined in 7 of 9 wells. Most of the concentration increases occurred in wells adjacent to extraction wells (e.g., 299-W22-93 and 299-W22-116), indicating that contamination is migrating toward the extraction wells or in wells monitoring the portion of the plumes not being captured (e.g., 299-W22-95 and 299-W22-96). The chromium concentration increased to above the 48 μg/L cleanup level at well 299-W22-95 (57.9 μg/L from a baseline of 9.9 μg/L). Nitrate also rose above the 45 mg/L cleanup level (62 mg/L from a baseline of 39.8 mg/L), and technetium-99 is near the cleanup level (893 pCi/L from a baseline of 310 pCi/L). This well is downgradient of the S Tank Farm and monitors the portion of the plume downgradient from the capture zone for well 299-W22-90. Chromium, nitrate, and technetium-99 concentrations have also increased at 299-W22-96 (only technetium-99 is above a cleanup level; 2,580 pCi/L during 2016) as the portion of the plume from the SX Tank Farm not being captured migrates downgradient. The plumes not being captured are expected to naturally disperse to below cleanup levels.
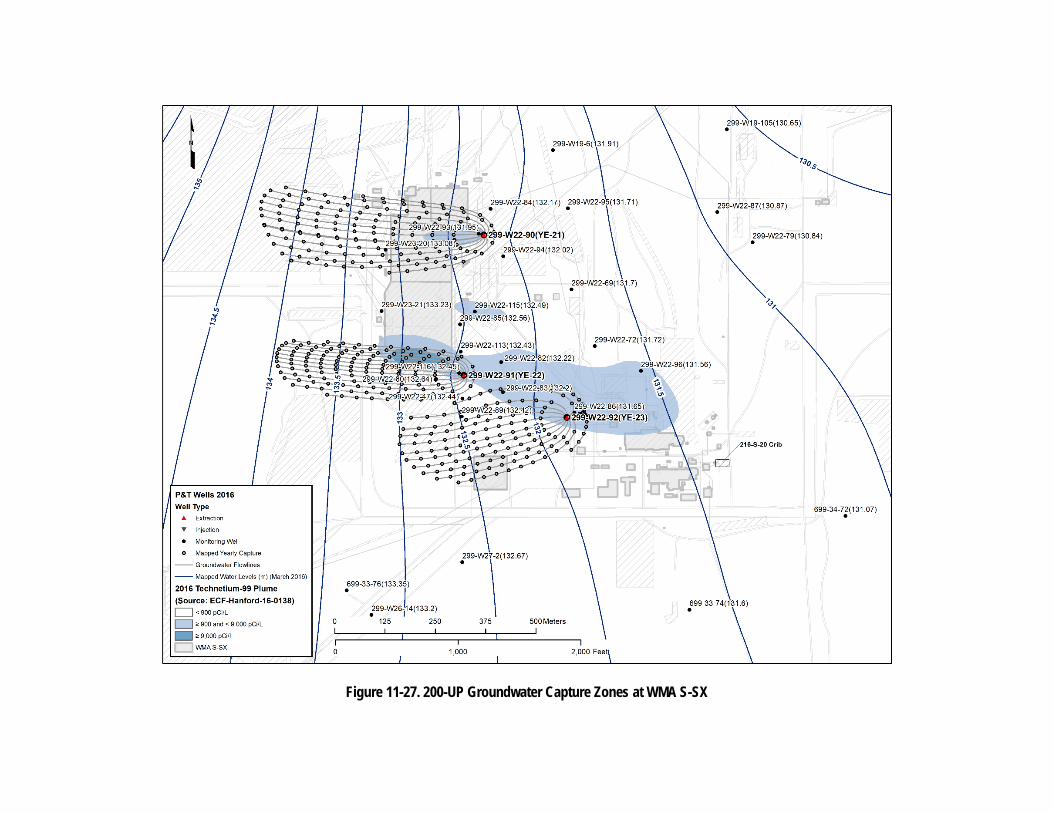
Figure 11-27. 200-UP Groundwater Capture Zones at WMA S-SX
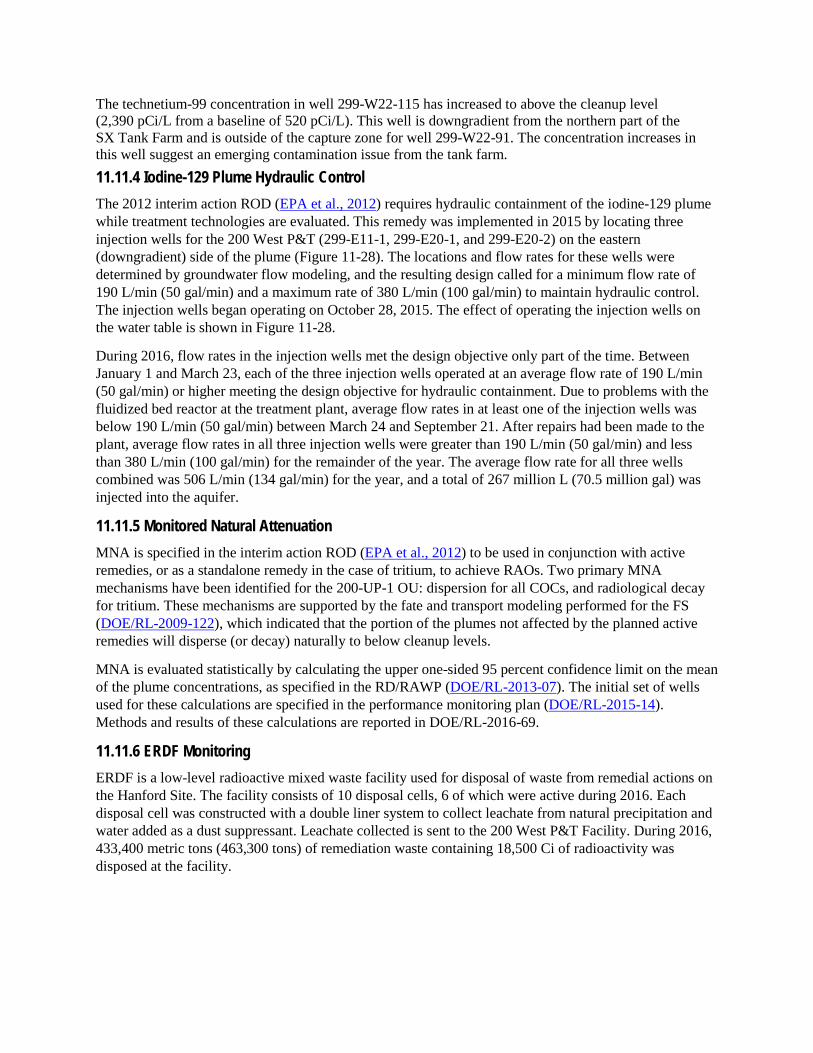
The technetium-99 concentration in well 299-W22-115 has increased to above the cleanup level (2,390 pCi/L from a baseline of 520 pCi/L). This well is downgradient from the northern part of the SX Tank Farm and is outside of the capture zone for well 299-W22-91. The concentration increases in this well suggest an emerging contamination issue from the tank farm. 11.11.4 Iodine-129 Plume Hydraulic Control The 2012 interim action ROD (EPA et al., 2012) requires hydraulic containment of the iodine-129 plume while treatment technologies are evaluated. This remedy was implemented in 2015 by locating three injection wells for the 200 West P&T (299-E11-1, 299-E20-1, and 299-E20-2) on the eastern (downgradient) side of the plume (Figure 11-28). The locations and flow rates for these wells were determined by groundwater flow modeling, and the resulting design called for a minimum flow rate of 190 L/min (50 gal/min) and a maximum rate of 380 L/min (100 gal/min) to maintain hydraulic control. The injection wells began operating on October 28, 2015. The effect of operating the injection wells on the water table is shown in Figure 11-28.
During 2016, flow rates in the injection wells met the design objective only part of the time. Between January 1 and March 23, each of the three injection wells operated at an average flow rate of 190 L/min (50 gal/min) or higher meeting the design objective for hydraulic containment. Due to problems with the fluidized bed reactor at the treatment plant, average flow rates in at least one of the injection wells was below 190 L/min (50 gal/min) between March 24 and September 21. After repairs had been made to the plant, average flow rates in all three injection wells were greater than 190 L/min (50 gal/min) and less than 380 L/min (100 gal/min) for the remainder of the year. The average flow rate for all three wells combined was 506 L/min (134 gal/min) for the year, and a total of 267 million L (70.5 million gal) was injected into the aquifer.
11.11.5 Monitored Natural Attenuation MNA is specified in the interim action ROD (EPA et al., 2012) to be used in conjunction with active remedies, or as a standalone remedy in the case of tritium, to achieve RAOs. Two primary MNA mechanisms have been identified for the 200-UP-1 OU: dispersion for all COCs, and radiological decay for tritium. These mechanisms are supported by the fate and transport modeling performed for the FS (DOE/RL-2009-122), which indicated that the portion of the plumes not affected by the planned active remedies will disperse (or decay) naturally to below cleanup levels.
MNA is evaluated statistically by calculating the upper one-sided 95 percent confidence limit on the mean of the plume concentrations, as specified in the RD/RAWP (DOE/RL-2013-07). The initial set of wells used for these calculations are specified in the performance monitoring plan (DOE/RL-2015-14). Methods and results of these calculations are reported in DOE/RL-2016-69.
11.11.6 ERDF Monitoring ERDF is a low-level radioactive mixed waste facility used for disposal of waste from remedial actions on the Hanford Site. The facility consists of 10 disposal cells, 6 of which were active during 2016. Each disposal cell was constructed with a double liner system to collect leachate from natural precipitation and water added as a dust suppressant. Leachate collected is sent to the 200 West P&T Facility. During 2016, 433,400 metric tons (463,300 tons) of remediation waste containing 18,500 Ci of radioactivity was disposed at the facility.
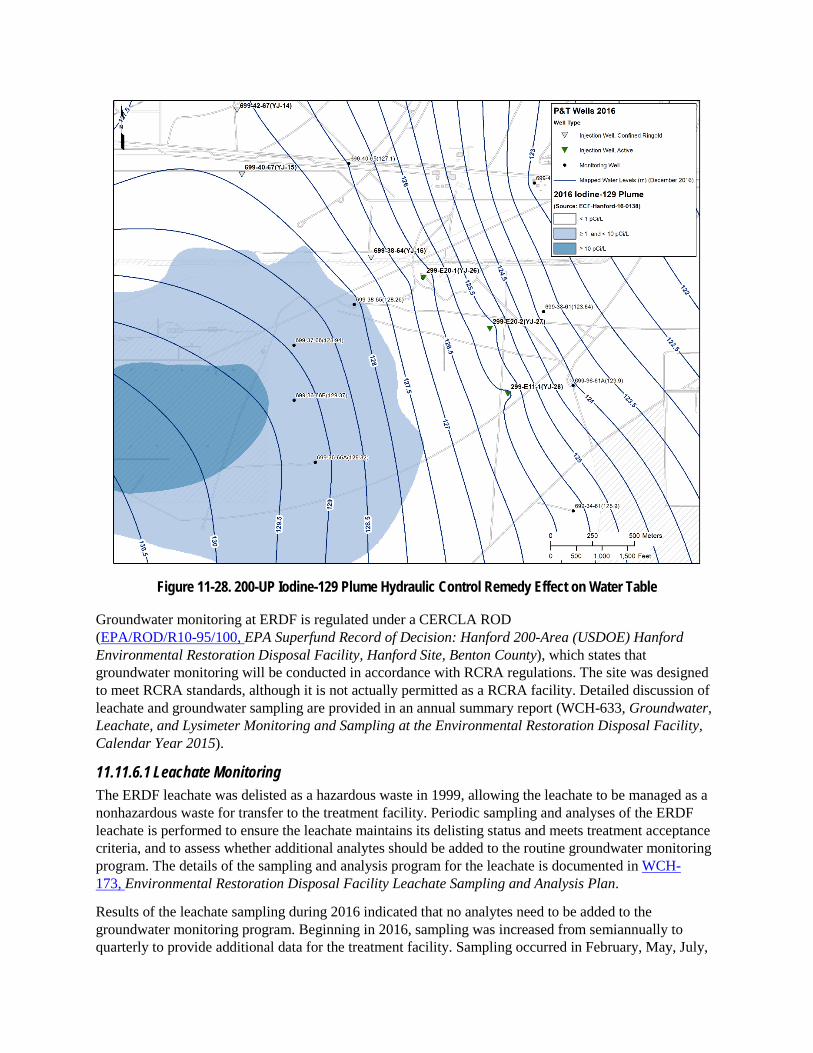
Figure 11-28. 200-UP Iodine-129 Plume Hydraulic Control Remedy Effect on Water Table
Groundwater monitoring at ERDF is regulated under a CERCLA ROD (EPA/ROD/R10-95/100, EPA Superfund Record of Decision: Hanford 200-Area (USDOE) Hanford Environmental Restoration Disposal Facility, Hanford Site, Benton County), which states that groundwater monitoring will be conducted in accordance with RCRA regulations. The site was designed to meet RCRA standards, although it is not actually permitted as a RCRA facility. Detailed discussion of leachate and groundwater sampling are provided in an annual summary report (WCH-633, Groundwater, Leachate, and Lysimeter Monitoring and Sampling at the Environmental Restoration Disposal Facility, Calendar Year 2015).
11.11.6.1 Leachate Monitoring The ERDF leachate was delisted as a hazardous waste in 1999, allowing the leachate to be managed as a nonhazardous waste for transfer to the treatment facility. Periodic sampling and analyses of the ERDF leachate is performed to ensure the leachate maintains its delisting status and meets treatment acceptance criteria, and to assess whether additional analytes should be added to the routine groundwater monitoring program. The details of the sampling and analysis program for the leachate is documented in WCH-173, Environmental Restoration Disposal Facility Leachate Sampling and Analysis Plan.
Results of the leachate sampling during 2016 indicated that no analytes need to be added to the groundwater monitoring program. Beginning in 2016, sampling was increased from semiannually to quarterly to provide additional data for the treatment facility. Sampling occurred in February, May, July,
and November 2016. The July samples were analyzed for the biennial extended analysis list (more than 300 analytes). The other samples were analyzed for the routine list of approximately 50 constituents. No analytes exceeded a delisting level and no significant changes were noted. Chromium remained above one-tenth of the Cr(VI) delisting level, but the upward trend reversed after the May sampling event. Nitrate concentrations remained greater than one-tenth of the delisting value, as they have since monitoring began.
11.11.6.2 Groundwater Sampling Groundwater monitoring at ERDF is performed in accordance with WCH-198, Groundwater Protection Plan for the Environmental Restoration Disposal Facility. The groundwater flow direction is toward the east-northeast. One upgradient well (699-36-70A) and three downgradient wells (699-37-66, 699-36-66B, and 699-35-66A) are sampled semiannually (Figure 11-29), typically in March and September. To detect potential impacts to groundwater quality, sample results are compared to baseline conditions established when monitoring began in 1996 using a tolerance interval approach (WCH-198). All monitoring wells were sampled successfully during 2016.
The results of groundwater monitoring at ERDF continued to indicate the facility has not affected groundwater quality. Several constituents (tritium, iodine-29, nitrate, and carbon tetrachloride) are present in groundwater near or above the 200-UP-1 cleanup levels, but these constituents are elevated in both upgradient and downgradient wells. These plumes originated in the 200 West Area and have migrated toward ERDF. The majority of the analytes have remained essentially on trend, and no significant changes were noted in 2016.
Uranium concentrations at all wells were consistent with Hanford Site background levels. Technetium-99 and gross beta concentrations are trending down in the upgradient well and remained stable in downgradient wells. Technetium 99 and gross beta (affected by technetium-99) in downgradient well 699-35-66A continued to show an upward trend from the low concentration in 2012. The maximum technetium-99 results remain approximately 15 percent of the 200-UP-1 cleanup level.
Chromium concentrations remained stable in the downgradient wells. Chromium levels in downgradient well 699-35-66A remained above the established upper tolerance value but below recent maxima. Maintenance and cleaning activities at well 699-36-70A appear to have returned analytical results for metals to pre-2013 stable levels.
11.12 RCRA Monitoring DOE/RL-2016-66 presents results of RCRA monitoring on the Hanford Site in 2016. The following subsections describe the results of monitoring in accordance with RCRA regulations at three individual WMAs within 200-UP: WMA S-SX, WMA U, and the 216-S-10 Pond and Ditch. Interim status groundwater quality assessment monitoring is conducted at WMA S-SX and WMA U (40 CFR 265.93(d), “Preparation, Evaluation, and Response,” as referenced by WAC 173-303-400). Interim status detection monitoring for indicator parameter evaluation is conducted at the 216-S-10 Pond and Ditch (40 CFR 265.92, “Sampling and Analysis,” and 40 CFR 265.93(b), as referenced by WAC 173-303-400). Locations of the RCRA sites within the 200-UP groundwater interest area are shown in Figure 11-1.

Reference: NAVD88, North American Vertical Datum of 1988.
Figure 11-29. 200-UP ERDF Monitoring Well Locations
Groundwater data are available in the HEIS database, which is available at https://ehs.hanford.gov/eda. Appendix B includes additional information (including well and constituent lists, groundwater flow rates, and statistical tables). Site analytical data can also be obtained from the PNNL PHOENIX system (http://phoenix.pnnl.gov/).
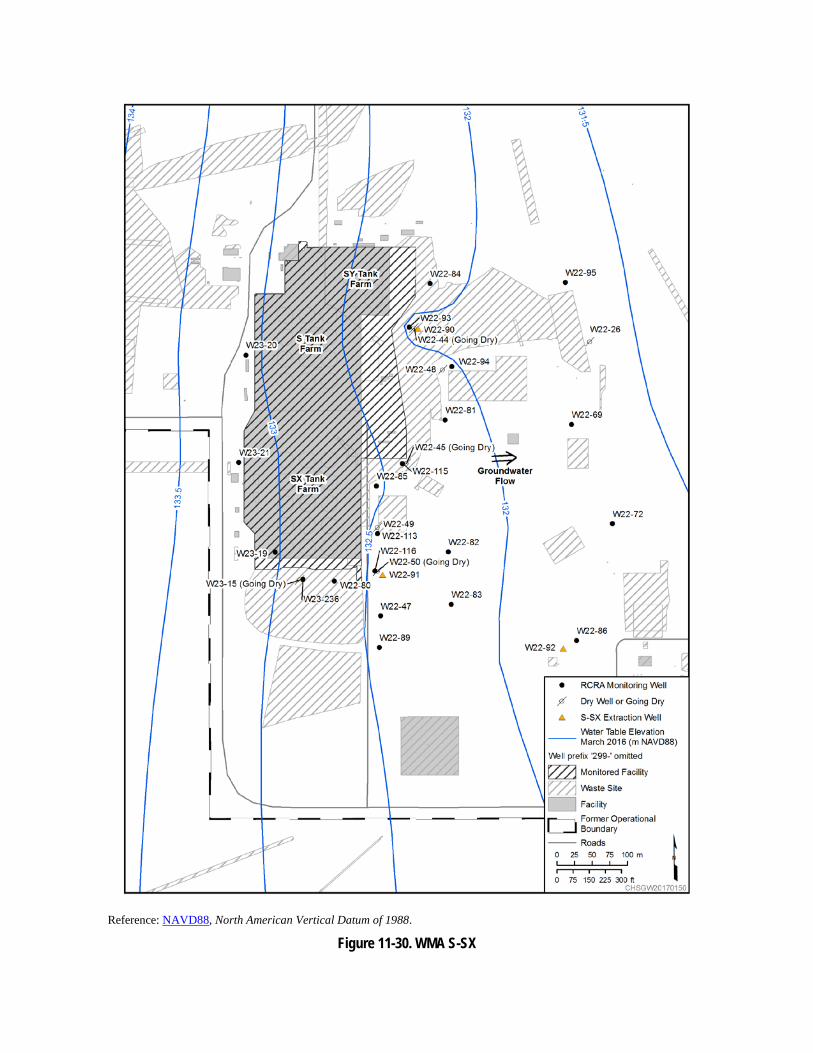
11.12.1 Waste Management Area S-SX WMA S-SX (Figure 11-30) consists of the S and the SX Tank Farms. The S Tank Farm contains 12 SSTs, each with a capacity of 2.9 million L (758,000 gal). The SX Tank Farm contains 15 SSTs, each with a capacity of 3.8 million L (1,000,000 gal) (Section 1.2 of RPP-7884, Field Investigation Report for Waste Management Area S-SX). The WMA also includes the following ancillary equipment: three catch tanks; one receiver tank; six diversion boxes; and associated piping, valve pits, and pumps (Section 1.2 of RPP-7884). Both tank farms received waste from REDOX in the 1950s and 1960s. To minimize the probability and severity of future leaks, most of the drainable liquid in each tank was been removed and transferred to DSTs.
In 1996, at the direction of Ecology, WMA S-SX was placed into assessment status because of elevated specific conductance in downgradient monitoring wells. The first determination assessment found that multiple sources within the WMA had affected groundwater quality with elevated chromium (Chapter 5.0 of PNNL-11810). Monitoring is currently under DOE/RL-2009-73, Interim Status Groundwater Quality Assessment Plan for the Single-Shell Tank Waste Management Area S-SX. The objective of RCRA monitoring at WMA S-SX is to assess the extent and concentration of the dangerous waste constituent chromium in the groundwater and determine its rate of movement.
Table B-79 in Appendix B lists the monitoring wells for WMA S-SX. Two wells were installed in 2013, one well in 2014, and four wells in 2015 to replace wells that had either gone dry or were becoming dry (Table B-79 in Appendix B). No new WMA S-SX wells were installed in 2016. Based on the well distribution compared to the extent of contamination, the current well network is capable of monitoring the distribution of contamination at WMA S-SX, and it will remain in interim status groundwater quality assessment monitoring for 2017.
Water levels in the wells declined an average of 0.18 m/yr (0.60 ft/yr) during 2016. This is less than in 2015 when the decline was 0.36 m/yr (1.17 ft/yr). The groundwater extraction system operating at WMA S-SX had average extraction well flow rates that were lower from September to December 2016 than during the rest of the year, which may partly explain the lower water table decline. Also, the 200 West P&T operated at a lower average rate during 2016, which may also have contributed. Trend surface analyses performed on 10 sets of water-level measurements during 2016 resulted in an estimated hydraulic gradient of 3.5 × 10⁻³ m/m toward the east (86° azimuth). Based on the best estimate values selected for hydraulic conductivity and effective porosity (Table B-80 in Appendix B), the average groundwater flow rate in 2016 was 0.18 m/day (0.59 ft/day), consistent with the 2015 value of 0.17 m/day (0.54 ft/day).
Table B-81 in Appendix B summarizes the assessment data and indicates that the required WMA S-SX sampling was performed in 2016. Groundwater beneath WMA S-SX is contaminated with the dangerous waste constituent chromium. This chromium is attributed to a 91,000 L (24,000 gal) overfill event from tank S-104 in the S Tank Farm (Sections 3.7.2 and 4.6 in RPP-RPT-48589) and a 190,000 L (51,000 gal) leak from tank SX-115 during 1965 in the SX Tank Farm (Section 4.3 of RPP-ENV-39658). Because dissolved chromium is highly mobile in the aquifer, it migrates at the same average flow rate (to the east) as groundwater (0.18 m/day [0.59 ft/day]). Depth-discrete sampling while drilling well 299-W22-47 indicated that chromium was present within the upper 20 m (65 ft) of the aquifer.
Reference: NAVD88, North American Vertical Datum of 1988.
Figure 11-30. WMA S-SX
Groundwater extraction wells 299-W22-90, 299-W22-91, and 299-W22-92 (Figure 11-30), within the WMA S-SX plumes, began pumping in July 2012. Extraction well operation has altered the chromium plumes migration. Instead of moving eastward, some of the chromium is drawn into the extraction wells. In 2016, the P&T continued to remove chromium mass from the aquifer.
The groundwater extraction system has caused chromium to decline in several network wells. Of the six wells that had baseline chromium above the 48 μg/L 200-UP-1 cleanup level prior to the P&T, chromium decreased in wells 299-W22-47, 299-W22-83, 299-W22-86, 299-W22-93, and 299-W23-19 and increased in well 299-W22-116. The increase in 299-W22-116 indicates that chromium is migrating toward the adjacent extraction well 299-W22-91. The chromium in 299-W22-95 has been increasing since it was drilled in 2013; concentrations in June 2016 were 45 μg/L (filtered) and 47 μg/L (unfiltered). This is consistent with migration of the S Tank Farm portion of the plume downgradient from extraction well 299-W22-90. At well 299-W23-19, inside the SX Tank Farm, chromium declined from 205 µg/L in December 2015 to 161 µg/L in December 2016 (Figure 11-5).
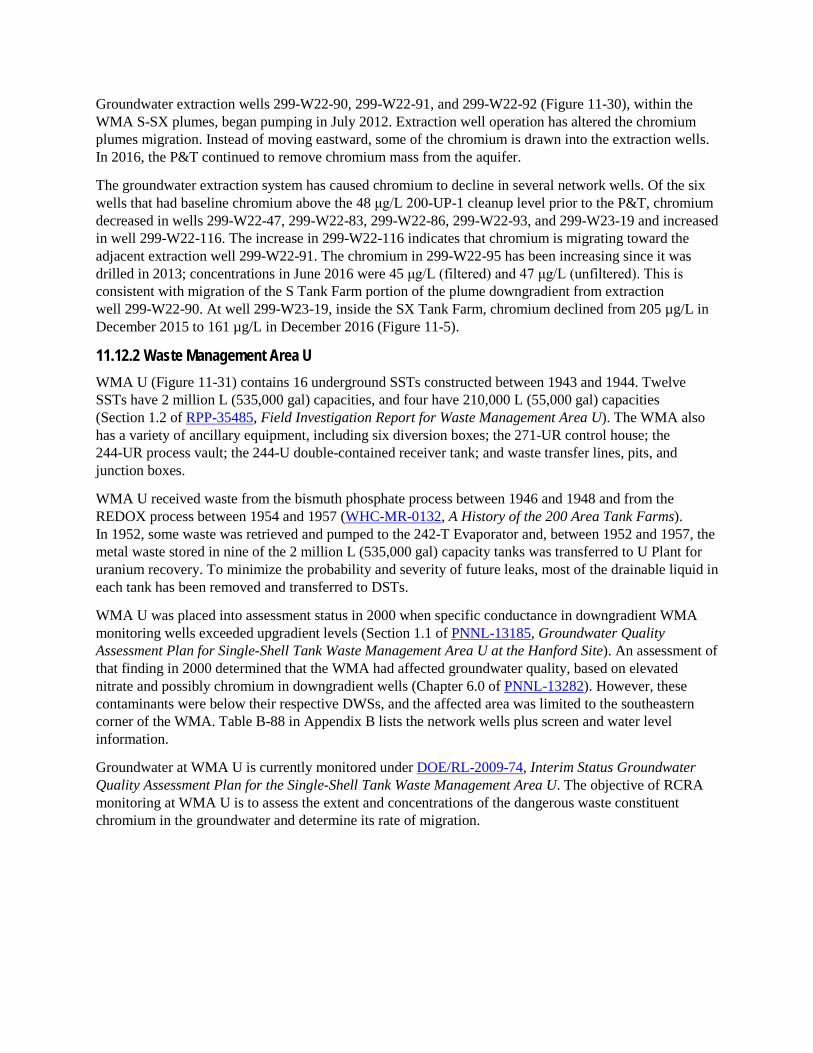
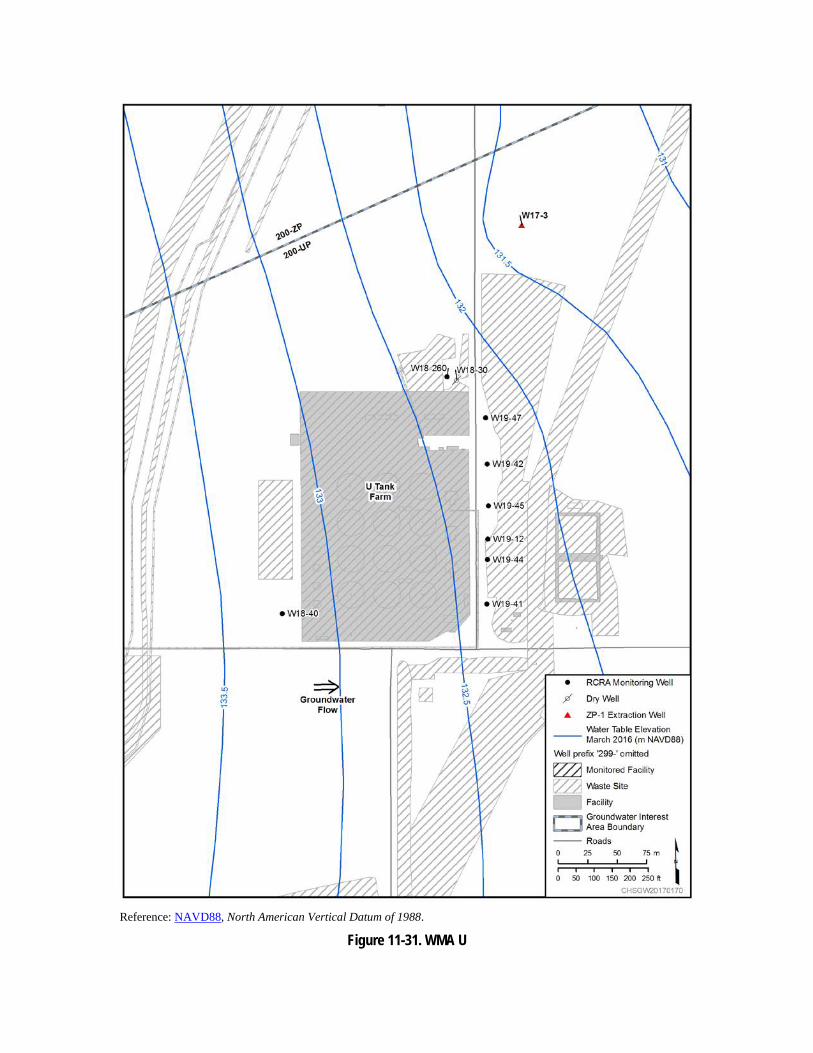
11.12.2 Waste Management Area U WMA U (Figure 11-31) contains 16 underground SSTs constructed between 1943 and 1944. Twelve SSTs have 2 million L (535,000 gal) capacities, and four have 210,000 L (55,000 gal) capacities (Section 1.2 of RPP-35485, Field Investigation Report for Waste Management Area U). The WMA also has a variety of ancillary equipment, including six diversion boxes; the 271-UR control house; the 244-UR process vault; the 244-U double-contained receiver tank; and waste transfer lines, pits, and junction boxes.
WMA U received waste from the bismuth phosphate process between 1946 and 1948 and from the REDOX process between 1954 and 1957 (WHC-MR-0132, A History of the 200 Area Tank Farms). In 1952, some waste was retrieved and pumped to the 242-T Evaporator and, between 1952 and 1957, the metal waste stored in nine of the 2 million L (535,000 gal) capacity tanks was transferred to U Plant for uranium recovery. To minimize the probability and severity of future leaks, most of the drainable liquid in each tank has been removed and transferred to DSTs.
WMA U was placed into assessment status in 2000 when specific conductance in downgradient WMA monitoring wells exceeded upgradient levels (Section 1.1 of PNNL-13185, Groundwater Quality Assessment Plan for Single-Shell Tank Waste Management Area U at the Hanford Site). An assessment of that finding in 2000 determined that the WMA had affected groundwater quality, based on elevated nitrate and possibly chromium in downgradient wells (Chapter 6.0 of PNNL-13282). However, these contaminants were below their respective DWSs, and the affected area was limited to the southeastern corner of the WMA. Table B-88 in Appendix B lists the network wells plus screen and water level information.
Groundwater at WMA U is currently monitored under DOE/RL-2009-74, Interim Status Groundwater Quality Assessment Plan for the Single-Shell Tank Waste Management Area U. The objective of RCRA monitoring at WMA U is to assess the extent and concentrations of the dangerous waste constituent chromium in the groundwater and determine its rate of migration.
Reference: NAVD88, North American Vertical Datum of 1988.
Figure 11-31. WMA U
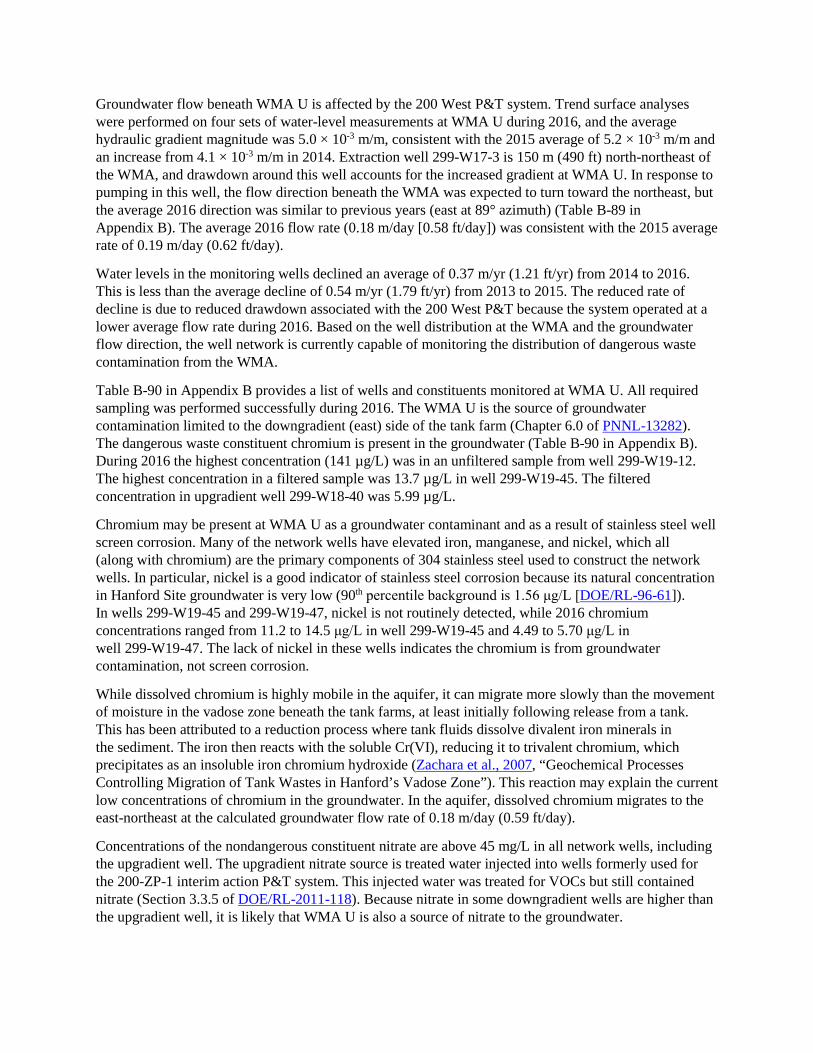
Groundwater flow beneath WMA U is affected by the 200 West P&T system. Trend surface analyses were performed on four sets of water-level measurements at WMA U during 2016, and the average hydraulic gradient magnitude was 5.0 × 10⁻³ m/m, consistent with the 2015 average of 5.2 × 10⁻³ m/m and an increase from 4.1 × 10⁻³ m/m in 2014. Extraction well 299-W17-3 is 150 m (490 ft) north-northeast of the WMA, and drawdown around this well accounts for the increased gradient at WMA U. In response to pumping in this well, the flow direction beneath the WMA was expected to turn toward the northeast, but the average 2016 direction was similar to previous years (east at 89° azimuth) (Table B-89 in Appendix B). The average 2016 flow rate (0.18 m/day [0.58 ft/day]) was consistent with the 2015 average rate of 0.19 m/day (0.62 ft/day).
Water levels in the monitoring wells declined an average of 0.37 m/yr (1.21 ft/yr) from 2014 to 2016. This is less than the average decline of 0.54 m/yr (1.79 ft/yr) from 2013 to 2015. The reduced rate of decline is due to reduced drawdown associated with the 200 West P&T because the system operated at a lower average flow rate during 2016. Based on the well distribution at the WMA and the groundwater flow direction, the well network is currently capable of monitoring the distribution of dangerous waste contamination from the WMA.
Table B-90 in Appendix B provides a list of wells and constituents monitored at WMA U. All required sampling was performed successfully during 2016. The WMA U is the source of groundwater contamination limited to the downgradient (east) side of the tank farm (Chapter 6.0 of PNNL-13282). The dangerous waste constituent chromium is present in the groundwater (Table B-90 in Appendix B). During 2016 the highest concentration (141 µg/L) was in an unfiltered sample from well 299-W19-12. The highest concentration in a filtered sample was 13.7 µg/L in well 299-W19-45. The filtered concentration in upgradient well 299-W18-40 was 5.99 µg/L.
Chromium may be present at WMA U as a groundwater contaminant and as a result of stainless steel well screen corrosion. Many of the network wells have elevated iron, manganese, and nickel, which all (along with chromium) are the primary components of 304 stainless steel used to construct the network wells. In particular, nickel is a good indicator of stainless steel corrosion because its natural concentration in Hanford Site groundwater is very low (90th percentile background is 1.56 μg/L [DOE/RL-96-61]). In wells 299-W19-45 and 299-W19-47, nickel is not routinely detected, while 2016 chromium concentrations ranged from 11.2 to 14.5 μg/L in well 299-W19-45 and 4.49 to 5.70 μg/L in well 299-W19-47. The lack of nickel in these wells indicates the chromium is from groundwater contamination, not screen corrosion.
While dissolved chromium is highly mobile in the aquifer, it can migrate more slowly than the movement of moisture in the vadose zone beneath the tank farms, at least initially following release from a tank. This has been attributed to a reduction process where tank fluids dissolve divalent iron minerals in the sediment. The iron then reacts with the soluble Cr(VI), reducing it to trivalent chromium, which precipitates as an insoluble iron chromium hydroxide (Zachara et al., 2007, “Geochemical Processes Controlling Migration of Tank Wastes in Hanford’s Vadose Zone”). This reaction may explain the current low concentrations of chromium in the groundwater. In the aquifer, dissolved chromium migrates to the east-northeast at the calculated groundwater flow rate of 0.18 m/day (0.59 ft/day).
Concentrations of the nondangerous constituent nitrate are above 45 mg/L in all network wells, including the upgradient well. The upgradient nitrate source is treated water injected into wells formerly used for the 200-ZP-1 interim action P&T system. This injected water was treated for VOCs but still contained nitrate (Section 3.3.5 of DOE/RL-2011-118). Because nitrate in some downgradient wells are higher than the upgradient well, it is likely that WMA U is also a source of nitrate to the groundwater.
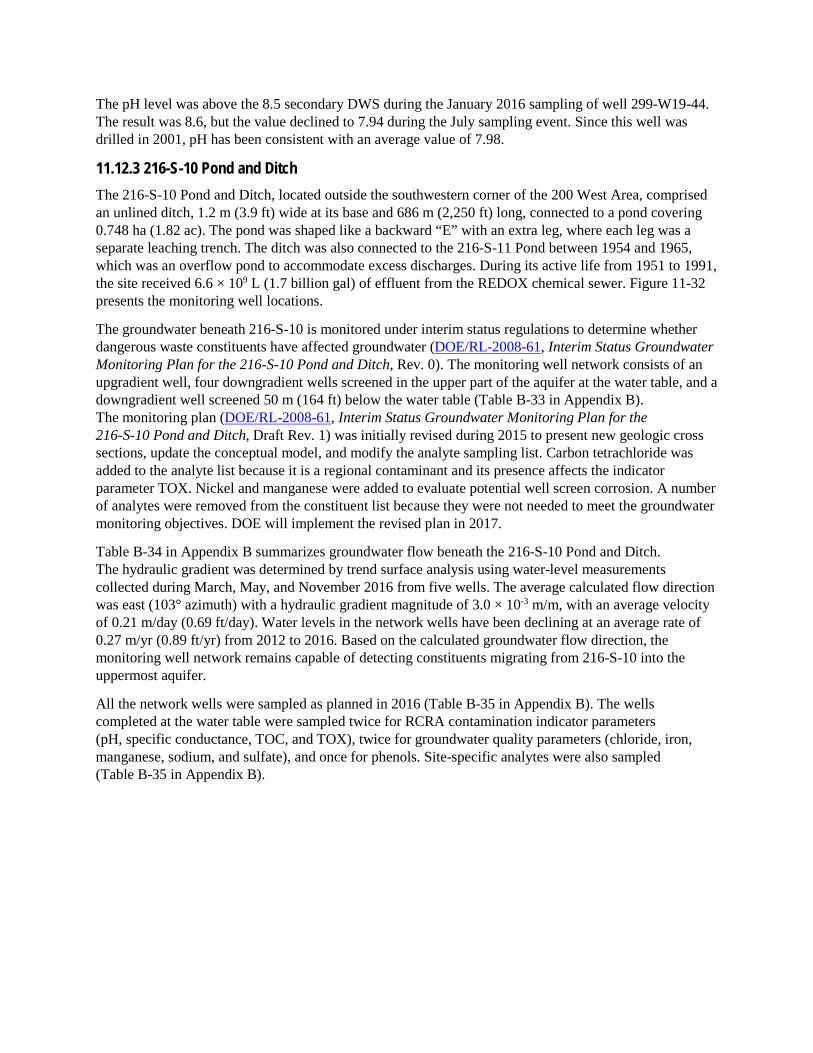
The pH level was above the 8.5 secondary DWS during the January 2016 sampling of well 299-W19-44. The result was 8.6, but the value declined to 7.94 during the July sampling event. Since this well was drilled in 2001, pH has been consistent with an average value of 7.98.
11.12.3 216-S-10 Pond and Ditch The 216-S-10 Pond and Ditch, located outside the southwestern corner of the 200 West Area, comprised an unlined ditch, 1.2 m (3.9 ft) wide at its base and 686 m (2,250 ft) long, connected to a pond covering 0.748 ha (1.82 ac). The pond was shaped like a backward “E” with an extra leg, where each leg was a separate leaching trench. The ditch was also connected to the 216-S-11 Pond between 1954 and 1965, which was an overflow pond to accommodate excess discharges. During its active life from 1951 to 1991, the site received 6.6 × 10⁹ L (1.7 billion gal) of effluent from the REDOX chemical sewer. Figure 11-32 presents the monitoring well locations.
The groundwater beneath 216-S-10 is monitored under interim status regulations to determine whether dangerous waste constituents have affected groundwater (DOE/RL-2008-61, Interim Status Groundwater Monitoring Plan for the 216-S-10 Pond and Ditch, Rev. 0). The monitoring well network consists of an upgradient well, four downgradient wells screened in the upper part of the aquifer at the water table, and a downgradient well screened 50 m (164 ft) below the water table (Table B-33 in Appendix B). The monitoring plan (DOE/RL-2008-61, Interim Status Groundwater Monitoring Plan for the 216-S-10 Pond and Ditch, Draft Rev. 1) was initially revised during 2015 to present new geologic cross sections, update the conceptual model, and modify the analyte sampling list. Carbon tetrachloride was added to the analyte list because it is a regional contaminant and its presence affects the indicator parameter TOX. Nickel and manganese were added to evaluate potential well screen corrosion. A number of analytes were removed from the constituent list because they were not needed to meet the groundwater monitoring objectives. DOE will implement the revised plan in 2017.
Table B-34 in Appendix B summarizes groundwater flow beneath the 216-S-10 Pond and Ditch. The hydraulic gradient was determined by trend surface analysis using water-level measurements collected during March, May, and November 2016 from five wells. The average calculated flow direction was east (103° azimuth) with a hydraulic gradient magnitude of 3.0 × 10⁻³ m/m, with an average velocity of 0.21 m/day (0.69 ft/day). Water levels in the network wells have been declining at an average rate of 0.27 m/yr (0.89 ft/yr) from 2012 to 2016. Based on the calculated groundwater flow direction, the monitoring well network remains capable of detecting constituents migrating from 216-S-10 into the uppermost aquifer.
All the network wells were sampled as planned in 2016 (Table B-35 in Appendix B). The wells completed at the water table were sampled twice for RCRA contamination indicator parameters (pH, specific conductance, TOC, and TOX), twice for groundwater quality parameters (chloride, iron, manganese, sodium, and sulfate), and once for phenols. Site-specific analytes were also sampled (Table B-35 in Appendix B).
Reference: NAVD88, North American Vertical Datum of 1988.
Figure 11-32. 216-S-10 Pond and Ditch
No indicator parameter critical mean exceedances occurred in 2016. Between 2007 and 2012, specific conductance generally trended upward in well 299-W26-13 from annual average values of 270 to 310 µS/cm. This increasing trend correlated to increasing chromium and nitrate concentrations. From 2012 through 2016, specific conductance has been relatively stable, consistent with a stable to slightly declining nitrate trend. However, chromium has continued to increase in well 299-W26-13 and exceeded the 100 µg/L total chromium DWS (157 µg/L maximum in May 2016). The 216-S-10 Pond and Ditch system was the most substantial source of chromium in this area (Appendix C of RPP-26744), but other sources of chromium (216-S-5 Crib, 216-S-6 Crib, 216-S-11, 216-S-16, and 216-S-17 Ponds, and associated ditches) also exist. In particular, the chromium may also originate from the 216-S-11 overflow pond, which received some of the same waste as 216-S-10, but is not part of the RCRA unit.
The network monitoring wells routinely show low levels of TOX. The highest average concentration from quadruplicate samples was in downgradient well 699-33-75 (5.82 µg/L in May 2016), below the critical mean (49.28 µg/L). The TOX detections are attributed to carbon tetrachloride in several 216-S-10 wells. Well 699-33-75 had the highest carbon tetrachloride in the network (7.36 µg/L in 2016). This is above the 3.4 µg/L cleanup level for the 200-UP-1 OU. Carbon tetrachloride is also detected in upgradient well 699-33-76 (2.60 µg/L in 2016). This constituent does not originate from 216-S-10, but is widespread in the groundwater beneath and near the 200 West Area and originates from waste disposal sites at PFP (DOE/RL-2016-09, Chapter 12).
Concentrations of chromium (unfiltered), iron (unfiltered), manganese (unfiltered), and nickel (filtered and unfiltered) continue to be elevated in deep well 299-W27-2. These constituents are stainless steel corrosion products, and this well has stainless steel components. A downhole video of the well screen confirmed that the source of the elevated metals is corrosion. Chromium analysis completed in 2016 includes filtered and unfiltered total chromium, as well as filtered and unfiltered Cr(VI). Total chromium analysis provides a summation of both trivalent chromium, as well as the mobile Cr(VI). The elevated chromium identified in well 299-W27-2 during 2016 comprised primarily undissolved trivalent chromium. Results for dissolved-phase total chromium and both undissolved and dissolved Cr(VI) were near or below the detection limits. The presence of undissolved trivalent chromium is consistent with well corrosion and is not indicative of the Cr(VI) plume present at 216-S-10. The maximum concentration of unfiltered total chromium of 90.1 µg/L in 2016 at well 299-W27-2 is consistent with values attributable to well corrosion.
11.13 Atomic Energy Act Monitoring AEA groundwater monitoring was conducted at 49 groundwater wells in the 200-UP groundwater interest area in accordance with the SAP issued in December 2015 (DOE/RL-2015-56). The primary AEA constituents for 200-UP are iodine-129, nitrate, technetium-99, tritium, and uranium. One well was not sampled in accordance with SAP requirements in 2016 (Table C-10 in Appendix C). Minor exceptions to planned monitoring occurred because of maintenance issues and scheduling constraints. Appendix C lists the sampling frequencies, types of laboratory analyses, and sample status for 2016 AEA monitoring of the 200-UP groundwater wells.
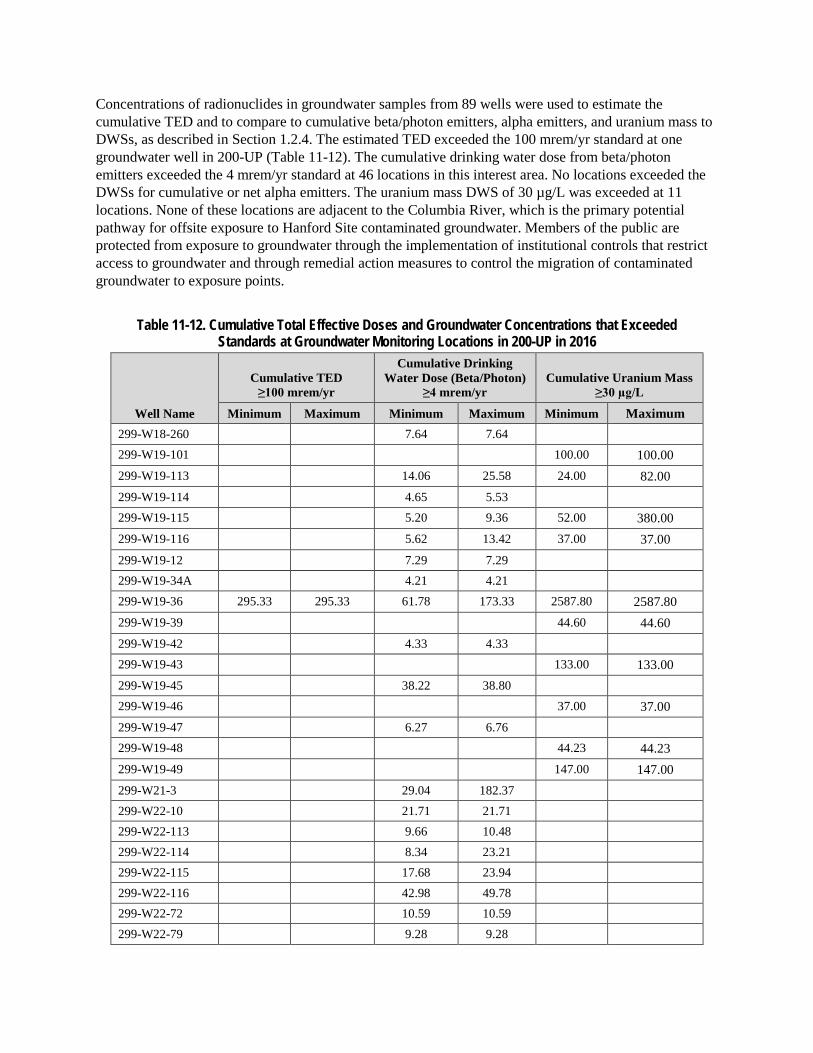
Concentrations of radionuclides in groundwater samples from 89 wells were used to estimate the cumulative TED and to compare to cumulative beta/photon emitters, alpha emitters, and uranium mass to DWSs, as described in Section 1.2.4. The estimated TED exceeded the 100 mrem/yr standard at one groundwater well in 200-UP (Table 11-12). The cumulative drinking water dose from beta/photon emitters exceeded the 4 mrem/yr standard at 46 locations in this interest area. No locations exceeded the DWSs for cumulative or net alpha emitters. The uranium mass DWS of 30 µg/L was exceeded at 11 locations. None of these locations are adjacent to the Columbia River, which is the primary potential pathway for offsite exposure to Hanford Site contaminated groundwater. Members of the public are protected from exposure to groundwater through the implementation of institutional controls that restrict access to groundwater and through remedial action measures to control the migration of contaminated groundwater to exposure points.
Table 11-12. Cumulative Total Effective Doses and Groundwater Concentrations that Exceeded Standards at Groundwater Monitoring Locations in 200-UP in 2016
Well Name
Cumulative TED ≥100 mrem/yr
Cumulative Drinking Water Dose (Beta/Photon)
≥4 mrem/yr Cumulative Uranium Mass
≥30 µg/L
Minimum Maximum Minimum Maximum Minimum Maximum 299-W18-260
7.64 7.64
299-W19-101
100.00 100.00 299-W19-113
14.06 25.58 24.00 82.00
299-W19-114
4.65 5.53
299-W19-115
5.20 9.36 52.00 380.00 299-W19-116
5.62 13.42 37.00 37.00
299-W19-12
7.29 7.29
299-W19-34A
4.21 4.21
299-W19-36 295.33 295.33 61.78 173.33 2587.80 2587.80 299-W19-39
44.60 44.60
299-W19-42
4.33 4.33
299-W19-43
133.00 133.00 299-W19-45
38.22 38.80
299-W19-46
37.00 37.00 299-W19-47
6.27 6.76
299-W19-48
44.23 44.23 299-W19-49
147.00 147.00
299-W21-3
29.04 182.37
299-W22-10
21.71 21.71
299-W22-113
9.66 10.48
299-W22-114
8.34 23.21
299-W22-115
17.68 23.94
299-W22-116
42.98 49.78
299-W22-72
10.59 10.59
299-W22-79
9.28 9.28

Table 11-12. Cumulative Total Effective Doses and Groundwater Concentrations that Exceeded Standards at Groundwater Monitoring Locations in 200-UP in 2016
Well Name
Cumulative TED ≥100 mrem/yr
Cumulative Drinking Water Dose (Beta/Photon)
≥4 mrem/yr Cumulative Uranium Mass
≥30 µg/L
Minimum Maximum Minimum Maximum Minimum Maximum 299-W22-81
4.65 4.65
299-W22-82
9.51 15.16
299-W22-83
21.61 26.39
299-W22-85
19.90 19.90
299-W22-86
12.54 12.54
299-W22-88
5.10 5.10
299-W22-91
13.65 16.62
299-W22-92
10.19 15.35
299-W22-93
6.62 20.89
299-W22-96
11.47 22.20
299-W23-19
6.15 74.67
299-W23-4
10.16 10.16 36.00 36.00 699-31-68
4.40 5.26
699-32-64
4.02 4.02
699-32-72A
7.62 7.62
699-34-72
21.62 21.62
699-35-66A
6.75 27.73
699-36-61A
8.24 8.24
699-36-63B
15.20 24.72
699-36-66B
18.43 70.80
699-36-70A
39.87 40.52
699-36-70B
16.24 16.24
699-37-66
4.87 18.72
699-38-61
14.20 14.20
699-38-65
16.46 16.46
699-38-70C
8.66 8.66
Source: ECF-HANFORD-17-0022, Calculation of Radiological Dose based on Calendar Year 2016 Atomic Energy Act Groundwater Monitoring at Hanford. Notes: Blank cells indicate no exceedances. No wells in 200-UP had cumulative alpha activity ≥15 pCi/L.

This page intentionally left blank.

Contents 11 200-UP ........................................................................................................................................... 11-1
11.1 Overview .............................................................................................................................. 11-1 11.2 Technetium-99...................................................................................................................... 11-4
11.2.1 Waste Management Area S-SX ............................................................................. 11-4 11.2.2 216-U-1 and 216-U-2 Cribs ................................................................................... 11-9 11.2.3 Waste Management Area U ................................................................................. 11-11
11.3 Uranium .............................................................................................................................. 11-12 11.3.1 216-U-1 and 216-U-2 Cribs Plume ...................................................................... 11-12 11.3.2 U Pond ................................................................................................................. 11-12
11.4 Tritium ................................................................................................................................ 11-15 11.4.1 Eastern High-Concentration Area ........................................................................ 11-15 11.4.2 216-S-25 Crib ...................................................................................................... 11-18 11.4.3 216-S-21 Crib ...................................................................................................... 11-19
11.5 Iodine-129 .......................................................................................................................... 11-19 11.5.1 REDOX Waste Sites ............................................................................................ 11-19 11.5.2 SX Tank Farm ..................................................................................................... 11-22 11.5.3 216-U-1 and 216-U-2 Cribs ................................................................................. 11-22
11.6 Nitrate ................................................................................................................................. 11-22 11.6.1 U Plant Crib Sources ........................................................................................... 11-22 11.6.2 Waste Management Area U ................................................................................. 11-24 11.6.3 Waste Management Area S-SX/216-S-25 Crib ................................................... 11-25
11.7 Chromium ........................................................................................................................... 11-25 11.7.1 Waste Management Area S-SX ........................................................................... 11-26 11.7.2 Southeast Plume .................................................................................................. 11-26
11.8 Carbon Tetrachloride .......................................................................................................... 11-32 11.9 Trichloroethene .................................................................................................................. 11-32 11.10 Strontium-90 ....................................................................................................................... 11-32 11.11 CERCLA Remediation and Monitoring ............................................................................. 11-35
11.11.1 CERCLA Decision Documents and Plans ........................................................... 11-35 11.11.2 U Plant Area Pump and Treat .............................................................................. 11-37 11.11.3 S-SX Pump and Treat .......................................................................................... 11-40 11.11.4 Iodine-129 Plume Hydraulic Control .................................................................. 11-42 11.11.5 Monitored Natural Attenuation ............................................................................ 11-42 11.11.6 ERDF Monitoring ................................................................................................ 11-42
11.12 RCRA Monitoring .............................................................................................................. 11-44 11.12.1 Waste Management Area S-SX ........................................................................... 11-46
11.12.2 Waste Management Area U ................................................................................. 11-48 11.12.3 216-S-10 Pond and Ditch..................................................................................... 11-51
11.13 Atomic Energy Act Monitoring ......................................................................................... 11-53
Figures
Figure 11-1. 200-UP Sampling Locations, 2016 ..................................................................................... 11-2 Figure 11-2. 200-UP Water Table Map, March 2016 .............................................................................. 11-5 Figure 11-3. 200-UP Plume Areas ........................................................................................................... 11-6 Figure 11-4. 200-UP Technetium-99 Plume, 2016 .................................................................................. 11-7 Figure 11-5. 200-UP Chromium, Nitrate, and Technetium-99 Data for Well 299-W23-19 at
WMA S-SX.................................................................................................................... 11-8 Figure 11-6. 200-UP Technetium-99 Data for Wells 299-W22-47, 299-W22-83, and 299-W22-
86 East of WMA S-SX .................................................................................................. 11-8 Figure 11-7. 200-UP Technetium-99 Data for Wells 299-W19-36 and 299-W19-43 near U Plant ...... 11-10 Figure 11-8. 200-UP Technetium-99 Data for Wells 299-W19-34A, 299-W19-113, and 299-
W19-114 near U Plant ................................................................................................. 11-10 Figure 11-9. 200-UP Technetium-99 Data for Selected Wells at WMA U ........................................... 11-11 Figure 11-10. 200-UP Uranium Plume, 2016 ........................................................................................ 11-13 Figure 11-11. 200-UP Uranium Data for Wells 299-W19-18, 299-W19-115 (replacement for 299-
W19-18), 299-W19-49, and 299-W19-36 near U Plant .............................................. 11-15 Figure 11-12. 200-UP Tritium Plume, 2016 .......................................................................................... 11-16 Figure 11-13. 200-UP Tritium Data for Well 299-W23-4 at the 216-S-21 Crib ................................... 11-19 Figure 11-14. 200-UP Iodine-129 Plume, 2016 ..................................................................................... 11-20 Figure 11-15. 200-UP Iodine-129 Data for Wells 299-W22-72, 699-36-66B, and 699-36-70A ........... 11-21 Figure 11-16. 200-UP Nitrate Plume, 2016 ........................................................................................... 11-23 Figure 11-17. 200-UP Nitrate Data for Wells 299-W19-36 and 299-W19-43 near U Plant ................. 11-24 Figure 11-18. 200-UP Nitrate Data for Selected Wells at WMA U ...................................................... 11-25 Figure 11-19. 200-UP Chromium Plume, 2016 ..................................................................................... 11-27 Figure 11-20. 200-UP Chromium Data for Monitoring Wells 299-W22-47, 299-W22-83, 299-
W22-86, and 299-W22-116 East of WMA S-SX ....................................................... 11-28 Figure 11-21. 200-UP Southeast Chromium Plume, 2016 .................................................................... 11-29 Figure 11-22. 200-UP Chromium Data for Wells 699-30-66 and 699-32-62 Southeast of the
200 West Area ............................................................................................................. 11-31 Figure 11-23. 200-UP Chromium and Nitrate Data for Wells 299-W26-13 and 699-32-76 at the
216-S-10 Pond and Ditch ............................................................................................. 11-31 Figure 11-24. Carbon Tetrachloride Plume, 2016 ................................................................................. 11-33 Figure 11-25. 200-UP TCE Plume, 2016 ............................................................................................... 11-34 Figure 11-26. 200-UP Groundwater Capture Zones for the Uranium Plume Remedy .......................... 11-39 Figure 11-27. 200-UP Groundwater Capture Zones at WMA S-SX ..................................................... 11-41 Figure 11-28. 200-UP Iodine-129 Plume Hydraulic Control Remedy Effect on Water Table .............. 11-43
Figure 11-29. 200-UP ERDF Monitoring Well Locations..................................................................... 11-45 Figure 11-30. WMA S-SX ..................................................................................................................... 11-47 Figure 11-31. WMA U ........................................................................................................................... 11-49 Figure 11-32. 216-S-10 Pond and Ditch ................................................................................................ 11-52
Tables
Table 11-1. 200-UP at a Glance ........................................................................................................ 11-3 Table 11-2. Depth Profile Sample Results for Well 299-W19-115 ................................................ 11-14 Table 11-3. Depth Profile Sample Results for Well 299-W19-116 ................................................ 11-14 Table 11-4. Depth Profile Sample Results for Well 299-W21-3 .................................................... 11-17 Table 11-5. Depth Profile Sample Results for Well 299-W22-114 ................................................ 11-17 Table 11-6. Depth Profile Sample Results for Well 699-36-63B ................................................... 11-17 Table 11-7. Depth Profile Sample Results for Well 699-29-66 ...................................................... 11-18 Table 11-8. Depth Profile Sample Results for Well 699-31-68 ...................................................... 11-18 Table 11-9. Depth Profile Sample Results for Well 699-30-57 ...................................................... 11-30 Table 11-10. Wells and Boreholes Installed in 200-UP in 2016 ....................................................... 11-36 Table 11-11. 200-UP-1 Remedy Summary ....................................................................................... 11-37 Table 11-12. Cumulative Total Effective Doses and Groundwater Concentrations that
Exceeded Standards at Groundwater Monitoring Locations in 200-UP in 2016 ......... 11-54