Embed Size (px)
Citation preview

11. Annual Trading Cost Analysis Review — Presentation by Zeno Consulting Group
11

Los Angeles Water & Power Employees’ Retirement Plan July 23, 2014
Transaction Cost Analysis and
Annual Review
Confidential

Table of Contents
Tab A - Who Is Zeno? Tab B - Equity Transaction Cost Analysis Tab C – Market Review Tab D – Annual Review Tab E – Appendix - Biographies
2 Confidential

Who is Zeno?
Confidential

Meaningful Trade Cost Analysis Three Reasons Why Funds Come to Zeno • Satisfies legal obligation, as fiduciaries, to monitor your managers’ (and
their brokers’) Equity, FX and Fixed Income trading processes for Best Execution
• Provides critical transparency, substantive due diligence, and insight into how your managers are handling Fund assets (“What you don’t know, can hurt you!”)
• Helps control excessive trade costs (often the single largest expense of the Fund!)
Why is Trade Cost Analysis Important for Asset Owners?
3 Confidential

Zeno Consulting Group is a consulting firm, not a broker, that specializes in helping large institutional clients proactively monitor, and manage, their asset managers’ trading processes.
All analytical thought is a function of math, logic, and ethics – but math and logic must be subordinate to ethics.
Zeno of Citium c.335-c.263 B.C. (paraphrased)
As prudent fiduciaries, more than ever before, asset owners should understand their managers’ trading process, what they pay to execute trades, whether they obtained best execution, and its impact on performance.
The easiest route to the top quartile of performance
is to be in the bottom quartile of expenses. Jack Bogle
Who is Zeno Consulting Group?
4 Confidential
Long Track Record Providing Meaningful TCA
• Established in 1986 as “Plexus Group.” Operated as a privately-owned trade cost measurement, analysis, and consulting firm. Two lines of business - selling TCA services to Plan Sponsors and buy-side, respectively. • Developed reputation as thought-leader in trade cost analysis, including being named “Consultant of the Year” by PLANSPONSOR magazine and authoring the PBGC Standards on transition management. • Acquired by JPMorgan Chase in 2002 as part of initiative to develop in-house TCA capabilities. • Acquired by ITG (a specialized agency brokerage and technology firm) in 2006, who integrated the manager TCA services into existing ITG services, and established the plan sponsor TCA services as a wholly-owned subsidiary called “Plexus Plan Sponsor Group, Inc.” • In January 2010, Plexus Plan Sponsor Group, Inc. was re-established as an independent employee-owned consulting firm called: Zeno Consulting Group, LLC.
5 Confidential

• Independent trade cost consultant, and Registered Investment Advisor, acting solely in asset owner’s interest.
• Methodology for calculating and benchmarking costs. • Web-based drill down facility, peer group universes, and comprehensive
end-to-end analytics that calculate the true loss of asset value and its impact on performance.
• Specialist in constructing meaningful oversight programs that systematically identify trading outliers and flag key issues with actionable recommendations.
• Zeno consultants act as extension of your staff in reviewing reports and conducting manager follow-up.
Unique Consultative Differentiators
6 Confidential

Firm Structure
5
President & CEO Steven Glass, JD
Consulting & Client Service
Warren Chun, CFA Vinod Pakianathan Chris Phillips, CFA
Data Analytics Cole Bovasso
Marketing & Business
Development Brian Greene John Seyler Tracy Grassi
Administrative Kimberly Barch
Confidential

9
Current Offerings Utilized By Our clients:
SPONSOR/FUND REVIEW – Equity Assists asset owners and general consultants in meeting legal and fiduciary obligations to ensure managers receive Best Execution and pay reasonable commission rates.
SPONSOR/FUND MONITOR – Equity
Goes beyond basic due diligence and provides asset owners greater transparency into their managers’ internal trading processes, enables constructive dialogue with managers, and provides consultative follow-up to reduce excessive transaction costs.
FX MONITOR Provides Fund fiduciaries with an accurate assessment of their managers’ foreign currency transactions , and consulting to help conduct follow-up on cost outliers and address potential trading abuses.
FIXED INCOME MONITOR Provides Fund fiduciaries with an accurate quantitative assessment of their managers’ fixed income transactions, and consulting to help conduct follow-up on cost outliers and address potential trading abuses.
DIRECTED BROKERAGE AND COMMISSION RECAPTURE AUDIT Offers asset owners an independent assessment of their underlying managers’ and funds’ execution efficiency, with particular emphasis on whether directed trades achieved Best Execution or incurred unnecessary hidden costs.
TRANSITION SERVICES Assists asset owners in navigating the complex marketplace known as Transition Management. As a Registered Investment Advisor, we offer several levels of service that range from pre-trade and post-trade analytics to strategic planning and transition manager selection.
Confidential

Equity Trade Cost Analysis
Confidential

Transaction Costs: A Common Sense Definition
How to Measure Transaction Costs Value before the transaction $X Value after the transaction $Y Cost to complete the trade $X - $Y
—
The loss of asset value associated with Buying and Selling securities in your portfolio.
Nothing tricky here. Simple arithmetic.
9 Confidential
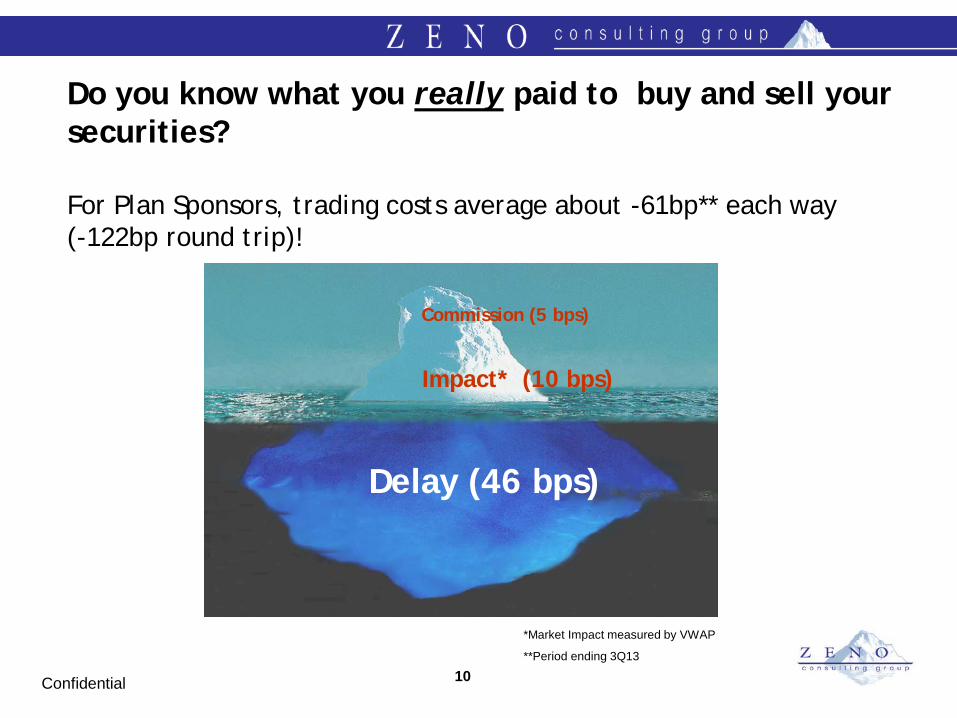
Do you know what you really paid to buy and sell your securities? For Plan Sponsors, trading costs average about -61bp** each way (-122bp round trip)!
Commission (5 bps)
Impact* (10 bps)
Delay (46 bps)
*Market Impact measured by VWAP
**Period ending 3Q13
10 Confidential

Let’s Put This Into Dollars and Cents
Transaction costs are often the largest expense of the fund!
Fund Value $1,000,000,000 60% Commitment to Active Equities $600,000,000 80% Equity turnover $480,000,000 (Double for both buying and selling) $960,000,000 One-way -60 bps Transaction cost -$5,760,000 Impact on return of Active Equities . . . . -0.96%
11 Confidential

Putting Costs Into Context
• Once you calculate the loss of asset value, you now know what the manager paid in trading costs, but that’s all you know.
• You don’t know whether you should be upset, satisfied, or happy with the trading costs paid by your manager.
• To answer that question, you need a benchmark to juxtapose again those costs, and help put them into context…
12 Confidential
This Requires a Meaningful Benchmark (i.e. Were the costs you paid reasonable?)
Zeno employs a three-tier process:
Tier 1
We utilize the industry standard Implementation Shortfall model to calculate what a fund’s absolute costs are.
Tier 2
We then compare those absolute costs to a meaningful Implementation Shortfall benchmark, that takes into account the decision/trades’ difficulty (e.g. trading 10,000 shares of a stock is easier than trading 100,000 shares).
Tier 3
We then rank each Fund and Manager against their Peer Group Universes
for: total costs, execution efficiency, brokerage efficiency, and commissions.
13 Confidential

Zeno’s Oversight Program: A Three Step Process Satisfy fiduciary obligations to monitor, achieve deeper understanding of (and comfort with)
manager trade processes, better manage and control excessive costs, and custom due-diligence/research on an as needed basis.
Step One: Quantitative review of report analytics Top-down approach maximizes staff time and resources. Basic metrics reviewed: – Review Aggregate Fund costs, benchmark, ranking, commissions, brokers, traded returns – Identify individual managers driving: costs, commission rates, and broker usage – Review individual managers’ costs, benchmark, ranking, commissions, brokers, traded returns – Review any other items of specific interest to your Fund
Step Two: Identify specific issues that may drive manager’s costs and suggest specific questions for follow-up
For Example: – What resources does the manager have to: manage portfolios; trade portfolios? – What are the general policies and procedures used by the manager while trading the portfolio – Is manager capacity an issue? – Are client-specific instructions potentially affecting the execution quality of all accounts?
Step Three: Consultative communication and follow-up with managers
Engage managers in focused meaningful discussions Intended to ensure manager’s awareness, and gain comfort in their process
– In general, share manager-specific pages (in the spirit of open communication) – Where appropriate, identify “Significant Issues” that warrant follow-up – Schedule calls with relevant managers to ask pertinent questions and discuss “Significant Issues” – Senior Zeno Consultant available for in-depth research projects
22 Confidential

Importance of a TCA Oversight Program
• Superficial TCA oversight programs may lead to partial, misleading, or incorrect conclusions.
• Meaningful oversight requires sufficient detail and metrics to enable clients to ask the “right” questions and become “the squeaky wheel”
• Zeno’s TCA oversight services provide both a deeper understanding of manager trade processes, and helps control excessive costs!
The CFA Institute defines Best Execution as: “The Trading Process Most Likely to maximize the
Value of Client Portfolios”
23 Confidential

18
Monitoring Commission Recapture Program 1. A three-step approach to aid in satisfying a fiduciary obligation;
a) Measure Implementation shortfall costs and compare with difficulty adjusted benchmark.
Assess comparative efficacy of commission recapture and non-recapture trades. b) Measure Total Costs and Benchmark Adjusted costs against peer strategies for both
recapture and non-recapture trades. c) Measure commission rates in the context of total costs paid. Assess net and gross
commission rates and usage of brokers.
2. Once the relative efficacy of manager’s trade implementation processes are established through Zeno’s analysis, any follow-up issues or recommendations are identified.
3. Clarification: net commission rates are the actual rates paid to execute a trade: • Any commission savings accruing to the Fund, and achieved from commission
recapture programs, are extracted from the total commission expenditure. Remaining commissions can be expressed in cents and/or basis points.
Confidential

Market Review
Confidential
20
2014 Market Environment and Trends
• US trading volumes have been declining for the since 2009 as investors reduce their equity asset allocations. Volatility has declined to the lowest level to pre-crisis 2006.
• Continued venue fragmentation. Ten years ago the NYSE and NASDAQ combined for over 75% of
US equity market share. Today they comprise of just over 25%. • Demand for TCA beyond equities: foreign exchange, fixed income, and other asset classes. New
and existing Zeno clients are now monitoring multiple asset classes.
• Regulators are increasingly looking into Best Execution practices in foreign exchange and fixed income.
• High frequency traders are under more scrutiny as they are being examined by various regulators regarding transparency, incentives, and fair dealing practices with electronic exchanges.
Confidential

21
High Frequency Trading (HFT)
• Zeno’s role as a Transaction Cost Consultant is to assess/inform clients of their manager’s overall trading process and its impact on Fund performance. Secondary role is cost-attribution (which in part touches HFT).
• Traits: high speed sophisticated computer programs/algorithms, proprietary data feeds/leases and
co-location, very short holding periods, posting numerous order quotes/cancels, ending the day flat (Not taking a position in the market).
• Current issues are largely a function of the current market structure engendered by Reg NMS.
• While there are many proposed solutions to HFT, the hope is that there will be greater market transparency.
• Recommendation that managers are reviewed for the efficiency of their trading processes from the PM’s investment idea to execution by the broker to ensure best execution.
Confidential
22
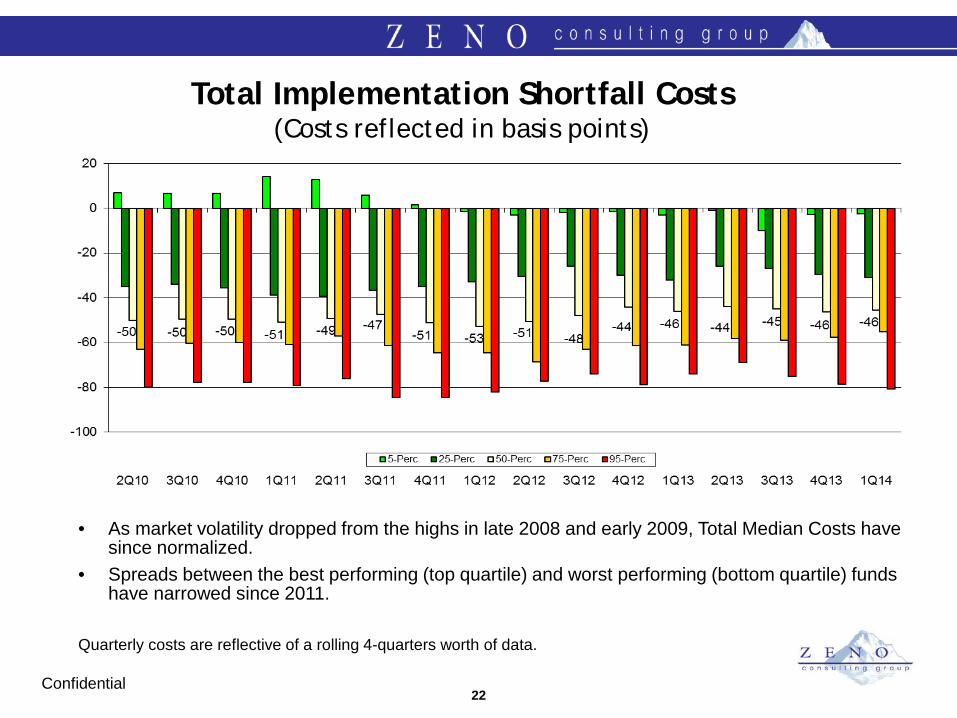
• As market volatility dropped from the highs in late 2008 and early 2009, Total Median Costs have since normalized.
• Spreads between the best performing (top quartile) and worst performing (bottom quartile) funds have narrowed since 2011.
Quarterly costs are reflective of a rolling 4-quarters worth of data.
Total Implementation Shortfall Costs (Costs reflected in basis points)
Confidential

23
Client Commission Trends in Domestic Markets (Commissions in cents per share)
• Median US commission rates have remained stable over the last 4 years. • $11B in brokerage commissions in 2011 according to Greenwich versus the peak in 2009 of
$14B. • Increased usage of Commission Sharing Arrangements have allowed managers to better
manage regulatory demands, transparency, and accountability. Quarterly costs are reflective of a rolling 4-quarters worth of data.
Confidential

Annual Review
Confidential

25
Trading Review of External Equity Portfolios Trading volume for the aggregate fund was slightly higher over the prior year. Gross commissions
expenditures also increased slightly as a result.
Annualized turnover rates were generally stable at 45% of assets. Managers with greater levels of trading turnover have a greater effect on transaction costs for the overall fund.
Total costs for WPERP as a fund in aggregate increased slightly. Prior review period costs were positively impacted by 2Q12 funding of Gateway. In general, individual portfolios were traded efficiently and comparably with peer strategies. The
Pyramis Non-US All Country portfolio, displayed costs that were greater than average, but the portfolio improved over the prior review period.
BlackRock and LA Capital portfolios were efficient.
Costs for trades which participated in the commission recapture program were better than non-recapture trades. In general we find that the commission recapture program did not materially affect manager’s trade execution processes. In some situations recapture trades were more difficult than non-recapture trades. Earnest Partners had poor relative performance of recaptured trades as it had a higher percentage of overall directed trades and more difficult trades. T Rowe Price LCG also had poor relative performance that was driven by delays in 4Q13. In total, 12% of all commission dollars were sent to the recapture program run by ConvergEx. A majority of commission recapture trading activity (99%) was executed by ConvergEx, Merrill
Lynch, and Piper Jaffray. Twelve other brokers were used to facilitate the remaining (1%) commission recapture trades.
Fred Alger (53%) provided the greatest revenues from the program, followed by Gateway (29%), and Frontier (7%).
The commission recapture program reduced gross directed commissions to 1.5 cps.
Confidential

26
Trading Volumes (MM) and Participation Rates 2Q13-1Q14
• Trading volumes and directed volumes driven by Fred Alger. • International managers MFS Intl and Pyramis did not participate in directed trades; Vontobel
executed 4 trades. • Manager’s have discretion on their participation rates.
Non-Directed Directed % Participation Earnest Partners 24 13 35% Fred Alger 2,389 307 11% Frontier 167 39 19% Gateway 0 168 100% MFS 143 26 15% MFS Intl 147 0 0% Pyramis 720 0 0% T Rowe Price LCG 575 20 3% T Rowe Price LCV 109 6 5% Vontobel 112 0 0% Total 4,386 579 12%
Did not participate: Los Angeles Capital and BlackRock
Confidential
27
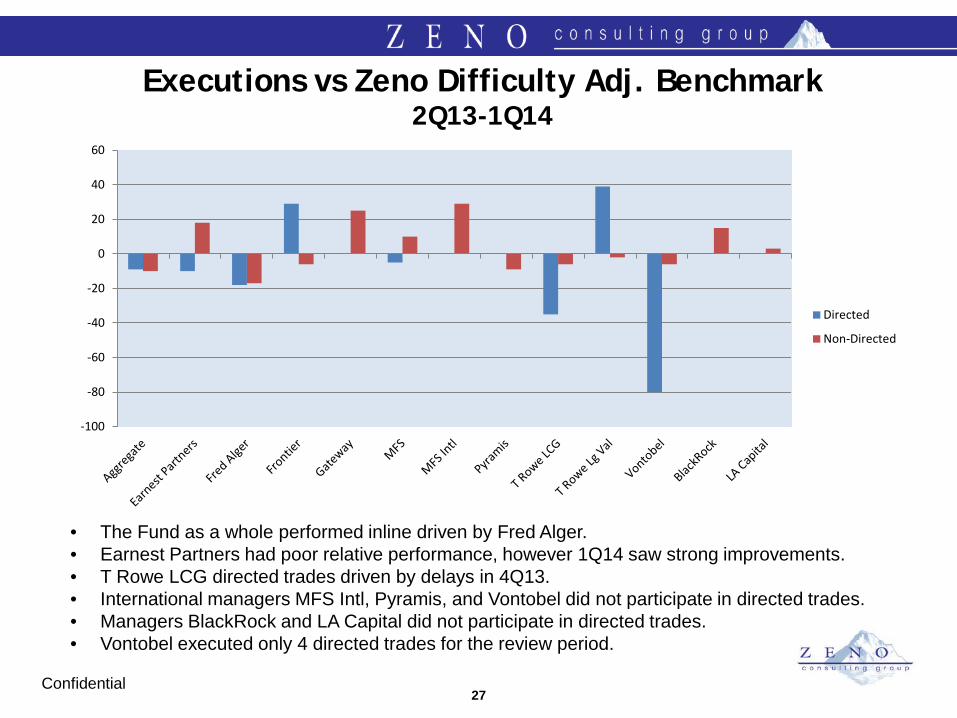
Executions vs Zeno Difficulty Adj. Benchmark 2Q13-1Q14
• The Fund as a whole performed inline driven by Fred Alger. • Earnest Partners had poor relative performance, however 1Q14 saw strong improvements. • T Rowe LCG directed trades driven by delays in 4Q13. • International managers MFS Intl, Pyramis, and Vontobel did not participate in directed trades. • Managers BlackRock and LA Capital did not participate in directed trades. • Vontobel executed only 4 directed trades for the review period.
-100
-80
-60
-40
-20
0
20
40
60
Directed
Non-Directed
Confidential

28
US Manager Commission Rates in cps 2Q13-1Q14
• Net commissions (after rebates) were generally efficient for US managers. • Directed trades improved overall portfolio commission rates for US managers. • Directed trades were executed at a net of 1.5 cps. • Managers BlackRock and LA Capital did not direct any trades. • International commission rates were inline: MFS Intl (-12 bp), Pyramis (-14 bp), and Vontobel (-10 bp)
0.0
0.5
1.0
1.5
2.0
2.5
3.0
3.5
EarnestPartners
Fred Alger Frontier Gateway MFS T RowePrice LCG
T RowePrice LCV
BlackRock LA Capital
Gross
Net
Confidential

29
Trading Review of External Equity Portfolios Portfolio Strategy Metric Observations
Earnest Partners
Small Cap Value
Total Costs
Costs increased over the prior year. Poor relative performance of recaptured trades as those trades were more difficult and had delays. Efficient as compared with Zeno’s Difficulty adjusted benchmarks. Follow-up call with manager provided additional information that WPERP staff and Zeno found satisfactory.
Execution Efficiency Average, when compared with peer portfolios.
Commission Recapture Above average participation rate (35%) may be affecting performance.
Commission Rates
Gross rates (3.1 cps, 4th qtile) have been poorer than peer averages. Net of commission (recapture) savings, commission rates (2.4 cps. 2nd qtile) are better than average. Used ConvergEx for recapture trades, exclusively.
Fred Alger Large Cap
Growth
Total Costs Slight increase in costs over the prior year. Efficient, compared with Zeno’s benchmarks.
Execution Efficiency Average, when compared with peer portfolios.
Commission Recapture
Biggest participant in program (53%). Participation rate (11%). Largest revenues from any manager in WPERP’s commission recapture program.
Commission Rates
Gross rates (3.2 cps, 4th qtile) have been poorer than peer averages. Net of commission (recapture) savings, commission rates (2.9 cps.3rd qtile) are average. Uses ConvergEx for recapture exclusively.
Confidential

30
Trading Review of External Equity Portfolios
Portfolio Strategy Metric Observations
Frontier Small Cap Growth
Total Costs Increase in costs over prior year. Efficient as compared with Zeno’s Difficulty adjusted benchmarks.
Execution Efficiency Better than the average (1st qtile) Small Cap Growth manager.
Commission Recapture Participation rate is 19%.
Commission Rates
Gross rates (3.0 cps, 3rd qtile) are average to their peers. Net of commission (recapture) savings, commission rates (2.6 cps. 2nd qtile) are better than average. Used ConvergEx for all recapture trades except 6.
Gateway Large Cap Core
Total Costs Costs deteriorated from prior year but still positive. Efficient as compared with Zeno’s Difficulty adjusted benchmarks.
Execution Efficiency
Better than the average (1st qtile) for peer portfolios. Consistent ranking over the past year.
Commission Recapture
Near 100% participation rate. Second largest in revenues from any manager in LADWP’s commission recapture program.
Commission Rates
Gross commission rates at the median (2.0 cps, 2nd qtile). Net of commission (recapture) savings, commission rates (1.5 cps. 2nd qtile) are better than average. Used ConvergEx for all recapture trades except 10.
Confidential

31
Trading Review of External Equity Portfolios Portfolio Strategy Metric Observations
MFS
Large Cap Value
Total Costs Costs were poorer from the prior year, however were still efficient.
Execution Efficiency Consistently top quartile compared to peer portfolios for the past two years.
Commission Recapture
Participation rate of 15%. ConvergEx was the only recapture broker used except for 1 trade.
Commission Rates
Gross rates (3.2 cps, 4th qtile) have been poorer than peer averages. Net of commission (recapture) savings, commission rates (2.8 cps. 3rd qtile) are average. Used ConvergEx for all recapture trades except 1.
MFS Intl’ Dev Val
Non-US All Country
Total Costs Costs improved from prior year. Efficient as compared with Zeno’s Difficulty adjusted benchmarks.
Execution Efficiency Average, when compared with peer portfolios.
Commission Recapture Did not participate.
Commission Rates Commission rates (13 bps, 3rd qtile) are consistently in line with peer averages.
Confidential

32
Trading Review of External Equity Portfolios Portfolio Strategy Metric Observations
Pyramis Non-US All Country
Total Costs Costs improved over the prior year with better delay and market impact costs. Generally high cost.
Execution Efficiency Ranked below average as compared with peer portfolios.
Commission Recapture Did not participate.
Commission Rates Commission rates (14 bps, 3rd qtile) are consistently in line with peer averages.
T. Rowe Price
Large Cap Growth
Total Costs Costs improved over the prior year. Poorer 2nd half results. Poor relative performance of recapture trades as 4Q13 had above average costs.
Execution Efficiency Lagged peer average, however 1st half results of the review period were efficient.
Commission Recapture Participation rate is 3%.
Commission Rates
Gross rates (2.1 cps, 2nd qtile) are above peer averages. Net of commission (recapture) savings, commission rates (2.0 cps. 1st qtile) are efficient. Merrill Lynch (75%) and Piper Jaffray (17%) were the largest recapture brokers.
Confidential

33
Trading Review of External Equity Portfolios
Portfolio Strategy Metric Observations
T. Rowe Price Large Cap Value
Total Costs Costs were poorer from the prior year, however were still efficient. Costs for recapture trades outperformed non-recapture trades.
Execution Efficiency Better than the average for peer portfolios. Efficient quarterly executions.
Commission Recapture Participation rates of 5%.
Commission Rates
Gross rates (2.2 cps, 2nd qtile) are above peer averages. Net of commission (recapture) savings, commission rates (2.1 cps, 2nd qtile) are efficient. Merrill Lynch, Piper Jaffray, and Weeden were the only recapture brokers.
Vontobel Emerging Market
Total Costs
Review initiated 1Q13. . Poor relative performance of recapture trades. Above average costs, however efficient as compared with Zeno’s Difficulty adjusted benchmarks.
Execution Efficiency Average, when compared with peer portfolios.
Commission Recapture Executed only 4 recapture trades.
Commission Rates
Commission rates (10 bps, 2nd qtile) are consistently in line with peer averages.
Confidential

34
Trading Review of External Equity Portfolios
Portfolio Strategy Metric Observations
BlackRock Large Cap Passive
Total Costs Costs efficient versus the Close
Execution Efficiency Efficient quarterly executions.
Commission Recapture Did not participate.
Commission Rates
Efficient commission rates of (0.1 cps, 1st qtile).
LA Capital Emerging Market
Total Costs Review initiated 4Q12. Costs consistently efficient as compared with Zeno’s Difficulty adjusted benchmarks.
Execution Efficiency Average, when compared with peer portfolios.
Commission Recapture Did not participate.
Commission Rates
Efficient commission rates (9 bps, 1st qtile).
Confidential

35
Conclusions and Recommendations
Trading costs and manager’s overall trading processes were not materially
affected by the Commission Recapture program.
LADWP’s commission recapture program has been implemented in a prudent manner.
Savings from Commission Recapture reduced gross directed rates to 1.5 cps.
In general, overall US commissions for managers improved.
Recommend the continuation of the Commission Recapture program as long as it is fiscally viable.
Confidential

Appendix
Confidential
37
Steven Glass, J.D. President and CEO
Steven Glass purchased Zeno Consulting Group, LLC, formerly known as Plexus Plan Sponsor Group, Inc. in January 2010, from its’ parent corporation Investment Technology Group, Inc. Steve first joined Plexus in 1996, and has headed up all client servicing, sales/marketing, and product development for institutional clients such as plan sponsors, mutual fund boards, and other entities exercising oversight over 3rd party investment managers. These services include fiduciary advice regarding: due diligence monitoring, transition management, construction of prudent directed brokerage programs, soft dollar audits, manager searches and terminations, and assistance to trading desks. In December 1999, his Division was named Consultant of the Year by Plan Sponsor Magazine. Prior to joining Plexus, he served as General Counsel to the District of Columbia Retirement Board, where he provided fiduciary guidance on investment management issues, and developed the Board’s Transaction Cost Monitoring Program. Steve received his Juris Doctorate from Drake University Law School and has a Master’s Degree in Law from Antioch Law School. He has written and spoken on trading costs, manager transitions and plan sponsor fiduciary obligations. Two articles (published in The Journal of Investment Consulting) have been cited as “seminal reading” for any plan sponsor concerned about transaction costs. In addition, an article on the fiduciary responsibilities of plan sponsors when implementing transitions (published in Institutional Investor’s 2003 Investment Guide), was selected by The Practicing Law Institute for inclusion in its "ERISA 2004 Course Handbook."
Confidential

38
Warren Chun, CFA Senior Consultant
Warren joined Zeno Consulting Group, LLC, formerly known as Plexus Plan Sponsor Group, in 2008. He provides consulting to plan sponsors, as well as supports plan sponsor clients through the preparation and production of Sponsor Monitor and Transition Management services. Warren also manages Zeno’s Fixed Income product. Prior to joining Zeno, he served as a Portfolio Manager at a convertible securities money manager and as an Analyst at Wilshire Associates, and has over 25 years of industry experience.
Vinod Pakianathan Senior Consultant
Vinod joined Zeno Consulting Group, LLC, formerly known as Plexus Plan Sponsor Group, in 1994. As Managing Director of Consulting, Vinod oversees Zeno's flagship product Sponsor Monitor. Vinod consults with some of Zeno's largest plan sponsor and fund oversight board clients, and supports product development for all Zeno services. Further, Vinod has primary responsibility for the Transition Services provided by Zeno. Vinod has a BS in Engineering and obtained his MBA from the University of Iowa. He has twenty years of industry experience.
Confidential
39
Chris Phillips, CFA Senior Consultant
Chris joined Zeno Consulting Group, LLC, formerly known as Plexus Plan Sponsor Group, in 2002. He services and advises institutional clients such as plan sponsors, mutual fund boards, and other entities exercising oversight over 3rd party investment managers by evaluating the trading activity and performance of managed portfolios. He provides support to Zeno through the ongoing development of products and new business. Additionally, he serves as the firm’s liaison to traditional investment consultants and other entities engaged in the use of Zeno services. Chris has over 15 years of investment related experience and served as investment analyst for the District of Columbia Retirement Board. Chris earned the right to use the Chartered Financial Analyst designation in 1998 and is currently a member of CFA Institute and the CFA Society of Washington DC.
Brian Greene Business Development
Brian joined Zeno Consulting Group, LLC, formerly known as Plexus Plan Sponsor Group, in 2006. He heads sales and business development of Zeno’s three product lines: Trade Cost Analysis, Transition Management Consulting and Directed Brokerage/Soft Dollar Audits. Prior to joining Zeno, Brian has worked for over twelve years in sales, marketing and servicing the plan sponsor community on trading costs, transition management and directed brokerage programs while working with such firms as BNY Brokerage, Lynch, Jones & Ryan and First Union Securities.
Confidential

40
John Seyler Business Development
John joined Zeno Consulting Group, LLC in 2012 as part of the business development team, with over 20 years of experience in the financial services industry. Prior to joining Zeno, John was Senior Vice President of Plan Sponsor Sales at Jackson Securities. Prior to his tenure at Jackson Securities, John was Managing Director, LJR National Sales for BNY ConvergEx, responsible for their U.S. plan sponsor sales group. Prior to BNY ConvergEX, John was the Lynch, Jones & Ryan (LJR) Sales Manager for the eastern part of the U.S., Canada, and Puerto Rico. John began his career with LJR in 1988 as a sales representative for commission recapture and transition management services to plan sponsors in the mid-Atlantic and southeastern part of the U.S. Prior to his tenure with LJR, John held a variety of sales and management positions with Litton Computer Services, Multiple Funding Corp, a division of D&B, and Phoenix Mutual/Phoenix Equities in the New York City area. John graduated from Baruch College, part of CUNY, with a BBA in Marketing. John is a FINRA General Securities Registered Representative and Principal (Series 7, 63, and 24).
Confidential

41
Tracy Grassi Business Development
Tracy joined Zeno Consulting Group, LLC, formerly known as Plexus Plan Sponsor Group, in 2003. Tracy is part of Zeno’s business development team, managing all marketing campaigns, coordinating events and educating prospective clients. Prior to joining Zeno, Tracy worked for Catequil Asset Management, LLC supporting a team of equity traders. Prior to Catequil, Tracy worked for Brown Brothers Harriman & Co. as a short-term money markets trader. Tracy has more than 15 years of experience in the financial industry, most recently working with the Plan Sponsor community.
Cole Bovasso Investment Analyst
Cole joined Zeno Consulting Group, LLC, formerly known as Plexus Plan Sponsor Group, in 2003. As head of report production, Cole is responsible for overseeing the collection and processing of client data, as well as the timely delivery of finished reports. Cole also has primary responsibility for managing outside data vendors and software subcontractors essential to Zeno’s report production processes. Prior to joining Zeno, Cole worked in licensing for Virgin Records America.
Kimberly Barch Executive Assistant
Kimberly joined Zeno Consulting Group, LLC, in 2010. Her primary focus is on managing the firm’s administrative operations and supporting the business development team. Prior to joining Zeno, she was a member of the marketing department at an international law firm and wholesale pharmaceutical company.
Confidential
For further information please contact: Warren Chun, CFA Vinod Pakianathan Senior Consultant Senior Consultant 310.417.9042 310.417.9041 [email protected] [email protected] The information contained herein has been taken from trade and statistical services and other sources we deem reliable but we do not represent that such information is accurate or complete and it should not be relied upon as such. No guarantee or warranty is made as to the reasonableness of the assumptions or the accuracy of the models or market data used by Zeno Consulting Group, LLC (Zeno) or the actual results that may be achieved. The screen shots provided in this presentation represent hypothetical examples of certain products available from Zeno. They contain sample data and are provided for informational purposes only. None of these materials is intended to be used for trading or investment purposes or as an offer to sell or the solicitation of an offer to buy any security or financial product. These materials do not provide any form of advice (investment, tax or legal). All trademarks, service marks, and trade names not owned by Zeno are owned by their respective owners. All functionality described herein is subject to change without notice. These materials are not to be copied, displayed or transmitted in any form without the prior written permission of Zeno.
Confidential