Embed Size (px)
Citation preview

11
ATLANTIC GRUPA
FY11 Financial results (audited)
Performance in line with guidance alongside successful execution of integration processes
February 23th, 2012

22
CONTENT
KEY BUSINESS DEVELOPMENTS in 2011 and ANNOUNCEMENT of EVENTS in FY12
FINANCIAL RESULTS in 2011
FY12 GUIDANCE
33
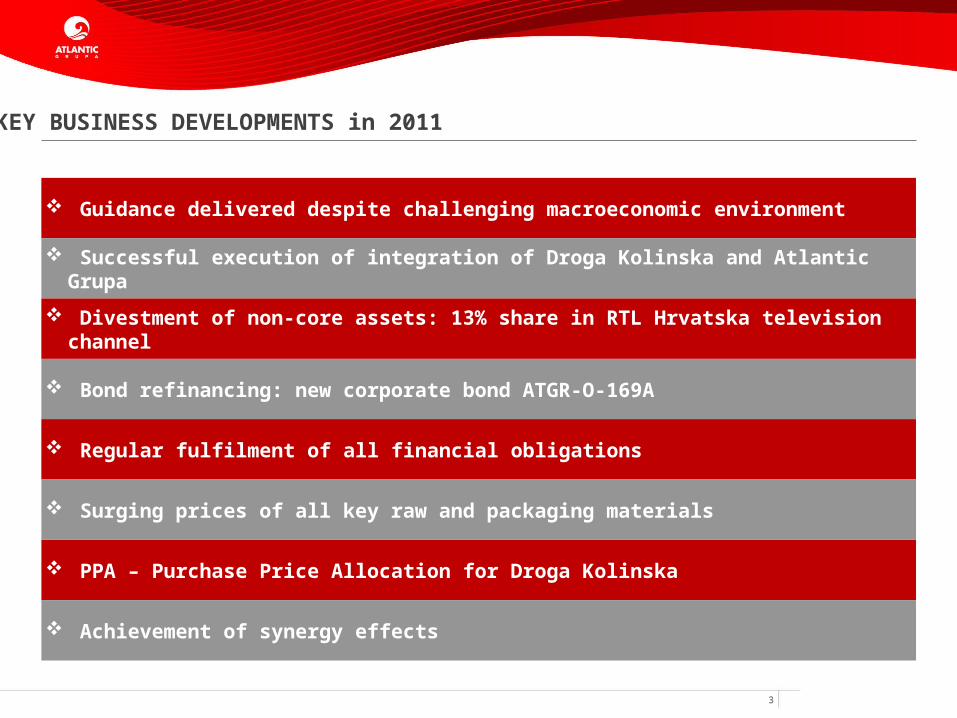
KEY BUSINESS DEVELOPMENTS in 2011
Guidance delivered despite challenging macroeconomic environment
Successful execution of integration of Droga Kolinska and Atlantic Grupa
Divestment of non-core assets: 13% share in RTL Hrvatska television channel
Bond refinancing: new corporate bond ATGR-O-169A
Regular fulfilment of all financial obligations
Surging prices of all key raw and packaging materials
PPA – Purchase Price Allocation for Droga Kolinska
Achievement of synergy effects

44
KEY INTEGRATION ACTIVITIES: Phase I
Sales and distribution
• Setting up joined distribution on all regional markets: establishing independent distribution companies on each regional market that are consolidated in the Distribution division
• Implemented new commercial terms on all regional markets
• Sales force optimized
Logistics and investment
• Setting up joined logistics operations and processes (the most complex one in Serbia with initial 11 distribution centres, reallocated to 4 new locations)
• Logistics reorganisation in Croatia (in-house logistics as opposed to formerly outsourced logistics)
• Consolidation of office space on all regional markets
Procurement and marketing
• Implemented centralised procurement system
• Developed purchasing category management concept with lead buyers for key raw materials
• Implemented centralised marketing
HR challenges
• Creating new and efficient business organisation
• Retaining and motivating the most qualitative workforce
• Co-life of different corporate cultures
• Developing fair rewarding schemes
First phase of integration activities carried out in the 1H11

55
KEY INTEGRATION ACTIVITIES: Phase II
Consolidation of production facilities
• Previously outsourced bottling of Cockta for Croatian and B&H market has been replaced with in-house bottling in Apatovec, Croatia
• Transfer of coffee roasting for Croatian market from previously outsourced producer to own production plant in Izola, Slovenia
• Currently, feasibility studies are being prepared for transfer of other production from outsourced producers to own production plants
Consolidation of information technology
• Consolidation of business IT solutions on several regional markets based on the assessment of business systems for operational support within Droga Kolinska and Atlantic Grupa and selection of best practice
• Redefining current IT contracts related to telecom services, licences and outsourced IT support
Real estate management
• Real estate and financial assets portfolio management with the goal to sell all assets that are not in accordance with the company’s core business operations – e.g. sale of 13% ownership in Croatian broadcasting channel – RTL Hrvatska
• Currently the company assesses sale of several real estate that are not in accordance with the company’s core business operations
Second phase of integration activities started in the 2H11

66
SUMMARY OF INTEGRATION ACTIVITIES and OTHER
CORE program
In November 2011, Atlantic Grupa launched cost reduction program – CORE program The key goal is to optimize the company’s primarily external expenses in the period from 2011 to 2013 Emphasis is on the group of expenses that are encountered as result of purchase of goods and services from suppliers
46% of total synergy savingsEUR 5.9m net synergy savings
Investment management
LogisticsDistribution

77
NEW BUSINESS MODEL OF ATLANTIC GRUPA from 2012
SBU COFFEE
Turkish,Espresso,
Instant
Reorganization in 2012 with an aim to manage business segments and distribution markets more efficiently Operational business also includes Central procurement, Central marketing and Corporative quality management functions
SBU BEVERAGES
Vitamin instant drinks and teasCarbonated soft
drinksFunctional water
and Water
SBU SPORTS AND
FUNCTIONAL FOOD
Sports and functional food
SBU PHARMA AND
PERSONAL CARE
VMS and OTC Pharmacy chainCosmetics and personal care
SBU SAVOURY SPREADS
Savoury spreadsSandwiches of
extended freshness
SBU SNACKS
Sweet and salted snacks
SMUCroatia
SMUSlovenia,
Serbia and Macedonia
SMUHoReCa
Hotels, restaurants and cafes
MU Russia
Baby foodAll products sold in
CIS region
SMUInternational
marketsAll markets outside ex.-YU region and
Russia

88
ATLANTIC GRUPA ON CROATIAN CAPITAL MARKET in 2011
Ownership structure on 30/12/2011
-46.5%-37.9%
18.2%
47.7%
-47.6%-62.0%
-17.6%
5.3%16.4%
-67.2%
-15.4%
19/11/07-30/12/11
2011 2010 2009 2008
Performance on capital market ATGR-R-A
Crobex
Crobex10
From the end of March, ATGR-R-A has been included in domestic blue-chip index Crobex10
On 20 September 2011, Atlantic Grupa issued Notes amidst restructuring of its maturity debt structure
Atlantic Grupa’s average market capitalization in 2011: HRK 2.2m – second place based on average Mcap among components of local blue-chip index Crobex10
Atlantic Grupa’s share retained total turnover and average daily turnover on the 2010 levels
Valuation 2011 2010*
Last price in reporting period 500.0 805.0
Market capitalization (HRK 000) 1,667,150 2,684,112
Average daily turnover (HRK) 551,157 554,827
EV (HRK 000) 4,229,100 5,243,503
EV/EBITDA* 8.18 9.96
EV/EBIT* 13.68 19.01
EV/sales* 0.89 1.16
EPS (HRK) 5.90 26.43
P/E 84.71 30.46Normalized P&L figures *Pro-forma consolidated figures in 2010
TEDESCHI EMIL50.20%
EBRD8.53%
DEG8.49%
L. Tedeschi Fiorio5.79%
East Capital0.36% Management
1.25%
Others8.09%
Raiffeisen OPF54.32%
AZ OPF23.07%
PBZ CO OPF7.88%
Raiffeisen VPF8.08%
Erste Plavi OPF6.65%
Pension funds
17.29%

99
CONTENT
KEY BUSINESS DEVELOPMENTS in 2011 and ANNOUNCEMENT of EVENTS in FY12
FINANCIAL RESULTS in 2011
FY12 GUIDANCE

1010
Sales at 4,727.8 million kuna+ 108.4% yoy based on reported figures+ 1.2% yoy organic growth+ 4.8% yoy growth compared to pro-forma consolidated level in the same period last year
Normalized earnings before interests, taxes and depreciation (EBITDA) at 517.3 million kuna+ 156.5% yoy based on reported figures- 1.7 yoy growth compared to pro-forma consolidated level in the same period last year
Normalized earnings before interests and taxes (EBIT) at 309.2 million kuna+ 110.9% yoy based on reported figures+ 12.1% yoy growth compared to pro-forma consolidated level in the same period last year
Net profit after minorities at 46.6 million kuna* Normalised net profit after minorities at 19.7 million kuna
OWERVIEW of FY11 RESULTS

1111
RESULTS IN LINE WITH GUIDANCE
HRKm 101.7% 98.2% 96.9%
2011 result normalized
4,550
4,650
4,750
Sales
4,728
4,650
2011A
2011E
0
200
400
600
EBITDA EBIT
517
309
527
319
2011A
2011E

1212
OVERVIEW OF ONE-OFF ITEMS in 2010/2011
2010
Sale of Neva’s former location in Tuškanova
* One of gain in the amount of 48.6 million kuna Acquisition of Droga Kolinska
* Transaction costs in the amount of 52.2 million kuna
* Positive financial impact of 16.9 million kuna (income on deposits from capital increase
funds and positive exchange rate differences) Acquisition of the company Kalničke vode Bio Natura
* Badwill in the amount of 5.1 million kuna
2011
Sale of non-core assets – 13% stake in the company RTL Hrvatska
* One-off gain in the amount of 12.0 million kuna Acquisition of Droga Kolinska
Transaction costs in the amount of 5.8 million kuna Purchase price allocation
* One-off impact on increase in inventories in the amount of 22.8 million kuna
* One-off impact on depreciation of tangible assets and amortization of intangible assets in
the amount of 42.3 million kuna. Depreciation and amortization effect is one-off compared
to 2010, but, lower depreciation and amortization will remain in 2012 and onwards
* One-off impact on increase in financial borrowings in the amount of 1.2 million kuna

1313
SALES in 2011
* Sales growth: +108.4%
Growth generators:
(i) Acquisition of Droga Kolinska
(ii) Organic growth of Atlantic Grupa
* Sales growth: + 4.8% comparing to pro-forma consolidated sales in 2010
Growth generators:
(i) Growth on regional markets after acquisition of Droga Kolinska(ii) Growth in coffee, sweet and salted snacks and baby food segments(iii) Growth in Sports and Functional Food and Pharma divisions
* Sales growth : +1.2% without Droga
Kolinska effect
Growth generators:
(i) Growth of own brands within Sports and Functional Food division
(ii) Sales growth of private label
(iii) Newly opened pharmacies and specialized stores
(iv) Final consolidation of acquired pharmacy chain Dvoržak
HRKm
1,000
2,000
3,000
4,000
5,000
4,728
2,269
FY11 vs. FY10 FY11FY10
+108.4%
4,000
4,200
4,400
4,600
4,800
4,728
4,513
FY11 vs. FY10 Pro-forma FY11FY10
+4.8%
2,100
2,150
2,200
2,250
2,300
2,2962,269
FY11 vs. FY10 organic FY11FY10
+1.2%

1414
GEOGRAPHIC SALES PROFILE
Croatian market remained the largest selling market after acquisition of Droga Kolinska with 28.2% share of total sales, however the acquisition itself significantly reduced exposure to domestic market from 55.1% in 2010
Regional markets (without Croatia) have 52.0% share of total sales compared to 18.9% in 2010
Share of West European markets fell to 7.5% from 14.9% in 2010, as sales of acquired Droga Kolinska are mostly focused on regional markets and to smaller extent on Russian market
East European markets have 3.0% share of sales compared to 1.8% in 2010, due to Droga Kolinska’s presences on those markets
28%
25%13%
8%
6%
8%
3%9%
2011Croatia
Serbia
Slovenia
B&H
Other ex. Yu*
Key WEU**
Russia and EE
Other
30%
24%13%
9%
6%
8%
4% 6%
Pro-forma consolidated 2010
Croatia
Serbia
Slovenia
B&H
Other ex. Yu*
Key WEU**
Russia and EE
Other
*Other ex. YU: Macedonia, Monte Negro, Kosovo **Key WEU: Germany, Italy, UK
55%
6%
8%3%
2%
15%
2%9%
Stand-alone 2010
Croatia
Serbia
Slovenia
B&H
Other ex. Yu*
Key WEU**
Russia and EE
Other

1515
SALES on KEY MARKETS – CROATIA
-3,3% compared to 2010 pro-forma consolidated results-3,9% on organic level (without Droga Kolinska) Two key factors affected sales on Croatian market: i. Renewal of contracts with key customers due to integration of Droga Kolinska’s product portfolio during 2011ii. Continuation of negative trends in Croatian economy Sales decline on the pro-forma consolidated level was partially cushioned by following:i. Increase in coffee and salted snacks category as well as mild increase in savoury spreads and beverages categories of Droga
Kolinskaii. Growth of some principal brandsiii. Growth in Pharma division
500
750
1,000
1,250
1,500
FY11 FY10 Pro-forma cons. FY10 Stand-alone
1,332.2 1,377.91,250.6
(in H
RKm
)

1616
SALES on KEY MARKETS – SERBIA, SLOVENIA AND BOSNIA AND HERZEGOVINA
Serbian Market+ 12.7% growth compared to pro-forma consolidated sales in 2010-10.7% on organic level (without Droga Kolinska) The second largest market in Atlantic
Grupa with 25.5% share of total sales
Slovenian market+3.5% growth compared to pro-forma consolidated sales in 2010+2.5% on organic level (without Droga Kolinska) The third largest market in Atlantic
Grupa with 12.7% share of total sales Growth: coffee, salted snacks,
Cedevita and some principal brands
B&H market-9.3% drop compared to pro-forma consolidated sales in 2010-2.5% on organic level (without Droga Kolinska) The third largest market in Atlantic
Grupa with 7.6% share of total sales
0
200
400
600
800
1,000
1,200
1,400
Serbia Slovenia B&H
1,204.2
598.1
359.2
1,068.6
577.7
395.9
130.1 172.579.0
(in H
RKm
)
FY11
FY10 Pro-forma cons.
FY10 Stand-alone

1717
SALES on KEY MARKETS – WEST EUROPEAN MARKETS AND RUSSIA
West European markets+1.1% growth compared to pro-forma consolidated sales in 2010+5.2% on organic level (without Droga Kolinska)
Three key factors buoyed sales growth in this geographic regioni. Double-digit growth in the sports food brand Champ and the functional food
brand Multabenii. Double-digit growth in private label salesiii. Further expansion of mass market outside the specialized sports channel.
Russian and East European markets -20.0% compared to pro-forma consolidated sales in 2010
Decline mainly reflected lower sales of Multivita assortment, whereby growth in baby food assortment with brand Bebi was insufficient to annul decline in the former
0
50
100
150
200
250
300
Germany Italy UK Russia & EE
264.1
41.5 50.3
144.0
246.3
57.3 48.3
180.0
244.3
49.3 44.5 41.4
(in H
RKm
)
FY11
FY10 Pro-forma cons.
FY10 Stand-alone

1818
SALES by PRODUCT TYPE
Own brands+6.4% compared to pro-forma consolidated sales in 2010+1.8% on organic level (without Droga Kolinska)Principal brands-9.7% yoy Share decrease due to conolidation of Droga KolinskePrivate label+31.8% yoyFarmacia+15.6% yoy+9.8% on organic level (excluding acquired chain Dvoržak)
72%
17%
5%6%
2011
Own brands
Principal brands
Private label
Farmacia
71%
20%
4%5%
Pro-forma consolidated 2010
Own brands
Principal brands
Private label
Farmacia
41%
40%
8%
11%
Stand-alone 2010
Own brands
Principal brands
Private label
Farmacia

1919
597
441
333304
235
172 171144 141 126 125
Grand Kafa Argeta Cedevita Barcaffe Multipower Smoki Cockta Najlepše želje Bebi Champ Donat Mg
HRK m
Sales Net I
KEY BRANDS in 2011
The following brands achieved growth:i. Coffee – Grand Kafa 12.3% i Barcaffe 9.7%ii. Sweet and salted snack – Najlepše želje 11.6% andSmoki 5.5%iii. Baby food – Bebi 11.7%iv. Sports and functional food – Champ and Multaben
Following brands posted yoy lower sales:i. Beverages – Cedevita and Cocktaii. Savoury spreads - Argeta

2020
GROSS SALES by DIVISION
+ 1.2% yoy organic growth+ 4.8% compared to pro-forma consolidated sales in 2010
Distribution : +114.3% , -6.4% organic Consolidated distribution of Atlantic Grupa and Droga
Kolinska, renewed contracts with key customers Unfavourable macroeconomic environment decreased
consumption Portfolio rationalization
Consumer HealthCare: -6.4% Unfavourable macroeconomic situation Consolidation of distribution activities of Atlantic
Grupa and Droga Kolinska affected this division’s sales
Sports and Functional Food: +16.3% Growth of brands Champ and Multaben as well as
private label Upward trend in mass market and online sales
Pharma: +12.5% Pharmacy chain sales growth, opening of 4 new sales
locations, consolidation of Dvoržak pharmacy chain Fidifarm sales growth
Droga Kolinska: +0.2% Growth of product categories: coffee, sweet and salted
snacks and baby food
HRKm
2,763
448647
367
2,249
1,289
478 556326
2,244
Distribution Consumer Health Care
Sports and Functional Food
Pharma Droga Kolinska
2011 2010
1,207
448
647
367
1,289
478556
326
Distribution Consumer Health Care
Sports and Functional Food
Pharma
2011 ex. Droga Kolinska 2010

2121
SALES by CATEGORIES
Indicative overview of sales by categories (according to the new business model) in 2011 reflect the following:
Product category – coffee – with brands Grand Kafa i Barcaffe is the largest individual product category with 21% share in total sales
Product category – beverages – with key brands Cedevita, Cockta, Donat Mg is the second largest product category with 14% share in total sales
Product category – sports and functional foods – with key brands Multipower and Champ is the third largest product category with 14% share in total sales
Distribution which includes principal brands has 17% share in total sales
17%
14%
10%
21%
12%
9%
14%
3%Distribution (Principal brands)
Sports and Functional Food
Pharma &Personal care (Farmacia, Fidifarm, Multivita, Neva)
Coffee
Sweet and salted snack
Savoury spreads
Beverages
Baby food

2222
PROFITABILITY DYNAMICS
Two-fold higher profitability on EBITDA and EBIT levels compared to 2010 primarily reflected consolidation of Droga Kolinska
Decline in EBITDA compared to pro-forma consolidated 2010 largely reflected 20.7% yoy higher production materials costs
Normalised EBIT reflected the impact of finalised PPA process for Droga Kolinska on tangible assets depreciation and intangible assets amortization
2011 vs. 2010 2011 vs. 2010 pro-formaNormalised EBITDA +156.5%
-1.7%Normalised EBIT
+110.9% +12.1%
Normalised Net profit -67.5% -
77.7%
HRKm
100
200
300
400
500
600
FY11 FY10 Pro-forma FY10 Stand-alone
501545
220
517 526
202
EBITDA EBITDA
Normalized EBITDA
0
100
200
300
400
FY11 FY10 Pro-forma FY10 Stand-alone
335
294
165
309276
147
EBIT EBITNormalized EBIT
0
50
100
150
200
FY11 FY10 Pro-forma FY10 Stand-alone
55
146
107
28
126
86
Net profit Net income
Normalized net income

2323
PROFITABILITY DYNAMICS – Impact of surging prices on global commodity markets
On the pro-forma consolidated level, production materials costs surged 21% yoy
Soaring production materials costs came on the back of: * Growth in coffee, sugar, milk powder and others largely on the back of surging prices on the global commodity markets as well as packaging materials costs* Coffee rocketed 55% on average on global commodity markets (expressed through coffee “C” futures contract as the world benchmark for Arabica coffee) compared to 2010
Left graph - coffee price movements during 2010 and 2011– maximum at the beginning of May 2011
Right graph: beginning of May 2011 the highest coffee price since the end of 1997
In the following period:*The fundamentals indicate upward pressure on global coffee prices largely amidst historically low global coffee inventories and downtrend in inventories in weeks of consumption* But, excess of global supply should cushion uptrend in 2012

2424
PURCHASE PRICE ALLOCATION for DROGA KOLINSKA
• Pursuant to the International Financial Reporting Standards (IFRS 3), Atlantic Grupa was obliged to allocate the purchase price of EUR 243,109 ths paid for Droga Kolinska’s assets acquired, within a year from the transaction. For that purpose, Atlantic Grupa engaged the independent appraiser.
Summary
• Fair value of trademarks on 31 December 2010 is HRK 764.8m and has been increased by HRK 206.3m from their book value
• Valuation based on income approach, i.e. Relief-from-Royalty method• Indefinite useful life: brands will not be amortised but tested annually for
impairment
Intangible assets
• On 31 December 2010, fair value of tangible assets has been estimated at HRK 73.6m above its book value
• Applied market-based approach and cost-based approach to value tangible assets
Tangible assets
• On 31 December 2010, fair value of inventories has been estimated at HRK 22.6m above its book value
• On 31 December 2010, fair value of financial borrowings has been estimated at HRK 1.2m above its book value
Other assets and liabilities
• Goodwill of HRK 571.5m has been calculated • Allocated to the following operating segments (CGUs): coffee, savoury spreads,
snacks and confectionary, beverages, baby food and distributionResidual goodwill

2525
DIVISIONAL OPERATING PROFITABILITY
Distribution+114.3% amidst Integration of Droga Kolinska and Atlantic Grupa’s portfolio
Consumer HealthCare-32.0% amidst: Lower sales Higher production materials costs
Sports and Functional Food-52.3% amidst Front-loaded investments in new company in Spain Higher production materials and marketing and selling costs Higher service costs
Pharma-5.2% amidst: Stronger growth in operating costs base, primarily service
costs, staff costs and costs of goods sold
HRKm
80.3
56.6
14.4 16.0
169.8
37.4
83.2
30.116.9
0
40
80
120
160
Distribution CHC SFF Pharma Droga Kolinska
2011 2010
24%
17%
4%
5%
50%
Distribution
Consumer HealthCare
Sports and Functional Food
Pharma
Droga Kolinska

2626
Leverage indicators: Net debt-to-normalized EBITDA at 4.8 times Interest covered with normalized EBITDA at 2.3 times Gearing ratio (net debt-to-net debt and total equity) at 62.3%
In accordance with the Policy of active financial debt management, Atlantic Grupa fixed substantial portion of its long-term financial liabilities with interest rate swaps in the 1Q11
In 2011, Atlantic Grupa refinanced corporate bond in the nominal amount of HRK 115m maturing in 2016
FINANCIAL INDICATORS
Require: prudent debt management and delivery of synergies
in HRKm FY11 YE10*
Net debt 2,494.0 2,495.8
Total assets 5,355.2 5,259.3
Equity 1,512.3 1,456.3
Current ratio 1.84 1.34
Gearing ratio 62.3% 63.2%
Net debt/EBITDA** 4.8 4.7
Interest coverage ratio** 2.3 5.3
Capex 96.5 34.8
Cash flow from operating activities*** 165.1 101.5
* P&L items on pro-forma consolidated basis **Normalized *** Excluding impact of transaction costs

2727
CONTENT
KEY BUSINESS DEVELOPMENTS in 2011 and ANNOUNCEMENT of EVENTS in FY12
FINANCIAL RESULTS in 2011
FY12 GUIDANCE

2828
FY12 GUIDANCE (I)
Strategic management
guidance
Further delivery of planned synergy potentials both on sales and costs side following finalisation of the first integration phase of Atlantic Grupa and Droga Kolinska;
Focus on execution of the second integration phase (consolidation of production facilities, information technology consolidation, real estate portfolio management) as the basis for further improvement of operating efficiency;
Further focus on organic growth through innovations in product categories and active brand management (new flavours, modernized packaging, product line extensions), strengthening the regional character of distribution business and further development of certain distribution channels as HoReCa segment;
Meeting financial commitments on regularly basis coupled with active debt and financial cost management;
Cost management through the CORE program and optimisation of operating processes on both centralised and lower levels, aiming to improve operating efficiency;
Prudent liquidity management;
Continuous analysis of global commodity markets with particular focus on coffee, sugar, cocoa and milk powder as well as more active application of hedging instruments;
More focused development of risk management on all levels in the company.

2929
FY12 GUIDANCE (II)
* In 2011, EBIT was calculated on normalised EBITDA level, however depreciation and amortization expenses
have not been normalized for the PPA impact in order to make it more comparable to 2012 guidance.
In HRKm2012 Guidance (excluding
one-offs)2011 Normalized 2012/2011
Sales 4,964 4,728 5.0%
EBITDA 550 517 6.3%
EBIT* 385 351 9.5%
Interest expense 223 222

3030
Appendix

3131
FY11 CONSOLIDATED INCOME STATEMENT (AUDITED)
In HRK000 FY11% of sales
FY10 Pro-forma
consolidated
% of sales
FY10 Stand-alone
% of sales
FY11/FY10 Pro-forma
cons.
FY11/FY10 Stand-alone
Turnover 4,774,385 101.0% 4,575,540 101.4% 2,301,945 101.5% 4.3% 107.4%Sales 4,727,766 100.0% 4,512,983 100.0% 2,268,641 100.0% 4.8% 108.4%Other income 46,619 1.0% 62,557 1.4% 33,304 1.5% -25.5% 40.0%Operating costs 4,273,714 90.4% 4,030,856 89.3% 2,081,899 91.8% 6.0% 105.3%Cost of merchandise sold 1,187,673 25.1% 1,201,640 26.6% 1,085,720 47.9% -1.2% 9.4%Change in inventories -5,772 -0.1% 5,665 0.1% -9,405 -0.4% n/a n/aProduction materials 1,579,935 33.4% 1,309,183 29.0% 291,074 12.8% 20.7% 442.8%Energy 61,238 1.3% 53,324 1.2% 12,141 0.5% 14.8% 404.4%Services 308,439 6.5% 327,564 7.3% 163,340 7.2% -5.8% 88.8%Personnel costs 635,047 13.4% 658,002 14.6% 325,942 14.4% -3.5% 94.8%Marketing expenses 313,218 6.6% 314,792 7.0% 148,692 6.6% -0.5% 110.6%Other expenses 212,994 4.5% 231,399 5.1% 128,510 5.7% -8.0% 65.7%Other (gains)/losses, net -19,058 -0.4% -70,713 -1.6% -64,115 -2.8% -73.0% -70.3%EBITDA 500,670 10.6% 544,684 12.1% 220,046 9.7% -8.1% 127.5%
EBIT 334,843 7.1% 294,252 6.5% 164,985 7.3% 13.8% 103.0%
EBT 78,837 1.7% 168,270 3.7% 123,122 5.4% -53.1% -36.0%Taxes 23,945 0.5% 21,844 0.5% 16,325 0.7% 9.6% 46.7%Net income 54,892 1.2% 146,426 3.2% 106,797 4.7% -62.5% -48.6%Minority interest 8,291 0.2% 13,088 0.3% 11,804 0.5% -36.7% -29.8%Net income II 46,601 1.0% 133,338 3.0% 94,993 4.2% -65.1% -50.9%

3232
FY11 NORMALIZED CONSOLIDATED INCOME STATEMENT (AUDITED)
In HRK000 FY11% of sales
FY10 Pro-forma
consolidated
% of sales
FY10 Stand-alone
% of sales
FY11/FY10 Pro-forma
cons.
FY11/FY10 Stand-alone
Turnover 4,774,385 101.0% 4,569,421 101.3% 2,295,825 101.2% 4.5% 108.0%Sales 4,727,766 100.0% 4,512,983 100.0% 2,268,641 100.0% 4.8% 108.4%Other income 46,619 1.0% 56,438 1.3% 27,184 1.2% -17.4% 71.5%Operating costs 4,257,105 90.0% 4,043,127 89.6% 2,094,170 92.3% 5.3% 103.3%Cost of merchandise sold 1,164,918 24.6% 1,201,640 26.6% 1,085,720 47.9% -3.1% 7.3%Change in inventories -5,772 -0.1% 5,665 0.1% -9,405 -0.4% n/a n/aProduction materials 1,579,935 33.4% 1,309,183 29.0% 291,074 12.8% 20.7% 442.8%Energy 61,238 1.3% 53,324 1.2% 12,141 0.5% 14.8% 404.4%Services 304,053 6.4% 308,166 6.8% 143,943 6.3% -1.3% 111.2%Personnel costs 635,047 13.4% 658,002 14.6% 325,942 14.4% -3.5% 94.8%Marketing expenses 313,218 6.6% 314,792 7.0% 148,692 6.6% -0.5% 110.6%Other expenses 211,564 4.5% 198,017 4.4% 95,128 4.2% 6.8% 122.4%Other (gains)/losses, net -7,096 -0.2% -5,663 -0.1% 935 0.0% 25.3% -858.9%EBITDA 517,280 10.9% 526,294 11.7% 201,656 8.9% -1.7% 156.5%
EBIT 309,169 6.5% 275,862 6.1% 146,595 6.5% 12.1% 110.9%
EBT 51,914 1.1% 149,127 3.3% 103,979 4.6% -65.2% -50.1%Taxes 23,945 0.5% 23,496 0.5% 17,978 0.8% 1.9% 33.2%Net income 27,969 0.6% 125,631 2.8% 86,001 3.8% -77.7% -67.5%Minority interest 8,291 0.2% 13,088 0.3% 11,804 0.5% -36.7% -29.8%Net income II 19,677 0.4% 112,543 2.5% 74,197 3.3% -82.5% -73.5%

3333
BUSINESS SEGMENTS
Gross revenues 2.784.594 458.099 654.224 373.558 2.276.696 744 6.547.915
Inter-segment revenues 24.532 337.961 4.340 27.015 1.379.682 - 1.773.530
Total revenues 2.760.062 120.138 649.884 346.543 897.014 744 4.774.385
EBITDA 93.993 86.893 20.116 22.986 270.659 6.023 500.670
Depreciation and amortization 13.722 30.333 5.748 6.990 100.893 8.141 165.827
EBIT 80.271 56.560 14.368 15.996 169.766 (2.118) 334.843
Total assets 973.849 566.217 196.322 620.003 3.421.431 (826.130) 4.951.692
Total assets at 31.12.2010 561.173 598.000 164.158 580.608 3.195.021 (208.437) 4.890.523
Gross revenues 1.308.296 492.044 558.412 330.832 n/p 9.647 2.699.231
Inter-segment revenues 21.397 352.128 4.024 19.737 n/p - 397.286
Total revenues 1.286.899 139.916 554.388 311.095 n/p 9.647 2.301.945
EBITDA 48.778 108.695 36.832 23.287 n/p 2.454 220.046
Depreciation and amortization 11.329 25.519 6.703 6.410 n/p 5.100 55.061
EBIT 37.449 83.176 30.129 16.877 n/p (2.646) 164.985
Droga Kolinska
Reconciliation Group
GroupDroga
KolinskaReconciliation
For the year ended 31 December 2010 (in thousands of HRK)
DistributionConsumer
Health Care
Sports and Functional
FoodPharma
PharmaSports and Functional
Food
For the year ended 31 December 2011 (in thousands of HRK)
DistributionConsumer
Health Care

3434
BALANCE SHEET as of 31 December 2011 (AUDITED)in thousands of HRK, audited 31 December 2011 % of total assets 31 December 2010 % of total assetsProperty, plant and equipment 1,189,502 22.21% 1,235,866 23.50%Investment propery 1,934 0.04% 2,481 0.05%Intangible assets 1,956,194 36.53% 1,929,631 36.69%Available-for-sale financial assets 1,358 0.03% 36,379 0.69%Derivative financial instrument 8,617 0.16% 0 0.00%Trade and other receivables 21,514 0.40% 23,736 0.45%Deferred tax assets 56,412 1.05% 53,714 1.02%Non-current assets 3,235,531 60.42% 3,281,807 62.40%Inventories 533,680 9.97% 503,013 9.56%Trade and other receivables 1,119,851 20.91% 1,100,134 20.92%Non-current assets held for sale 139,127 2.60% 111,310 2.12%Prepaid income tax 24,877 0.46% 17,951 0.34%Deposits given 36,334 0.68% 5,192 0.10%Derivative financial instrument 18,249 0.34% 7,939 0.15%Cash and cash equivalents 247,596 4.62% 231,978 4.41%Current assets 2,119,714 39.58% 1,977,517 37.60%Total assets 5,355,245 100.00% 5,259,324 100.00%
Capital and reserves att ributable to equity holders of the Company 1,444,404 26.97% 1,392,624 26.48%
Minority interest 67,920 1.27% 63,632 1.21%Borrowings 2,346,725 43.82% 2,007,781 38.18%Deferred tax liabil ities 193,064 3.61% 189,872 3.61%Derivative financial instrument 62,393 1.17% 26,446 0.50%Other non-current l iabil ities 36,357 0.68% 38,421 0.73%Provisions 54,540 1.02% 60,138 1.14%Non-current liabilities 2,693,079 50.29% 2,322,658 44.16%Trade and other payables 719,606 13.44% 731,668 13.91%Borrowings 375,035 7.00% 697,744 13.27%Current income tax l iabilities 12,553 0.23% 16,594 0.32%Derivative financial instrument 20,673 0.39% 8,898 0.17%Provisions 21,975 0.41% 25,506 0.48%Current liabilities 1,149,842 21.47% 1,480,410 28.15%Total liabilities 3,842,921 71.76% 3,803,068 72.31%Total equity and liabilities 5,355,245 100.00% 5,259,324 100.00%

3535
FY11 CONSOLIDATED CASH FLOW STATEMENT (AUDITED)
Net cash from operating activities amounted to HRK 165.1m in FY11 and HRK 101.5m in FY10, once transaction costs excluded
HRK 000 Jan - Dec 2011 Jan - Dec 2010
Net cash flow from operating activities 159.266 49.249Net CFO before interest and income tax paid 382.167 102.497
Cash flow from investing activities (55.924) (1.568.133)O/w Capex (96.525) (34.830)
Net cash flow from / (used in) financing activities (90.925) 1.677.640
Net increase / (decrease) in cash and cash equivalents 12.417 158.756
Exchange gains / (losses) on cash and cash equivalents 3.201 (1.358)
Cash and cash equivalents at beginning of period 231.978 74.580Cash and cash equivalents at end of period 247.596 231.978

3636
Q & A
Thank you for your attention!