Embed Size (px)
Citation preview
11Department of Agriculture, Government of Uttar Pradesh
(24-25 Sept. 2013 )
National Conference on AgricultureNational Conference on AgricultureFor For
Rabi Campaign 2013-14Rabi Campaign 2013-14
2
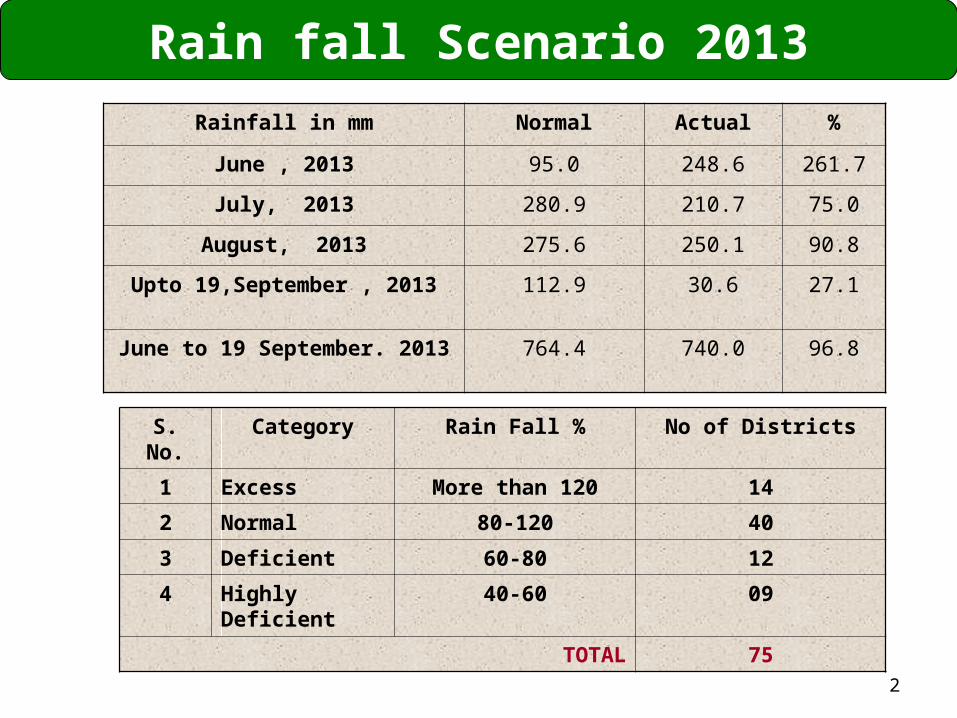
Rain fall Scenario 2013
Rainfall in mm Normal Actual %
June , 2013 95.0 248.6 261.7
July, 2013 280.9 210.7 75.0
August, 2013 275.6 250.1 90.8
Upto 19,September , 2013 112.9 30.6 27.1
June to 19 September. 2013 764.4 740.0 96.8
S. No. Category Rain Fall % No of Districts
1 Excess More than 120 14
2 Normal 80-120 40
3 Deficient 60-80 12
4 Highly Deficient 40-60 09
TOTAL 75
3
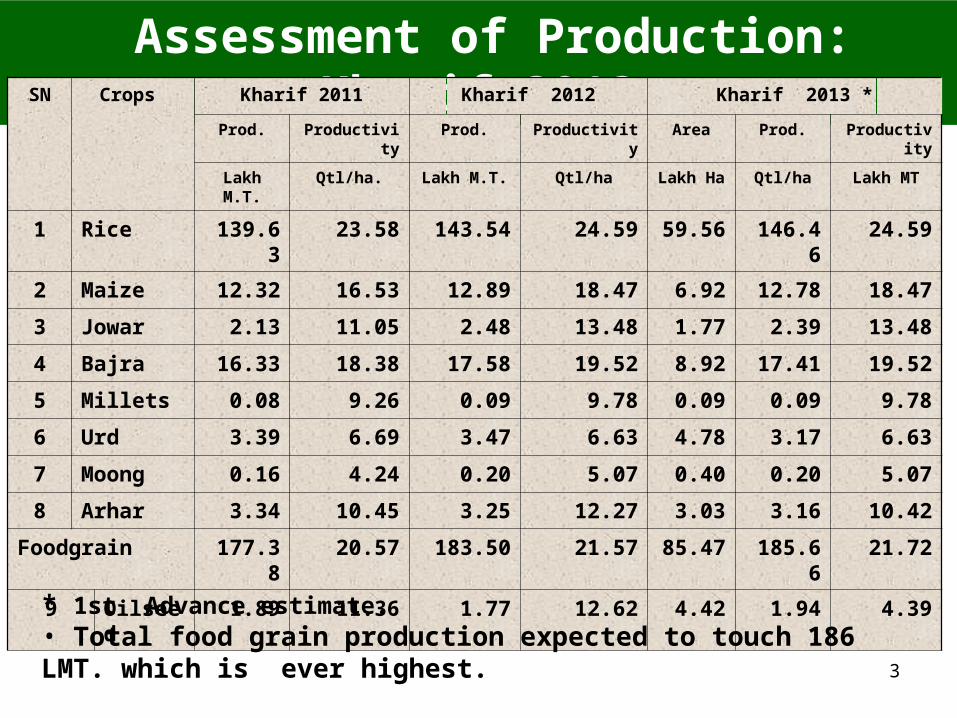
Assessment of Production: Kharif 2013SN Crops Kharif 2011 Kharif 2012 Kharif 2013 *
Prod. Productivity Prod. Productivity Area Prod. Productivity
Lakh M.T. Qtl/ha. Lakh M.T. Qtl/ha Lakh Ha Qtl/ha Lakh MT
1 Rice 139.63 23.58 143.54 24.59 59.56 146.46 24.59
2 Maize 12.32 16.53 12.89 18.47 6.92 12.78 18.47
3 Jowar 2.13 11.05 2.48 13.48 1.77 2.39 13.48
4 Bajra 16.33 18.38 17.58 19.52 8.92 17.41 19.52
5 Millets 0.08 9.26 0.09 9.78 0.09 0.09 9.78
6 Urd 3.39 6.69 3.47 6.63 4.78 3.17 6.63
7 Moong 0.16 4.24 0.20 5.07 0.40 0.20 5.07
8 Arhar 3.34 10.45 3.25 12.27 3.03 3.16 10.42
Foodgrain 177.38 20.57 183.50 21.57 85.47 185.66 21.72
9 Oilseed 1.89 11.36 1.77 12.62 4.42 1.94 4.39
* 1st Advance estimate. • Total food grain production expected to touch 186 LMT. which is ever highest.
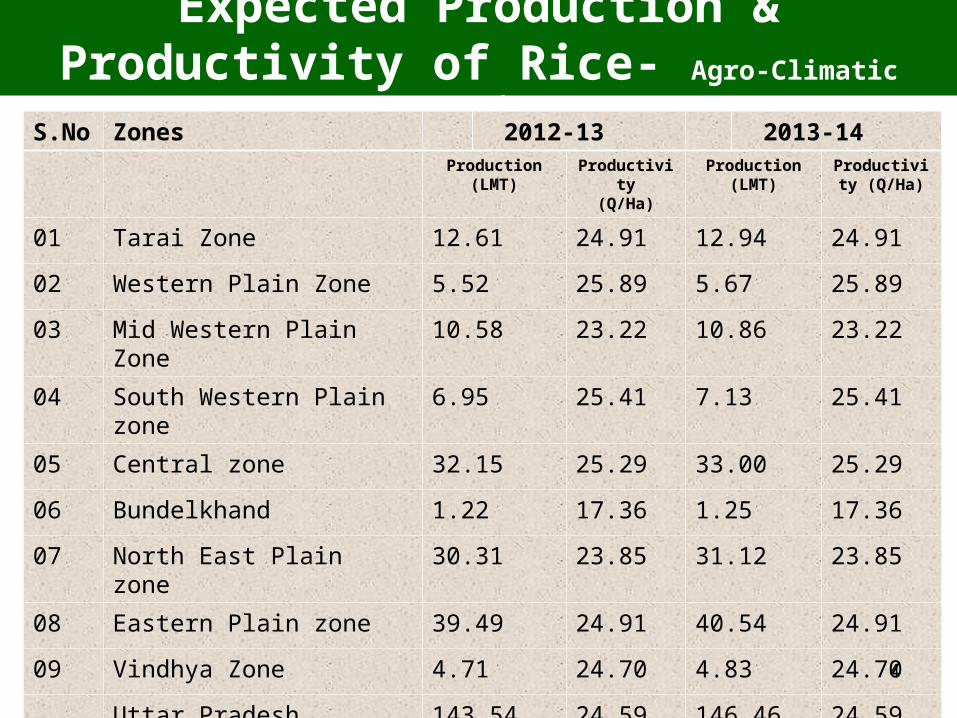
Expected Production & Productivity of Rice- Agro-Climatic Zonewise
S.No Zones 2012-13 2013-14Production
(LMT)Productivity
(Q/Ha)Production
(LMT)Productivity
(Q/Ha)
01 Tarai Zone 12.61 24.91 12.94 24.91
02 Western Plain Zone 5.52 25.89 5.67 25.89
03 Mid Western Plain Zone 10.58 23.22 10.86 23.22
04 South Western Plain zone 6.95 25.41 7.13 25.41
05 Central zone 32.15 25.29 33.00 25.29
06 Bundelkhand 1.22 17.36 1.25 17.36
07 North East Plain zone 30.31 23.85 31.12 23.85
08 Eastern Plain zone 39.49 24.91 40.54 24.91
09 Vindhya Zone 4.71 24.70 4.83 24.70
Uttar Pradesh 143.54 24.59 146.46 24.594
5
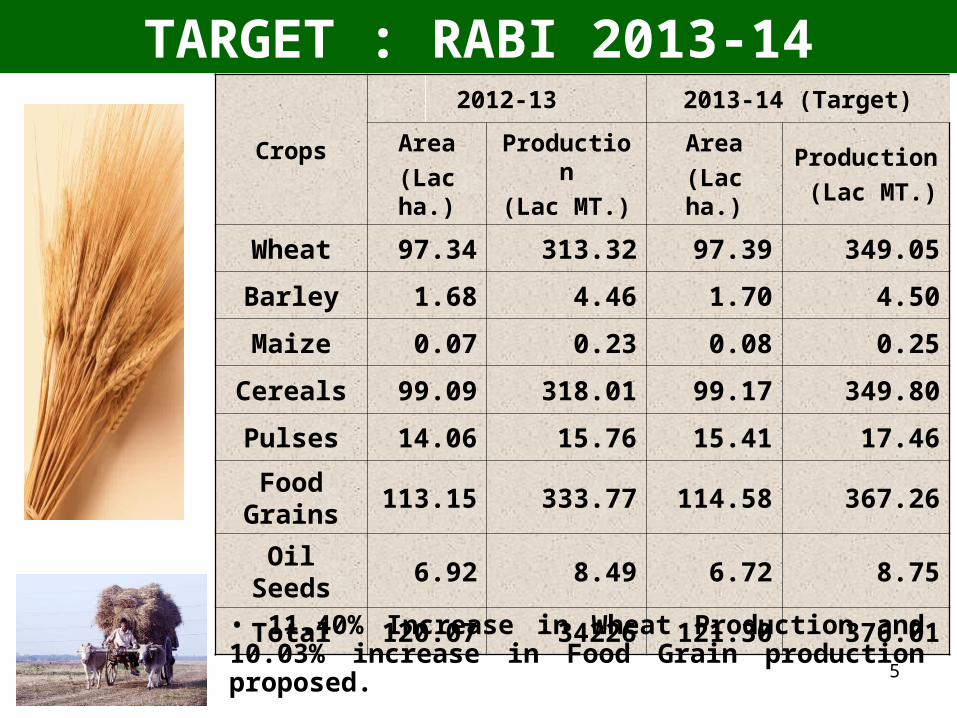
TARGET : RABI 2013-14
Crops
2012-13 2013-14 (Target)
Area
(Lac ha.)
Production
(Lac MT.)
Area
(Lac ha.)
Production
(Lac MT.)
Wheat 97.34 313.32 97.39 349.05
Barley 1.68 4.46 1.70 4.50
Maize 0.07 0.23 0.08 0.25
Cereals 99.09 318.01 99.17 349.80
Pulses 14.06 15.76 15.41 17.46
Food Grains
113.15 333.77 114.58 367.26
Oil Seeds 6.92 8.49 6.72 8.75
Total 120.07 34226 121.30 376.01
• 11.40% Increase in Wheat Production and 10.03% increase in Food Grain production proposed.
6
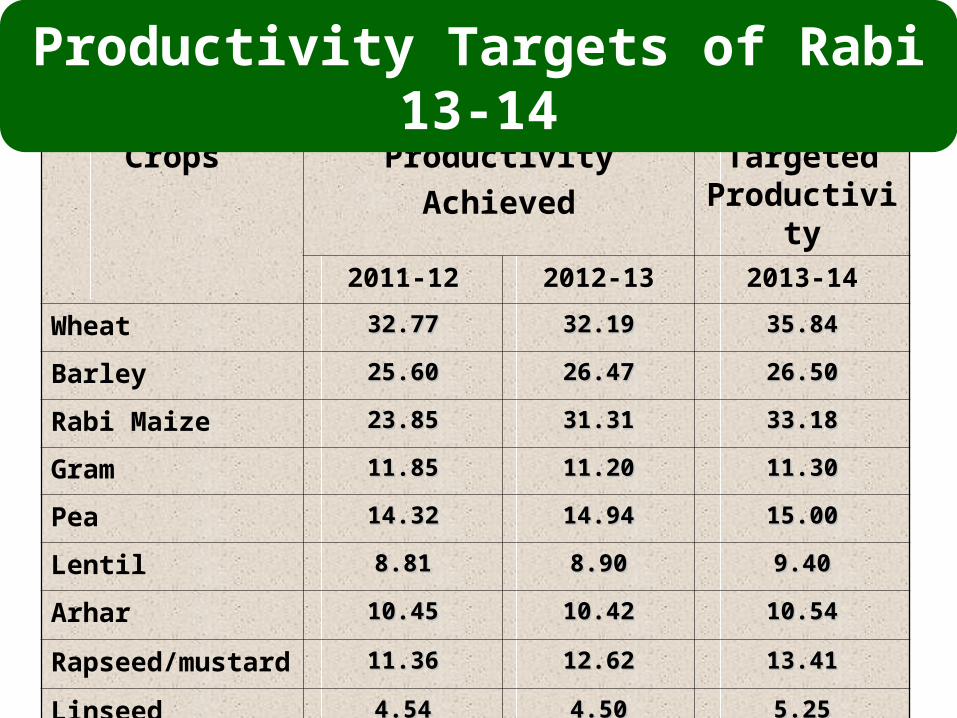
Crops Productivity
Achieved
Targeted Productivity
2011-12 2012-13 2013-14
Wheat 32.7732.77 32.1932.19 35.8435.84
Barley 25.6025.60 26.4726.47 26.5026.50
Rabi Maize 23.8523.85 31.3131.31 33.1833.18
Gram 11.8511.85 11.2011.20 11.3011.30
Pea 14.3214.32 14.9414.94 15.0015.00
Lentil 8.818.81 8.908.90 9.409.40
Arhar 10.4510.45 10.4210.42 10.5410.54
Rapseed/mustard 11.3611.36 12.6212.62 13.4113.41
Linseed 4.544.54 4.504.50 5.255.25
Qtls/ha
Productivity Targets of Rabi 13-14
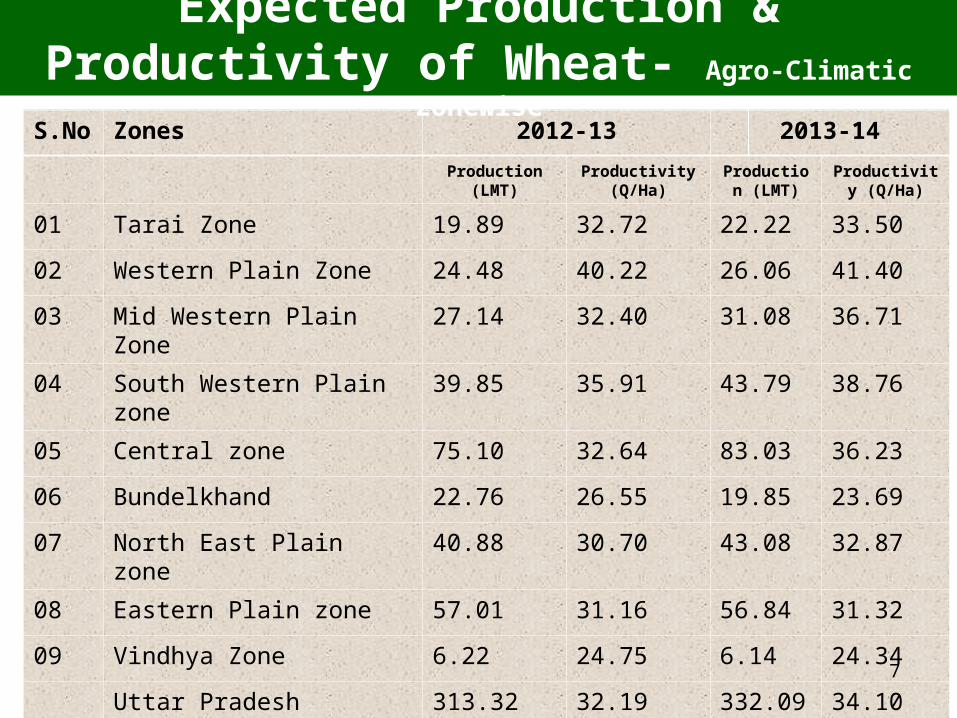
S.No Zones 2012-13 2013-14
Production(LMT)
Productivity(Q/Ha)
Production (LMT)
Productivity (Q/Ha)
01 Tarai Zone 19.89 32.72 22.22 33.50
02 Western Plain Zone 24.48 40.22 26.06 41.40
03 Mid Western Plain Zone 27.14 32.40 31.08 36.71
04 South Western Plain zone 39.85 35.91 43.79 38.76
05 Central zone 75.10 32.64 83.03 36.23
06 Bundelkhand 22.76 26.55 19.85 23.69
07 North East Plain zone 40.88 30.70 43.08 32.87
08 Eastern Plain zone 57.01 31.16 56.84 31.32
09 Vindhya Zone 6.22 24.75 6.14 24.34
Uttar Pradesh 313.32 32.19 332.09 34.107
Expected Production & Productivity of Wheat- Agro-Climatic Zonewise
8
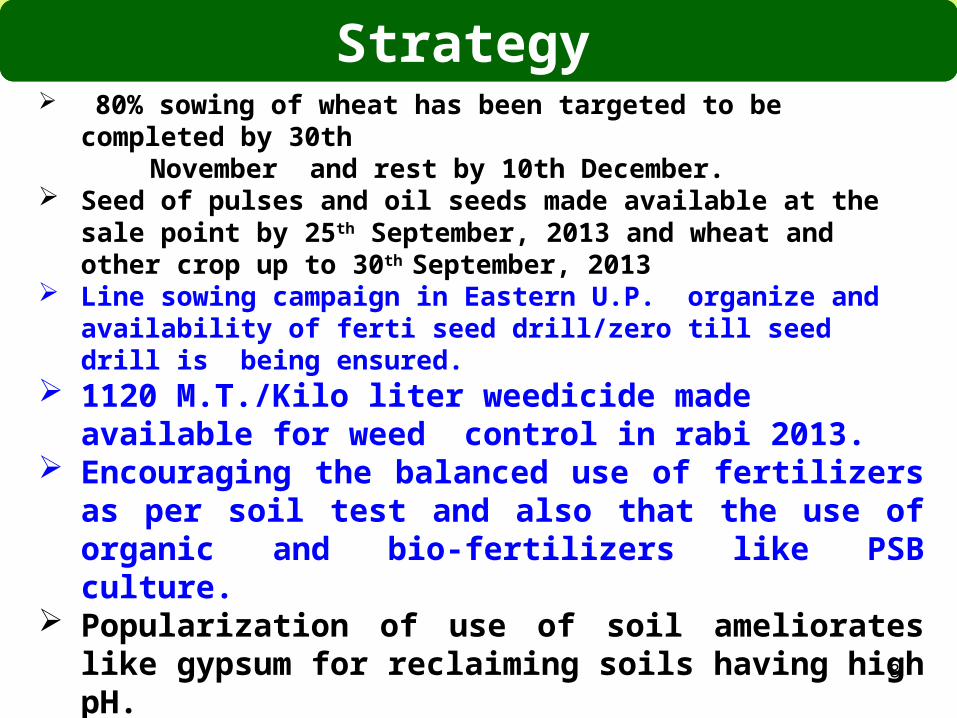
Strategy 80% sowing of wheat has been targeted to be completed by 30th November and rest by 10th December. Seed of pulses and oil seeds made available at the sale point by
25th September, 2013 and wheat and other crop up to 30th
September, 2013 Line sowing campaign in Eastern U.P. organize and availability of
ferti seed drill/zero till seed drill is being ensured. 1120 M.T./Kilo liter weedicide made available for weed
control in rabi 2013. Encouraging the balanced use of fertilizers as per soil test and
also that the use of organic and bio-fertilizers like PSB culture.
Popularization of use of soil ameliorates like gypsum for reclaiming soils having high pH.
Encouraging efficient on farm water management. Bringing more area under micro irrigation sprinkler & drip
irrigation, especially in Bunldelkhand region.
StrategyStrategy Strategy
• Seed rolling plan up to 2016-17 prepared .
• Higher subsidy on promotional varieties up to the age of 10 years and lesser subsidy on maintenance variety of 10 to 15 years and no subsidy on varieties above 15 years.
• Promotion of stress tolerance varieties.
• Focus on varietals replacement rate.
• Discouraging the use of highly toxic plant protection chemicals.
• Promotion of use of bio pesticides and bio agents.
• Popularizing multi Crop planter, Raised bed planter and Rotavator.
• Training for skilled man power for maintenance and use of farm machinery.
• Two tire system to ensure quality of agriculture inputs (Zinc sulphate, micro nutrients and pesticides).
Initiatives
10
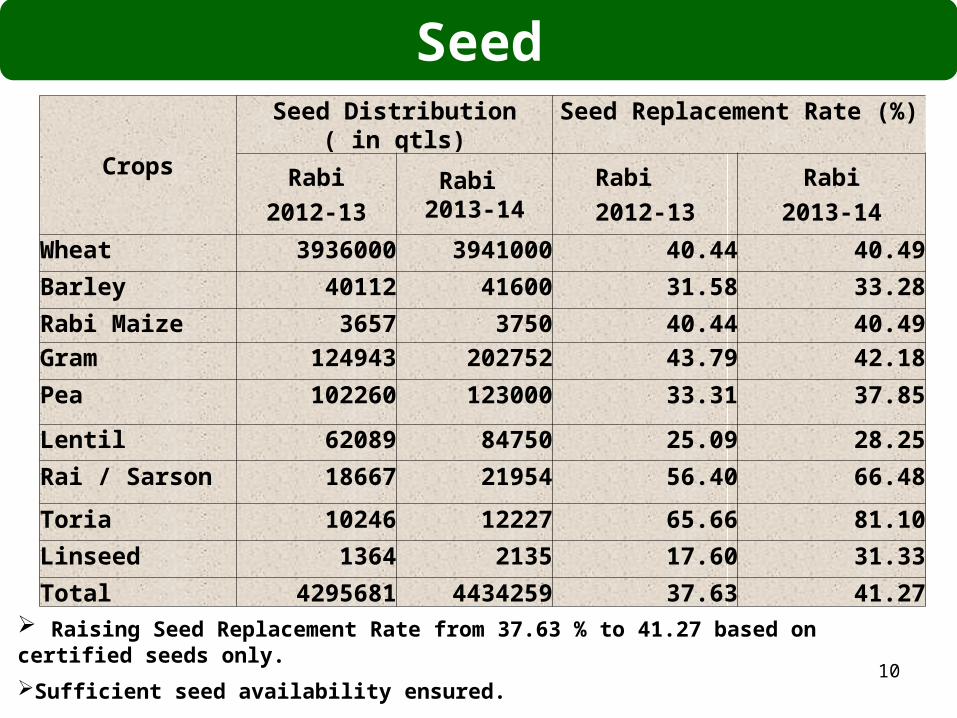
Seed
Raising Seed Replacement Rate from 37.63 % to 41.27 based on certified seeds only.
Sufficient seed availability ensured.
Crops
Seed Distribution( in qtls)
Seed Replacement Rate (%)
Rabi
2012-13 Rabi
2013-14Rabi
2012-13
Rabi
2013-14
Wheat 3936000 3941000 40.44 40.49
Barley 40112 41600 31.58 33.28
Rabi Maize 3657 3750 40.44 40.49
Gram 124943 202752 43.79 42.18
Pea 102260 123000 33.31 37.85
Lentil 62089 84750 25.09 28.25
Rai / Sarson 18667 21954 56.40 66.48
Toria 10246 12227 65.66 81.10
Linseed 1364 2135 17.60 31.33
Total 4295681 4434259 37.63 41.27
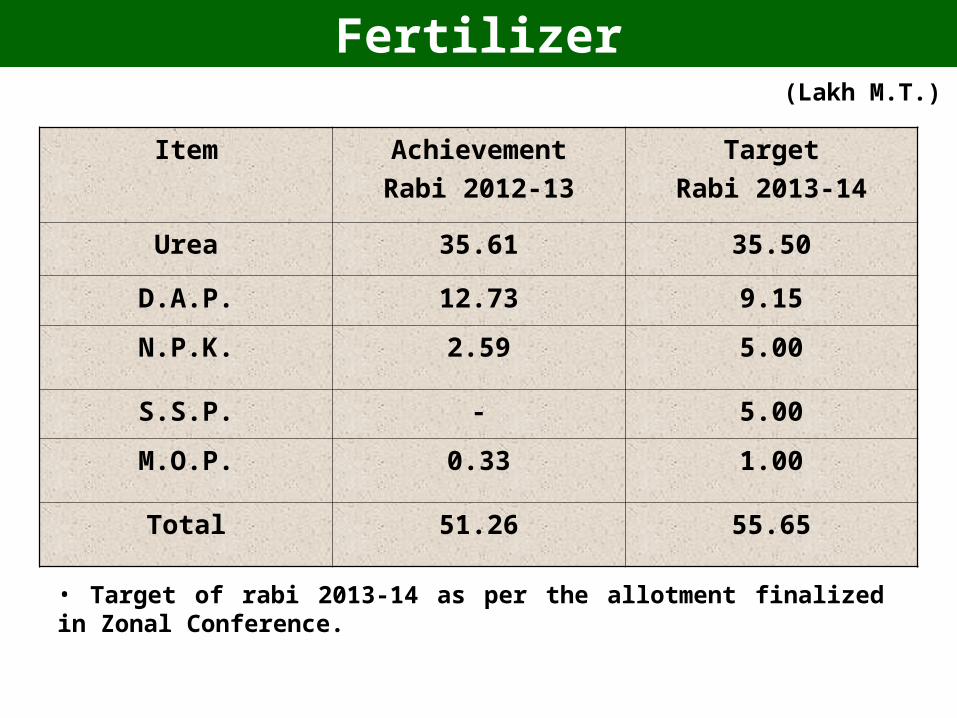
Item Achievement
Rabi 2012-13
Target
Rabi 2013-14
Urea 35.61 35.50
D.A.P. 12.73 9.15
N.P.K. 2.59 5.00
S.S.P. - 5.00
M.O.P. 0.33 1.00
Total 51.26 55.65
(Lakh M.T.)
• Target of rabi 2013-14 as per the allotment finalized in Zonal Conference.
Fertilizer
12
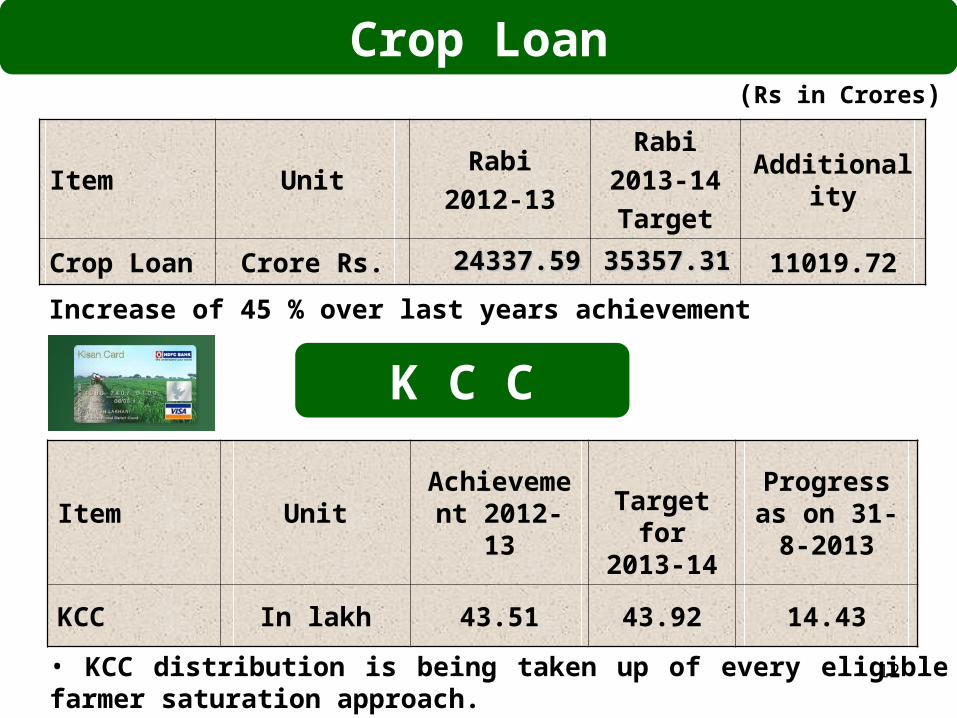
Crop Loan
Item UnitRabi
2012-13
Rabi
2013-14
Target
Additionality
Crop Loan Crore Rs. 24337.5924337.59 35357.3135357.31 11019.72
Increase of 45 % over last years achievement
(Rs in Crores)
K C C
Item UnitAchievement
2012-13 Target for 2013-14
Progress as on 31-8-2013
KCC In lakh 43.51 43.92 14.43
• KCC distribution is being taken up of every eligible farmer saturation approach.
Crop Loan
13
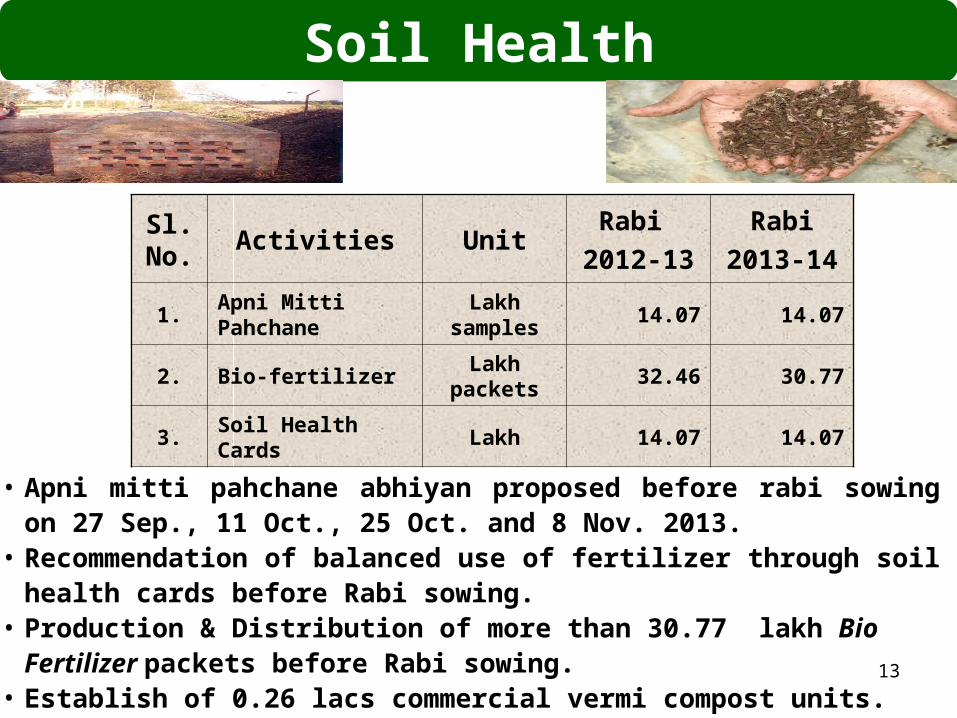
Sl. No.
Activities UnitRabi
2012-13
Rabi
2013-14
1.Apni Mitti Pahchane
Lakh samples
14.07 14.07
2. Bio-fertilizerLakh
packets32.46 30.77
3. Soil Health Cards Lakh 14.07 14.07
Soil Health
• Apni mitti pahchane abhiyan proposed before rabi sowing on 27 Sep., 11 Oct., 25 Oct. and 8 Nov. 2013.
• Recommendation of balanced use of fertilizer through soil health cards before Rabi sowing.
• Production & Distribution of more than 30.77 lakh Bio Fertilizer packets before Rabi sowing.
• Establish of 0.26 lacs commercial vermi compost units.
14
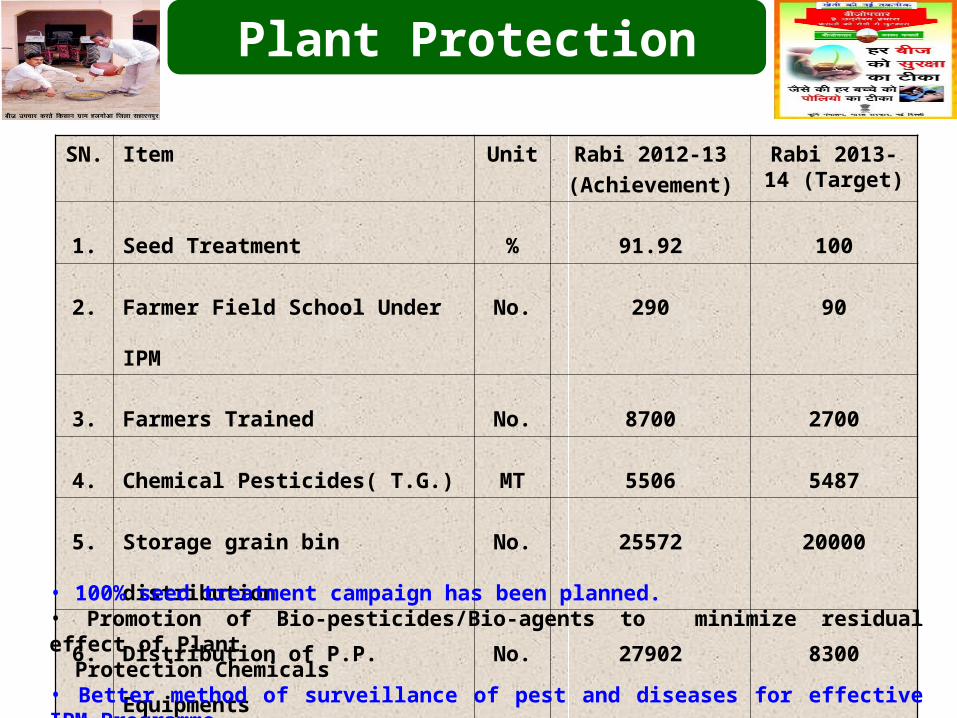
SN. Item Unit Rabi 2012-13
(Achievement)
Rabi 2013-14 (Target)
1. Seed Treatment % 91.92 100
2. Farmer Field School Under IPM No. 290 90
3. Farmers Trained No. 8700 2700
4. Chemical Pesticides( T.G.) MT 5506 5487
5. Storage grain bin distribution No. 25572 20000
6. Distribution of P.P. Equipments No. 27902 8300
• 100% seed treatment campaign has been planned. • Promotion of Bio-pesticides/Bio-agents to minimize residual effect of Plant Protection Chemicals • Better method of surveillance of pest and diseases for effective IPM Programme.
Plant Protection
15
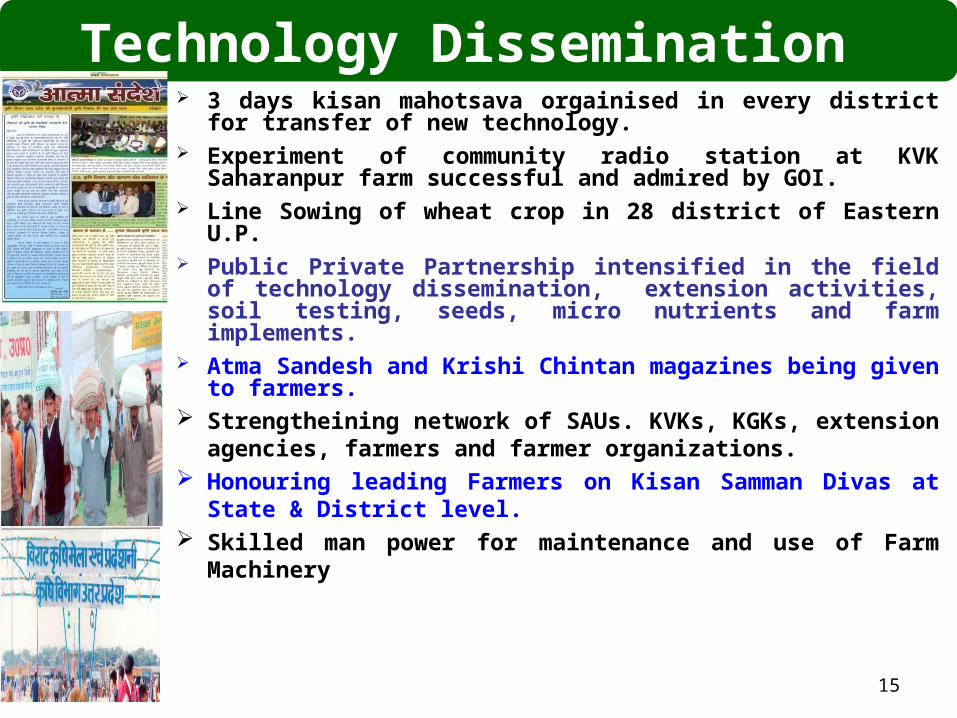
3 days kisan mahotsava orgainised in every district for transfer of new technology.
Experiment of community radio station at KVK Saharanpur farm successful and admired by GOI.
Line Sowing of wheat crop in 28 district of Eastern U.P. Public Private Partnership intensified in the field of
technology dissemination, extension activities, soil testing, seeds, micro nutrients and farm implements.
Atma Sandesh and Krishi Chintan magazines being given to farmers.
Strengtheining network of SAUs. KVKs, KGKs, extension agencies, farmers and farmer organizations.
Honouring leading Farmers on Kisan Samman Divas at State & District level.
Skilled man power for maintenance and use of Farm Machinery
Technology Dissemination
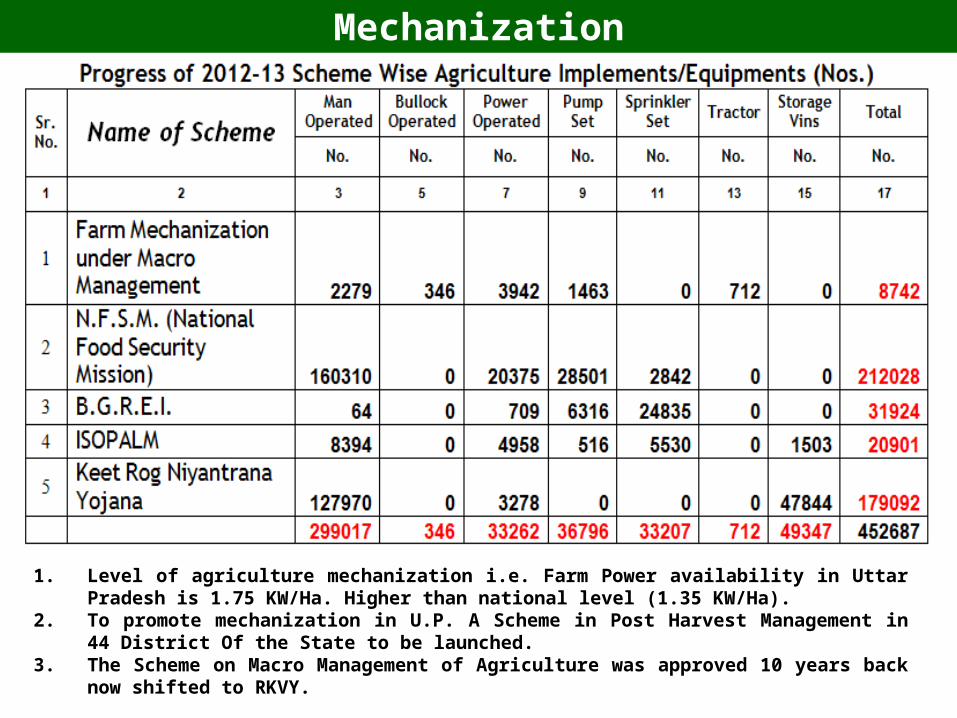
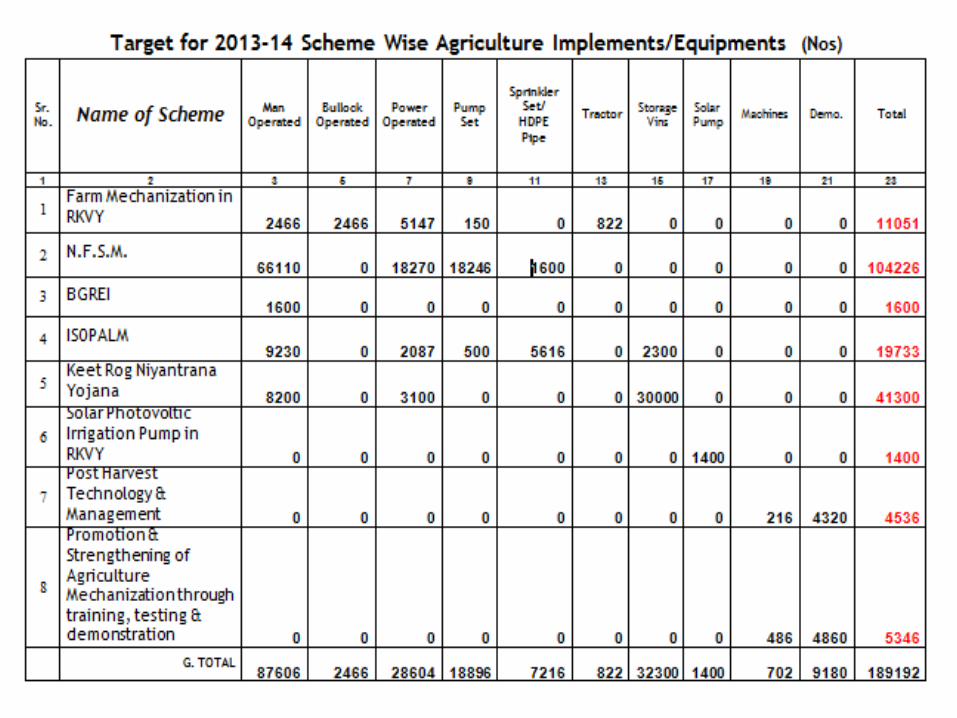
1. Level of agriculture mechanization i.e. Farm Power availability in Uttar Pradesh is 1.75 KW/Ha. Higher than national level (1.35 KW/Ha).
2. To promote mechanization in U.P. A Scheme in Post Harvest Management in 44 District Of the State to be launched.
3. The Scheme on Macro Management of Agriculture was approved 10 years back now shifted to RKVY.
Mechanization
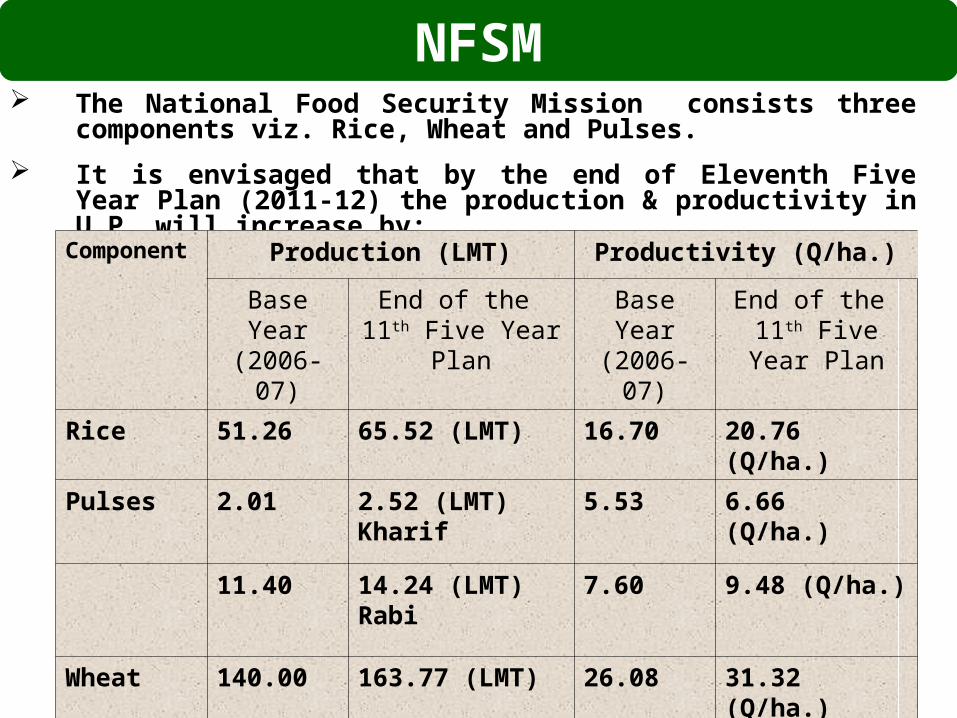
The National Food Security Mission consists three components viz. Rice, Wheat and Pulses.
It is envisaged that by the end of Eleventh Five Year Plan (2011-12) the production & productivity in U.P. will increase by:
Component Production (LMT) Productivity (Q/ha.)
Base Year(2006-07)
End of the 11th Five Year Plan
Base Year(2006-07)
End of the 11th Five Year Plan
Rice 51.26 65.52 (LMT) 16.70 20.76 (Q/ha.)
Pulses 2.01 2.52 (LMT) Kharif 5.53 6.66 (Q/ha.)
11.40 14.24 (LMT) Rabi 7.60 9.48 (Q/ha.)
Wheat 140.00 163.77 (LMT) 26.08 31.32 (Q/ha.)
NFSM
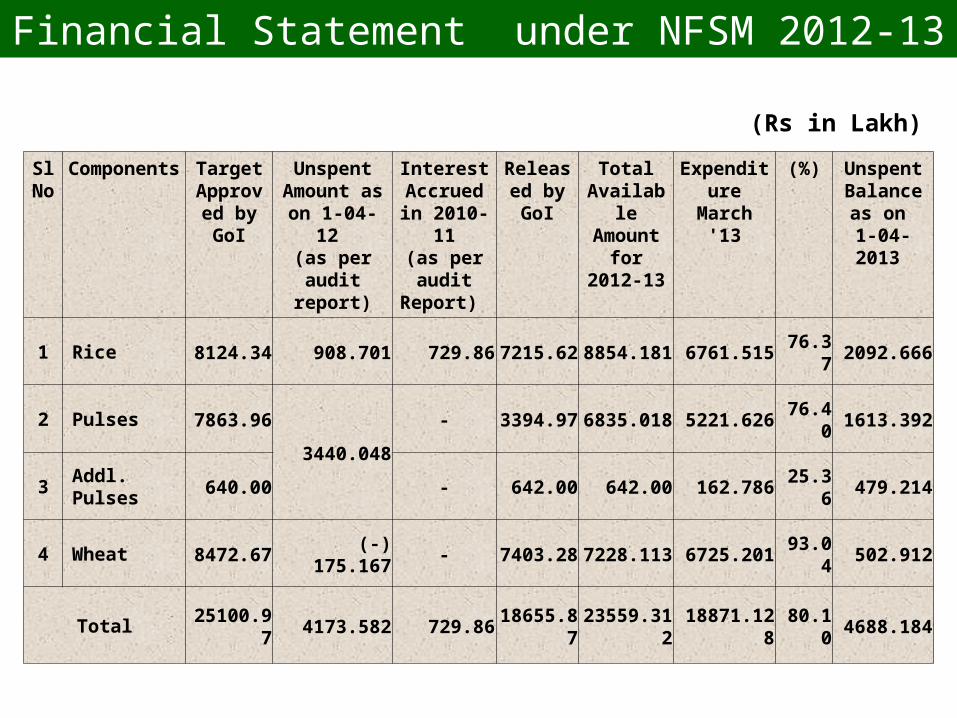
Financial Statement under NFSM 2012-13
Sl No
Components Target Approved
by GoI
Unspent Amount as on
1-04-12 (as per audit
report)
Interest Accrued in
2010-11(as per audit
Report)
Released by GoI
Total Available
Amount for 2012-13
ExpenditureMarch '13
(%) Unspent Balance as
on 1-04-2013
1 Rice 8124.34 908.701 729.86 7215.62 8854.181 6761.515 76.37 2092.666
2 Pulses 7863.96
3440.048
- 3394.97 6835.018 5221.626 76.40 1613.392
3Addl. Pulses
640.00 - 642.00 642.00 162.786 25.36 479.214
4 Wheat 8472.67 (-) 175.167 - 7403.28 7228.113 6725.201 93.04 502.912
Total 25100.97 4173.582 729.86 18655.87 23559.312 18871.128 80.10 4688.184
(Rs in Lakh)
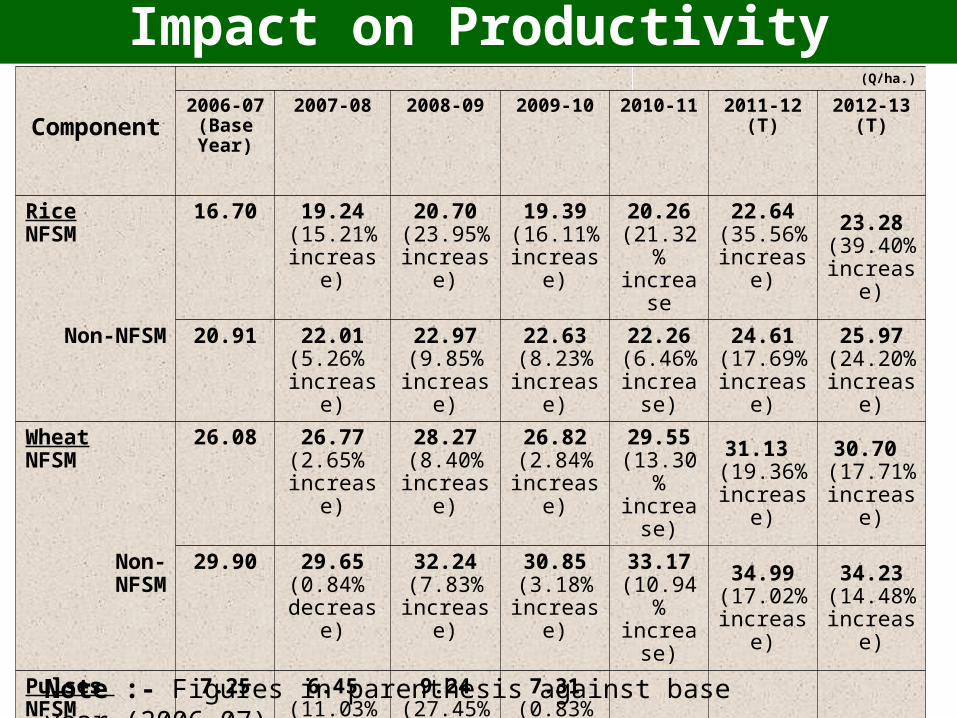
Component (Q/ha.)
2006-07(Base Year)
2007-08 2008-09 2009-10 2010-11 2011-12(T)
2012-13 (T)
Rice NFSM 16.70 19.24(15.21% increase)
20.70(23.95%increase)
19.39(16.11%increase)
20.26(21.32%increase
22.64(35.56% increase)
23.28(39.40% increase)
Non-NFSM 20.91 22.01(5.26% increase)
22.97(9.85%
increase)
22.63(8.23%
increase)
22.26(6.46%
increase)
24.61(17.69% increase)
25.97(24.20% increase)
Wheat NFSM 26.08 26.77(2.65% increase)
28.27(8.40%
increase)
26.82(2.84%
increase)
29.55(13.30%increase)
31.13 (19.36%increase)
30.70 (17.71%increase)
Non-NFSM 29.90 29.65(0.84%
decrease)
32.24(7.83%
increase)
30.85(3.18%
increase)
33.17(10.94%increase)
34.99(17.02%increase)
34.23(14.48%increase)
Pulses NFSM 7.25 6.45(11.03% decrease)
9.24(27.45%increase)
7.31(0.83%
increase) 8.24(12.11%increase)
9.92(34.96%increase)
9.98 Non-NFSM
Avg.
7.55
7.35
8.48(12.32%increase)
8.50(12.58%increase)
7.95(5.30%
increase)
Note :- Figures in parenthesis against base year (2006-07)
Impact on Productivity
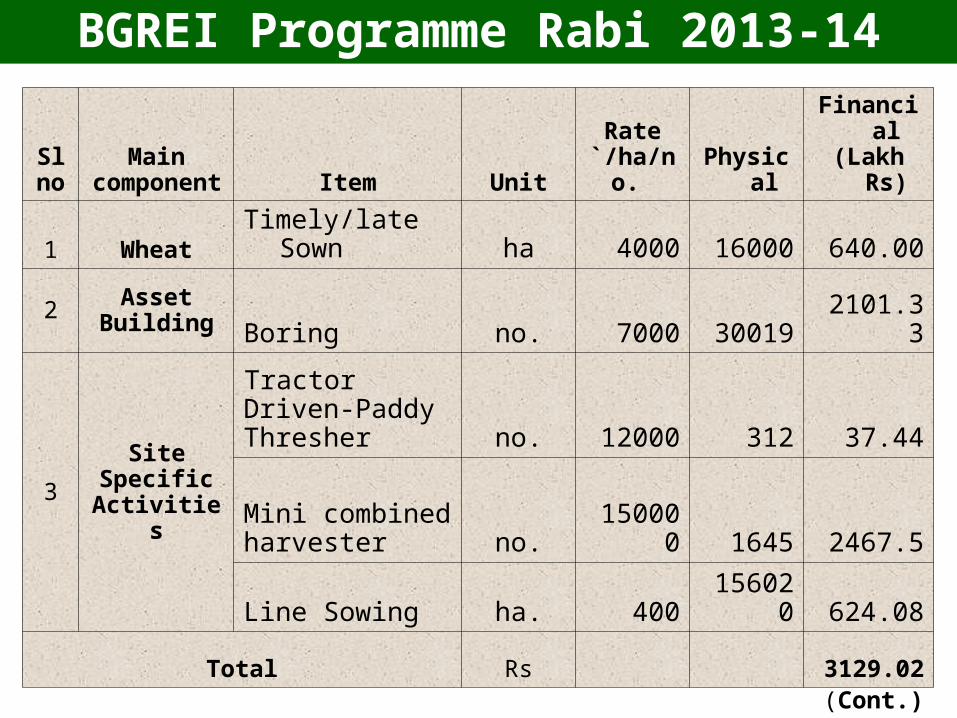
BGREI Programme Rabi 2013-14
Sl no
Main component Item Unit
Rate `/ha/no. Physical
Financial(Lakh Rs)
1 Wheat Timely/late Sown ha 4000 16000 640.00
2 AssetBuilding Boring no. 7000 30019 2101.33
3 Site Specific Activities
Tractor Driven-Paddy Thresher no. 12000 312 37.44
Mini combined harvester no. 150000 1645 2467.5
Line Sowing ha. 400 156020 624.08
Total Rs 3129.02
(Cont.)
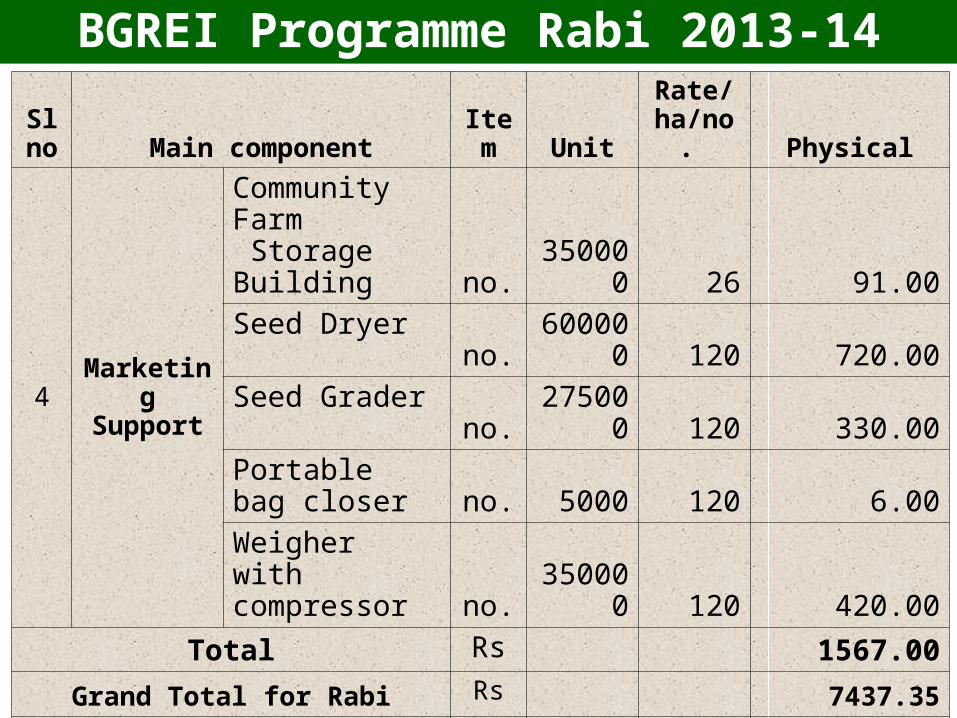
Sl no Main component Item Unit
Rate/ ha/no. Physical
4 Marketing Support
Community Farm Storage Building no. 350000 26 91.00
Seed Dryerno. 600000 120 720.00
Seed Grader no. 275000 120 330.00
Portable bag closer no. 5000 120 6.00
Weigher with compressor no. 350000 120 420.00
Total Rs 1567.00
Grand Total for Rabi Rs 7437.35
Total for the project Rs 15730.00
BGREI Programme Rabi 2013-14
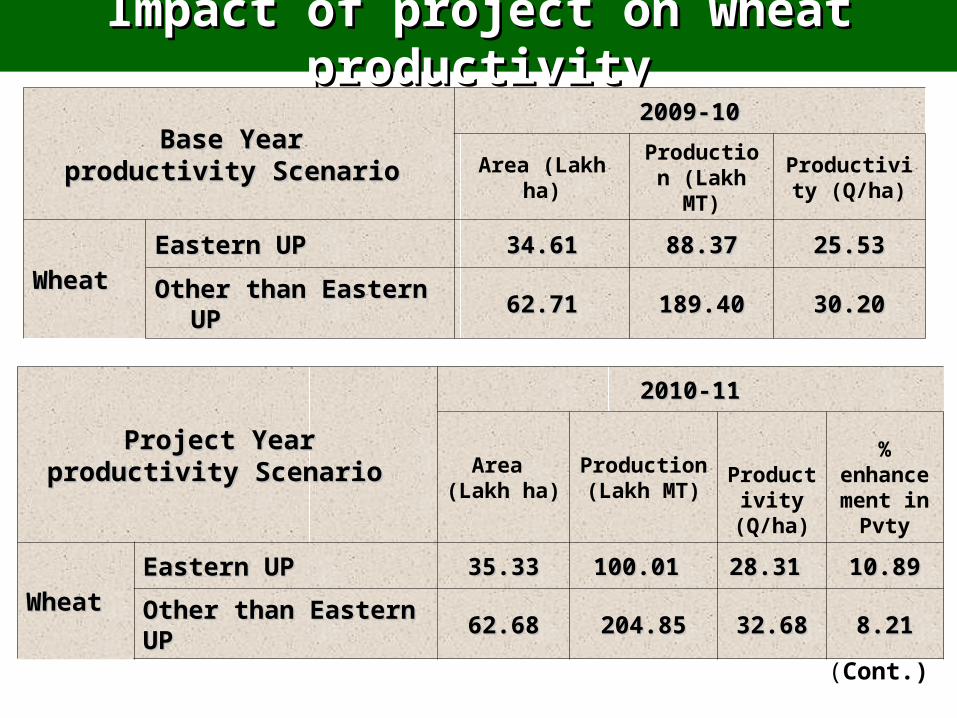
Impact of project on wheat productivityImpact of project on wheat productivity
Base Year Base Year productivity Scenarioproductivity Scenario
2009-102009-10
Area (Lakh ha)Production (Lakh MT)
Productivity (Q/ha)
WheatWheatEastern UPEastern UP 34.6134.61 88.3788.37 25.5325.53
Other than Eastern UPOther than Eastern UP 62.7162.71 189.40189.40 30.2030.20
Project Year Project Year productivity Scenarioproductivity Scenario
2010-112010-11
Area (Lakh ha)
Production (Lakh MT)
Productivity
(Q/ha)
% enhancement in
Pvty
WheatWheatEastern UPEastern UP 35.3335.33 100.01 100.01 28.31 28.31 10.8910.89
Other than Eastern UPOther than Eastern UP 62.6862.68 204.85204.85 32.6832.68 8.218.21
(Cont.)
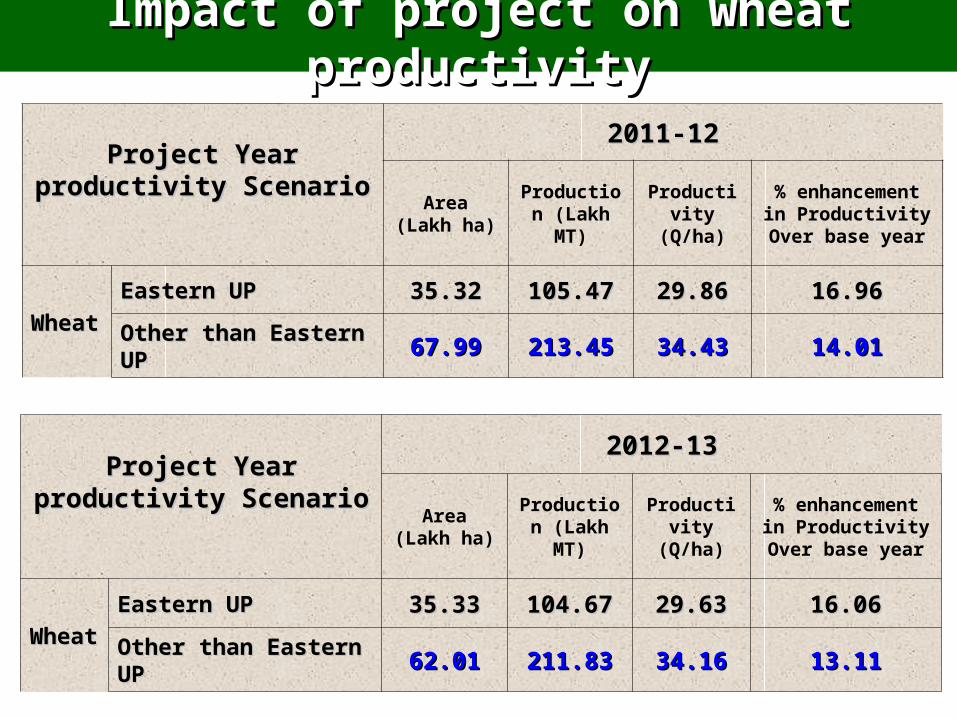
Project Year productivity Project Year productivity Scenario Scenario
2011-122011-12
Area (Lakh ha)
Production (Lakh MT)
Productivity (Q/ha)
% enhancement in Productivity
Over base year
WheatWheatEastern UPEastern UP 35.3235.32 105.47105.47 29.8629.86 16.9616.96
Other than Eastern UPOther than Eastern UP 67.9967.99 213.45213.45 34.4334.43 14.0114.01
Impact of project on wheat productivityImpact of project on wheat productivity
Project Year productivity Project Year productivity Scenario Scenario
2012-132012-13
Area (Lakh ha)
Production (Lakh MT)
Productivity (Q/ha)
% enhancement in Productivity
Over base year
WheatWheatEastern UPEastern UP 35.3335.33 104.67104.67 29.6329.63 16.0616.06
Other than Eastern UPOther than Eastern UP 62.0162.01 211.83211.83 34.1634.16 13.1113.11
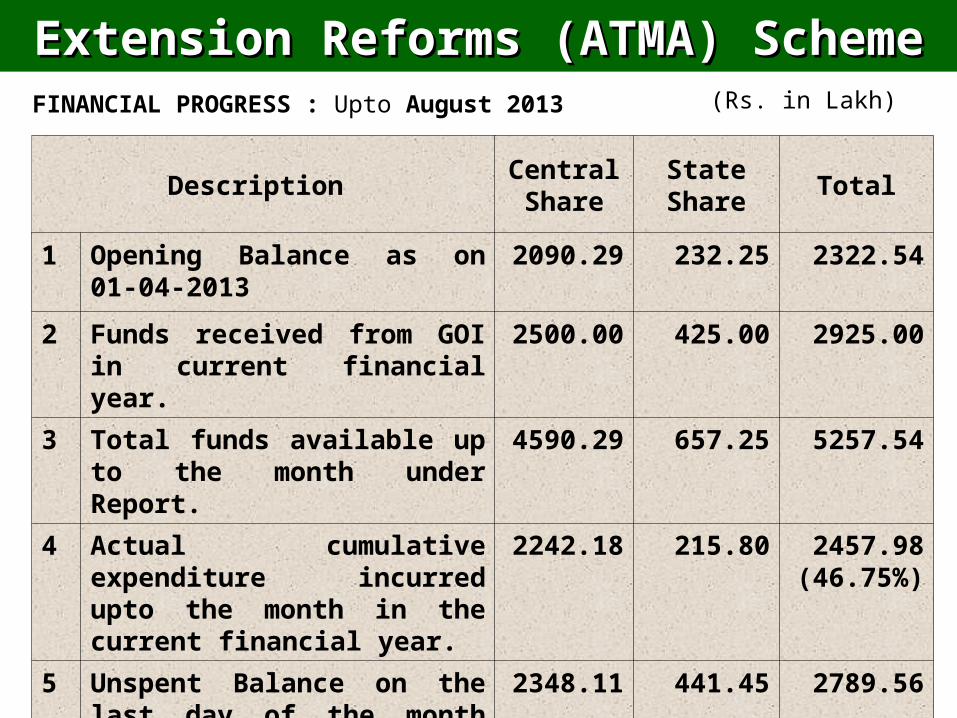
Description Central Share
State Share
Total
1 Opening Balance as on 01-04-2013
2090.29 232.25 2322.54
2 Funds received from GOI in current financial year.
2500.00 425.00 2925.00
3 Total funds available up to the month under Report.
4590.29 657.25 5257.54
4 Actual cumulative expenditure incurred upto the month in the current financial year.
2242.18 215.80 2457.98(46.75%)
5 Unspent Balance on the last day of the month under report.
2348.11 441.45 2789.56
FINANCIAL PROGRESS : Upto August 2013
Extension Reforms (ATMA) SchemeExtension Reforms (ATMA) Scheme(Rs. in Lakh)
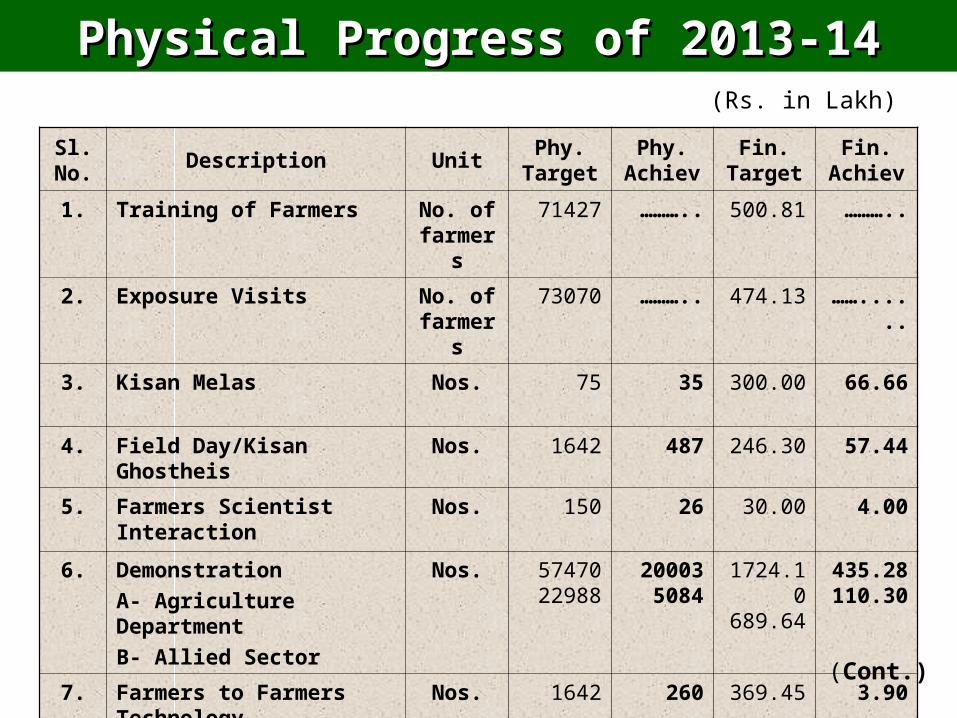
Sl. No.
Description UnitPhy.
TargetPhy.
AchievFin.
TargetFin.
Achiev
1. Training of Farmers No. of farmers
71427 ……….. 500.81 ………..
2. Exposure Visits No. of farmers
73070 ……….. 474.13 ……......
3. Kisan Melas Nos. 75 35 300.00 66.66
4. Field Day/Kisan Ghostheis Nos. 1642 487 246.30 57.44
5. Farmers Scientist Interaction
Nos. 150 26 30.00 4.00
6. Demonstration
A- Agriculture Department
B- Allied Sector
Nos. 5747022988
200035084
1724.10689.64
435.28110.30
7. Farmers to Farmers Technology Dissemination
Nos. 1642 260 369.45 3.90
Physical Progress of 2013-14Physical Progress of 2013-14(Rs. in Lakh)
(Cont.)
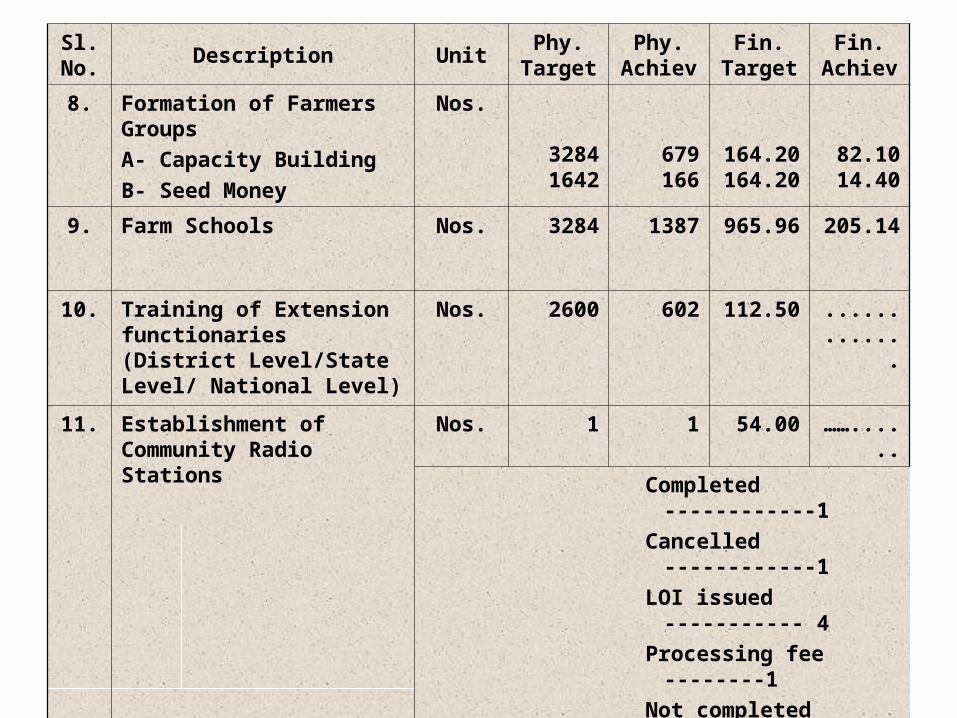
Sl. No.
Description UnitPhy.
TargetPhy.
AchievFin.
TargetFin.
Achiev
8. Formation of Farmers Groups
A- Capacity Building
B- Seed Money
Nos.
32841642
679166
164.20164.20
82.1014.40
9. Farm Schools Nos. 3284 1387 965.96 205.14
10. Training of Extension functionaries (District Level/State Level/ National Level)
Nos. 2600 602 112.50 .............
11. Establishment of Community Radio Stations
Nos. 1 1 54.00 ……......
Completed ------------1
Cancelled ------------1
LOI issued ----------- 4
Processing fee --------1
Not completed --------1
Reconsideration ------1
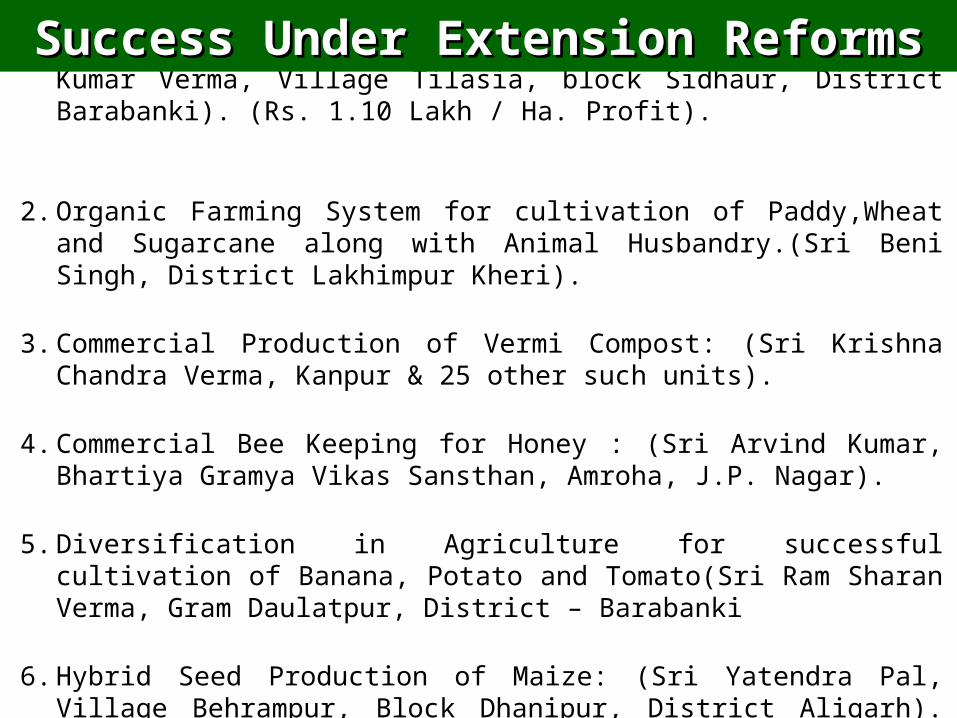
1. Cultivation of Vegetables and Banana : (Sri Rajesh Kumar Verma, Village Tilasia, block Sidhaur, District Barabanki). (Rs. 1.10 Lakh / Ha. Profit).
2. Organic Farming System for cultivation of Paddy,Wheat and Sugarcane along with Animal Husbandry.(Sri Beni Singh, District Lakhimpur Kheri).
3. Commercial Production of Vermi Compost: (Sri Krishna Chandra Verma, Kanpur & 25 other such units).
4. Commercial Bee Keeping for Honey : (Sri Arvind Kumar, Bhartiya Gramya Vikas Sansthan, Amroha, J.P. Nagar).
5. Diversification in Agriculture for successful cultivation of Banana, Potato and Tomato(Sri Ram Sharan Verma, Gram Daulatpur, District – Barabanki
6. Hybrid Seed Production of Maize: (Sri Yatendra Pal, Village Behrampur, Block Dhanipur, District Aligarh). (Rs. 40,000 / Ha. Profit)
Success Under Extension ReformsSuccess Under Extension Reforms
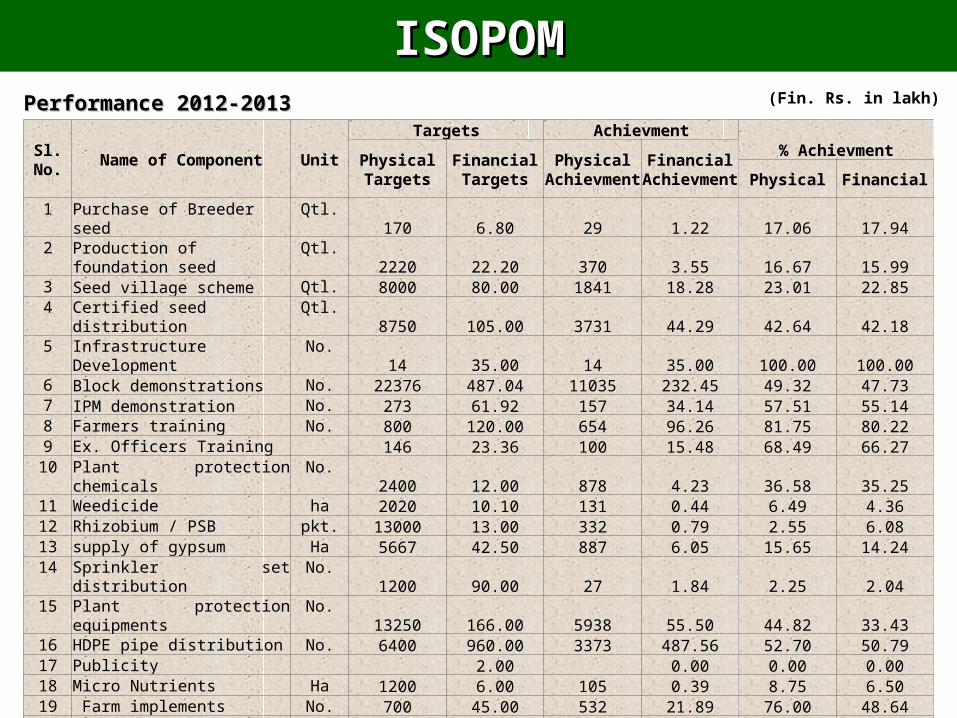
Performance 2012-2013Performance 2012-2013 (Fin. Rs. in lakh)
Sl. No.
Name of Component Unit
Targets Achievment% Achievment
PhysicalTargets
FinancialTargets
PhysicalAchievme
nt
FinancialAchievme
nt Physical Financial
1 Purchase of Breeder seed Qtl. 170 6.80 29 1.22 17.06 17.942 Production of foundation seed Qtl. 2220 22.20 370 3.55 16.67 15.993 Seed village scheme Qtl. 8000 80.00 1841 18.28 23.01 22.854 Certified seed distribution Qtl. 8750 105.00 3731 44.29 42.64 42.185 Infrastructure Development No. 14 35.00 14 35.00 100.00 100.006 Block demonstrations No. 22376 487.04 11035 232.45 49.32 47.737 IPM demonstration No. 273 61.92 157 34.14 57.51 55.148 Farmers training No. 800 120.00 654 96.26 81.75 80.229 Ex. Officers Training 146 23.36 100 15.48 68.49 66.27
10 Plant protection chemicals No. 2400 12.00 878 4.23 36.58 35.2511 Weedicide ha 2020 10.10 131 0.44 6.49 4.3612 Rhizobium / PSB pkt. 13000 13.00 332 0.79 2.55 6.0813 supply of gypsum Ha 5667 42.50 887 6.05 15.65 14.2414 Sprinkler set distribution No. 1200 90.00 27 1.84 2.25 2.0415 Plant protection equipments No. 13250 166.00 5938 55.50 44.82 33.4316 HDPE pipe distribution No. 6400 960.00 3373 487.56 52.70 50.7917 Publicity 2.00 0.00 0.00 0.0018 Micro Nutrients Ha 1200 6.00 105 0.39 8.75 6.5019 Farm implements No. 700 45.00 532 21.89 76.00 48.6420 G.I. storage bins dis. No. 2400 24.00 1329 11.89 55.38 49.5422 Diesal Pump Set 700 70.00 516 48.89 73.71 69.8423 Kisan Mela 160 120.00 122 86.51 76.25 72.09 TOTAL 2501.92 1206.65
23 Staff contigencies 126.00 91.63 72.72 TOTAL 2627.92 1298.28
ISOPOMISOPOM
(Fin. Rs. in lakh)
Sl. No.
Name of Component Unit
Targets Achievment% Achievment
PhysicalTargets
FinancialTargets
PhysicalAchievme
nt
FinancialAchievme
nt Physical Financial
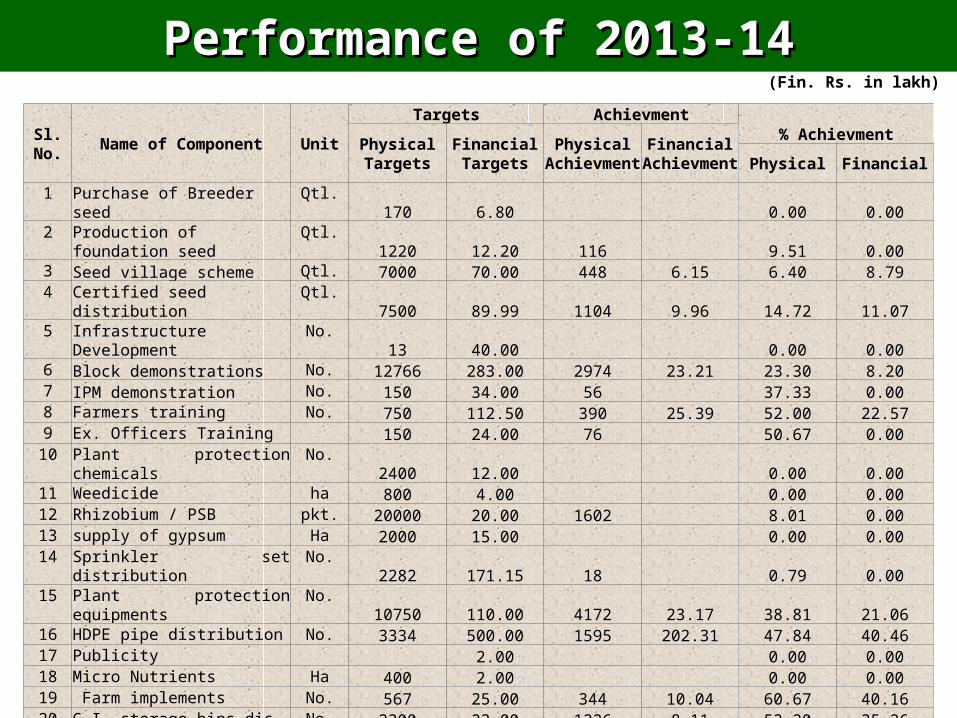
1 Purchase of Breeder seed Qtl. 170 6.80 0.00 0.002 Production of foundation seed Qtl. 1220 12.20 116 9.51 0.003 Seed village scheme Qtl. 7000 70.00 448 6.15 6.40 8.794 Certified seed distribution Qtl. 7500 89.99 1104 9.96 14.72 11.075 Infrastructure Development No. 13 40.00 0.00 0.006 Block demonstrations No. 12766 283.00 2974 23.21 23.30 8.207 IPM demonstration No. 150 34.00 56 37.33 0.008 Farmers training No. 750 112.50 390 25.39 52.00 22.579 Ex. Officers Training 150 24.00 76 50.67 0.00
10 Plant protection chemicals No. 2400 12.00 0.00 0.0011 Weedicide ha 800 4.00 0.00 0.0012 Rhizobium / PSB pkt. 20000 20.00 1602 8.01 0.0013 supply of gypsum Ha 2000 15.00 0.00 0.0014 Sprinkler set distribution No. 2282 171.15 18 0.79 0.0015 Plant protection equipments No. 10750 110.00 4172 23.17 38.81 21.0616 HDPE pipe distribution No. 3334 500.00 1595 202.31 47.84 40.4617 Publicity 2.00 0.00 0.0018 Micro Nutrients Ha 400 2.00 0.00 0.0019 Farm implements No. 567 25.00 344 10.04 60.67 40.1620 G.I. storage bins dis. No. 2300 23.00 1226 8.11 53.30 35.2622 Diesal Pump Set 500 50.00 241 18.20 48.20 36.4023 Kisan Mela 100 75.00 58 31.50 58.00 42.00 TOTAL 1681.64 358.04
23 Staff contigencies 191.00 72.05 37.72 TOTAL 1872.64 430.09
Performance of 2013-14Performance of 2013-14
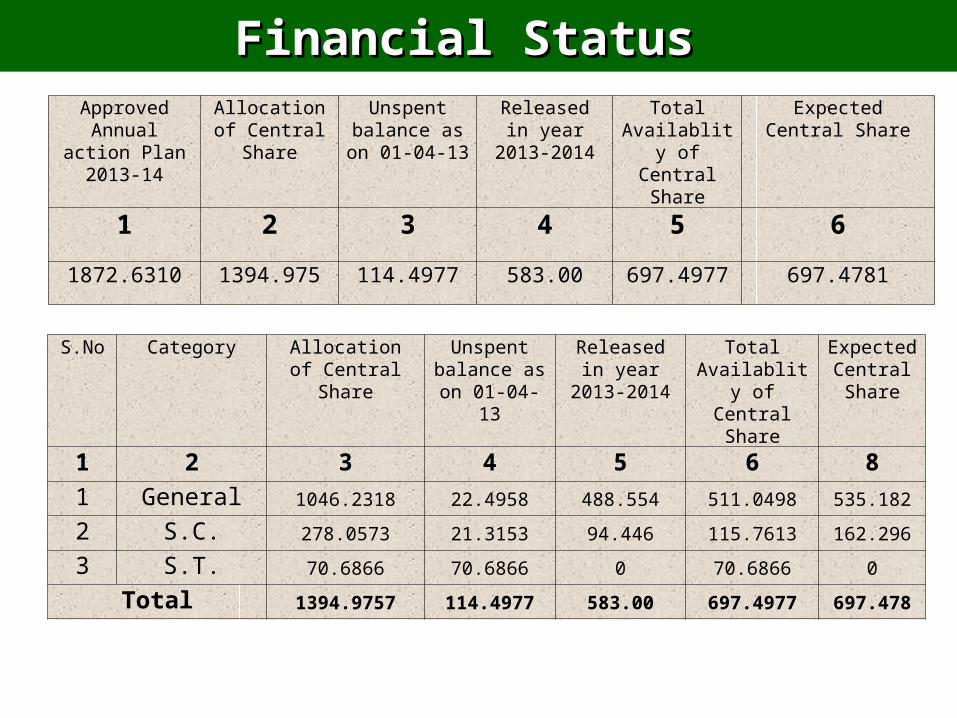
Approved Annual action Plan 2013-14
Allocation of Central Share
Unspent balance as on
01-04-13
Released in year
2013-2014
Total Availablity of
Central Share
Expected Central Share
1 2 3 4 5 6
1872.6310 1394.975 114.4977 583.00 697.4977 697.4781
S.No Category Allocation of Central Share
Unspent balance as on
01-04-13
Released in year
2013-2014
Total Availablity of Central Share
Expected Central Share
1 2 3 4 5 6 81 General 1046.2318 22.4958 488.554 511.0498 535.182
2 S.C. 278.0573 21.3153 94.446 115.7613 162.296
3 S.T. 70.6866 70.6866 0 70.6866 0
Total 1394.9757 114.4977 583.00 697.4977 697.478
Financial Status Financial Status
• Majority of oilseed growers are small and marginal having poor buying capacity. Hence need to increase the subsidy up to 75% on various components specially on seed, sprinkler sets and H.D.P.E. pipe.
• For effective demonstration pattern of A-3p should be adopted for oilseed also, where a package is allowed.
• Scheme should promote the small scale industries also for the establishment of expellers.
• Marketing facilities should be strengthened. NAFED shuld open new doors.
• State has launched a programme of promoting hybrid maize seeds in which Govt. and seed producing companies are providing assistance to the farmers. G.O.I. is requested to adopt such models for both Oilseed and Maize.
• 1.0 lakh ha. area covered by the Hybrid Maize out of 8.0 lakh ha. Maize area in kharif 2013.
• Insurance policy for oilseeds crops need to be revisited.• For 2013-14 central share has been reduced to 1395 lakh previously it
was to the tune of1800 to 2000 lakh.
Suggestions-ISOPOMSuggestions-ISOPOM
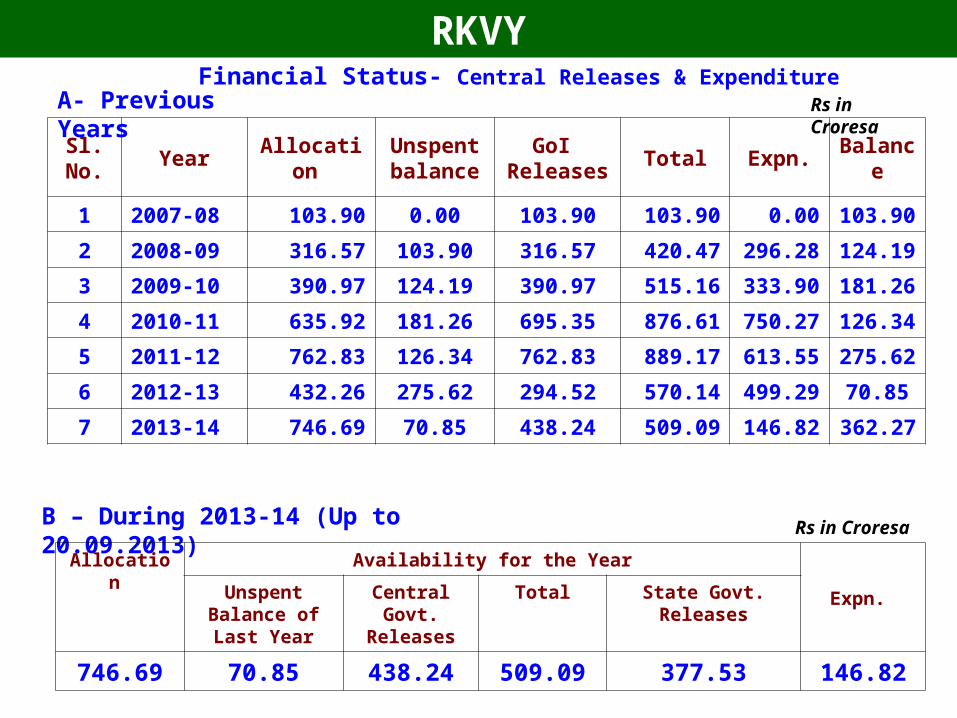
Sl. No.
Year Allocation Unspent balance
GoI Releases
Total Expn. Balance
1 2007-08 103.90 0.00 103.90 103.90 0.00 103.90
2 2008-09 316.57 103.90 316.57 420.47 296.28 124.19
3 2009-10 390.97 124.19 390.97 515.16 333.90 181.26
4 2010-11 635.92 181.26 695.35 876.61 750.27 126.34
5 2011-12 762.83 126.34 762.83 889.17 613.55 275.62
6 2012-13 432.26 275.62 294.52 570.14 499.29 70.85
7 2013-14 746.69 70.85 438.24 509.09 146.82 362.27
RKVYFinancial Status- Central Releases & Expenditure
Rs in Croresa
B – During 2013-14 (Up to 20.09.2013)
Allocation Availability for the Year
Expn. Unspent Balance of Last Year
Central Govt. Releases
Total State Govt. Releases
746.69 70.85 438.24 509.09 377.53 146.82
Rs in Croresa
A- Previous Years
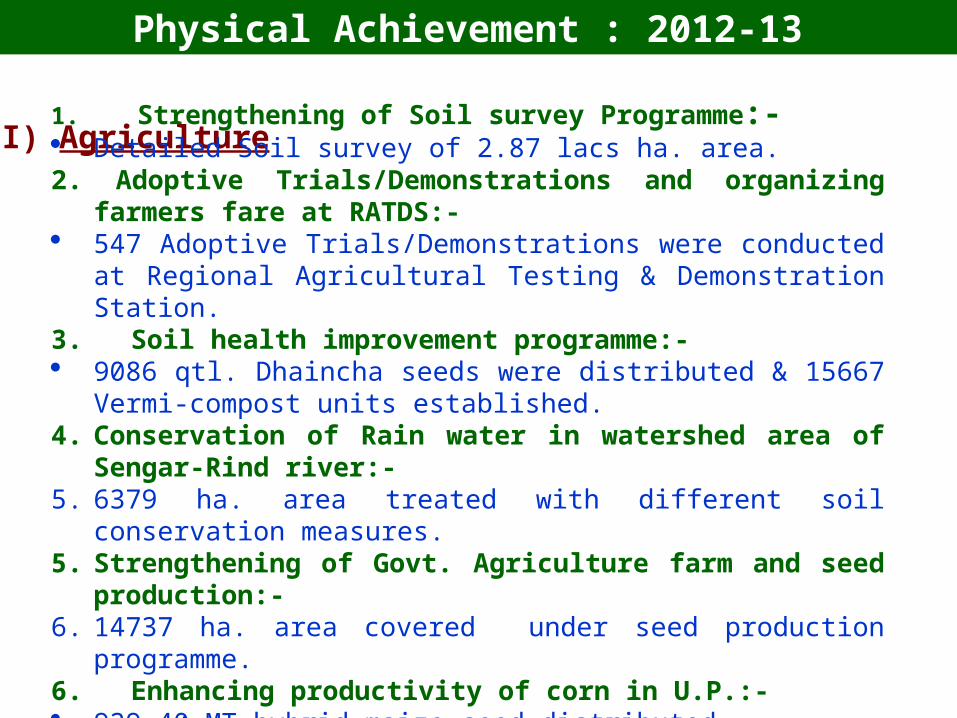
Physical Achievement : 2012-13
(I) Agriculture
1. Strengthening of Soil survey Programme:- Detailed Soil survey of 2.87 lacs ha. area.2. Adoptive Trials/Demonstrations and organizing farmers fare at
RATDS:- 547 Adoptive Trials/Demonstrations were conducted at Regional
Agricultural Testing & Demonstration Station.3. Soil health improvement programme:- 9086 qtl. Dhaincha seeds were distributed & 15667 Vermi-compost units
established.4. Conservation of Rain water in watershed area of Sengar-Rind river:-5. 6379 ha. area treated with different soil conservation measures.5. Strengthening of Govt. Agriculture farm and seed production:-6. 14737 ha. area covered under seed production programme.6. Enhancing productivity of corn in U.P.:- 929.40 MT hybrid maize seed distributed.
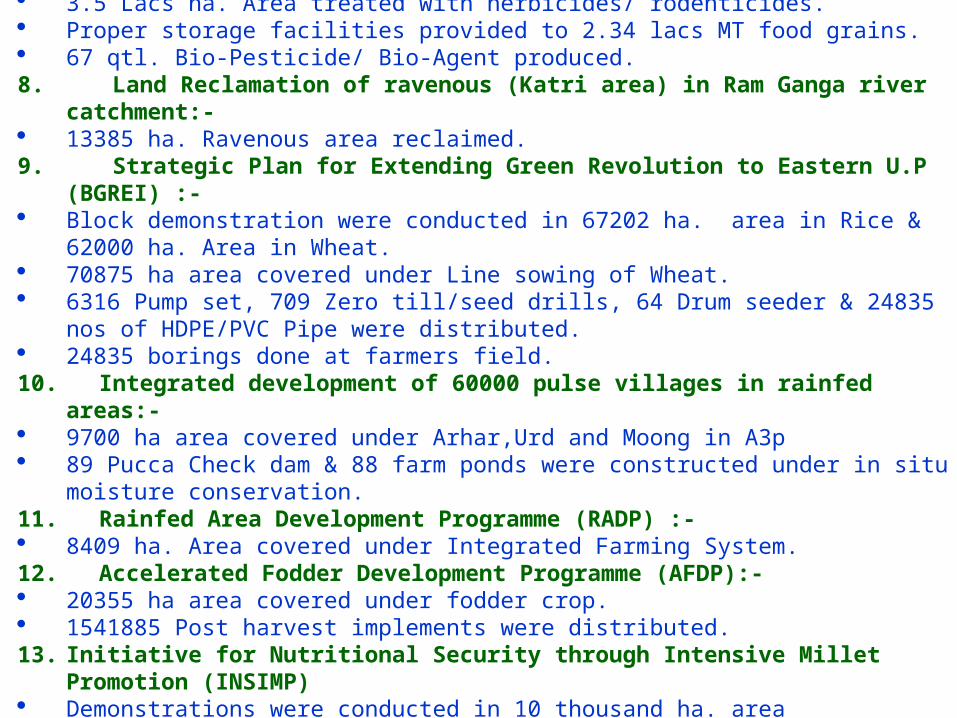
7. Strengthening of IPM programme:- 400 IPM training cum demonstration were conducted. 3.5 Lacs ha. Area treated with herbicides/ rodenticides. Proper storage facilities provided to 2.34 lacs MT food grains. 67 qtl. Bio-Pesticide/ Bio-Agent produced.8. Land Reclamation of ravenous (Katri area) in Ram Ganga river catchment:- 13385 ha. Ravenous area reclaimed.9. Strategic Plan for Extending Green Revolution to Eastern U.P (BGREI) :- Block demonstration were conducted in 67202 ha. area in Rice & 62000 ha. Area in Wheat. 70875 ha area covered under Line sowing of Wheat. 6316 Pump set, 709 Zero till/seed drills, 64 Drum seeder & 24835 nos of HDPE/PVC Pipe were
distributed. 24835 borings done at farmers field.10. Integrated development of 60000 pulse villages in rainfed areas:- 9700 ha area covered under Arhar,Urd and Moong in A3p 89 Pucca Check dam & 88 farm ponds were constructed under in situ moisture conservation.11. Rainfed Area Development Programme (RADP) :- 8409 ha. Area covered under Integrated Farming System.12. Accelerated Fodder Development Programme (AFDP):- 20355 ha area covered under fodder crop. 1541885 Post harvest implements were distributed.13. Initiative for Nutritional Security through Intensive Millet Promotion (INSIMP) Demonstrations were conducted in 10 thousand ha. area 10,000 seed mini-kits and input kits were distributed. 15 processing units were established.
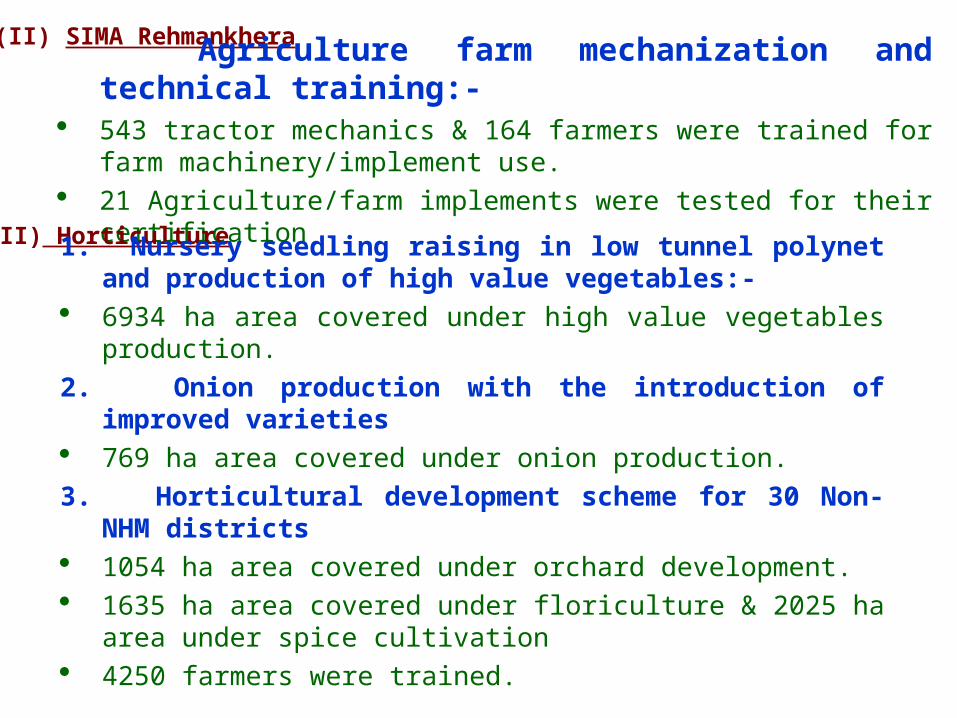
(II) SIMA Rehmankhera
Agriculture farm mechanization and technical training:- 543 tractor mechanics & 164 farmers were trained for farm
machinery/implement use. 21 Agriculture/farm implements were tested for their certification
(III) Horticulture
1. Nursery seedling raising in low tunnel polynet and production of high value vegetables:-
6934 ha area covered under high value vegetables production.
2. Onion production with the introduction of improved varieties 769 ha area covered under onion production.
3. Horticultural development scheme for 30 Non-NHM districts 1054 ha area covered under orchard development. 1635 ha area covered under floriculture & 2025 ha area under spice
cultivation 4250 farmers were trained.
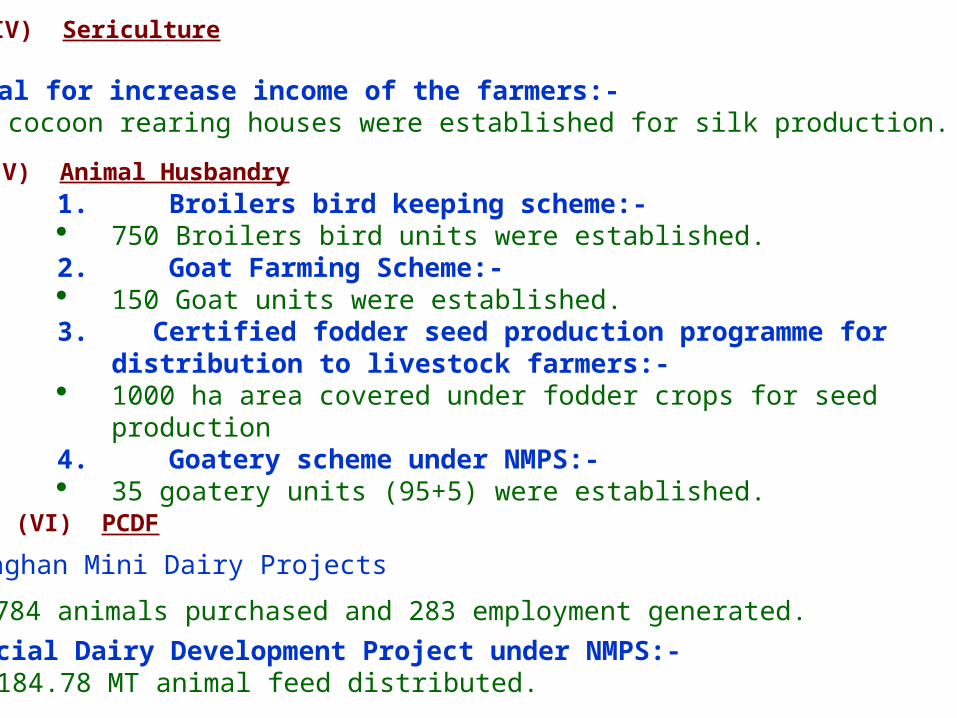
(IV) Sericulture
Proposal for increase income of the farmers:- 560 cocoon rearing houses were established for silk production.
(V) Animal Husbandry
1. Broilers bird keeping scheme:- 750 Broilers bird units were established.2. Goat Farming Scheme:- 150 Goat units were established.3. Certified fodder seed production programme for distribution to
livestock farmers:- 1000 ha area covered under fodder crops for seed production 4. Goatery scheme under NMPS:- 35 goatery units (95+5) were established.
(VI) PCDF
Special Dairy Development Project under NMPS:- 3184.78 MT animal feed distributed.
Saghan Mini Dairy Projects
784 animals purchased and 283 employment generated.
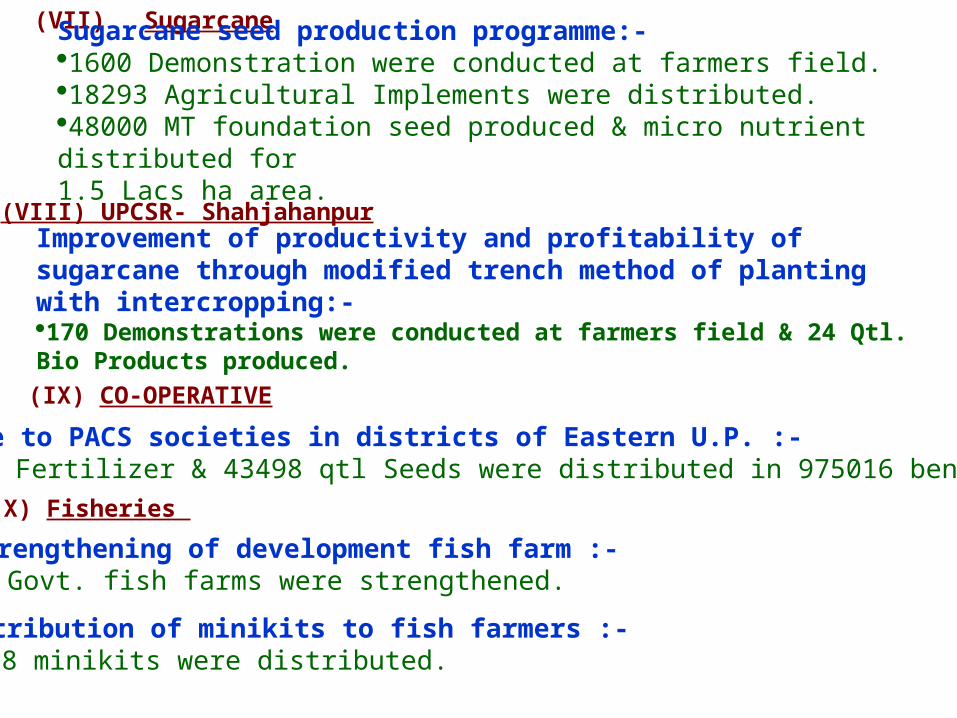
(VII) SugarcaneSugarcane seed production programme:-1600 Demonstration were conducted at farmers field.18293 Agricultural Implements were distributed.48000 MT foundation seed produced & micro nutrient distributed for 1.5 Lacs ha area.
(VIII) UPCSR- Shahjahanpur
Improvement of productivity and profitability of sugarcane through modified trench method of planting with intercropping:-170 Demonstrations were conducted at farmers field & 24 Qtl. Bio Products produced.
(IX) CO-OPERATIVE
Assistance to PACS societies in districts of Eastern U.P. :-204709 MT Fertilizer & 43498 qtl Seeds were distributed in 975016 beneficiaries.
(X) Fisheries
Strengthening of development fish farm :-6 Govt. fish farms were strengthened.
Distribution of minikits to fish farmers :-4058 minikits were distributed.
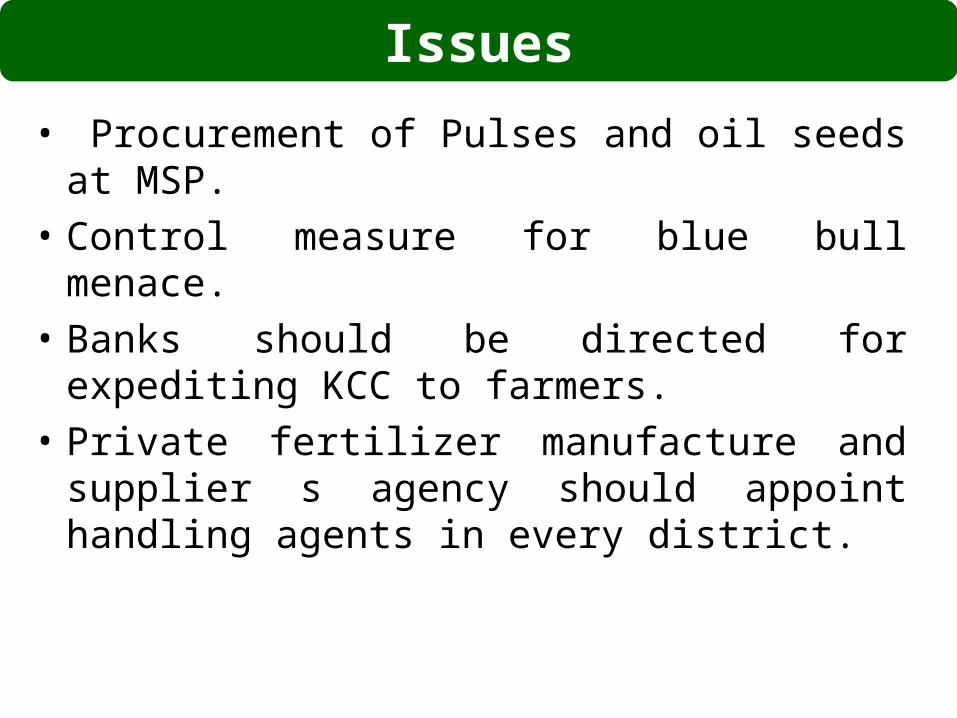
• Procurement of Pulses and oil seeds at MSP.
• Control measure for blue bull menace.
• Banks should be directed for expediting KCC to farmers.
• Private fertilizer manufacture and supplier s agency should appoint handling agents in every district.
Issues
40