Embed Size (px)
Citation preview
International Research Journal of Finance and Economics ISSN 1450-2887 Issue 87 (2012) © EuroJournals Publishing, Inc. 2012 http://www.internationalresearchjournaloffinanceandeconomics.com
Financial and Operating Performance of Privatized Firms: A
Case Study of Pakistan
Rehana Kouser Lecturer, Department of Commerce, Bahuddin Zakariya University, Multan
E-mail: [email protected] Tel: +92-333-6102638
Toseef Azid
Professor of Economics, Department of Finance and Economics College of Business Administration, Taibah University, Madinah, Saudi Arabia
E-mail: [email protected] Tel: +966-598-923431
Karamat Ali
Professor, Ex. Vice Chancellor, Bahuddin Zakariya University, Multan E-mail: [email protected]
Tel: +92-300-6354608
Abstract
There are many studies for developed and developing countries but none of these studies has extensively covered the privatization program from structural and contextual issue of accounting standpoint in Pakistan. The core part of this study is to test the hypothesis that privatization in Pakistan has increased the profitability, operating performance, capital investment spending, higher dividend payments and output of the firms but lower leverage ratios and employment of firms after divestiture. This dissertation aims to examine and evaluate the financial and operating performance of only those firms, which were privatized during 1999 to 2005. The closed down units have also been discussed for their negative impact on economy. The sample consists of 33 companies from 8 sectors. In overall analysis we documented significant increases in financial, automobile, cement, energy, fertilizer, engineering sectors’ post privatization performance but ghee and chemical sectors did not perform well in almost all proxies. In sector-wise analysis the results are almost similar in financial, automobile and cement sectors. Empirical evidences show that profitability, efficiency, investment, employment and dividend increases after privatization. While output and employment decrease in financial, increase in automobile and cement sector. JEL Classification Codes: C12, D21, L25, L33
1. Introduction During the last two decades, privatization has taken the centre stage to remodel the traditional economies of the developing countries but simultaneously this has posed different contextual
International Research Journal of Finance and Economics - Issue 87 (2012) 91
challenges to emerging nations in their pursuit of economic growth and social development. Privatization is desirable for a number of obvious reasons, varying from growth enhancement to capital accumulation and integrating the public sector to global production and investment network that in turn boost productivity and economic growth.
The worldwide experience has brought another spin to the ways in which we handle the privatization agenda. In fact, efficiency of private companies harbours great opportunities to induce changes in the public sector for getting results in terms of effectiveness and efficiency.
Privatization seems to be changes control over public assets with new ideological sense (Megginson, 2000).
Different researches have conducted to analyse the important magnitude of privatization including patterns and trends in policies and implications. In the last two decade many countries have introduced privatization programmes. It is a common observation that SoEs were viewed as highly inefficient, frequent political intervention and dominated by powerful trade unions. Privatisation reduced the financial burden of the government, to offer new way to earn revenues and simultaneously breaking the monopoly by selling shares to a number of parties and restricting union power (Arbomeit, 1986). This source of state funding is considered fundamental when economic policies were geared to trim down the public sector deficits. Competition sharpens the incentives for management to manage the firm’s assets efficiently. Also, where there is a competition, the firm’s profits reflect and identify the differences in managerial ability creating a dynamic link between the product and the capital market. Privatization efforts in both developed and emerging economies result in channelizing ownership from public to private sector and, consequently, can create the agency problems
When countries intend to reduce the size of its government they go for privatization. It is evident that the size of governments is too large to induce bureaucratic procedures. The private sector offers profits margins while public sector focuses on socially sustained goals. So, the up scaling of market economy and setting the fast pace for growth is a result of shift of focus from political interest to vested economic benefits of the privatization program (Poole, 1996). It is obvious that downsizing is the after effect of privatization (Easterly, 2001).
However, privatization does not stand for non-functioning of government, rather a reduced participation, so in this way it creates an encouraging impact on fiscal policies of the government. Easterly discusses that privatization is a viable option for making existing debt payments rather future debts and governmental expenditures. This will lower interest rates and thus leading to increased investment in the said country. Over-borrowing can be offset by downsizing policy and enhancing tax circles (Poole, 1996). 1.1. Objectives of the Study
There are many studies for developed and developing countries but none of these studies has extensively covered the companies in Pakistan. Whatever may be the direct impact on the macro level; this study will document the changes, improvement or otherwise, at firm’s level for the privatized firms in Pakistan. It will consider both the operating and financial performance of former SoEs partial divestment.
This study will take into consideration almost all the companies privatized, to analyse fully or partially privatized during 1990 to 2005 in Pakistan. It will take multiple measures for operating and financial performance of the companies. It will also try to determine whether following the privatization the firm’s increases or not their profitability, operating efficiency, capital expenditure, output of the company, leverage and their output, also testing the effect of privatization policies on employment structure. The evidence so generated will provide empiricism on to support or to challenge the benefits put forward by the government in favour of the privatization process.
92 International Research Journal of Finance and Economics - Issue 87 (2012)
1.2. Objectives of the Privatization
Despite these problems and consequences, the objectives of privatization are a prime force to adopt it as a major macroeconomic level policy in the developing world particularly in Pakistan. The prime objectives are a dire need to reduce government debt by the sale of state-owned industrial and commercial units, to improve their profitability and performance, and to make the role of government that of a facilitator. Other stated goals include the strengthening of capital markets and the securities industry, increasing local savings, and broadening the ownership of economic assets through publicly listed companies. Remarkably, each of the governments in Pakistan since 1988 has made privatisation the cornerstone of their economic program. 1.3. Historical Perspectives of Privatization1: International Scenario
Privatization is not simply an economic concept; rather it is more comprehensive in terms of socio-economic and political philosophy. During the 1970s, Conservative party in UK used privatization as a slogan. Historical perspective can be explained in three phases. 1.3.1. Phase 1 (1961-1980) The regulation of the national economy in terms of state ownership and private-ownership became the imperative programme of discussion worldwide. The first breakthrough came in UK (1984). Thatcher (Ex. Prime Minister of UK) first used the word "privatization," which is previously introduced by Peter. F. Drucker, a term "denationalization" (Yergin& Stanislaw, 1998). Privatization compact the function of the government in the availability of marketed goods and services. Most of the times the services like health, education, community services and social welfare are provided by the government in almost all over the world , as a percentage of GDP, all the way through the 1980s and 1990s (Quiggin, 2002).
Albeit the movement was provoked in United Kingdom but it was also adopted by many other countries of Western Europe (Burton, 1987). Bangladesh, Mexico, Thailand, South Korea, Malaysia, Sri Lanka, Japan, Spain, Turkey, Chile, Sweden, Singapore, West Germany, India, Portugal, Australia, the Philippines, Jamaica, Uganda, Pakistan and Brazil are those countries who have taken up privatization in the fields of telecommunications, banking, railways, car manufacture, electricity generation, etc but Cuba, China and Soviet Union are now starting the public companies shares in open markets, (Young, 1987). 1.3.2. Phase 1I (1985-1993) Subsequently the initial success of privatization program in United Kingdom, it was followed by Denmark, Italy, Chile, Malaysia, and Singapore. A robust growth was experienced in the form of limited sales of individual companies. However, the United Kingdom, France has adopted privatization program in multiple spheres. Additionally, France, Austria, Belgium, Holland, Jamaica, Japan, Spain, Sweden, and the United States implemented momentous privatizations all the way through share issues during late 1986 and 1987. The case of Nippon Telephone and Telegraph (NTT) is significant in Japan. Finally, the mid-1990s also witnessed an acceleration of privatization programs in the European Community. After 1987, the accelerated growth in privatization was witnessed in many countries of South America, Africa, and South Asia. Selling SoEs and share issues options were widely used in Bangladesh, Brazil, Chile, Gambia, Malaysia, Mexico, Nigeria, Sierra Leone, Singapore, and Venezuela (Megginson& Netter, 2001).
1 All the historical perceptive which are included in this dissertation are extracted from the detail research of Megginson,
Nash, and Randenborgh (1994). And similar debates on the history and evolution of privatization which include Yergin& Stanislaw (1998), Megginson& Netter (2001), Burton (1987), Young (1987), Gibbon, (1997) and (Megginson, 2000).
International Research Journal of Finance and Economics - Issue 87 (2012) 93
1.3.3. Shift Towards Transition Economies In 1960s, Germany started privatization program by selling public stakes in Volkswagen and the industrial company VEBA to private investors. Latin America pursued rigorous privatization program from 1988 to 1993 by spurring market liberalization and economic reform efforts. In the middle of 1990s an immense transfer of public enterprises to private sector started by China, (Cao, Qian, &Weingast, 1999; Lin & Zhu, (2001); Garnaut, Song, & Yao, 2003).
From 1996 to since 2001 the figure of state ownership decreased by forty percept and rest were also planned for privatization in future (Garnaut, Song, & Yao, 2003). 1.4. Historical Perspectives: National History
During 70’s social democracy model provoked Bhutto to follow the policy of nationalization; the profit-earning private-sector institutions gave the Pakistani economy a good shake. The situation was made worse by declaring some of the business areas out of bond for private investors. However, the government in 1989 initiated the process of divestiture of government holding in SoEs by first public offering partial government holding in PIA and to organize this process, the Privatization Commission was formed on January 22, 1991. Furthermore, in the start the privatizations of industrial concerns was the prime objective but later on in 1993 other sectors such as financial, engineering, automobile, energy, cement, ghee, fertilizer and chemical were also included in its scope.Sixty six privatization transactions were carried out from 1991 to 1994, which reached to 92 by end of 1997, 106 by end of 2000 and 129 till 2005.
In late 1980’s as nationalization policy was not yielding expected results and moreover, there was an international gesticulate of privatization round the world. This caused inefficiency and not has of managerial control. This burden had started showing multiplying impacts over the period of time. A consensus was emerged that the state is not the best entrepreneur for such industries because by then most of SoEs had started showing negative characteristics like management incompetence, over-staffing, over-branching, over-purchasing, over-investment, poor level of service, deterioration in quality of goods, corruption in purchases, hiring practices and privileges-abuse, inappropriate investments and large debt burden and financial losses.
During the Zia regime, initial steps were taken by reinstating the ownership of Nowshera Engineering and Hilal Ghee Mills in late 1970s. In addition, the control of the Ittefaq Foundry was given to the Sharif family. Many financial authors consider that the procedure of privatization was bolstered in 1991 through Privatization Commission of Pakistan has started. 1.4.1. Benazir Bhutto's Regime (1989-1990) During April 1989, Benazir Bhutto engaged Mr. Rothschild & Sons was hired to prepare a feasibility report to identify the units for privatization in Pakistan.14 units were identified and two-tier privatization strategy was recommended. But the government could not carry out its intended plans except privatization of 10% shares of PIA. The Benazir government was dismissed in 1990 by giving way to Nawaz Sharif’s first government. 1.4.2. Nawaz Sharif Regime (1990-1993) During this phase, the government facilitated privatization process on larger scale and 1974’s Act was amended in 1990, empowering the Federal Government to sell all or any part of the share capital of Nationalized Commercial Banks (NCBs.). Privatization Commission was established on January 22, 1991 to identify the enterprises to be privatized and to make recommendations on how this process should take place. During March and July 1991, bids were invited for the sale of 25 units while during August 1991 the plan was chalked out to sale 100 units that is the single biggest lot offered to be privatized. GoP accepted 26 bids among 235 bids for the sale of 81 units. At this time of dismissal of this government the total number of completed transactions was up to 1993, 2 banks, 68 industrial units and 10% shares of Sui Northern Gas Pipeline were privatized. Many banks were privatized including UBL, Allied Bank, Bankers Equity Ltd. Habib Bank Ltd and Habib Credit & Exchange.
94 International Research Journal of Finance and Economics - Issue 87 (2012)
Later on after privatization Habib Credit & Exchange, a subsidiary of HBL was re-named Bank Alfalah. The benefits of privatization were experienced in the banking sector that was previously dominated by public sector and portrayed by high intermediation costs, over-staffing and over-branching, big portfolio of non-performing loans, poor customer services, undercapitalized, poorly managed / narrow product range, political involvement in lending, loan recovery & appointments. 1.4.3. Benazir Bhutto's Privatization (1993-1996) During her second tenure, Benazir Bhutto espoused privatization as a prime agenda focusing on the sale of large scale units like Water and Power Development Authority (WAPDA), Pakistan Telecommunication and banks. The important milestones were 20 industrial units, one financial institution; KotAdu unit was major privatization and 12% shares of Telecommunication Company of Pakistan. GoP was intending to sell SoEs to shed off government debt. This is the optimal solution to reduce the debt which units were responsible for (Paula, 1994). 1.4.4. Nawaz Sharif Government (1996-1999) During his 2nd term, Mian Nawaz Sharif adopted a professional approach to revamp privatization program by hiring highly paid professionals for reengineering and restructuring of those units who were to be sold. This was done with 210 million US dollars given as a financial aid for restructuring from the World Bank. The prime focus of restructuring was on reducing the number of employees, launching early retirement schemes and golden shake hand schemes and introducing electronic banking so a new breed of bankers were required for this. 1.4.5. General Musharraf (1999 to 2009) During the regime of President General Pervez Musharraf, economic reforms were given primary importance. On September 28, 2000, privatization policy of GoP was revamped by strengthening its legal structure and ordinance 2000 was formally declared. In this new ordinance of Privatization Commission, independence and accountability and transparency were the cornerstones. Another initiative was taken at governmental level in November 2000 to announce new privatisation ministry which was responsible for facilitating transactions and this ministry is known as Ministry of Privatisation and Investment. The performance at a glance is as:
• 97.259 billion rupees were generated for debt retirement and poverty alleviation • 23.301 billion rupees were paid to DFI/owners for their shares sold in 2005-2006.
2. Literature Review Literature proves that normally the state-owned enterprises are persistently unprofitable. Improvement in government revenues, increasing capital ownership and the very important factor performance of SoEs is the source of inspiration for privatization.
Many politicians are of the view that it is not the job of the government to run all types of industries, government should concentrate only some very crucial and specific nature business like steel and defence production, (Megginson & Netter, 2001).
People ask this question that why the government wants to own industries and why does it want to privatize them afterwards. The government own companies to get better control and achieve their objectives. The rationales behind that entire are, they have different objectives as compared to the other business at least in part because their major objectives are maximizing employment, developing backward areas and other social aspect. In order to achieve those objectives, the government has to provide some non-market benefits like subsidies and implicit guarantees to meet operating losses.
A number of empirical studies show significant positive results for the firms after privatization like Megginson, Nash, & Randenborgh, (1994) did empirical analysis about comparison of the pre and post privatization performance of 61 companies from 18 countries which include both developed and underdeveloped, belong to 32 different industries. They found persuasive evidence that the mean and
International Research Journal of Finance and Economics - Issue 87 (2012) 95
median profitability, real sales, operating efficiency, and capital investment spending of sample firms had increased significantly in their analysis and this change occurred in both statistical and economic terms) after privatization according to their study. In addition, they documented significantly lower leverage ratios and higher dividend payments of firms after privatization. However, they observed no fall in the employment level after privatization, rather they have proven an increase in mean (median). Another comprehensive research on the same issue is examined by Boubakri, & Cosset, (1998) who studied the same change in the financial and operating performance of seventy nine companies from twenty one developing countries that practiced complete or partial privatization for the period starting from 1980 to 1992 and have tested accounting performance measures. Their results are same as previous research motioned above and show significant increases in profitability, operating efficiency, capital investment spending, output, employment level, and dividends and their results strengthen the previous study done by Megginson, Nash, & Randenborgh, (1994). A further study conducted by D'Souza, & Megginson, (1999) gives valuable insights into the possible methodological and ideological changes that should be considered for future perspectives. This empirical work also compares the same financial and operating performance of privatized and includes the huge data from twenty eight industrialized countries’ eighty five companies which were privatized through public share offerings and their findings strongly recommend that privatization capitulates significant improvements in the performance, profitability, operating efficiency, capital expenditures, output, and dividend payments of the firms but it decreases employment and leverage insignificantly.
Wei, Varela, D'Souza, Hassan (2003) conducted the same study in China and analysed two hundred and eight companies’ pre and post privatization financial and operating performance during the study period 1990-97 and their findings show momentous progress in real output, real assets, and sales efficiency, and significant declines in leverage in those firms who were following privatization but no significant change in profitability. Similarly, different empirical evidences from China suggest that reorientation of the contents of property allocation is the main determinant of enterprise restructuring that can capitulate substantial benefits even without putting thrust on privatization. Thus, economic reforms along with privatization will yield significant performance improvement. Hardly any study signifies to answer this question and perhaps most surprisingly it would not be so easy to develop such evidence but, in fact, the private sector is effective in solving the problem of externalities though costless bargaining driven by individual incentives.
Several of the other researchers observed the different issues related to China's privatized firms like Gul (1999) studied and concluded that how SoEs behaviour is positively related to growth opportunities to be negatively related to debt financing and dividend policy and Qi, Wu, and Zhang (2000) documented that after privatization, the return on equity positively related to institutional ownership and negatively related to state ownership but as compared to this Wei and Varela (2003) tested a negative relationship between Tobin's q and state equity ownership and their study was also related to the China's newly privatized firms.
Egypt also initiated a privatization program in 1991 and used it as a part of its economic reform program; Omran (2004) examined fifty four divested firms with a matching number of SOEs, and concluded that both types of firms experience significant improvements in profitability and efficiency, and significant declines in employment and debt after privatization.
La Porta, & Lopez- de- Silanes (1999) did another study by using data firms privatized in Mexico for during the period starting from 1983 till 1991 and found convincing evidence that profitability, real sales, operating efficiency, and capital investment spending of sample firms increases significantly after privatization. According to their analysis they also documented significantly lower leverage ratios and higher dividend payments of firms after divesture. Furthermore, they also analysed to what extent the increase in profits after privatization comes from better incentives and from the political position of privatization, and how much increase in profit comes at the cost of the society. This concept is a part of the social view of privatization.
There are a number of firms who have great improvements in profits, but this is not due to increase in efficiency rather due to increase in prices. As the case of Pak Arab Fertilizers in Pakistan
96 International Research Journal of Finance and Economics - Issue 87 (2012)
earned huge profits due to layoffs and increase in prices of fertilizers but efficiency is least concerned regarding the case in point. This gives us important social loss.
A supplementary study documented by Bhaskar & Khan (1995), who use firm-level data from jute mills from Bangladesh and analyze the effects of privatization upon employment and output and their findings evident that privatization has reduced employment significantly, while the reduction in output is statistically insignificant. The breakdown of employment reduction by category of employee is particularly noteworthy. They also observed that normally the reduction in employment was primarily directed toward clerical and managerial employees and define the category of workers like white-collar workers and manual workers and prove that in privatized firms the reduction in number of employees is to a lesser extents towards permanent manual workers.
It is the general perception that SoEs can invest more than private firms, because nationalized companies provide the government an investment vehicle, the government has the resources and borrowing power from their institutions.
There are so many reasons that why people expect that privatization will improve the companies spending (capital expenditure) after privatization. First, companies following privatization have better option to use private debt and particularly equity markets as compared to most of the SoEs. Because then they become registered in the stock exchange.
Another view of the picture is that if privatization occurs along with the deregulation and the starting of new market, then these firms will have to invest more in the businesses in order to enter in the competitive markets as a private company. So privatizations will very large investment spending needs in order to become competitive with other private firms.
SOEs are normally labour intensive in their production processes. The power of politicians, labor unions, and other interest groups leads towards SoEs employees wealthy and the capital reduced. Besides this, the need of finance often leads firms to cut their routine maintenance which must be improved after privatization.
Another aspect is that the when a SoEs is privatized then the government’s power towards that company is reduced and its ability to bribe or pressurize mangers for excessive production of attractive but low quality goods is also decreased.
Now, after privatization, due to the open market competition, the firms have to struggle extraordinary and forced to produce quality products for their survival such as introduction new products and services, new markets, and follow acquisitions both at home and abroad. Privatization promotes entrepreneurship.
One of the reasons for privatization is the expectation by the governments and other people that due to improved incentives, more flexible financing opportunities, improved competition, and better range for entrepreneurial scheme, real sales will increase after privatization. 2.1. Consequences and Cost of Privatization
Current empirical studies which mainly emphasised to know the consequences of privatization on monetary, operational and working performance, workforces, fiscal balances and distributional equity principally authenticates the analysis that only those firms who belongs to middle income group counties and operate in a competitive market structure has positive impact of privatization. Whereas its impact is not easy to judge that how many affects it has under which situations. However, the fact indicates that the improvements in efficiency are possible even with an only unpretentious decline in labour but certainly it needs some requirements.
A significant limitation of these studies they always consider and measure the privatization effect on the basis of their pre and post privatization analysis but did not consider the growth rates of the economy and industry because ultimately effect the organizations and if we consider both the dimensions change in performance and growth effects of privatization on companies performance, it will be helpful for us to resolve many issues.
International Research Journal of Finance and Economics - Issue 87 (2012) 97
An imperative gap in most of the researches conducted to know the impact of privatization emphasised to measure the performance exercised be liable to be affected by issues other than privatization, and increase the importance of its major attribution problems. Therefore, people normally misperceive and consider all the collective measures which are taken for restructuring the organizations in the pre-privatization era. They normally confused all these with the special effects of privatization, (Christopher, Cavendish and Mistry, 1992).
Similarly, trade policy reform, domestic price liberalization and privatization become the route cause for the success of private sector and make it more productive. The same strategy is adopted by the developing countries. Capital market development, a large amount from financial liberalization and broader economic deregulation, favourable microeconomic efficiency gains become the cause of success and it happens due to the changed macroeconomic framework. So we can conclude the major parameters and conditions for growth of privatization are the country conditions and market conditions (Kikeri, Nellis, & Shirley, 1994).
But open trade regime, a stable and predictable environment for investment, a well-developed institutional and regulatory capacity is the key issues in country which serve as a prerequisite for the success of privatization besides the market conditions which is also an important determinant. But the most important thing is in the success determinants depends on the transparency of the transaction, if the firm manufactures some consumable item operate in a competitive environment then its efficiency will be automatically improved subject to the condition that privatization activity must be transparent same is true for industrial goods but all those SoEs which are privatized and work as a monopolies face more complex and the regulatory capabilities of the country turn out to be a critical issue.
In developing countries where institutional and regulatory capacities are deteriorating the privatization of utilities and natural monopolies is most complicated because the non-existence of some more important economic conditions, development of capital markets, competitive goods and services markets, and efficient regulatory capacity are the major causes which makes privatization complicated and difficult.
It is the normal fear of all governments contemplating privatization programs, that efficiency and profitability will be improved and targets can be achieved only at the cost of large-scale job losses. First, there are several real examples of large-scale job losses in the firms following privatization. As examples, BT, British Gas, St. Gobain, and NTT all lost at least 5,000 workers after privatization.
Finally, where privatization coincides with industry deregulation the result is frequently to put severe competitive cost pressures on corporate managements, who respond by pressuring their work force either for wage concessions, or work rule changes, or both.
Another very important incident occurred when Argentina's national rail company fired its approximately seventy nine percent workers arguing that it is the part of their restructuring of railroad. An additional study in Mexico was conducted which examine the behaviour of two hundred privatized companies and documented that half of all workers lost their jobs in the divested firms. Besides all these some of the researches documented unchanged employment in privatized firms, (Megginson, 2000).
Similarly, those economies that have a low-income country’s economic structure face major constraints on privatization which comes from these situations and not a single research has examined the before and after effects of privatized companies performance who can match the results of middle income with low-income economies. 3. Research Methodology and Testable Predictions The data collection for this research started in 2004 for all the firms which were working under the control of Ministry of Production (MoP)2 and Ministry of Finance (MoF)3 before their privatization. 2 For more information about Ministry of production of Pakistan visit <http://www.moip.gov.pk/> 3 For more information about Ministry of Finance visit: <http://www.finance.gov.pk/>
98 International Research Journal of Finance and Economics - Issue 87 (2012)
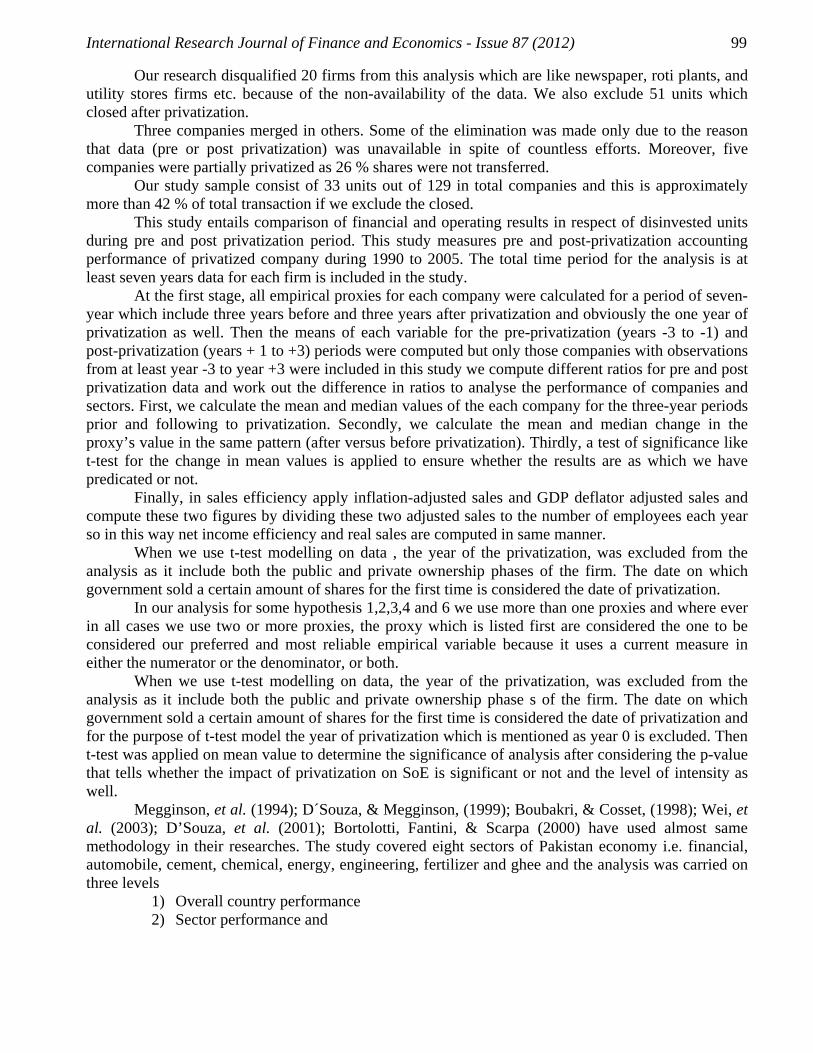
The pre-privatization data of industries for year, 1990-2005 was mostly available with Expert Advisory Cell (EAC). Experts Advisory Cell is a source of all the information on operational, financial and profile about the performance of public sector industries under Ministry of Industries & Production, whereas data of Ghee industry was collected through Ghee Corporation (GC) and Securities and Exchange Commission of Pakistan (SECP)4. The post privatization data on the performance and resource generation by disinvested/privatized entities was collected from respective corporations, individual units, SECP, AKD Securities5, and Karachi Stock Exchange (KSE)6 etc. It was a challenging task to retrieve performance results, especially sales and tax related information from the disinvested firms and it were worsened after the current surveys on tax by the government. However, every possible effort was made to acquire maximum information from maximum number of disinvested industries.
In order to access the post privatization financial data regarding the organizations we collected their annual reports from the library and record room of Karachi Stock Exchange (KSE) but here we found the data of those companies which were listed in KSE collect some of the data from the websites of the sample companies as well.
The library of State Bank of Pakistan was rich enough in financial sector data which they made available for the research.
This research aims to study the use of privatization program in a strategic context by GoP to uplift the economic growth performance. This study starts to compare the pre- and post-privatization data of 129 companies from 8 sectors in Pakistan, but we limit our sample to the companies whose ownership has been transferred (government shifts ownership if 26% shares are privatized). Only 33 companies complete data was available to conduct this research out of total 129 units which were privatized during the above mentioned period whereas; 86 companies were excluded from study, as five companies were reported in heavy losses thus considered as outlier, 51 units were closed after privatization and data of 20 companies was unavailable.
The pre-privatization data of 10 companies was available but post-privatization data was not there. Similarly, post-privatization data of two companies was available but pre-privatization data was missing. Three companies merged and were renamed so their parent companies are included in analysis. The closed down disinvested units have also been discussed to measure their impact on economy. Thus sample consists of thirty three companies from 8 sectors. Three companies merged and were renamed so their parent companies are included in analysis. The closed down disinvested units have also been discussed to measure their impact on economy.
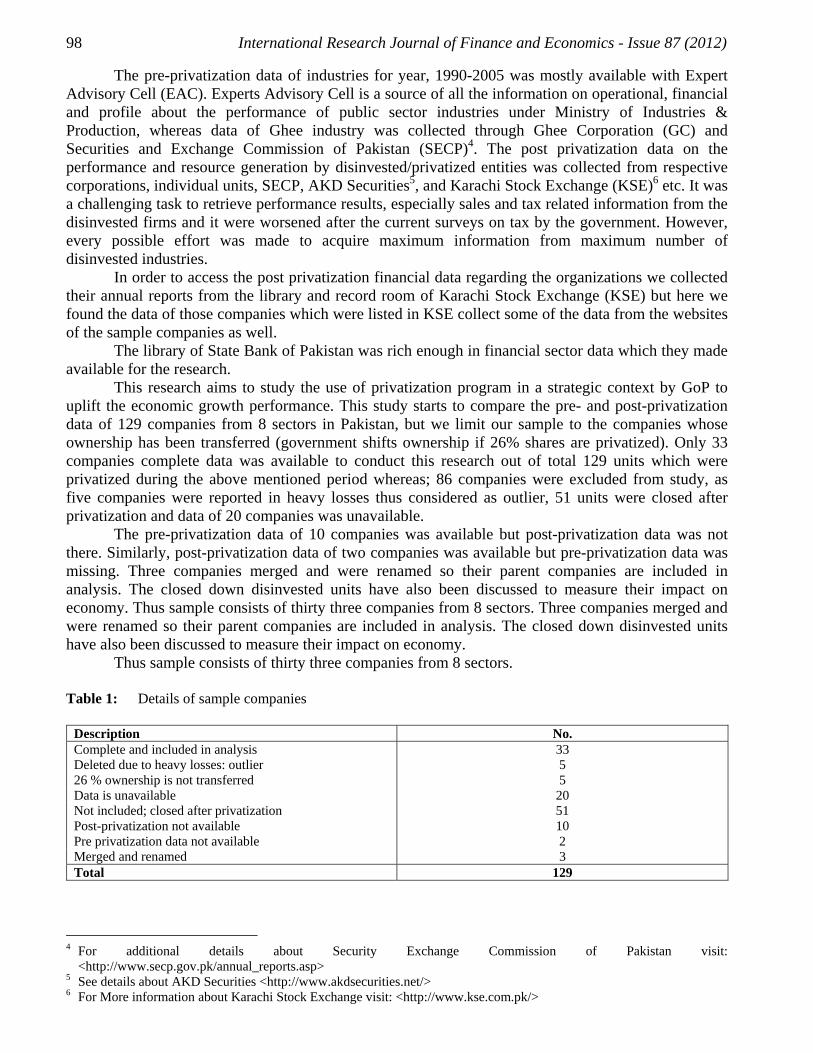
Thus sample consists of thirty three companies from 8 sectors. Table 1: Details of sample companies
Description No. Complete and included in analysis 33 Deleted due to heavy losses: outlier 5 26 % ownership is not transferred 5 Data is unavailable 20 Not included; closed after privatization 51 Post-privatization not available 10 Pre privatization data not available 2 Merged and renamed 3 Total 129
4 For additional details about Security Exchange Commission of Pakistan visit:
<http://www.secp.gov.pk/annual_reports.asp> 5 See details about AKD Securities <http://www.akdsecurities.net/> 6 For More information about Karachi Stock Exchange visit: <http://www.kse.com.pk/>
International Research Journal of Finance and Economics - Issue 87 (2012) 99
Our research disqualified 20 firms from this analysis which are like newspaper, roti plants, and utility stores firms etc. because of the non-availability of the data. We also exclude 51 units which closed after privatization.
Three companies merged in others. Some of the elimination was made only due to the reason that data (pre or post privatization) was unavailable in spite of countless efforts. Moreover, five companies were partially privatized as 26 % shares were not transferred.
Our study sample consist of 33 units out of 129 in total companies and this is approximately more than 42 % of total transaction if we exclude the closed.
This study entails comparison of financial and operating results in respect of disinvested units during pre and post privatization period. This study measures pre and post-privatization accounting performance of privatized company during 1990 to 2005. The total time period for the analysis is at least seven years data for each firm is included in the study.
At the first stage, all empirical proxies for each company were calculated for a period of seven-year which include three years before and three years after privatization and obviously the one year of privatization as well. Then the means of each variable for the pre-privatization (years -3 to -1) and post-privatization (years + 1 to +3) periods were computed but only those companies with observations from at least year -3 to year +3 were included in this study we compute different ratios for pre and post privatization data and work out the difference in ratios to analyse the performance of companies and sectors. First, we calculate the mean and median values of the each company for the three-year periods prior and following to privatization. Secondly, we calculate the mean and median change in the proxy’s value in the same pattern (after versus before privatization). Thirdly, a test of significance like t-test for the change in mean values is applied to ensure whether the results are as which we have predicated or not.
Finally, in sales efficiency apply inflation-adjusted sales and GDP deflator adjusted sales and compute these two figures by dividing these two adjusted sales to the number of employees each year so in this way net income efficiency and real sales are computed in same manner.
When we use t-test modelling on data , the year of the privatization, was excluded from the analysis as it include both the public and private ownership phases of the firm. The date on which government sold a certain amount of shares for the first time is considered the date of privatization.
In our analysis for some hypothesis 1,2,3,4 and 6 we use more than one proxies and where ever in all cases we use two or more proxies, the proxy which is listed first are considered the one to be considered our preferred and most reliable empirical variable because it uses a current measure in either the numerator or the denominator, or both.
When we use t-test modelling on data, the year of the privatization, was excluded from the analysis as it include both the public and private ownership phase s of the firm. The date on which government sold a certain amount of shares for the first time is considered the date of privatization and for the purpose of t-test model the year of privatization which is mentioned as year 0 is excluded. Then t-test was applied on mean value to determine the significance of analysis after considering the p-value that tells whether the impact of privatization on SoE is significant or not and the level of intensity as well.
Megginson, et al. (1994); D´Souza, & Megginson, (1999); Boubakri, & Cosset, (1998); Wei, et al. (2003); D’Souza, et al. (2001); Bortolotti, Fantini, & Scarpa (2000) have used almost same methodology in their researches. The study covered eight sectors of Pakistan economy i.e. financial, automobile, cement, chemical, energy, engineering, fertilizer and ghee and the analysis was carried on three levels
1) Overall country performance 2) Sector performance and
100 International Research Journal of Finance and Economics - Issue 87 (2012)
3.1. Hypotheses
It is generally expected that privatization will increase profitability, operating efficiency, capital expenditure and output, increase or decrease the level of employment, and leverage and improve the pay-out to the shareholders. Our hypotheses in this research are mentioned below.
Privatization will: 1. Increases a firm's profitability 2. Increases its operating efficiency 3. Increases its Capital expenditures 4. Increases its output 5. Decreases employment 6. Decreases leverage 7. Increases dividend pay-outs
Two symbols, A for after privatization and B for before privatization is are used in the study as used by other researchers to calculate the mean and median for different time periods. 4. Empirical Results Several studies as mentioned above such as Megginson, et al. (1994), D'Souza, & Megginson, (1999), Boubakri, & Cosset, (1998), Wei, Varela, D'Souza, Hassan, (2003) and D'Souza, Megginson, & Nash, (2001) have used the same proxies for analysis which we have adopted in this study and bring to a close almost similar findings.
In order to examine our hypothesis, first of all we calculated empirical proxies for each company for a seven-year period which consists of three years for before-privatization and three years for post-privatization. We then calculate the mean of each variable for each firm over the pre- and post-privatization here we mean pre-privatization: years –3 to –1 and post-privatization: years +1 to +3. For all firms, the year of privatization (year 0) includes both the public and private ownership phase of the enterprise. We therefore exclude year 0 from our t-test from mean calculations. The condition for any company to be included in the sample is that it must have at least two observations, available for each window and the government must have transferred 26% shares of that company.
We use mini tab software to calculate mean, median and apply t-test on the data, and for the purpose of segregation in pre and post privatization data we use two symbols, same as used the one by Megginson, Nash, & Randenborgh, (1994), in the predicted relation column A and B which stand for after and before respectively. Here we explain preferred and alternative empirical proxies of profitability, operating efficiency, capital expenditure, and changes in output, employment, leverages, and changes in dividend payments and the preferred proxy is listed first and the alternative, if any, is listed later in the tables of analysis and we call them preferred proxy because their result is more reliable. 4.1. Profitability
Almost all researches concluded that the profitability of the firm is positively correlated with privatization. It is evident after many empirical analysis that as the governments expected, profitability increases significantly after privatization according to RoS, RoE and RoA. In our results we primarily rely on RoS (our benchmark) which is the strongest of all and while discussing the results, we choose to focus on the first proxy (RoS) as it is less sensitive to inflation and accounting conventions than the two other profitability ratios.
Table include the performance measures of our overall 100% sample which includes the eight sectors data of 33 companies after excluding the five outliers. Six profitability ratios, that is return on sales (RoS) before and after tax and return on assets (RoA) before and after tax increase significantly after privatization but increase in return on equity (RoE) is less significant.
International Research Journal of Finance and Economics - Issue 87 (2012) 101
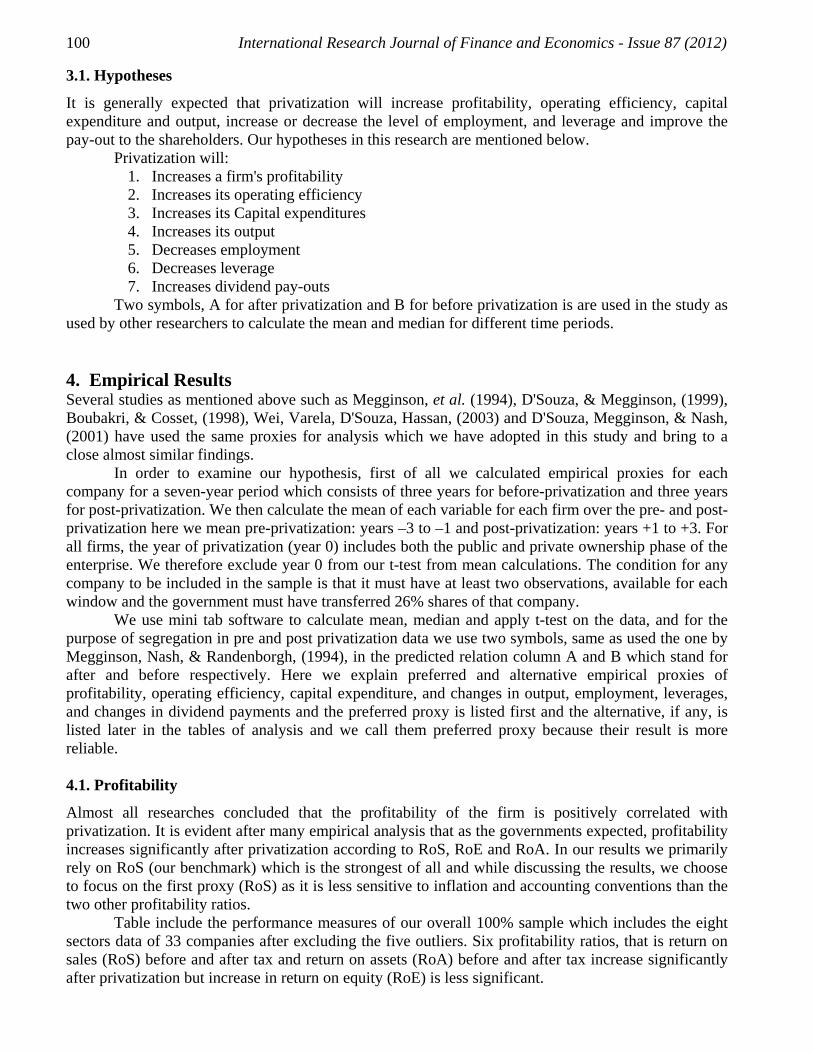
Table 2: Descripting of Proxies used in the Study Characteristics Proxies Predicted Relationship Profitability Return on Sales (RoS) = EBIT ÷ Sales RoSA>RoSB -do- Return on Sales (RoS) = Net Income ÷ Sales RoSA>RoSB -do- Return on Assets (RoA) = EBIT÷ Total Assets RoAA>RoAB -do- Return on Assets (RoA) = Net Income÷ Total Assets RoAA>RoAB -do- Return on Equity (RoE) = EBIT ÷ Equity RoEA>RoEB -do- Return on Equity (RoE) = Net Income ÷ Equity RoEA>RoEB Operating Efficiency Sales Efficiency (SALEFF) = Sales ÷ Number of Employees SALEFFA> SALEFFB
-do- Net Income Efficiency (NIEFF) = Net Income ÷ Number of Employees NIEFFA> NIEFFB Capital investment Capital Expenditures to Sales (CESA) = Capital Expenditures ÷ Sales CESAA> CESAB
-do- Capital Expenditures to Assets (CETA) = Capital Expenditures ÷ Total Assets CETAA> CETAB
Output Real Sales (SAL) = Nominal Sales ÷ Consumer Price Index (CPI) SALA >SALB -do- Real Sales (SAL) = Nominal Sales ÷ GDP Deflator SALA >SALB Employment Total Employment (EMPL) = Total Number of Employees EMPLA< EMPLB Leverage Debt to Assets (LEV) = Total Debt ÷ Total Assets LEVA< LEVB Long-Term Debt to Equity (LEV2) = Long ÷ Term Debt - Equity LEV2A< LEV2B Dividends to Sales (DIVSAL) = Cash Dividends ÷ Sales DIVSALA> DIVSALB
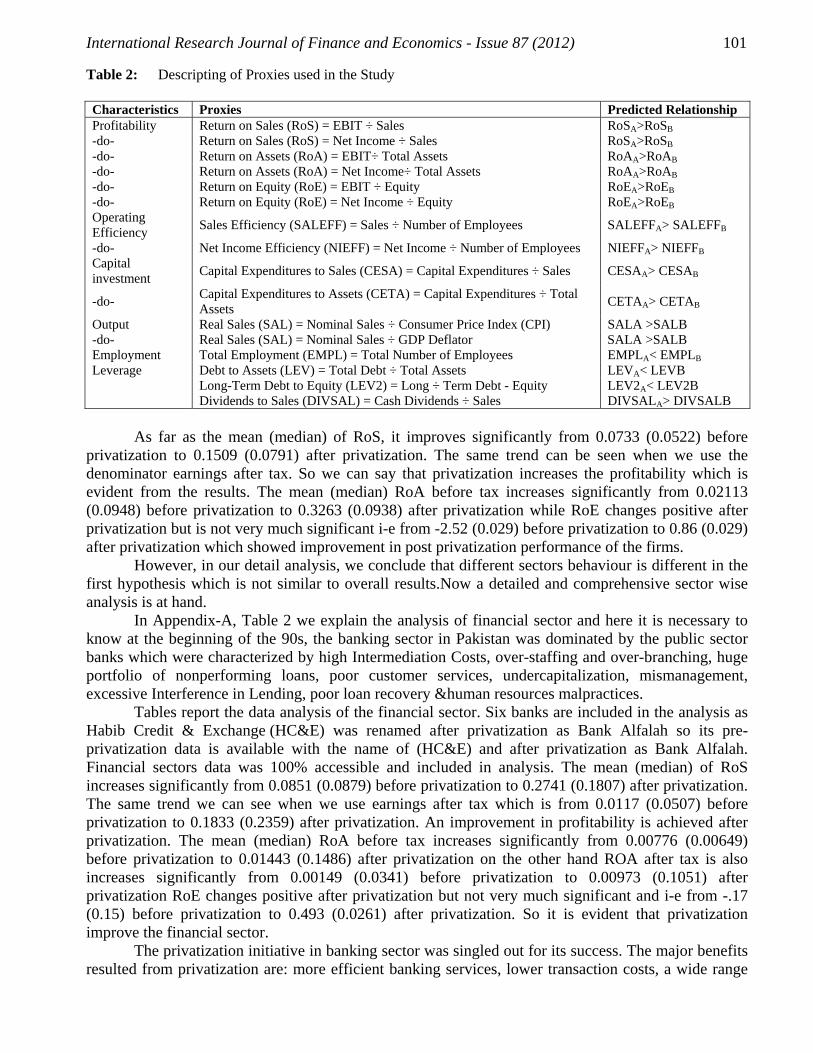
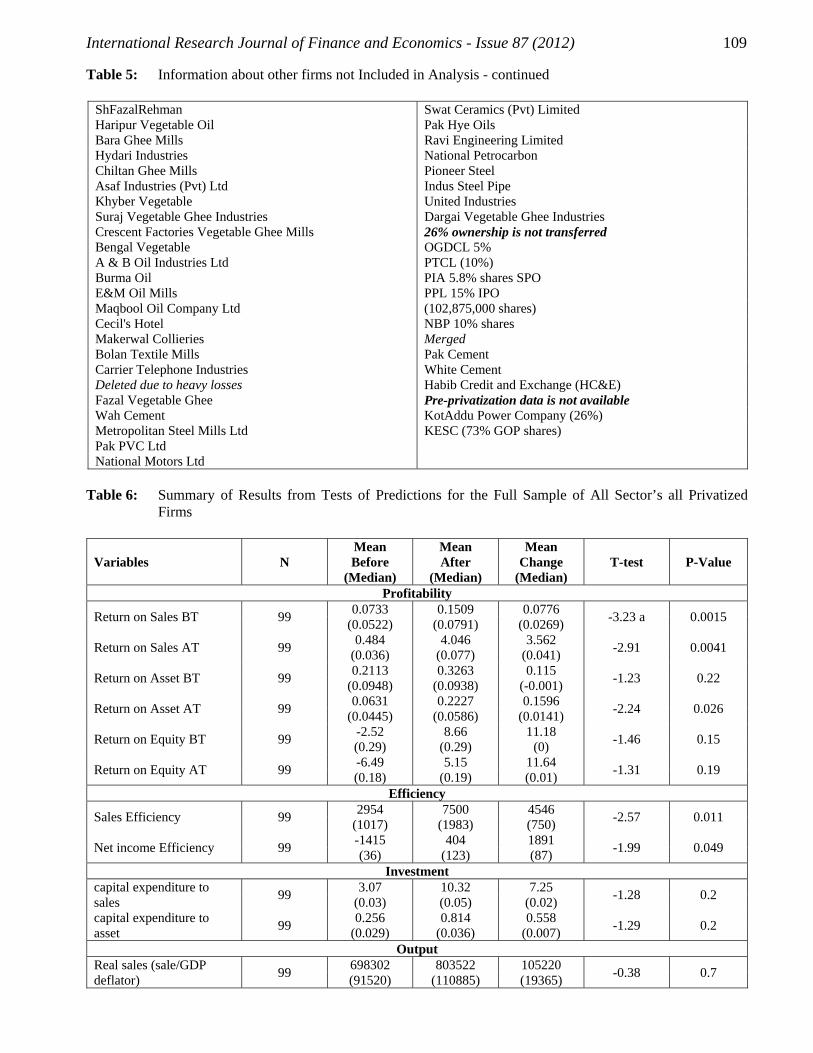
As far as the mean (median) of RoS, it improves significantly from 0.0733 (0.0522) before
privatization to 0.1509 (0.0791) after privatization. The same trend can be seen when we use the denominator earnings after tax. So we can say that privatization increases the profitability which is evident from the results. The mean (median) RoA before tax increases significantly from 0.02113 (0.0948) before privatization to 0.3263 (0.0938) after privatization while RoE changes positive after privatization but is not very much significant i-e from -2.52 (0.029) before privatization to 0.86 (0.029) after privatization which showed improvement in post privatization performance of the firms.
However, in our detail analysis, we conclude that different sectors behaviour is different in the first hypothesis which is not similar to overall results.Now a detailed and comprehensive sector wise analysis is at hand.
In Appendix-A, Table 2 we explain the analysis of financial sector and here it is necessary to know at the beginning of the 90s, the banking sector in Pakistan was dominated by the public sector banks which were characterized by high Intermediation Costs, over-staffing and over-branching, huge portfolio of nonperforming loans, poor customer services, undercapitalization, mismanagement, excessive Interference in Lending, poor loan recovery &human resources malpractices.
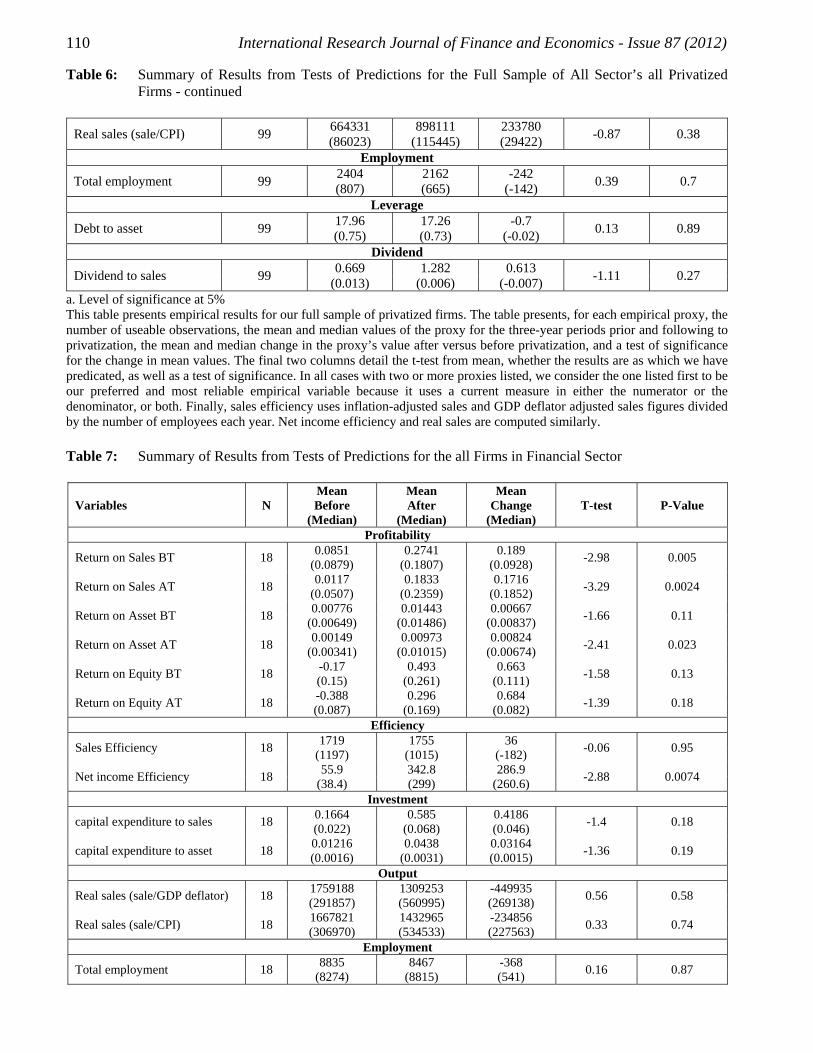
Tables report the data analysis of the financial sector. Six banks are included in the analysis as Habib Credit & Exchange (HC&E) was renamed after privatization as Bank Alfalah so its pre-privatization data is available with the name of (HC&E) and after privatization as Bank Alfalah. Financial sectors data was 100% accessible and included in analysis. The mean (median) of RoS increases significantly from 0.0851 (0.0879) before privatization to 0.2741 (0.1807) after privatization. The same trend we can see when we use earnings after tax which is from 0.0117 (0.0507) before privatization to 0.1833 (0.2359) after privatization. An improvement in profitability is achieved after privatization. The mean (median) RoA before tax increases significantly from 0.00776 (0.00649) before privatization to 0.01443 (0.1486) after privatization on the other hand ROA after tax is also increases significantly from 0.00149 (0.0341) before privatization to 0.00973 (0.1051) after privatization RoE changes positive after privatization but not very much significant and i-e from -.17 (0.15) before privatization to 0.493 (0.0261) after privatization. So it is evident that privatization improve the financial sector.
The privatization initiative in banking sector was singled out for its success. The major benefits resulted from privatization are: more efficient banking services, lower transaction costs, a wide range
102 International Research Journal of Finance and Economics - Issue 87 (2012)
of corporate and consumer services, removal of the additional equity requirement, reduction in political lending, improved regulations and competent management.
Hence privatization has shaped significant improvements in the financial sector of Pakistan. The automobile sector is presented in tables. A total of seven companies were privatized during
research period out of which 5 are included in the analysis. National Motors data is excluded from this sector analysis as an outlier and Naya Daur Motors was closed after privatization. The mean (median) of RoS increases significantly but not very high as it changes from 0.061 (0.0367) before privatization to 0.62 (0.0425) after privatization. The same results can be observed when we use earnings after tax which is from 0.0218 (0.0234) before privatization to 0.0426 (0.0273) after privatization. An average improvement in profitability is achieved after privatization. The mean (median) RoA before tax increases significantly from 0.0492 (0.0388) before privatization to 0.067 (0.0815) after privatization. On the other hand RoA after tax also increases significantly from 0.0218 (0.0212) before privatization to 0.0422 (0.0416) after privatization. The RoE changes negative after privatization but insignificant, which was from 0.137 (0.228) before privatization to -0.64 (0.026) after privatization. Privatization increased profitability in automobile sector but not much significant.
Tables present the cement sector analysis. 14 companies were privatized till 2005 which were previously included in STATE CEMENT CORPORATION OF PAKISTAN out of which 2 companies named White cement and Pak cement were merged in Maple Leaf cement. So these two companies’ pre privatization data was merged in Maple Leaf Cement and Wah cement’s data deleted as outlier. The overall profitability trend in cement sector is positive. The mean (median) of RoS before tax increases significantly as it changes from 0.0476 (0.0481) before privatization to 0.1847 (0.2116) after privatization and the same trend is presented in RoS after tax. The net increase in RoS before tax increase from 0.1371(.1635) which evens more than after tax mean (median) is 0.1239(0.132). The same increasing trend can be observed in remaining two proxies RoA and RoE. The net increase in mean (median), RoA and the RoE before tax is 0.0906 (0.0897), and after privatization is 0.0679 (0.0648), we can witness a similar outcome after sale as well (see Tables).
Thirteen companies were privatized in the chemical sector but post privatization data was available only for 4 companies and out of which 3 are included in analysis which are presented in table 5. Pak PVC Ltd’s data is excluded from this analysis as an outlier but still a negative trend is observed in chemical sector’s all 6 proxies i-e RoS, RoA and RoE before and after privatization. The mean (median) change in RoS, RoA and RoE before tax is -0.0574(-0.0457), -0.0502 (-0.0494) and -0.1257 (-0.1539) respectively. A similar trend is observed in after tax results in post privatization performance.
In the energy sector 6 companies were privatized during the study period. KotAddu Power Company is registered in KSE but its pre privatization data was unavailable as 3 years post privatization data was necessary to compare company’s performance. Similarly data of Karachi Electric Supply Corporation (KESC) was also unavailable so we include 4 companies’ data in our analysis. In RoS before tax (BT) the mean (median) changed from 0.1873(0.0843) to 0.2146(0.1336) and after tax were 0.1272 (0.0734) to 0.1638 (0.1077) showing a positive increase. The other two proxies also show the same trend, as in RoA and RoE the increase in results can be observed in 0.1039(0.0473) to 0.1248(0.069) and 0.3213(0.2383) to 0.3667(0.2924) respectively and similar trend is analyzed in after tax data.
In tables, engineering sector’s results are presented where overall increase in post privatization can be observed. A total of 7 companies were privatized in this sector and only two company’s 100% data was gathered for analysis, out of which one company, Metropolitan Steel Mills Ltd. was declared as outlier so only one company Quality Steel was included in this analysis. The RoS and RoA increased significantly but not RoE.
Tables shows the fertilizer data. Three companies were privatized and out of which Pak Saudi Fertilizers Limited’s data was unavailable, so two company’s data is included in this analysis. The first two proxies, which is RoS before and after taxes are showing a positive change and increase in profitability after privatization but the remaining 4 RoA and RoE before and after tax were negative.
International Research Journal of Finance and Economics - Issue 87 (2012) 103
As mentioned previously, where there is more than one proxy in any analysis, the first one is considered preferable. Hence, RoS provide more realist results.
Twenty four companies were privatized in the ghee sector, most of which are closed. Only five companies post privatization data was available with due efforts. Fazal Vegetable Ghee data was considered as an outlier company and the remaining 4 are included in the analysis. The whole ghee sector’s post privatization decreased in the sample period. All the six proxies show the decline in profitability after privatization.
Finally we can say out of 8 sectors, only ghee and chemical sectors did not perform well after privatization but financial, automobile, cement, energy, fertilizer, engineering and fertilizers’ post privatization performance has significantly improved. 4.2. Operating Efficiency
Normally government privatize SoEs with the hope that when the company will enter market competition, it will employ their human, financial, and technological resources more efficiently and it is necessary for their survival as well. Operating efficiency can be judged by two variables: sales efficiency (SALEFF) and income efficiency (INEFF). It explains the sales per employee and earnings before interest and taxes (EBIT) per employee respectively and normally sales efficiency is more preferred to compute the operating efficiency of the firms.
In order to calculate the efficiency of the firms we did not employ inflation-adjusted sales, we use inflation adjusted sales in output analysis only which shows imperative increases in the firms after privatization.
The two proxies for efficiency, namely sales efficiency and net income efficiency (net income per employee (NIEFF)) as mentioned in tables show a highly significant improvement (at 5 percentile level). For example, SALEFF increases mean (median) from 2954(1017) to 7500(1983) after privatization and NIEFF -1415 (404) to 36(123). The overall results suggest that privatization significantly improves their operating efficiency in Pakistan which accomplishes the government objectives of starting privatization program in country. In SALEFF, t-test value is -2.75 and P-value is .0011 and in NIEFF it is -1.99 and 0.049.
Financial sector’s performance also improves when we calculate the mean and it is from 719 to 1755 in SALEFF and 55.9 to 342 in NIEFF and improves significantly as its t-value is -.0.06 and -.2.88 respectively. The median values, however shows a decrease in sales SALEFF but increase in NIEFF. But overall, the financial sectors operating performance have augmented after privatization.
The operating performance of the automobile sector also significantly improved in post privatization results. The data shows the net increase in mean (median) of SALEFF is 2170(1383) which comes from the pre privatization results 1630 (1616) to 3737 (2999) post-privatization. And the same significant trend can be observed in NIEFF data presented in tables.
Similarly, the cement sector also shows a net increase in progress after privatization and the results of this sector are also highly significant. There is an increasing trend in mean (median) of SALEFF from 626.7 (538) to 9323 (1428) after privatization. Same increased performance results can be observed in NIEFF data in tables which is given in Appendix-.
The chemical sector show significant increase in operating performance after privatization as mentioned in table. But in this sector SALEFF shows highly significant results as compared to NIEFF. Because in NIEFF proxy, the mean shows improved performance but median shows declining results. The mean (median) improve from 642.7(620) to 1044 (981) in SALEFF and 49.5(37.6) to 35.1 (52.4). But as in our analysis our preferred proxy is the first one so we can say that the overall operating performance of privatized firms has increased.
Energy sector’ operating performance change is highly significant in NIEFF but moderate in SALEFF. As data in different tables present positive change in mean and median after privatization. The t-test value from mean is -1.79 in NIEFF and -1.32 in SALEFF which shows .092 and .21 significance at 5% confidence level.
104 International Research Journal of Finance and Economics - Issue 87 (2012)
In engineering, fertilizer and ghee sector operating performance of privatized firm is insignificant as predicted from t-test of mean. Although there is an increase in the firms operating performance after privatization in all the above mentioned sectors in Pakistan but that change is not much significant.
So we can conclude that the operating performance of privatized firms significantly increased in overall, financial, automobile, cement, chemical and energy but insignificant in engineering, fertilizer and ghee sectors. 4.3. Capital Expenditures
Boycko, Shleifer, and Vishny(1994) argued that in order to increase employment and social objectives in the country, the government must use all its resources to mobilize high output goods companies for example weaponry of doubtful economic value and subsidize their inefficiencies.
In order to judge the investment intensity we compute two proxies, capital expenditures divided by sales (CESA) and capital expenditures divided by total assets (CETA).
The above mentioned two proxies, specifically, capital expenditures to sales (CESA) and capital expenditures to total assets (CETA), explain an imperative increase in all firms empirically evident from the data. The mean (median) change in full sample is increased from 3.07(0.03) to10.32 (0.05) in CESA and 0.256 (0.029) to 0.814 (0.036) in CETA which show net change 7.25(0.02) -1.28 and -1.29 t-test values at 5 % confidence level.
But if we analyze the trend in individual sectors, financial, automobile, energy, engineering, fertilizer and ghee sectors although has improved their capital expenditure after privatization but the improvement in cement sector is highly significant. 4.4. Changes in Output
In order to test these predictions and to check our hypothesis we compute average inflation-adjusted sales and GDP deflated sales.
In this analysis real sale refers to deflating sales using the appropriate consumer price index (CPI) values, and then normalizing them to equal 1.00 in years. Each year we divide nominal sale to CPI and GDP deflator and see the trend of data after privatization. Because it happens for some companies that after privatization one reason or other their product prices increases sharply as in case of Pak Arab Fertilizer in Pakistan. The major contributions in profits were due to increase in prices as compared to increase in sales volume. So, the level of real sales is improved after privatization significantly.
Different researches presented by Megginson, Nash, & Randenborgh, (1994), D'Souza, & Megginson, (1999), Boubakri, & Cosset, (1998), Wei, Varela, D'Souza, Hassan, (2003) and D'Souza, & Megginson, & Nash, (2001) have used this proxy in order to measure real sale (Sale / CPI) but in our analysis we consider the real sale after eliminating the impact of inflation as well as GDP Deflator. But both have almost similar findings. Therefore, in overall analysis the net increase in mean (median) of real sale (Inflation) is 105220(19365) and in real sale (GDP Deflator) is 233780 (29422) but the results is insignificant when we consider t-test and P-value.
If we analyse the full sample results these are insignificant although the mean and median has increased in real term after privatization in full sample analysis, automobile, chemical, energy, engineering, fertilizer and ghee sectors it results are insignificant but have increasing trend while financial sector’s performance of output decline after privatization and cement sector shows highly significant results with improved performance. 4.5. Changes in Employment
Boycko, Shleifer & Vishny, (1996) analysis gives arguments against the previous documented researches that state owned enterprises produce more due to political pressure but Megginson et al.
International Research Journal of Finance and Economics - Issue 87 (2012) 105
(1994) gave one argument that the increase in production in the firms after privatization is often because of better incentives and greater financing opportunities. However, D'Souza & Megginson (1999) documented that the decrease in employment of firms which are privatized during 1990s are insignificant which is opposite to the La Porta and Lopez-de-Silanes (1999) who mentioned a decrease in the employment level after privatization significantly in their sample of Mexican NPFs. Our findings are similar to previous studies and there is a decreasing trend in employment after privatization but not very much significant as we can observe in different tables. 4.6. Changes in Leverages
Leverage changes also appear to be persistent across my samples. We documented a significant decline in LEV for every one of our sub samples, though in several cases-for non-competitive industry firms, for control privatizations, and for OECD countries-the decline is relatively small.
The empirical results shows a decrease in leverage in overall results but this is insignificant although the mean (median) has decreased in real term from 17.96(0.75) to 17.26(0.73) which give us an idea about net change in mean (median) -0.7(-0.02) after privatization. The 0.13 T-Test value and 0.89 p-values make it insignificant. The full sample analysis make our hypothesis correct.But the in full sample analysis, automobile, cement, chemical, sectors change in mean (median) is -0.0881 (-0.0663), -0.035 (0.0225), -0.035 (0.0225), its results are insignificant but have an increasing trend while the increase in leverage in financial, energy, engineering, fertilizer and ghee sector’s in mean(median) change are .00239(.01128), 0.007 (-0.0236), 0.556 (0.6092), 0.0647 (0.0694), and 0.3972 (0.3737), respectively but the results are insignificant when we consider the t-test and p-value after privatization . 4.7. Changes in Dividend Payments
We observe whether dividend payouts, measured as total dividend payments divided by net income (PAYOUT) and dividends divided by sales (DIVSAL), increase following privatization. This very strong evidence of dividend increases after privatization is also found in our sub samples. Without exception, DIVSAL increases substantially and significantly after divestiture regardless of industry structure, privatization method, or stage of national development. Clearly, becoming a private but publicly traded company implies a sharp increase (or initiation) in cash dividend payments.
For the hypothesis of changes in dividend payments, the overall analysis shows an improvement DIVSAL in mean (median) from 0.669 (0.013) to 1.282 (0.006) with net change 0.613 (-0.007) and t- value is -1.11 with p-value 0.27. This shows an increasing trend in post privatization results but again the results are not very much significant.While considering the sectors analysis the trend which can be observed from empirical results are in financial sector the mean (median) from 0.01458 (0) to 0.0495 (0.0495) with net change 0.613 (-0.007) shows significant increase in this sector.Engineering, automobile and ghee sector shows significant decrease in their proxies, and rather results of ghee sector is highly significant after privatization.
Nevertheless, cement, chemical, fertilizer and energy show increase in dividend to sale ratio but their results are insignificant.
A large number of privatized firms which are transferred to the employees like Milliat Tractors Ltd. and Allied Bank Limited proved good results and successful transactions. With the introduction of improved management training, management practises, productivity and welfare of the workers, these companies have been very successful. Similarly, some of the privatized units progressed very well because management gave lots of benefits to the workers like increase in salary and improved working atmosphere i.e. Kot Addu Power Company and MCB. On the other side, where the management was unqualified, inexperienced and having no expertise to run that organization, workers have suffered a lot.
106 International Research Journal of Finance and Economics - Issue 87 (2012)
5. Conclusion Combined with results from previous, directly similar researches, our findings recommend that privatization capitulate significant increase in performance and this is empirically evident through Overall country performance, sector performance and majority of the individual firm performance.
So we can say that government should focuses on good governance, policy making, guideline, provide supportive environment that provide incentives for the private sector to invest in providing goods and services efficiently and effectively. The prime responsibility of the government is to work for the welfare of the society and country not the business and privatization helps the government to achieve its objectives and support to put business into the right hands while releasing the government to focus on such matters as ensuring law and order and assuring that facilitating the framework which is favourable to investment while being fair to consumers and the taxpayers.
Simultaneously, in order to improve the political condition of the country and create the positive environment which will be ultimately fruitful for privatization, the government needs more new investment injections, introduction of better management, introduction of new and improving the technology, increase in competitiveness, and thus leaving more funds with the company. All these measures automatically enhance the employment opportunity in the country. Simultaneously government should take some important steps and develop dynamic policies to increase the confidence of the foreign as well as local investors in Pakistan. And all this is possible only and only if the government proves itself consistent and committed in following its policies and ensuring reforms and continuing in development positive environment for the investors in Pakistan.
The very fundamental and foremost thing for the successful privatization is that the country should be deregulated and the government should eliminate unnecessary restrictions and lengthy documentation procedures form the industrial enterprises. In this way privatization should consequently be part of a process to strengthen private sector through handing over it assets as well as improving and establishing regulatory arrangement and better infrastructure for their operation. Because if the government transfers the ownership to the private sector but to keep it throttled by massive regulations then privatization would not improve the operational efficiency and effectiveness of the organizations.
Consequently, the transfer of SoEs should be spread over a period of time. There should be a particular pre-defined order for privatization. To privatize the SoEs, normally the government should offered for sale the loss making units first and then the less profitable and finally the more profitable but it is also possible that a combination of loss making and profitable units is offered for sale collectively as a bunch. In conclusion, it must be ensured by the government that the company which is buying the industrial as well as consumer unit must be serious to run that organization instead of selling its assets and using the factory for some other businesses as this has happened in majority closed units in Pakistan and this, therefore cause a severe loss of production, employment and taxes to the national economy.
At the end, a new room for future researchers is to go for a detail analysis of privatized firms more than seven years is available because only three years may not show the reliable trend of the data.Privatization cannot be fruitful until and unless the support of all the stakeholders is not achieved. These include different government agencies, government and other departments and organizations and for the most part and very important the people of Pakistan, without whose constant support and understanding this process cannot be undertaken successfully. References [1] Arbomeit, H. (1986). Privatization in Great Britain. Annals of Public and Cooperative [2] Bhaskar, V., & Khan, M. (1995). Privatization and Employment: A Study of the Jute Industry
in Bangladesh, American Economic Review, 85(1), 267-273.
International Research Journal of Finance and Economics - Issue 87 (2012) 107
[3] Bortolotti, B., Fantini, M., & Scarpa, C. (2000). Why Do Governments Privatize Abroad? International Review of Finance, 3, 131-161.
[4] Boubakri, N., & Cosset J.C. (1998). The financial and operating performance of newly privatised firms: evidence from developing countries. Journal of Finance, 53(3), 1081-1110.
[5] Boycko, M., Shleifer, A., & Vishny, R.W. (1994). Voucher Privatization. Journal of Financial Economics, 35, 249-66.
[6] Boycko, M., Shleifer, A., & Vishny, R.W. (1996). A theory of privatization. Economic Journal, 106, 309-319.
[7] Burton, J. (1987). Privatization: The Thatcher Case. Managerial and Decision Economics, 1, 21-29.
[8] Cao, Y., Qian, Y. & Weingast, B. (1999). From federalism, Chinese style to privatization, Chinese style. Economics of Transition, 7, 103-31.
[9] Christopher, A. Cavendish, W., & Mistry, P. S. (1992). Adjusting Privatization: Case Studies from Developing Countries. London: James Currey Ltd.
[10] D’Souza, J., & Megginson, W.L. (1999) The financial and operating performance of newly privatized firms during the 1990s. Journal of Finance, 54(4), 1397-1438.
[11] D’Souza, J., Megginson, W.L., & Nash R.C. (2001). Determinants of Performance Improvements in Privatized Firms: The Role of Restructuring and Corporate Governance (Working paper). University of Oklahoma.
[12] Easterly, W. (2001). The Elusive Quest for Growth. Cambridge, Massachusetts: The MIT Press. [13] Garnaut, R., Song, L. Tenev, S. & Yao, Y. (2003). A Study of Firm Restructuring in China,
manuscript. Washington, DC: The World Bank. [14] Gibbon, H. (1997). A Seller's Manual: Guidelines for Selling State-Owned Enterprises.
Privatisation Yearbook, Privatization Int. (pp. 1626). [15] Gul, F.A. (1999). Government Share Ownership, Investment Opportunity Set and Corporate
Policy Choices in China. Pacific-Basin Finance Journal, 7, 157-172. [16] Kikeri, S, Nellis, J., & Shirley, M., (1994). Privatization: lessons from market economies.
World Bank Research Observer, 9, 241-272. [17] La Porta, Rafael, & Florencio Lopez-de-Silanes, (1999). Benefits of privatization: Evidence
from Mexico. Quarterly Journal of Economics, 114, 1193-1242. [18] Lin, Y. & Zhu, T. (2001). Ownership restructuring in Chinese state industry: An analysis of
evidence on initial organizational changes. China Quarterly, 0 (166), 305-41. [19] Megginson, W.L., Nash, R.C. & Randenborgh, M.V. (1994). The financial and operating
performance of newly privatized firms: An international empirical analysis. Journal of Finance, 49(2), 403-452.
[20] Megginson, W. L. (2000). Privatization. Foreign Policy, 118, 14-27. [21] Megginson, W.L., & Netter, J.M. (2001). From State to Market: A Survey of Empirical Studies
on Privatization. Journal of Economic Literature, 39, 321-389. [22] Omran, M. (2004). The Performance of State-Owned Enterprises and Newly Privatized Firms:
Does Privatization Really Matter? World Development, Elsevier, 32(6), 1019-1041. [23] Paula, N. (1994). Pakistan under Banazir Bhutto. Foreign Policy, 95, 161-174. [24] Poole, R. W. (1996). Privatization for Economic Development. In Terry L. A., & Peter J. H.
(Eds.), The Privatization Process (pp. 1-18). United States of America: Rowman & Littlefield Publishers.
[25] Qi, D., Wu, W., & Zhang, H. (2000). Shareholding Structure and Corporate Performance of Partially Privatized Firms: Evidence from Listed Chinese Companies. Pacific-Basin Finance Journal, 8, 587-610.
[26] Quiggin, J. (2002). Privatization and nationalization in the 21st century. Growth, 50, 66–73. [27] Wei, Z. & Varela, O. (2003). State Equity Ownership and Firm Market Performance: Evidence
from China's Newly Privatized Firms. Global Finance Journal, 14, 65-82.
108 International Research Journal of Finance and Economics - Issue 87 (2012)
[28] Wei, Z., Varela, O., D'Souza, J., & Hassan, M. Kabir. (2003). The financial and operating performance of China's newly privatized firms. Financial Management, 32(2).
[29] Yergin, D., & Stanislaw, J. (1998). The Commanding Heights: The Battle between Government and the Marketplace That Is Remaking the Modern World. NY: Simon & Schuster.
[30] Young, P. (1987). Privatization around the world. NCPA Policy Report, 120. Dallas: National Centre for Policy Analysis.
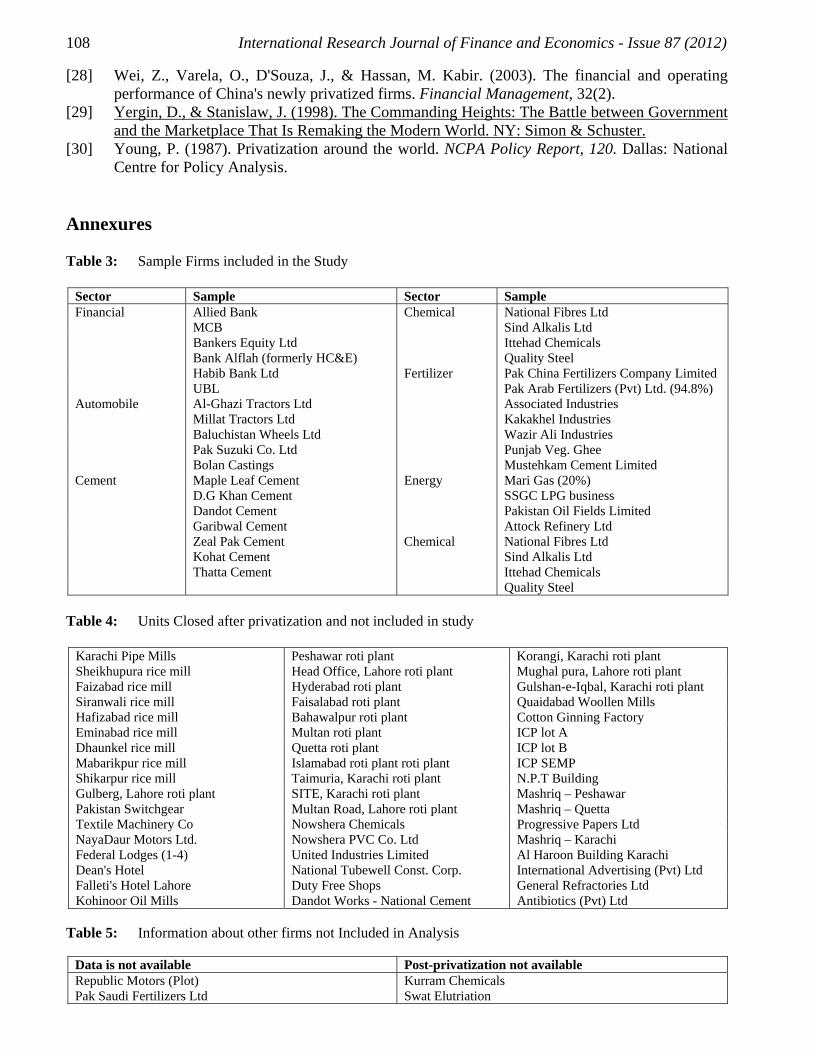
Annexures Table 3: Sample Firms included in the Study
Sector Sample Sector Sample Financial Allied Bank Chemical National Fibres Ltd MCB Sind Alkalis Ltd Bankers Equity Ltd Ittehad Chemicals Bank Alflah (formerly HC&E) Quality Steel Habib Bank Ltd Fertilizer Pak China Fertilizers Company Limited UBL Pak Arab Fertilizers (Pvt) Ltd. (94.8%) Automobile Al-Ghazi Tractors Ltd Associated Industries Millat Tractors Ltd Kakakhel Industries Baluchistan Wheels Ltd Wazir Ali Industries Pak Suzuki Co. Ltd Punjab Veg. Ghee Bolan Castings Mustehkam Cement Limited Cement Maple Leaf Cement Energy Mari Gas (20%) D.G Khan Cement SSGC LPG business Dandot Cement Pakistan Oil Fields Limited Garibwal Cement Attock Refinery Ltd Zeal Pak Cement Chemical National Fibres Ltd Kohat Cement Sind Alkalis Ltd Thatta Cement Ittehad Chemicals Quality Steel
Table 4: Units Closed after privatization and not included in study
Karachi Pipe Mills Peshawar roti plant Korangi, Karachi roti plant Sheikhupura rice mill Head Office, Lahore roti plant Mughal pura, Lahore roti plant Faizabad rice mill Hyderabad roti plant Gulshan-e-Iqbal, Karachi roti plant Siranwali rice mill Faisalabad roti plant Quaidabad Woollen Mills Hafizabad rice mill Bahawalpur roti plant Cotton Ginning Factory Eminabad rice mill Multan roti plant ICP lot A Dhaunkel rice mill Quetta roti plant ICP lot B Mabarikpur rice mill Islamabad roti plant roti plant ICP SEMP Shikarpur rice mill Taimuria, Karachi roti plant N.P.T Building Gulberg, Lahore roti plant SITE, Karachi roti plant Mashriq – Peshawar Pakistan Switchgear Multan Road, Lahore roti plant Mashriq – Quetta Textile Machinery Co Nowshera Chemicals Progressive Papers Ltd NayaDaur Motors Ltd. Nowshera PVC Co. Ltd Mashriq – Karachi Federal Lodges (1-4) United Industries Limited Al Haroon Building Karachi Dean's Hotel National Tubewell Const. Corp. International Advertising (Pvt) Ltd Falleti's Hotel Lahore Duty Free Shops General Refractories Ltd Kohinoor Oil Mills Dandot Works - National Cement Antibiotics (Pvt) Ltd
Table 5: Information about other firms not Included in Analysis
Data is not available Post-privatization not available Republic Motors (Plot) Kurram Chemicals Pak Saudi Fertilizers Ltd Swat Elutriation
International Research Journal of Finance and Economics - Issue 87 (2012) 109
Table 5: Information about other firms not Included in Analysis - continued
ShFazalRehman Swat Ceramics (Pvt) Limited Haripur Vegetable Oil Pak Hye Oils Bara Ghee Mills Ravi Engineering Limited Hydari Industries National Petrocarbon Chiltan Ghee Mills Pioneer Steel Asaf Industries (Pvt) Ltd Indus Steel Pipe Khyber Vegetable United Industries Suraj Vegetable Ghee Industries Dargai Vegetable Ghee Industries Crescent Factories Vegetable Ghee Mills 26% ownership is not transferred Bengal Vegetable OGDCL 5% A & B Oil Industries Ltd PTCL (10%) Burma Oil PIA 5.8% shares SPO E&M Oil Mills PPL 15% IPO Maqbool Oil Company Ltd (102,875,000 shares) Cecil's Hotel NBP 10% shares Makerwal Collieries Merged Bolan Textile Mills Pak Cement Carrier Telephone Industries White Cement Deleted due to heavy losses Habib Credit and Exchange (HC&E) Fazal Vegetable Ghee Pre-privatization data is not available Wah Cement KotAddu Power Company (26%) Metropolitan Steel Mills Ltd KESC (73% GOP shares) Pak PVC Ltd National Motors Ltd
Table 6: Summary of Results from Tests of Predictions for the Full Sample of All Sector’s all Privatized
Firms
Variables N Mean Before
(Median)
Mean After
(Median)
Mean Change
(Median) T-test P-Value
Profitability
Return on Sales BT 99 0.0733 0.1509 0.0776 -3.23 a 0.0015 (0.0522) (0.0791) (0.0269)
Return on Sales AT 99 0.484 4.046 3.562 -2.91 0.0041 (0.036) (0.077) (0.041)
Return on Asset BT 99 0.2113 0.3263 0.115 -1.23 0.22 (0.0948) (0.0938) (-0.001)
Return on Asset AT 99 0.0631 0.2227 0.1596 -2.24 0.026 (0.0445) (0.0586) (0.0141)
Return on Equity BT 99 -2.52 8.66 11.18 -1.46 0.15 (0.29) (0.29) (0)
Return on Equity AT 99 -6.49 5.15 11.64 -1.31 0.19 (0.18) (0.19) (0.01) Efficiency
Sales Efficiency 99 2954 7500 4546 -2.57 0.011 (1017) (1983) (750)
Net income Efficiency 99 -1415 404 1891 -1.99 0.049 (36) (123) (87) Investment
capital expenditure to sales 99 3.07 10.32 7.25 -1.28 0.2 (0.03) (0.05) (0.02) capital expenditure to asset 99 0.256 0.814 0.558 -1.29 0.2 (0.029) (0.036) (0.007)
OutputReal sales (sale/GDP deflator) 99 698302 803522 105220 -0.38 0.7 (91520) (110885) (19365)
110 International Research Journal of Finance and Economics - Issue 87 (2012)
Table 6: Summary of Results from Tests of Predictions for the Full Sample of All Sector’s all Privatized Firms - continued
Real sales (sale/CPI) 99 664331 898111 233780 -0.87 0.38 (86023) (115445) (29422)
Employment
Total employment 99 2404 2162 -242 0.39 0.7 (807) (665) (-142) Leverage
Debt to asset 99 17.96 17.26 -0.7 0.13 0.89 (0.75) (0.73) (-0.02) Dividend
Dividend to sales 99 0.669 1.282 0.613 -1.11 0.27 (0.013) (0.006) (-0.007) a. Level of significance at 5% This table presents empirical results for our full sample of privatized firms. The table presents, for each empirical proxy, the number of useable observations, the mean and median values of the proxy for the three-year periods prior and following to privatization, the mean and median change in the proxy’s value after versus before privatization, and a test of significance for the change in mean values. The final two columns detail the t-test from mean, whether the results are as which we have predicated, as well as a test of significance. In all cases with two or more proxies listed, we consider the one listed first to be our preferred and most reliable empirical variable because it uses a current measure in either the numerator or the denominator, or both. Finally, sales efficiency uses inflation-adjusted sales and GDP deflator adjusted sales figures divided by the number of employees each year. Net income efficiency and real sales are computed similarly. Table 7: Summary of Results from Tests of Predictions for the all Firms in Financial Sector
Variables N Mean Before
(Median)
Mean After
(Median)
Mean Change
(Median) T-test P-Value
Profitability
Return on Sales BT 18 0.0851 0.2741 0.189 -2.98 0.005 (0.0879) (0.1807) (0.0928)
Return on Sales AT 18 0.0117 0.1833 0.1716 -3.29 0.0024 (0.0507) (0.2359) (0.1852)
Return on Asset BT 18 0.00776 0.01443 0.00667 -1.66 0.11 (0.00649) (0.01486) (0.00837)
Return on Asset AT 18 0.00149 0.00973 0.00824 -2.41 0.023 (0.00341) (0.01015) (0.00674)
Return on Equity BT 18 -0.17 0.493 0.663 -1.58 0.13 (0.15) (0.261) (0.111)
Return on Equity AT 18 -0.388 0.296 0.684 -1.39 0.18 (0.087) (0.169) (0.082) Efficiency
Sales Efficiency 18 1719 1755 36 -0.06 0.95 (1197) (1015) (-182)
Net income Efficiency 18 55.9 342.8 286.9 -2.88 0.0074 (38.4) (299) (260.6) Investment
capital expenditure to sales 18 0.1664 0.585 0.4186 -1.4 0.18 (0.022) (0.068) (0.046)
capital expenditure to asset 18 0.01216 0.0438 0.03164 -1.36 0.19 (0.0016) (0.0031) (0.0015) Output
Real sales (sale/GDP deflator) 18 1759188 1309253 -449935 0.56 0.58 (291857) (560995) (269138)
Real sales (sale/CPI) 18 1667821 1432965 -234856 0.33 0.74 (306970) (534533) (227563) Employment
Total employment 18 8835 8467 -368 0.16 0.87 (8274) (8815) (541)
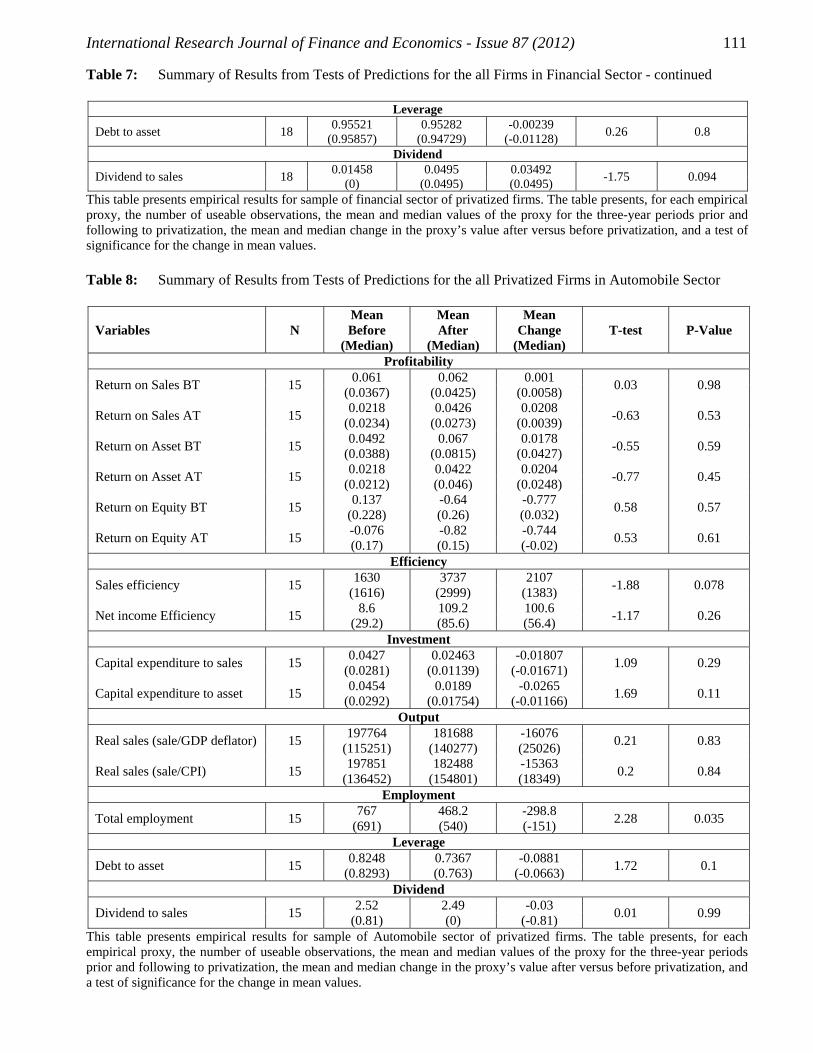
International Research Journal of Finance and Economics - Issue 87 (2012) 111
Table 7: Summary of Results from Tests of Predictions for the all Firms in Financial Sector - continued
Leverage
Debt to asset 18 0.95521 0.95282 -0.00239 0.26 0.8 (0.95857) (0.94729) (-0.01128) Dividend
Dividend to sales 18 0.01458 0.0495 0.03492 -1.75 0.094 (0) (0.0495) (0.0495) This table presents empirical results for sample of financial sector of privatized firms. The table presents, for each empirical proxy, the number of useable observations, the mean and median values of the proxy for the three-year periods prior and following to privatization, the mean and median change in the proxy’s value after versus before privatization, and a test of significance for the change in mean values. Table 8: Summary of Results from Tests of Predictions for the all Privatized Firms in Automobile Sector
Variables N Mean Before
(Median)
Mean After
(Median)
Mean Change
(Median) T-test P-Value
Profitability
Return on Sales BT 15 0.061 0.062 0.001 0.03 0.98 (0.0367) (0.0425) (0.0058)
Return on Sales AT 15 0.0218 0.0426 0.0208 -0.63 0.53 (0.0234) (0.0273) (0.0039)
Return on Asset BT 15 0.0492 0.067 0.0178 -0.55 0.59 (0.0388) (0.0815) (0.0427)
Return on Asset AT 15 0.0218 0.0422 0.0204 -0.77 0.45 (0.0212) (0.046) (0.0248)
Return on Equity BT 15 0.137 -0.64 -0.777 0.58 0.57 (0.228) (0.26) (0.032)
Return on Equity AT 15 -0.076 -0.82 -0.744 0.53 0.61 (0.17) (0.15) (-0.02) Efficiency
Sales efficiency 15 1630 3737 2107 -1.88 0.078 (1616) (2999) (1383)
Net income Efficiency 15 8.6 109.2 100.6 -1.17 0.26 (29.2) (85.6) (56.4) Investment
Capital expenditure to sales 15 0.0427 0.02463 -0.01807 1.09 0.29 (0.0281) (0.01139) (-0.01671)
Capital expenditure to asset 15 0.0454 0.0189 -0.0265 1.69 0.11 (0.0292) (0.01754) (-0.01166) Output
Real sales (sale/GDP deflator) 15 197764 181688 -16076 0.21 0.83 (115251) (140277) (25026)
Real sales (sale/CPI) 15 197851 182488 -15363 0.2 0.84 (136452) (154801) (18349) Employment
Total employment 15 767 468.2 -298.8 2.28 0.035 (691) (540) (-151) Leverage
Debt to asset 15 0.8248 0.7367 -0.0881 1.72 0.1 (0.8293) (0.763) (-0.0663) Dividend
Dividend to sales 15 2.52 2.49 -0.03 0.01 0.99 (0.81) (0) (-0.81) This table presents empirical results for sample of Automobile sector of privatized firms. The table presents, for each empirical proxy, the number of useable observations, the mean and median values of the proxy for the three-year periods prior and following to privatization, the mean and median change in the proxy’s value after versus before privatization, and a test of significance for the change in mean values.
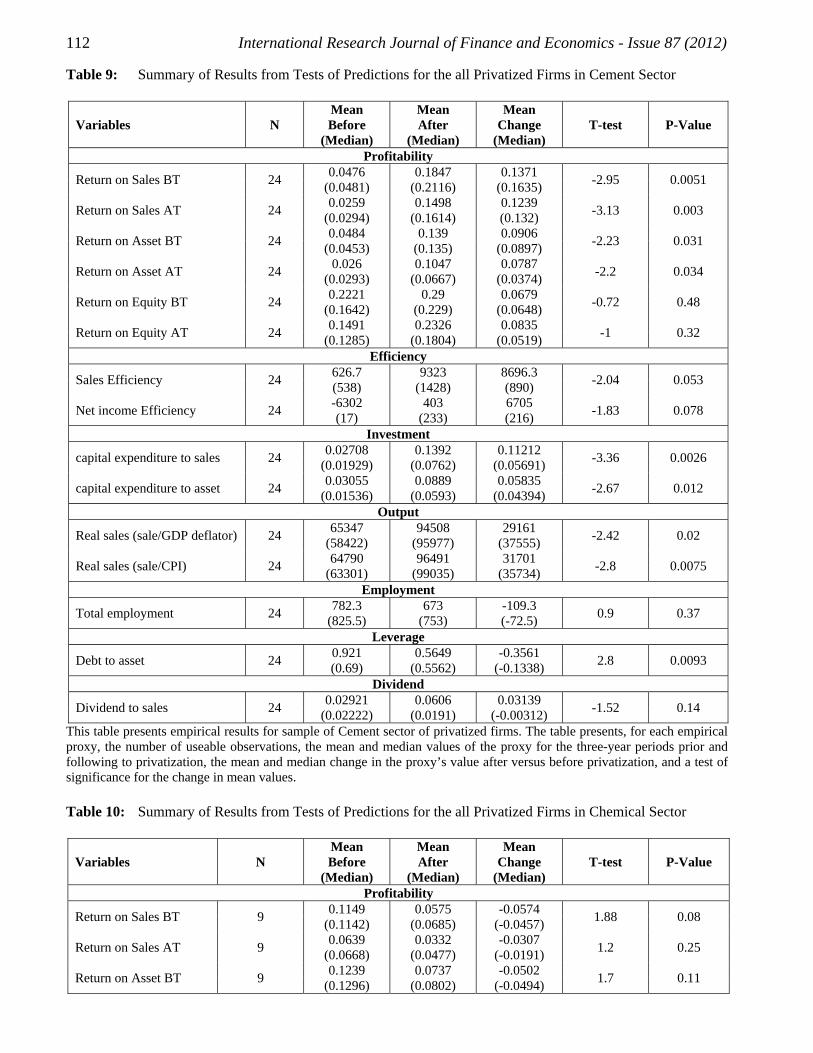
112 International Research Journal of Finance and Economics - Issue 87 (2012)
Table 9: Summary of Results from Tests of Predictions for the all Privatized Firms in Cement Sector
Variables N Mean Before
(Median)
Mean After
(Median)
Mean Change
(Median) T-test P-Value
Profitability
Return on Sales BT 24 0.0476 0.1847 0.1371 -2.95 0.0051 (0.0481) (0.2116) (0.1635)
Return on Sales AT 24 0.0259 0.1498 0.1239 -3.13 0.003 (0.0294) (0.1614) (0.132)
Return on Asset BT 24 0.0484 0.139 0.0906 -2.23 0.031 (0.0453) (0.135) (0.0897)
Return on Asset AT 24 0.026 0.1047 0.0787 -2.2 0.034 (0.0293) (0.0667) (0.0374)
Return on Equity BT 24 0.2221 0.29 0.0679 -0.72 0.48 (0.1642) (0.229) (0.0648)
Return on Equity AT 24 0.1491 0.2326 0.0835 -1 0.32 (0.1285) (0.1804) (0.0519) Efficiency
Sales Efficiency 24 626.7 9323 8696.3 -2.04 0.053 (538) (1428) (890)
Net income Efficiency 24 -6302 403 6705 -1.83 0.078 (17) (233) (216) Investment
capital expenditure to sales 24 0.02708 0.1392 0.11212 -3.36 0.0026 (0.01929) (0.0762) (0.05691)
capital expenditure to asset 24 0.03055 0.0889 0.05835 -2.67 0.012 (0.01536) (0.0593) (0.04394) Output
Real sales (sale/GDP deflator) 24 65347 94508 29161 -2.42 0.02 (58422) (95977) (37555)
Real sales (sale/CPI) 24 64790 96491 31701 -2.8 0.0075 (63301) (99035) (35734) Employment
Total employment 24 782.3 673 -109.3 0.9 0.37 (825.5) (753) (-72.5) Leverage
Debt to asset 24 0.921 0.5649 -0.3561 2.8 0.0093 (0.69) (0.5562) (-0.1338) Dividend
Dividend to sales 24 0.02921 0.0606 0.03139 -1.52 0.14 (0.02222) (0.0191) (-0.00312) This table presents empirical results for sample of Cement sector of privatized firms. The table presents, for each empirical proxy, the number of useable observations, the mean and median values of the proxy for the three-year periods prior and following to privatization, the mean and median change in the proxy’s value after versus before privatization, and a test of significance for the change in mean values. Table 10: Summary of Results from Tests of Predictions for the all Privatized Firms in Chemical Sector
Variables N Mean Before
(Median)
Mean After
(Median)
Mean Change
(Median) T-test P-Value
Profitability
Return on Sales BT 9 0.1149 0.0575 -0.0574 1.88 0.08 (0.1142) (0.0685) (-0.0457)
Return on Sales AT 9 0.0639 0.0332 -0.0307 1.2 0.25 (0.0668) (0.0477) (-0.0191)
Return on Asset BT 9 0.1239 0.0737 -0.0502 1.7 0.11 (0.1296) (0.0802) (-0.0494)
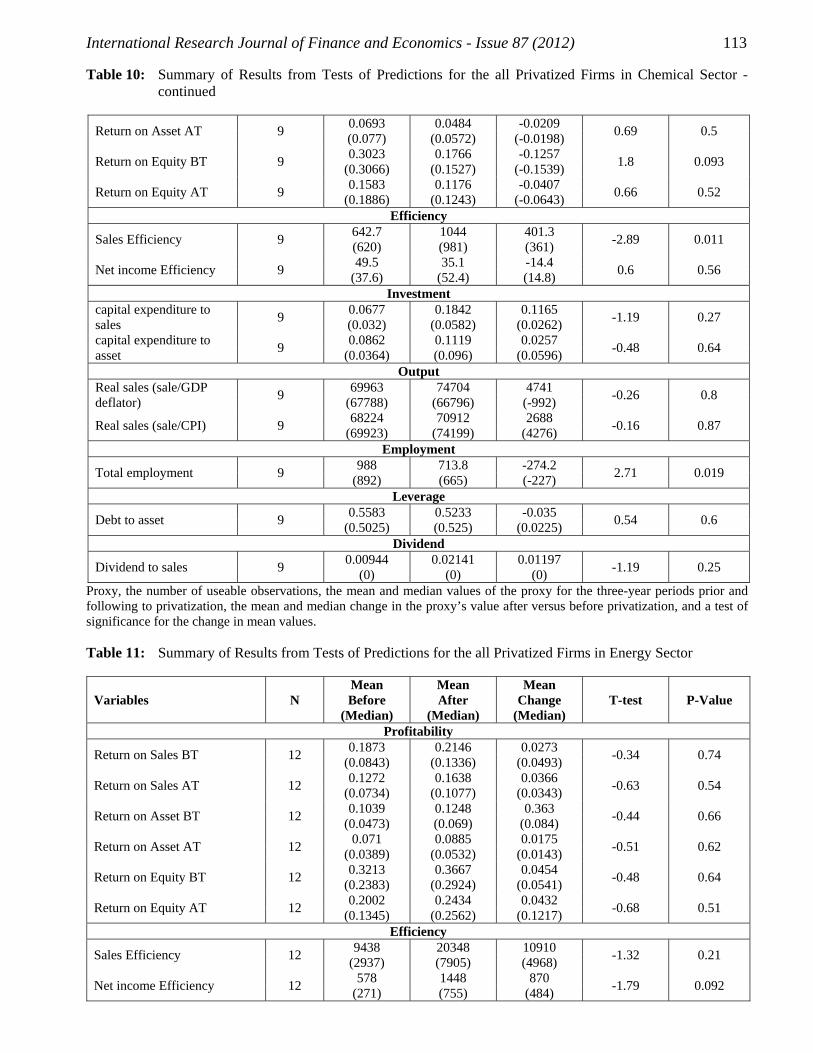
International Research Journal of Finance and Economics - Issue 87 (2012) 113
Table 10: Summary of Results from Tests of Predictions for the all Privatized Firms in Chemical Sector - continued
Return on Asset AT 9 0.0693 0.0484 -0.0209 0.69 0.5 (0.077) (0.0572) (-0.0198)
Return on Equity BT 9 0.3023 0.1766 -0.1257 1.8 0.093 (0.3066) (0.1527) (-0.1539)
Return on Equity AT 9 0.1583 0.1176 -0.0407 0.66 0.52 (0.1886) (0.1243) (-0.0643) Efficiency
Sales Efficiency 9 642.7 1044 401.3 -2.89 0.011 (620) (981) (361)
Net income Efficiency 9 49.5 35.1 -14.4 0.6 0.56 (37.6) (52.4) (14.8) Investment
capital expenditure to sales 9 0.0677 0.1842 0.1165 -1.19 0.27 (0.032) (0.0582) (0.0262) capital expenditure to asset 9 0.0862 0.1119 0.0257 -0.48 0.64 (0.0364) (0.096) (0.0596)
OutputReal sales (sale/GDP deflator) 9 69963 74704 4741 -0.26 0.8 (67788) (66796) (-992)
Real sales (sale/CPI) 9 68224 70912 2688 -0.16 0.87 (69923) (74199) (4276) Employment
Total employment 9 988 713.8 -274.2 2.71 0.019 (892) (665) (-227) Leverage
Debt to asset 9 0.5583 0.5233 -0.035 0.54 0.6 (0.5025) (0.525) (0.0225) Dividend
Dividend to sales 9 0.00944 0.02141 0.01197 -1.19 0.25 (0) (0) (0) Proxy, the number of useable observations, the mean and median values of the proxy for the three-year periods prior and following to privatization, the mean and median change in the proxy’s value after versus before privatization, and a test of significance for the change in mean values. Table 11: Summary of Results from Tests of Predictions for the all Privatized Firms in Energy Sector
Variables N Mean Before
(Median)
Mean After
(Median)
Mean Change
(Median) T-test P-Value
Profitability
Return on Sales BT 12 0.1873 0.2146 0.0273 -0.34 0.74 (0.0843) (0.1336) (0.0493)
Return on Sales AT 12 0.1272 0.1638 0.0366 -0.63 0.54 (0.0734) (0.1077) (0.0343)
Return on Asset BT 12 0.1039 0.1248 0.363 -0.44 0.66 (0.0473) (0.069) (0.084)
Return on Asset AT 12 0.071 0.0885 0.0175 -0.51 0.62 (0.0389) (0.0532) (0.0143)
Return on Equity BT 12 0.3213 0.3667 0.0454 -0.48 0.64 (0.2383) (0.2924) (0.0541)
Return on Equity AT 12 0.2002 0.2434 0.0432 -0.68 0.51 (0.1345) (0.2562) (0.1217) Efficiency
Sales Efficiency 12 9438 20348 10910 -1.32 0.21 (2937) (7905) (4968)
Net income Efficiency 12 578 1448 870 -1.79 0.092 (271) (755) (484)
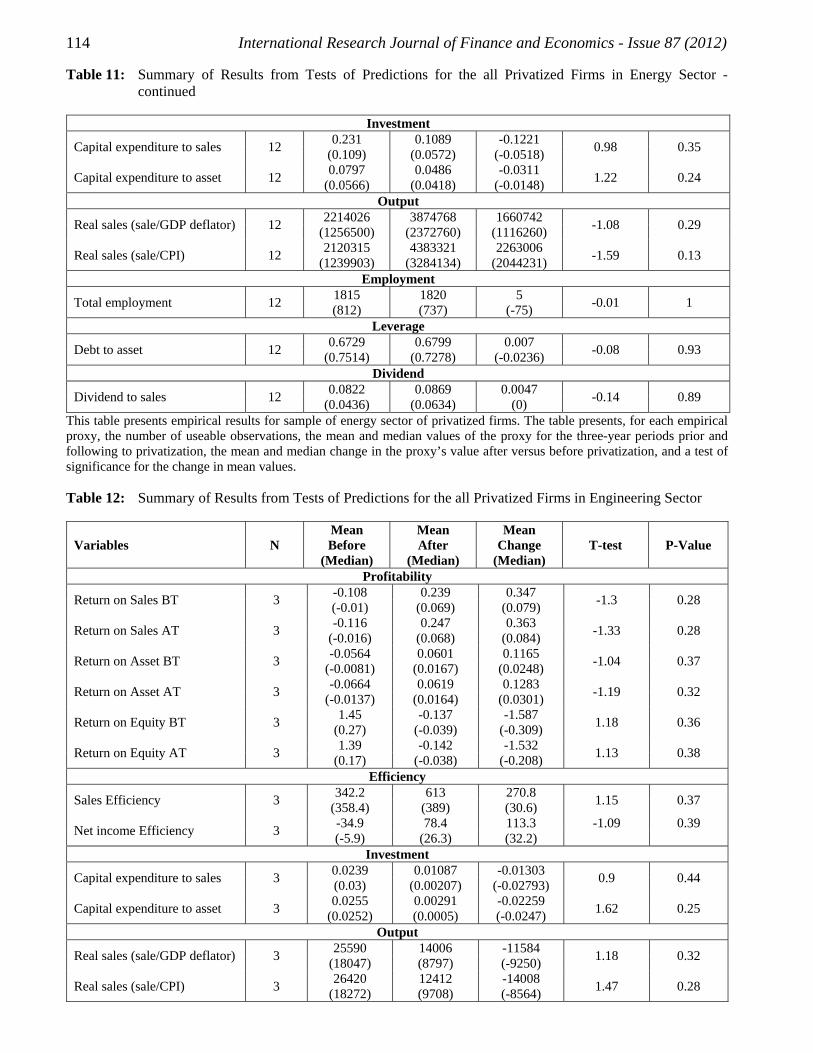
114 International Research Journal of Finance and Economics - Issue 87 (2012)
Table 11: Summary of Results from Tests of Predictions for the all Privatized Firms in Energy Sector - continued
Investment
Capital expenditure to sales 12 0.231 0.1089 -0.1221 0.98 0.35 (0.109) (0.0572) (-0.0518)
Capital expenditure to asset 12 0.0797 0.0486 -0.0311 1.22 0.24 (0.0566) (0.0418) (-0.0148) Output
Real sales (sale/GDP deflator) 12 2214026 3874768 1660742 -1.08 0.29 (1256500) (2372760) (1116260)
Real sales (sale/CPI) 12 2120315 4383321 2263006 -1.59 0.13 (1239903) (3284134) (2044231) Employment
Total employment 12 1815 1820 5 -0.01 1 (812) (737) (-75) Leverage
Debt to asset 12 0.6729 0.6799 0.007 -0.08 0.93 (0.7514) (0.7278) (-0.0236) Dividend
Dividend to sales 12 0.0822 0.0869 0.0047 -0.14 0.89 (0.0436) (0.0634) (0) This table presents empirical results for sample of energy sector of privatized firms. The table presents, for each empirical proxy, the number of useable observations, the mean and median values of the proxy for the three-year periods prior and following to privatization, the mean and median change in the proxy’s value after versus before privatization, and a test of significance for the change in mean values. Table 12: Summary of Results from Tests of Predictions for the all Privatized Firms in Engineering Sector
Variables N Mean Before
(Median)
Mean After
(Median)
Mean Change
(Median) T-test P-Value
Profitability
Return on Sales BT 3 -0.108 0.239 0.347 -1.3 0.28 (-0.01) (0.069) (0.079)
Return on Sales AT 3 -0.116 0.247 0.363 -1.33 0.28 (-0.016) (0.068) (0.084)
Return on Asset BT 3 -0.0564 0.0601 0.1165 -1.04 0.37 (-0.0081) (0.0167) (0.0248)
Return on Asset AT 3 -0.0664 0.0619 0.1283 -1.19 0.32 (-0.0137) (0.0164) (0.0301)
Return on Equity BT 3 1.45 -0.137 -1.587 1.18 0.36 (0.27) (-0.039) (-0.309)
Return on Equity AT 3 1.39 -0.142 -1.532 1.13 0.38 (0.17) (-0.038) (-0.208) Efficiency
Sales Efficiency 3 342.2 613 270.8 1.15 0.37 (358.4) (389) (30.6)
Net income Efficiency 3 -34.9 78.4 113.3 -1.09 0.39 (-5.9) (26.3) (32.2)
Investment
Capital expenditure to sales 3 0.0239 0.01087 -0.01303 0.9 0.44 (0.03) (0.00207) (-0.02793)
Capital expenditure to asset 3 0.0255 0.00291 -0.02259 1.62 0.25 (0.0252) (0.0005) (-0.0247) Output
Real sales (sale/GDP deflator) 3 25590 14006 -11584 1.18 0.32 (18047) (8797) (-9250)
Real sales (sale/CPI) 3 26420 12412 -14008 1.47 0.28 (18272) (9708) (-8564)
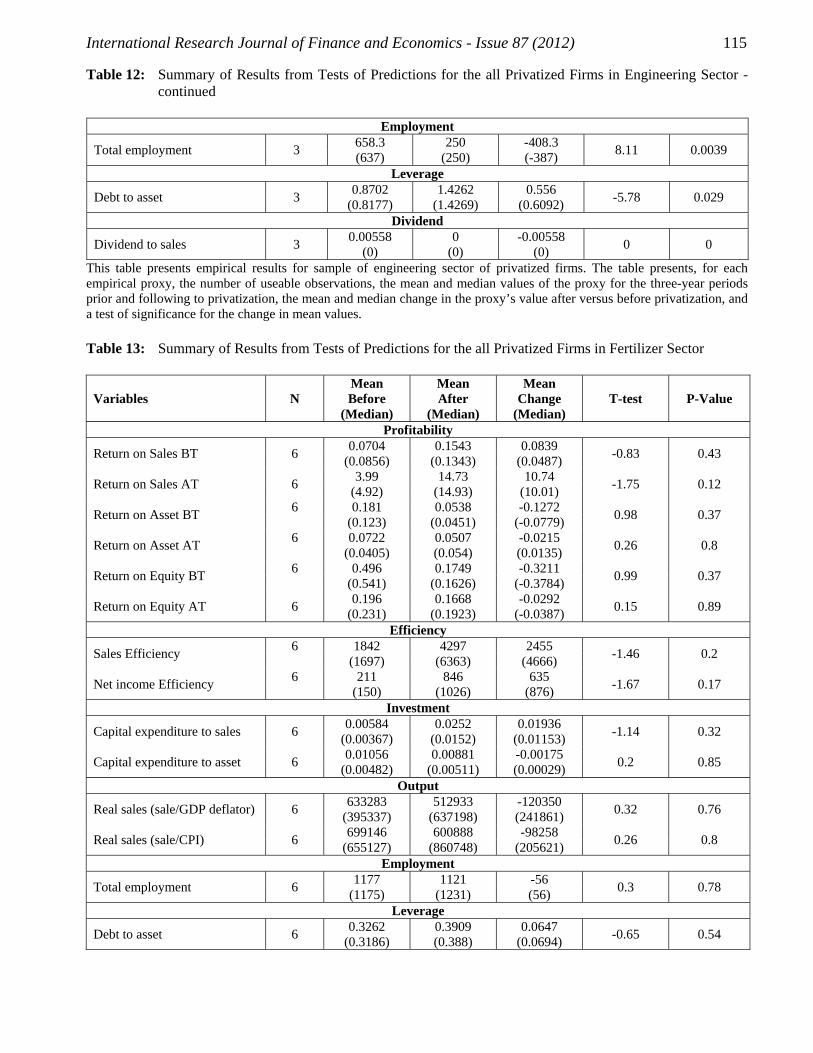
International Research Journal of Finance and Economics - Issue 87 (2012) 115
Table 12: Summary of Results from Tests of Predictions for the all Privatized Firms in Engineering Sector - continued
Employment
Total employment 3 658.3 250 -408.3 8.11 0.0039 (637) (250) (-387) Leverage
Debt to asset 3 0.8702 1.4262 0.556 -5.78 0.029 (0.8177) (1.4269) (0.6092) Dividend
Dividend to sales 3 0.00558 0 -0.00558 0 0 (0) (0) (0) This table presents empirical results for sample of engineering sector of privatized firms. The table presents, for each empirical proxy, the number of useable observations, the mean and median values of the proxy for the three-year periods prior and following to privatization, the mean and median change in the proxy’s value after versus before privatization, and a test of significance for the change in mean values. Table 13: Summary of Results from Tests of Predictions for the all Privatized Firms in Fertilizer Sector
Variables N Mean Before
(Median)
Mean After
(Median)
Mean Change
(Median) T-test P-Value
Profitability
Return on Sales BT 6 0.0704 0.1543 0.0839 -0.83 0.43 (0.0856) (0.1343) (0.0487)
Return on Sales AT 6 3.99 14.73 10.74 -1.75 0.12 (4.92) (14.93) (10.01)
Return on Asset BT 6 0.181 0.0538 -0.1272 0.98 0.37 (0.123) (0.0451) (-0.0779)
Return on Asset AT 6 0.0722 0.0507 -0.0215 0.26 0.8 (0.0405) (0.054) (0.0135)
Return on Equity BT 6 0.496 0.1749 -0.3211 0.99 0.37 (0.541) (0.1626) (-0.3784)
Return on Equity AT 6 0.196 0.1668 -0.0292 0.15 0.89 (0.231) (0.1923) (-0.0387) Efficiency
Sales Efficiency 6 1842 4297 2455 -1.46 0.2 (1697) (6363) (4666)
Net income Efficiency 6 211 846 635 -1.67 0.17 (150) (1026) (876) Investment
Capital expenditure to sales 6 0.00584 0.0252 0.01936 -1.14 0.32 (0.00367) (0.0152) (0.01153)
Capital expenditure to asset 6 0.01056 0.00881 -0.00175 0.2 0.85 (0.00482) (0.00511) (0.00029) Output
Real sales (sale/GDP deflator) 6 633283 512933 -120350 0.32 0.76 (395337) (637198) (241861)
Real sales (sale/CPI) 6 699146 600888 -98258 0.26 0.8 (655127) (860748) (205621) Employment
Total employment 6 1177 1121 -56 0.3 0.78 (1175) (1231) (56) Leverage
Debt to asset 6 0.3262 0.3909 0.0647 -0.65 0.54 (0.3186) (0.388) (0.0694)
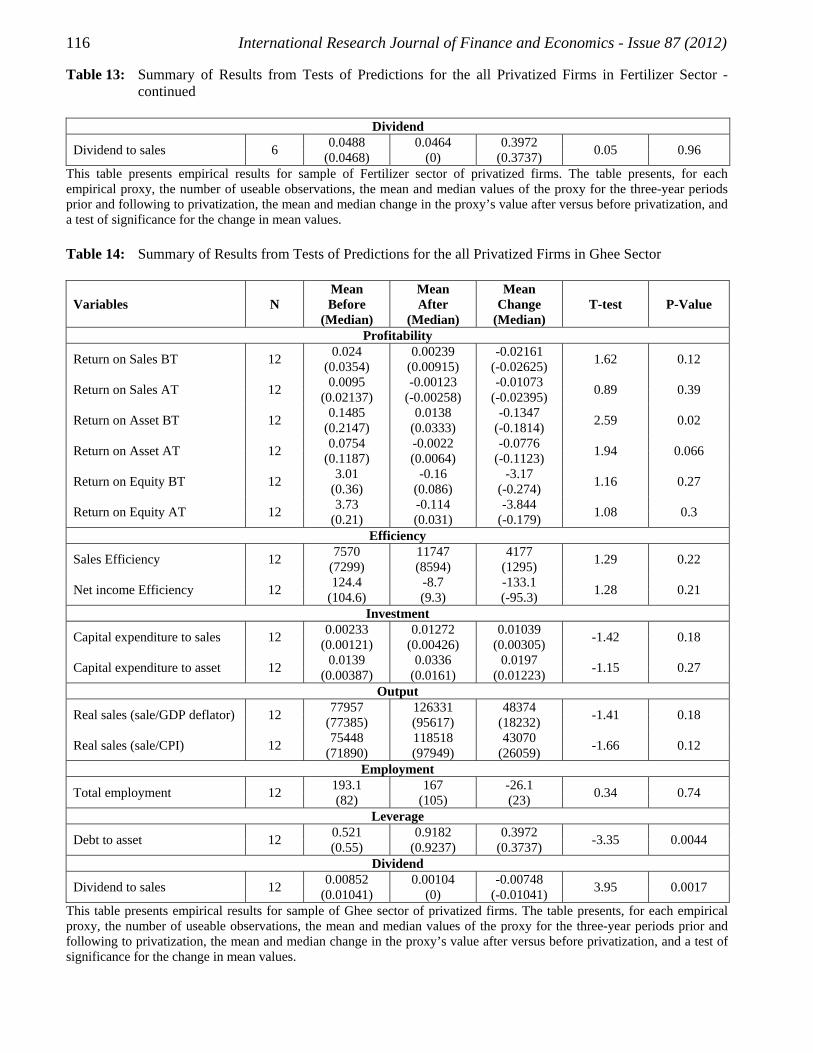
116 International Research Journal of Finance and Economics - Issue 87 (2012)
Table 13: Summary of Results from Tests of Predictions for the all Privatized Firms in Fertilizer Sector - continued
Dividend
Dividend to sales 6 0.0488 0.0464 0.3972 0.05 0.96 (0.0468) (0) (0.3737) This table presents empirical results for sample of Fertilizer sector of privatized firms. The table presents, for each empirical proxy, the number of useable observations, the mean and median values of the proxy for the three-year periods prior and following to privatization, the mean and median change in the proxy’s value after versus before privatization, and a test of significance for the change in mean values. Table 14: Summary of Results from Tests of Predictions for the all Privatized Firms in Ghee Sector
Variables N Mean Before
(Median)
Mean After
(Median)
Mean Change
(Median) T-test P-Value
Profitability
Return on Sales BT 12 0.024 0.00239 -0.02161 1.62 0.12 (0.0354) (0.00915) (-0.02625)
Return on Sales AT 12 0.0095 -0.00123 -0.01073 0.89 0.39 (0.02137) (-0.00258) (-0.02395)
Return on Asset BT 12 0.1485 0.0138 -0.1347 2.59 0.02 (0.2147) (0.0333) (-0.1814)
Return on Asset AT 12 0.0754 -0.0022 -0.0776 1.94 0.066 (0.1187) (0.0064) (-0.1123)
Return on Equity BT 12 3.01 -0.16 -3.17 1.16 0.27 (0.36) (0.086) (-0.274)
Return on Equity AT 12 3.73 -0.114 -3.844 1.08 0.3 (0.21) (0.031) (-0.179) Efficiency
Sales Efficiency 12 7570 11747 4177 1.29 0.22 (7299) (8594) (1295)
Net income Efficiency 12 124.4 -8.7 -133.1 1.28 0.21 (104.6) (9.3) (-95.3) Investment
Capital expenditure to sales 12 0.00233 0.01272 0.01039 -1.42 0.18 (0.00121) (0.00426) (0.00305)
Capital expenditure to asset 12 0.0139 0.0336 0.0197 -1.15 0.27 (0.00387) (0.0161) (0.01223) Output
Real sales (sale/GDP deflator) 12 77957 126331 48374 -1.41 0.18 (77385) (95617) (18232)
Real sales (sale/CPI) 12 75448 118518 43070 -1.66 0.12 (71890) (97949) (26059) Employment
Total employment 12 193.1 167 -26.1 0.34 0.74 (82) (105) (23) Leverage
Debt to asset 12 0.521 0.9182 0.3972 -3.35 0.0044 (0.55) (0.9237) (0.3737) Dividend
Dividend to sales 12 0.00852 0.00104 -0.00748 3.95 0.0017 (0.01041) (0) (-0.01041) This table presents empirical results for sample of Ghee sector of privatized firms. The table presents, for each empirical proxy, the number of useable observations, the mean and median values of the proxy for the three-year periods prior and following to privatization, the mean and median change in the proxy’s value after versus before privatization, and a test of significance for the change in mean values.