Embed Size (px)
Citation preview
Non-RF To RF Test Correlation Using Learning Machines: A Case Study
Haralampos-G. D. Stratigopoulos*, Petros ~ r i n e a s t , Mustapha slamanit and Yiorgos ~ a k r i s s *TIMA Laboratory, 46 Av. Fklix Viallet, 38031 Grenoble, France
t ~ e ~ a r t r n e n t of Computer Science, Rensselaer Polytechnic Institute, Lally Hall, 110 8th Street, NY 12180, USA ~ I B M , Wireless Test Development Group, 1000 River Street 863G. Essex Junction, VT 05452, USA
S ~ e ~ a r t m e n t of Electrical Engineering, Yale University, 51 Prospect Street, New Haven, CT 06520, USA
AbshrccCWe present a case study that employs production test data from an RF device to assess the effectiveness of four different methods in predicting the padfail labels of fabricated devices based on a subset of performances and, thereby, in decreasing test cost. The device employed is a zero-IF down- converter for cell-phone applications and the four methods range from a simple maximum-cover algorithm to an advanced ontogenic neural network. The results indicate that a subset of non-RF performances suffice to predict correctly the passffail label for the vast majority of the devices and that the addition of a few select RF performances holds great potential for reducing misprediction to industrially acceptable levels. Based on these results, we then discuss enhancements and experiments that will further corroborate the utility of these methods within the cost realities of analog/RF production testing.
Specification testing, wherein the performances of the de- vice are verified against the specification limits, still remains the only acceptable industrial practice for analoglRF devices. Yet the high cost of RF ATE and the lengthy test times involved have resulted in intensified efforts and interest in reducing the number and types of performances that are examined during production testing. A plausible direction towards decreasing cost, akin to test compaction practices in digital circuits, is to identify and eliminate information redundancy in the set of performances, thereby relying only on a subset of them in order to reach a passffail decision. Such redundancy is likely to exist since groups of performances refer to the same portion of the chip and are subject to similar process imperfections. Since it is not possible to express the relationship between performances in closed-form functions, the idea of identifying information redundancy through the specification test data logs has been pitched. Yet it is highly unlikely that such redundancy will manifest itself in a coarse and easily observable form of superfiuous performances that can be summarily discarded. Instead, more advanced statistical analysis methods are likely to be required. In essence, these methods should entail two components, namely a selection algorithm for searching in the power-set of performances for a discriminative low-cost subset and a prediction model for making passffail decisions based solely on this subset.
In this paper, we present the results of a case study that examines the effectiveness of four such methods using produc- tion test data from an RF device. These four methods are listed in Table I. In the MAX-COVER formulation the prediction model is trivialized, i.e. passffail decision is reached by simply
25th IEEE VLSl Test Symmposium (VTS'07) 0-7695-2812-0107 $20.00 O 2007 IEEE
comparing the selected performances to their specifications and ignoring the missing ones. This simplistic approach serves mainly as a basis for comparison. In contrast, the other three methods implement class$ers that learn to map the selected set of performances directly to a passlfail decision, thereby implicitly predicting conformance of the eliminated performances to the specifications. NN and LDA are standard machine learning approaches, while ONN can learn complex non-linear mappings. Using these four methods, we are inter- ested in exploring the following two questions: . How well can the passffail decision of the RF device
be predicted through models constructed based solely on a select set of non-RF performances (i.e. digital, DC and low frequency)? The motivation for this question is the fact that by only relying on non-RF performances, the need for RF ATE is eliminated, thereby drastically reducing test cost. How does the prediction accuracy improve by selectively adding a few RF performances to the best non-RF perfor- mance subsets? The motivation for this question is that even if the cost of an RF tester cannot be completely eliminated, it may still be possible to decrease the time that each device spends on it and, by extension, the over- all test cost, by reducing the number of RF performances that are explicitly tested.
The main conjecture drawn from this case study is that the machine learning approach to the specification test compaction problem shows great promise for reducing test cost. Indeed, a relatively small number of only non-RF performances are shown to suffice for predicting correctly the passffail decision of a very large percentage of devices (around 99% in our case study). Moreover, the addition of few RF performances, ameliorates this small prediction inaccuracy and results in very powerful prediction models, which enable test cost re- duction while maintaining industrially acceptable test quality
TABLE I
LEARNING METHODS EMPLOYED IN THIS CASE STUDY.
Method 11 Selection algorithm I Prediction model
MAX-COVER 11 MAX-COVER formulation I Trivial NN+QR 11 Q R decomposiuon I Nearest Ne~ghbors
Lincar Discriminant U M + Q R 11 Q R decomposition I Analvsis
Ontogenic Neural ONN+GA 11 Gcnctic Algorithm
Nawork

standards. The results of this case study also make evident that the more elaborate ONN+GA method outperforms the simpler MAX-COVER, NN+QR and LDA+QR methods; this eludes to the fact that the correlations between the kept and discarded performances are indeed intricate and justifies the use of advanced machine learning methods. While we acknowledge that the questions explored through this case study reflect a simplified model of test economics, they still reveal the underlying potential of machine learning-based analoglRF specification test compaction methods to reduce test cost. Thus, they encourage further experimentation and assessment of our methods using larger data sets and more complex cost models that reflect more accurately the realities of a production test environment
In the linear error-mechanism model algorithm (LEMMA) [I], it is assumed that a model y = Ax is available [2], where y is the m x 1 measurement error vector, x is a n x 1 circuit parameter error vector, A is a m x n sensitivity matrix, and nz corresponds to the number of measurements required for an exhaustive test of performances. The method aims to predict the complete vector y by carrying out only a subset 0. The cardinality p of 0 0, 2 n) is a compromise between the permitted measurement cost and the maximum tolerable prediction error. The selection process is performed through Q R factorization [3] and minimizes the prediction variance. In 141, an iterative selection approach is followed, which considers subsets rather than individual measurements. Next, the complete measurement vector is predicted by y =
d ( A T A ) ~ ' d T ~ , where d is the p x n reduced matrix A. A leisurely look at this approach and some refinements are provided in [5]. The LEMMA method has the following limi- tations: (a) it relies on a linear model to predict the behavior of a non-linear system, (b) the linear model is developed through simulation and (c) it requires error mechanism models that are difficult to specify for complex circuits.
In [6], a fault-driven test selection approach is proposed. The set of performances to be explicitly tested is cumulatively built by adding to the current set the performance p, for which the yield of the set {P - P - p i } is maximized, where P and P denote the current and the complete set of performances, respectively. The algorithm terminates when the desired fault coverage is reached. In [7], in addition to fault coverage, the selection is also driven by the degree to which faults are exposed. The disadvantage of these approaches is their dependence on fault models, which are incomplete and, thus may result in inadvertent yield loss and test escapes.
In 181, a data set is generated by measuring explicitly all performances for a representative set of devices. Here, it is not required to adopt a fault model since it is assumed that this set of devices reflects accurately the statistical mechanisms of the manufacturing process. Once a suitable subset of performances that need to be explicitly tested is identified, regression models are constructed for the untested performances using the data
25th IEEE VLSl Test Symmposium (VTS'07) 0-7695-2812-0107 $20.00 O 2007 IEEE
set and test limits are assigned to the tested performances such that they guarantee the compliance of the untested performances to the specifications with the desired confidence levels. The authors, however, do not show how to select the subset of independent performances, and, moreover, do not show how to explore efficiently the trade-off between the number of independent performances and yield loss.
In [9], the compaction problem is viewed as a binary passlfail classification problem. Similarly to 181, the method begins with generating a data set by measuring all perfor- mances for a set of devices. Then, starting with the complete set of performances, P = {pl :m, ...: ph,), one performance p, is selected at each step for possible removal. The training data corresponding to the set { P - p,}, where P denotes the current set of performances, is used to train a support vector machine (SVM) for predicting passlfail only by processing the values of performances in { P - p, ) . If the prediction error is smaller than a user define threshold, E,, then p, is considered redundant and is permanently excluded. This selection proce- dure is greedy since the result depends on the order in which performances are examined. In practice it is advantageous to consider subsets of performances since combinations of performances can provide significant information which is not available in any of the individual performances separately. The method is assessed on an operational amplifier and a MEMS accelerometer using simulation data.
Our case study vehicle is a zero-IF down-converter for cell- phone applications that is designed in RFCMOS technology, fabricated at IBM, and currently running in production. The input is an RF signal and the output is an IQ baseband signal. In addition, the device has an integrated VCO, a baseband filter and a DC nulling DAC. The LNA output is connected to the mixer input using an external SAW filter. This device is characterized by 136 performances, 65 of which are non-RF and 71 are RF. The data set contains the measured perfor- mances for 944 devices. These performance values, combined with the specification limits promised in the data sheet, are used to assign to each device a status bit denoting whether it is functional or faulty. Overall, the data set contains 73 faulty and 871 functional devices.
Preprocessing: Let A be the 944 x (65 + 71) matrix con- taining the given data. The performances have typical values which differ significantly. In order to avert skewing of the distance between two devices in the performance space, each column of A is individually normalized. More specifically, each column of A is divided by the maximal entry, in absolute value, in this column. This procedure scales all data in the range [- 1 , 11. Then, the columns of A are mean-centered by subtracting from every entry in each column the mean of the column elements. Formally, let .4ij denote the (i, j)-th entry in A, and let A(j) denote the j-th column of -4. Scaling the data amounts to getting a new matrix A' whose entries are
COMPUTER SOCIETY
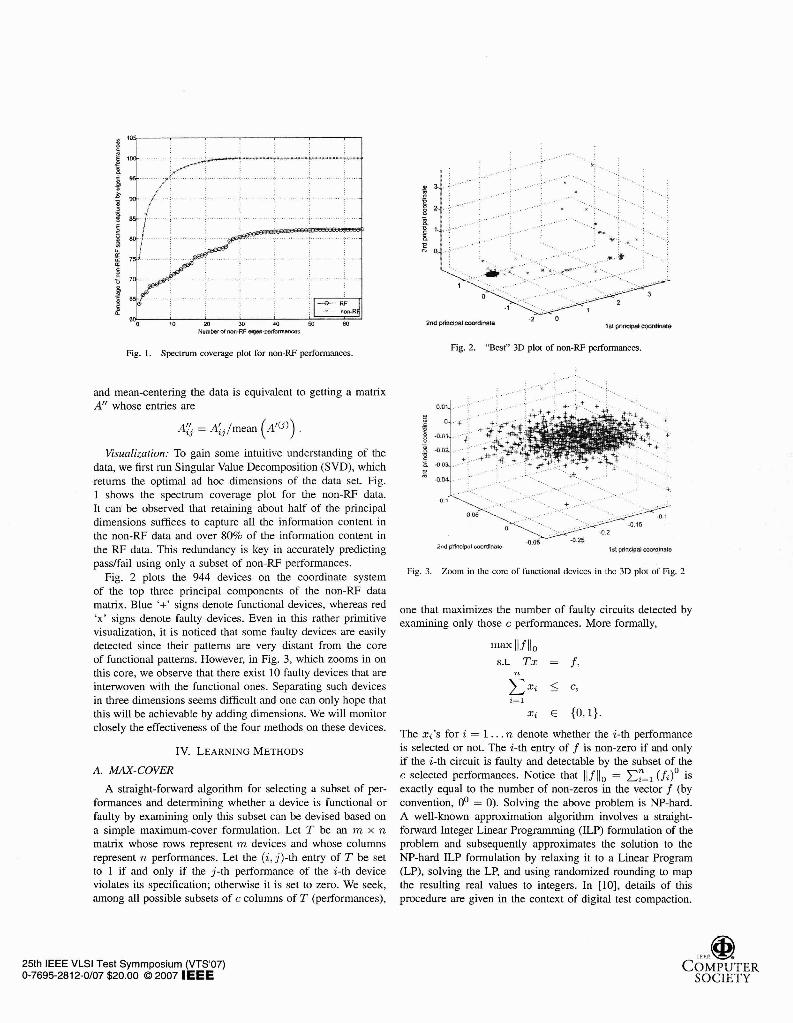
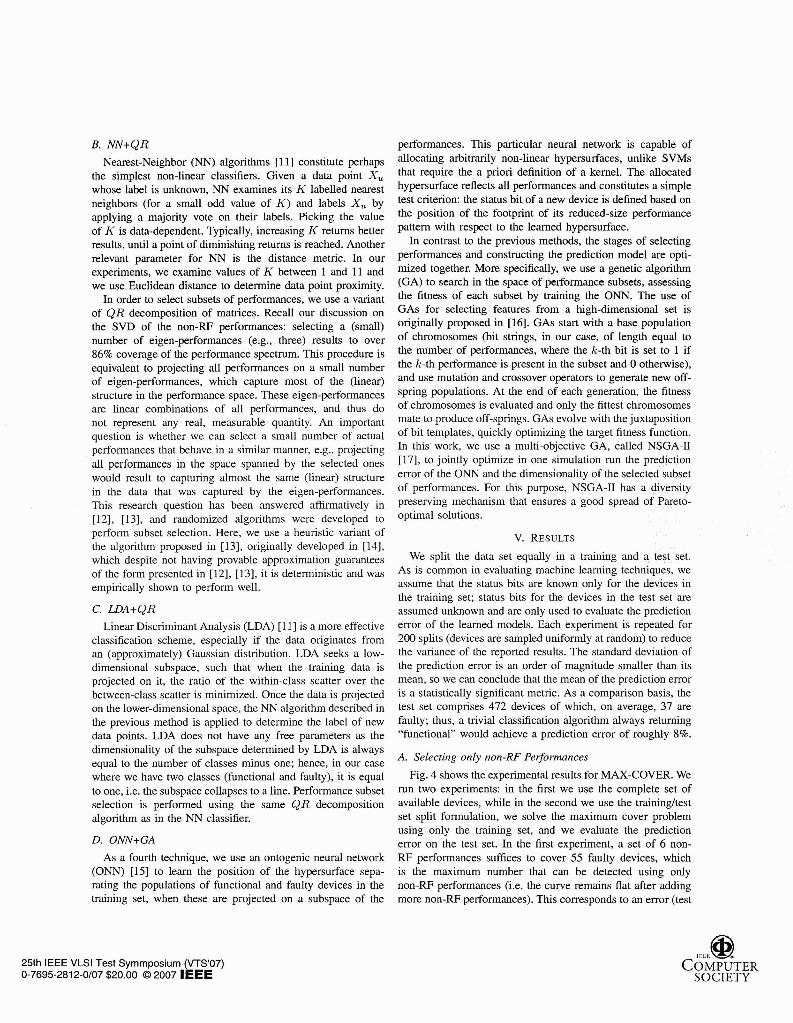
Fig. 1. Spectrum coverage plot for non-RF performances. Fig. 2. "Bcst" 3D plot of non-RF pcrformanccs.
and mean-centering the data is equivalent to getting a matrix A" whose entries are +
A + +$ +
+ 4- Visualization: To gain some intuitive understanding of the
data, we first run Singular Value Decomposition (SVD), wh~ch '5
returns the optimal ad hoc dimensions of the data set. Fig. 1 shows the spectrum coverage plot for the non-RF data.
+
It can be observed that retaming about half of the principal +
dimensions suffices to capture all the informahon content in /z
0 U - G 4 15 the non-RF data and over 80% of the information content in -0.25
the RF data. This redundancy is key in accurately predicting 21~l prrnceal mr)tntue 05 l e l principnl mmHna(e
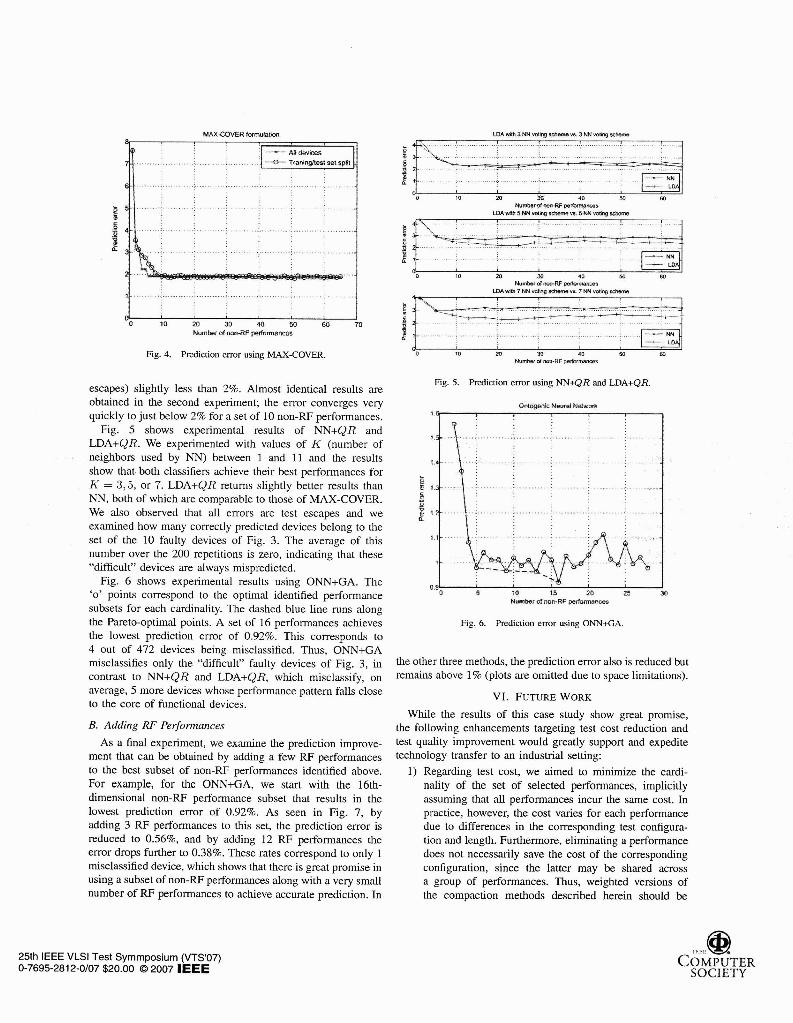
passlfail using only a subset of non-RF performances. Fig. 3. Zoom m thc corc of functional dcvlccs in thc 3D plot of Fig. 2
Fig. 2 plots the 944 devices on the coordinate system of the top three principal components of the non-RF data matrix. Blue '+' signs denote functional devices, whereas red one that maximizes the number of faulty circuits detected by 'x' signs denote faulty devices. Even in this rather primitive examining only those performances. More formally, visualization, it is noticed that some faulty devices are easily detected since their patterns are very distant from the core of functional patterns. However, in Fig. 3, which zooms in on this core, we observe that there exist 10 faulty devices that are interwoven with the functional ones. Separating such devices in three dimensions seems difficult and one can only hope that this will be achievable by adding dimensions. We will monitor closely the effectiveness of the four methods on these devices.
A. MAX-COVER
A straight-forward algorithm for selecting a subset of per- formances and determining whether a device is functional or faulty by examining only this subset can be devised based on a simple maxirnum-cover formulation. Let T be an m x n matrix whose rows represent m devices and whose columns represent n performances. Let the (i, j)-th entry of T be set to 1 if and only if the j-th performance of the i-th device violates its specification; otherwise it is set to zero. We seek, among all possible subsets of c columns of T (performances),
max llf llo s.t. T x = f:
The xi's for i = 1 . . . n denote whether the i-th performance is selected or not. The i-th entry of f is non-zero if and only if the i-th circuit is faulty and detectable by the subset of the c selected performances. Notice that 11 f l l o = x:=l (fi)' is exactly equal to the number of non-zeros in the vector f (by convention, 0' = 0). Solving the above problem is NP-hard. A well-known approximation algorithm involves a straight- forward Integer Linear Programming (ILP) formulation of the problem and subsequently approximates the solution to the NP-hard ILP formulation by relaxing it to a Linear Program (LP), solving the LP, and using randomized rounding to map the resulting real values to integers. In [lo], details of this procedure are given in the context of digital test compaction.
25th IEEE VLSl Test Symmposium (VTS'07) 0-7695-2812-0107 $20.00 0 2007 IEEE C O ~ P U T E R
SOCIETY
B. NN+QR performances. This particular neural network is capable of
~ ~ ~ ~ ~ ~ - ~ ~ i ~ h b ~ ~ (NN) algorithms [111 perhaps allocating arbitrarily non-linear hypersurfaces, unlike SVMs
the simplest non-linear classifiers. ~i~~~ a data point xu that require the a priori definition of a kernel. The allocated whose label is unknown, NN examines its K labelled nearest hypersurface reflects all performances and constitutes a simple neighbors (for a small odd value of K) and labels xu by test criterion: the status bit of a new device is defined based on
applying a majority vote on their labels. picking the value the position of the footprint of its reduced-size performance
of K is data-dependent. Typically, increasing K returns better pattern with respect the learned
results, until a point of diminishing returns is reached. Another In to the previous the stages
relevant for NN is the distance metric. our performances and constructing the prediction model are opti- experiments, we examine values of K between 1 and 11 and mized together. More specifically, we use a genetic algorithm we use Euclidean distance to determine data point proximity. (GA) to search in the space of performance subsets, assessing
In order to select subsets of performances, we use a variant the fitness each subset by training the ONN. The use of of QR decomposition of matrices. ~ ~ ~ ~ l l our discussion on GAS for selecting features from a high-dimensional set is the SVD of the non-RF performances: selecting a (small) originally proposed in [16]. GAS start with a base population number of eigen-performances (e.g., three) results to over of chromosomes (bit strings, in our case, of length equal to 86% covenge of the performance spectrum. l-his procedure is the number of performances, where the k-th bit is Set to 1 if equivalent to projecting all performances on a small number the k-th performance is present in the subset and 0 othemise), of eigen-performances, capture most of the (linear) and use mutation and crossover operators to generate new off- structure in the performance space. These eigen-performances spring populations. At the end of each generation, the fitness are linear of all performances, thus do of chromosomes is evaluated and only the fittest chromosomes not represent any real, measurable quanhty. An important "late Lo produce off-springs. GAS evolve with the juxlaposiLion question is whether we can select a small number of actual of bit templates, quickly optimizing the t?Kget fitness function.
perfommces that behave in a similar manner, e.g., projecting In this work, we use a multi-objective GA, called NSGA-11
d l performances in the space spanned by the selected ones [171, to jointly optimize in one simulation run the s re diction would result to capturing almost the same (linear) structure error of the ONN and the dimensionality of the selected subset
in the data that was captured by the eigen-performances. of performances. For this purpose, NSGA-11 has a diversity hi^ research question has been answered in preserving mechanism that ensures a good spread of Pareto-
[12], [13], and randomized algorithms were developed to perform subset selection. Here, we use a heuristic variant of V. RESULTS the algorithnl proposed in [13], orig~nally developed in [14], which despite not having provable approximation guarantees We split the data set equally in a training and a test set.
of the form presented in ~121, [131, it is deterministic and was AS is common in evaluating machine learning techniques, we
empirically shown to perform well. assume that the status bits are known only for the devices in the training set; status bits for the devices in the test set are
C. LDA+QR assumed unknown and are only used to evaluate the prediction Linear Discriminant Analysis (LDA) [I]] is a more effective error of the learned models. Each experiment is repeated for
classification scheme, especially if the data originates from 200 splits (devices are sampled uniformly at random) to reduce an (approximately) Gaussian distribution. LDA seeks a low- the variance of the reported results. The standard deviation of dimensional subspace, such that when the training data is the prediction error is an order of magnitude smaller than its projected on it, the ratio of the within-class scatter over the mean, so we can conclude that the mean of the prediction error between-class scatter is minimized. Once the data is projected is a statistically significant metric. As a comparison basis, the on the lower-dimensional space, the NN algorithm described in test set comprises 472 devices of which, on avenge, 37 are the previous method is applied to determine the label of new faulty; thus, a trivial classification algorithm always returning data points. LDA does not have any free parameters as the "functional" would achieve a prediction error of roughly 8%. dimensionality of the subspace determined by LDA is always
A. Selecting only non-RF Pe~omzances equal to the number of classes minus one; hence, in our case where we have two classes (functional and faulty), it is equal Fig. 4 shows the experimental results for MAX-COVER. We to one, i.e. the subspace collapses to a line. Performance subset run two experiments: in the first we use the complete Set of selection is performed using the same QR decomposition available devices, while in the second we use the trainingltest algorithm as in the NN classifier. set split formulation, we solve the maximum cover problem
using only the training set, and we evaluate the prediction D. ONN+GA error on the test set. In the first experiment, a set of 6 non-
As a fourth technique, we use an ontogenic neural network RF performance~ suffices to cover 55 faulty devices, which (ONN) [15] to learn the position of the hypersurface sepa- is the maximum number that can be detected using only rating the populations of functional and faulty devices in the non-RF performances (i.e. the curve remains flat after adding training set, when these are projected on a subspace of the more non-RF performances). This corresponds to an error (test
25th IEEE VLSl Test Symmposium (VTS'07) 0-7695-281 2-0107 520.00 O 2007 IEEE
Q COMPUTER
SOCIETY
MAXCOVER formulabon
Fig. 4. Prediction crror using MAX-COVER.
escapes) slightly less than 2%. Almost identical results are obtained in the second experiment; the error converges very quickly to just below 2% for a set of 10 non-RF performances.
Fig. 5 shows experimental results of NN+QR and LDA+QR. We experimented with values of K (number of neighbors used by NN) between 1 and 11 and the results show that both classifiers achieve their best performances for K = 3,5, or 7. LDA+QR returns slightly better results than NN, both of which are comparable to those of MAX-COVER. We also observed that all errors are test escapes and we examined how many correctly predicted devices belong to the set of the 10 faulty devices of Fig. 3. The average of this number over the 200 repetitions is zero, indicating that these "difficult" devices are always mispredicted.
Fig. 6 shows experimental results using ONN+GA. The '0' points correspond to the optimal identified performance subsets for each cardinality. The dashed blue line runs along the Pareto-optimal points. A set of 16 performances achieves the lowest prediction error of 0.92%. This corresponds to 4 out of 472 devices being misclassified. Thus, ONN+GA misclassifies only the "difficult" faulty devices of Fig. 3, in contrast to NN+QR and LDA+QR, which misclassify, on average, 5 more devices whose performance pattern falls close to the core of functional devices.
B. Adding RF Perfomnces
As a final experiment, we examine the prediction improve- ment that can be obtained by adding a few RF performances to the best subset of non-RF performances identified above. For example, for the ONN+GA, we start with the 16th- dimensional non-RF performance subset that results in the lowest prediction error of 0.92%. As seen in Fig. 7, by adding 3 RF performances to this set, the prediction error is reduced to 0.56%, and by adding 12 RF performances the error drops further to 0.38%. These rates correspond to only 1 misclassified device, which shows that there is great promise in using a subset of non-RF performances along with a very small number of RF performances to achieve accurate prediction. In
Number of m R F w-s L D A v u i h S N N ~ ~ u s SN+iro(iw.eheme
z 4F\ -I
Fig. 5. Prediction crror using NN+QR and LDA+QR.
Fig. 6. Prediction error using ONN+GA.
the other three methods, the prediction error also is reduced but remains above I% (plots are omitted due to space limitations).
VI. FUTURE WORK
While the results of this case study show great promise, the following enhancements targeting test cost reduction and test quality improvement would greatly support and expedite technology transfer to an industrial setting:
1) Regarding test cost, we aimed to minimize the cardi- nality of the set of selected performances, implicitly assuming that all performances incur the same cost. In practice, however, the cost varies for each performance due to differences in the corresponding test configura- tion and length. Furthermore, eliminating a performance does not necessarily save the cost of the corresponding configuration, since the latter may be shared across a group of performances. Thus, weighted versions of the compaction methods described herein should be
25th IEEE VLSl Test Symmposium (VTS'07) 0-7695-2812-0/07 $20.00 O 2007 IEEE
I
C ~ M P U T E R SOCIETY

Ontogerte Neural Net& vnth 16 nar-RF perf narkable nu&ro(RF psrt
. %.. .
2 4 8 8 10 12 1 1 $6 39 20 22 Number of RF p3rbnnaness
Fig. 7. Prediction emr using ONN+GA when adding RF performances to the best identified non-RF performance subset.
explored, aiming to optimize a more complex function that better reflects the actual test cost.
2) Regarding test quality, the statistical nature of this spec- ification test compaction approach entails a prediction error which, albeit small, may nevertheless be pro- hibitive for industrial standards, especially if it amounts to mostly test escapes. Thus, the use of some form of guard-banding [9], [18] should be explored, in order to deal with the devices that are prone to rnisprediction.
3) While prediction models are currently constructed using performances as inputs, greater prediction accuracy and elimination of more performances may be achievable by using, instead, the actual measurements obtained for computing the performances. In this case, further fine- grained cost reductions may be possible by eliminating individual measurements.
We also point out that the data set in this case study is fairly small and cannot provide a definitive answer as to whether the misprediction error really reflects a percentage (0.38%) due to underlying trends in the nominal and faulty distributions or whether it is an artifact of the data set and essentially reflects a constant (1 device) due to a peculiar outlier. Therefore, a continuation of this case study using many more devices and incorporating the above enhancements is currently under way.
VII. CONCLUSIONS
Analysis of production test data from an RF device reveals that performances comprise significant redundancy, which can be exploited to build prediction models for reaching passlfail decisions based on a reduced-size set of performances. To this end, advanced machine learning and performance selection techniques, such as ONN+GA, achieve excellent results and demonstrate great potential for reducing test cost through spec- ification test compaction. Further enhancements and evaluation of these methods on larger data sets is expected to confirm our findings and shape more research at the intersection of machine learning and analoglRF circuit testing.
25th IEEE VLSI Test Symmposium (VTS'07) 0-7695-2812-0107 $20.00 O 2007 IEEE
[I] T. M. Souders and G. N. Stenbakken, "A comprehensive approach for modeling and testing analog and mixed-signal devices:' in IEEE International Test Confercncc, 1990, pp. 169- 176.
[2] G. N. Stenbakken and T. M. Souders, "Developing linear error models for analog devices:' IEEE Transactions on Instnimen- ration and Measurement, vol. 43, no. 2, pp. 157-163, 1994.
[3] G. N. Stenbakken and T. M. Souders, ''Test-point selection and testability measures via QR factorration of linear models," IEEE Transactions on Instrumentation and Measurement, vol. W1-36, no. 2, pp. 406410, 1987.
[4] J. Van Spaandonk and T. A. M. Kevenaar, 'Iterative test-point selection for analog circuits:' in IEEE VLSl Test Symposium, 1996, pp. 66-71.
[5] A. Wrixon and M. P. Kennedy, "A rigorous exposition of the LEMMA method for analog and mixed-signal testing," IEEE Transactions on Instrumentation and Measurement, vol. 48, no. 5, pp. 97g985, 1999.
[6] L. Milor and A. L. Sangiovanni-Vincentelli, "Minimizing production test time to detect faults in analog circuits," IEEE Transactions on Computer-Aided Design of Integrated Circuits and Systems, vol. 13, no. 6, pp. 796-813, 1994.
[7] G. Devarayanadurg, M. Soma, P. Goteti, and S. D. Huynh, "Test set selection for structural faults in analog IC's," IEEE Transactions on Computer-Aided Design of Integrated Circuits and Systems, Vol. 18, no. 7, pp. 102€+1039, 1999.
[8] J. B. Brockman and S. W. Director, "Predictive subset testing: Optimizing 1C parametric performance testing for quality, cost, and yield," IEEE Transactions on Semiconductor Manufactur- ing, vol. 2, no. 3, pp. 1W113, 1989.
[9] S. Bi'swas, P. Li, R. D. (Shawn) Blanton, and L. Pileggi, "Specification test compaction for analog circuits and MEMS," in Design, Alctomation and Test in Europe, 2005, pp. 164-169.
[lo] P. Drineas and Y. Makris, "Independent test sequence com- paction through integer programming," in IEEE International Conference on Computer Design, 2003, pp. 38S386.
[ l l ] T. Hastie, R. Tibshirani, and J. Friedman, The Elements of Statistical Learning: Data Mining , Inference, and Prediction, Springer, 2001.
[12] P. Drineas, M. W. Mahoney, and S. Muthukrishnan, "Subspace sampling and relative-error matrix approximation: Column-row- based methods," in European Symposium on Algoritltms, 2006, pp. 304-314.
[13] P. Drineas, M. W. Mahoney, and S. Muthukrishnan, "Subspace sampling and relative-error matrix approximation: Column- based methods," in APPROX-RANDOM, 2006, pp. 316-326.
[14] M.W. Berry, S.A. Pulatova, and G.W. Stewart, "Computing sparse reduced-rank approximations to sparse matrices," Tech. Rep. UMlACS TR-2004-32 CMSC TR-4589, University of Maryland, College Park, MD, 2004.
[15] H.-G. D. Stratigopoulos and Y. Makris, "Constructive deriva- tion of analog specification test criteria," in IEEE V U I Test Symposium, 2005, pp. 395-400.
[16] W. Siedlecki and J. Sklansky, "A note on genetic algorithms for large-scale feature selection," Pattern Recognition Letters, vol. 10, pp. 335-347, 1989.
[17] K. Deb, A. Pratap, A. Agarwal, and T. Meyarivan, "A fast and elitist multiobjective genetic algorithm: NSGA-Il," IEEE Transactions on Evolutiona~~ Computation, vol. 6, no. 2, pp. 182-197, 2002.
[IS] H.-G. D. Stratigopoulos and Y. Makris, "Bridging the accuracy of functional and machine-learning-based mixed-signal testing," in IEEE VLSI Test S)~mposium, 2006, pp. 406-41 1.
Q COMPUTER
SOCIETY


![,r 1 ll~Cj...,r 1 ]Lll-ll~Cj I 11 . ,. ONTWERP TRACEBESLUIT I I HAZELDONKSESTRAAT 11 r HOGESNELHEIDSLIJN -ZUID 11 I I I I I I Verkeersveiligheidstoets Mei 2000 I ( I I I Ir …](https://img.pdfslide.net/doc/110x75/5ff9c9f23423653617488aaa/r-1-llcj-r-1-lll-llcj-i-11-ontwerp-tracebesluit-i-i-hazeldonksestraat.jpg)