Embed Size (px)
Citation preview
MSCI World
-0.1%
MSCI EM
-4.3%
EUR Gov.
0.6%
US Gov.
0.1%
UK Gilt
-2.1%S&P 500
1.5%
Dow Jones
0.3%
Nasdaq 100
3.5%
EUR IG Corp.
-0.2%
USD IG Corp.
-0.1%
UK IG Corp
-0.4%Euro Stoxx 50
-3.6%
FTSE 100
-3.6%
DAX
-4.0%
EUR HY
-0.8%
USD HY
-0.3%CAC 40
-3.8%
FTSE MIB
-4.1%
IBEX 35
-2.9%
CoCos
-2.0%Nikkei
-1.8%
Hang Seng
-3.2%
CSI 300
-2.0%DXY
1.0%
USD/EUR
1.0%
USD/JPY
0.5%Quality
1.0%
Momentum
0.8%
Min Vol
-0.3%
EUR/USD
-1.0%
EUR/GBP
0.3%
EUR/JPY
-0.6%Value
-2.5%
High Div
-2.3%
Size
-0.2%
GBP/USD
-1.2%
GBP/EUR
-0.3%CHF/USD
-0.8%
CHF/EUR
0.2%BCOM
0.8%
3M Fwd
0.4%
Roll Select
0.6%Optim Roll-WT
0.6%
UBS CMCI
0.3%
Brent Oil
1.5%
WTI Oil
0.3%
Natural Gas
1.1%Heating Oil
1.7%
Gasoline
1.1%
Carbon
-8.5%Gold
0.8%
Physical Gold
1.7%
Platinum
-2.7%Silver
0.5%
Physical Silver
5.0%
Palladium
2.4%
Wheat
5.7%
Corn
1.3%
Soybeans
-1.0%
INDUSTRIAL METALSSoybean Oil
2.0%
Cotton
-1.8%
Cocoa
-1.8%Aluminium
3.2%
Copper
-0.6%
Lead
0.4%
Coffee
-3.9%
Sugar
0.2%Nickel
1.4%
Tin
0.6%
Zinc
2.0%
Live Cattle
-1.7%
Lean Hogs
-2.3%
DIGITAL ASSETS VOLATILITYBitcoin
-7.3%
Ethereum
-9.2%
VIX
-0.7
VSTOXX
+4.7
WisdomTree MARKET UPDATE
PRECIOUS METALS
ENERGY
AGRICULTURE
WORLD EQUITIES FIXED INCOME
24 February 2022
WORLD EQUITY FACTORS
CURRENCIES
DAILY MARKET UPDATE
Daily Returns Heatmap
Top News1
For Professional Clients Only
COMMODITIES
Source: Bloomberg, WisdomTree. All data are as of 24/02/22 unless specified otherwise. Net Total Return Indices are used for equity assets. Total
Return Indices are used for Fixed Income. Excess Return Indices are used for commodities. Data about all indices can be found in Page 11 and 12.
+ President Biden imposed stiff sanctions on Russia. EU leaders backed a broad sanctions package.
+ Western allies see Kyiv poised to fall to Russian forces soon as fighting continued in Ukraine.
+ Federal Reserve officials stuck to their resolve to raise interest rates next month.
The Heatmap Live can be found on WisdomTree Short & Leveraged ETP Center here
WisdomTree Views and Insights on the market's evolutions can be found here .
WisdomTree also publishes short market news on its Short & Leveraged ETP Centre here .
WisdomTree.com n +44 (0) 207 448 4330
1) Relevant selected headlines news sourced from Bloomberg News. Historical performance is not an indication of future performance and
any investments may go down in value.
2
ASSET CLASS OVERVIEW
Index NameClosing
PriceLast 1D Last 1W Last 1M
Year to
Date
Dividend
Yield
Price to
Earnings Ratio
MSCI World 2,906 -0.1% -3.4% -3.2% -9.9% 2.0% 17.3
MSCI EM 1,155 -4.3% -7.1% -5.4% -6.2% 3.3% 11.7
S&P 500 4,289 1.5% -2.1% -2.7% -9.9% 1.5% 19.2
Dow Jones 33,224 0.3% -3.1% -3.2% -8.4% 2.1% 17.5
Nasdaq 100 13,975 3.5% -1.4% -3.6% -14.3% 0.8% 24.5
Euro Stoxx 50 3,829 -3.6% -6.9% -5.5% -10.7% 3.4% 13.2
FTSE 100 7,207 -3.6% -4.1% -0.8% -2.0% 4.1% 11.4
DAX 14,052 -4.0% -8.0% -6.5% -11.6% 3.2% 12.5
CAC 40 6,521 -3.8% -6.1% -3.9% -8.8% 3.2% 12.8
FTSE MIB 24,880 -4.1% -6.7% -4.2% -8.8% 4.7% 9.8
IBEX 35 8,199 -2.9% -5.5% -2.6% -5.6% 4.3% 12.2
Nikkei 25,971 -1.8% -4.6% -5.9% -9.8% 2.1% 15.9
Hang Seng 22,902 -3.2% -7.6% -7.1% -2.1% 3.2% 10.8
CSI 300 4,529 -2.0% -2.2% -5.4% -8.3% 2.3% 13.5
LAST 5 DAYS PERFORMANCE FOR S&P 500 and EURO STOXX 50 FUTURES1
Worst Discount in 2020
Historical Average Discount
Average Bid Offer Spreads in Nov 2019
EQUITY MARKET RISK SENTIMENT
Volatility Index ∆1D ∆1W ∆1M ∆year to DateAverage Last
10Y
VIX -0.7 2.2 0.4 13.1 17.2
VSTOXX 4.7 9.3 5.4 18.9 20.4
0.01%
-5.08%
0.08%
0.04%
LARGE EQUITY ETPS DISCOUNT TO NAV (LHS) AND BID OFFERS (RHS)2
For Professional Clients Only
WisdomTree MARKET UPDATE
Equity Focus
Source: Bloomberg, WisdomTree. All data are as of 24 February 2022 and using price return indices unless specified otherwise. Last 1D, Last
1W, Last 1M and Year to Date performance is calculated on net Total Return Index. Data about all indices can be found in Page 11 and 12.1) Intraday levels of the relevant Future for the indices as indicated in Page 11. 2) The 5 largest equity ETFs in the US and in Europe are used.
Historical performance is not an indication of future performance and any investments may go down in value.
WisdomTree.com n +44 (0) 207 448 4330
24 February 2022
Current Level
30.3
38.1
Europe DomiciledUS Domiciled
-0.63%
0.00%
3,700
3,900
4,100
4,300
4,500
4,100
4,180
4,260
4,340
4,420
Eu
ro S
tox
x 5
0
S&
P 5
00
S&P 500 Euro Stoxx 50
-2.0%
-1.0%
0.0%
1.0%
2.0%
Dis
co
un
t to
NA
V
US Domiciled Europe Domiciled
0.0%
0.0%
0.0%
0.1%
0.1%
0.1%
0.1%
Bid
Off
er
Sp
rea
ds
US Domiciled Europe Domiciled

3
ASSET CLASS OVERVIEW
Index NameClosing
PriceLast 1D Last 1W Last 1M
Year to
Date
Dividend
Yield
Price to
Earnings Ratio
MSCI World 2,906 -0.1% -3.4% -3.2% -9.9% 2.0% 17.3
Quality 3,004 1.0% -2.3% -4.4% -13.8% 1.6% 20.6
Momentum 3,023 0.8% -3.3% -2.4% -12.3% 1.6% 18.1
Min Vol 2,681 -0.3% -2.3% -3.4% -9.1% 2.2% 19.2
Value 1,188 -2.5% -5.0% -2.9% -3.3% 3.7% 9.1
High Div 1,374 -2.3% -3.9% -3.3% -4.7% 3.7% 13.1
Size 521 -0.2% -3.7% -2.7% -10.3% 26.5% 16.3
PERFORMANCE OF EQUITY FACTORS - LAST 3 MONTHS
REGIME ANALYSIS OVER THE LAST 20 BUSINESS DAYS
EXPECTED PRICE TO EARNINGS RATIO DIFFERENCE VS MSCI WORLD
Historical performance is not an indication of future performance and any investments may go down in value.
WisdomTree MARKET UPDATE
Equity Factors Focus
For Professional Clients Only
24 February 2022
Source: Bloomberg, WisdomTree. All data are as of 24 February 2022 and using price return indices unless specified otherwise.Last 1D, Last 1W,
Last 1M and Year to Date performance is calculated on net Total Return Index. Data about all indices can be found in Page 11 and 12.
WisdomTree.com n +44 (0) 207 448 4330
Find out more about Modern Alpha with WisdomTree here .
-7%
-2%
3%
8%
13%
29 Oct 08 Nov 18 Nov 28 Nov 08 Dec 18 Dec 28 Dec 07 Jan 17 Jan 27 Jan 06 Feb 16 Feb
Pe
rfo
rma
nce
ve
rsu
s M
SC
I W
orl
d
Min Vol Quality Momentum Value High Dividend Size
-13
-6
1
8
15
Jan 15 Jan 16 Jan 17 Jan 18 Jan 19 Jan 20 Jan 21 Jan 22
PE
ra
tio
ve
rsu
s M
SC
I W
orl
d
Min Vol Quality Momentum Value High Dividend Size
1.0%
-1.0%
0.6%
-0.6%
1.2%
-1.2%
1.4%
-1.2%
0.7%
-0.7%
0.4%
-0.6%
1.1%
-0.9%-2%
-1%
-1%
0%
1%
1%
2%
2%
Average Returns when MSCI World is Up Average Returns when MSCI World is Down
Av
era
ge
da
ily
re
turn
s
MSCI World Min Vol Quality Momentum Value High Dividend Size
4
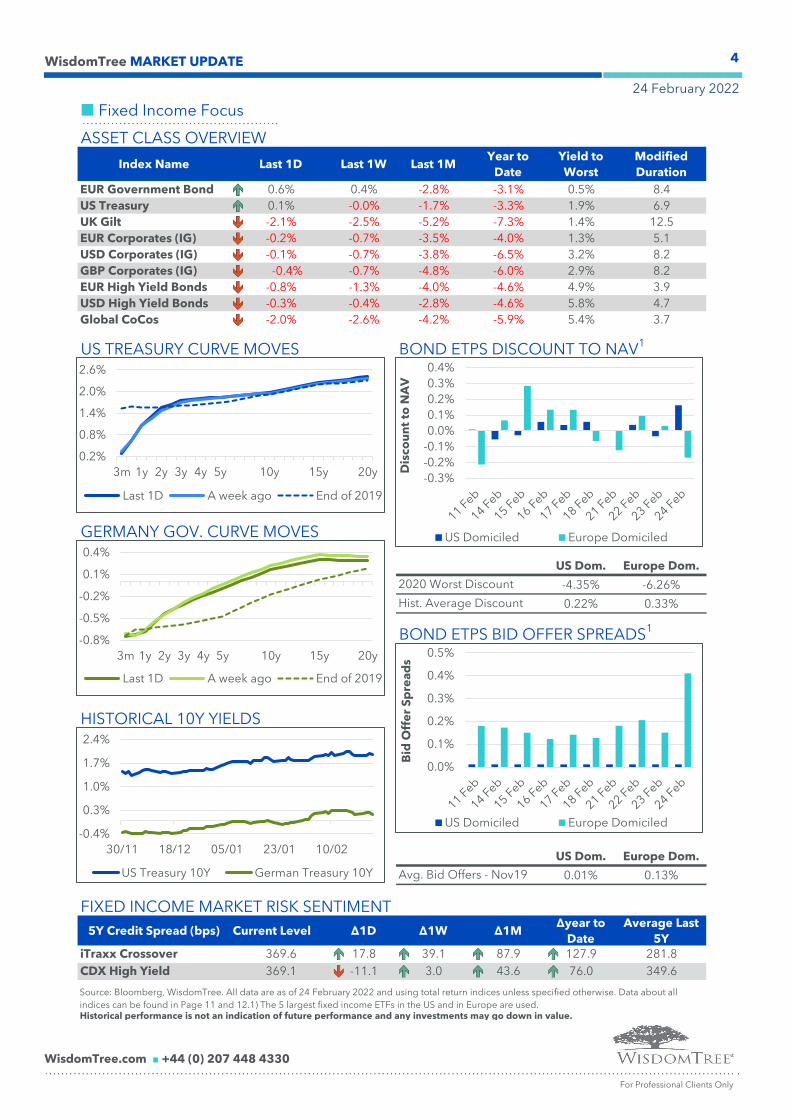
ASSET CLASS OVERVIEW
Index Name Last 1D Last 1W Last 1MYear to
Date
Yield to
Worst
Modified
Duration
EUR Government Bond 0.6% 0.4% -2.8% -3.1% 0.5% 8.4
US Treasury 0.1% -0.0% -1.7% -3.3% 1.9% 6.9
UK Gilt -2.1% -2.5% -5.2% -7.3% 1.4% 12.5
EUR Corporates (IG) -0.2% -0.7% -3.5% -4.0% 1.3% 5.1
USD Corporates (IG) -0.1% -0.7% -3.8% -6.5% 3.2% 8.2
GBP Corporates (IG) -0.4% -0.7% -4.8% -6.0% 2.9% 8.2
EUR High Yield Bonds -0.8% -1.3% -4.0% -4.6% 4.9% 3.9
USD High Yield Bonds -0.3% -0.4% -2.8% -4.6% 5.8% 4.7
Global CoCos -2.0% -2.6% -4.2% -5.9% 5.4% 3.7
US TREASURY CURVE MOVES BOND ETPS DISCOUNT TO NAV1
GERMANY GOV. CURVE MOVES
US Dom. Europe Dom.
-4.35% -6.26%
0.22% 0.33%
BOND ETPS BID OFFER SPREADS1
HISTORICAL 10Y YIELDS
US Dom. Europe Dom.
0.01% 0.13%
FIXED INCOME MARKET RISK SENTIMENT
5Y Credit Spread (bps) Current Level ∆1D ∆1W ∆1M∆year to
Date
Average Last
5Y
iTraxx Crossover 369.6 17.8 39.1 87.9 127.9 281.8
CDX High Yield 369.1 -11.1 3.0 43.6 76.0 349.6
Historical performance is not an indication of future performance and any investments may go down in value.
WisdomTree MARKET UPDATE
For Professional Clients Only
24 February 2022
Source: Bloomberg, WisdomTree. All data are as of 24 February 2022 and using total return indices unless specified otherwise. Data about all
indices can be found in Page 11 and 12.1) The 5 largest fixed income ETFs in the US and in Europe are used.
Avg. Bid Offers - Nov19
2020 Worst Discount
Hist. Average Discount
Fixed Income Focus
WisdomTree.com n +44 (0) 207 448 4330
0.2%
0.8%
1.4%
2.0%
2.6%
3m 1y 2y 3y 4y 5y 10y 15y 20y
Last 1D A week ago End of 2019
-0.8%
-0.5%
-0.2%
0.1%
0.4%
3m 1y 2y 3y 4y 5y 10y 15y 20y
Last 1D A week ago End of 2019
-0.4%
0.3%
1.0%
1.7%
2.4%
30/11 18/12 05/01 23/01 10/02
US Treasury 10Y German Treasury 10Y
-0.3%
-0.2%
-0.1%
0.0%
0.1%
0.2%
0.3%
0.4%
Dis
co
un
t to
NA
V
US Domiciled Europe Domiciled
0.0%
0.1%
0.2%
0.3%
0.4%
0.5%
Bid
Off
er
Sp
rea
ds
US Domiciled Europe Domiciled
5
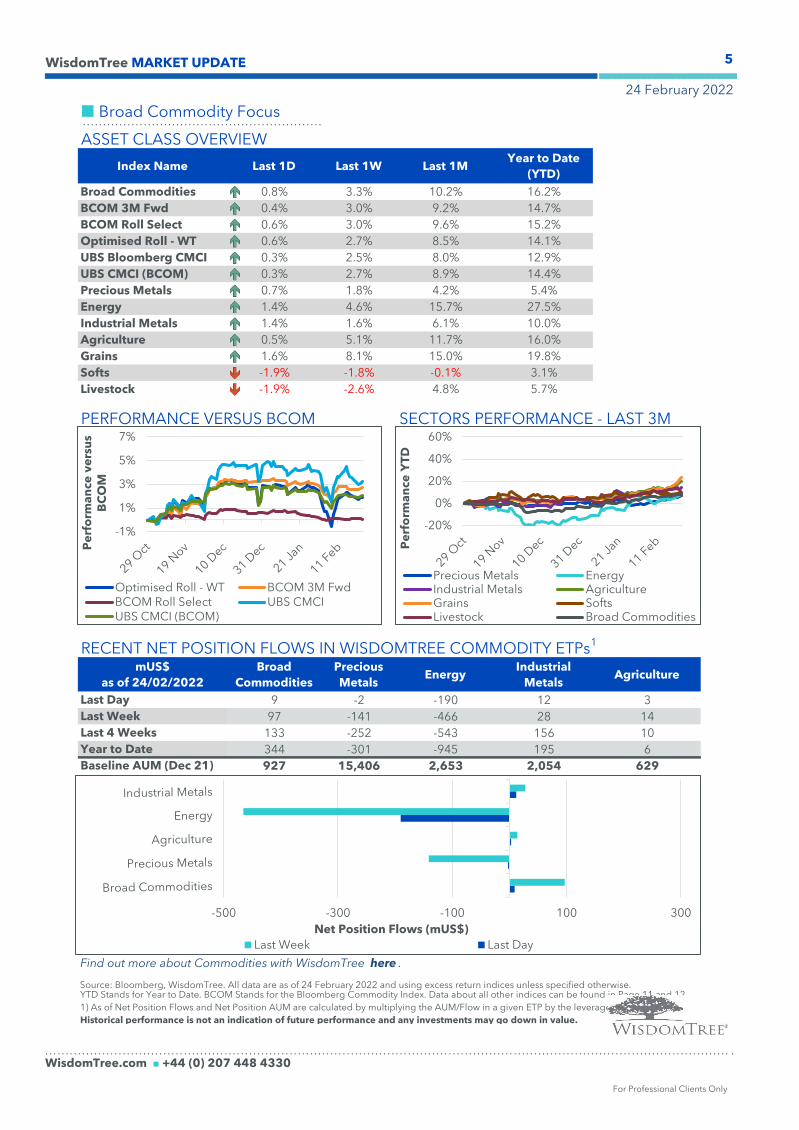
ASSET CLASS OVERVIEW
Index Name Last 1D Last 1W Last 1MYear to Date
(YTD)
Broad Commodities 0.8% 3.3% 10.2% 16.2%
BCOM 3M Fwd 0.4% 3.0% 9.2% 14.7%
BCOM Roll Select 0.6% 3.0% 9.6% 15.2%
Optimised Roll - WT 0.6% 2.7% 8.5% 14.1%
UBS Bloomberg CMCI 0.3% 2.5% 8.0% 12.9%
UBS CMCI (BCOM) 0.3% 2.7% 8.9% 14.4%
Precious Metals 0.7% 1.8% 4.2% 5.4%
Energy 1.4% 4.6% 15.7% 27.5%
Industrial Metals 1.4% 1.6% 6.1% 10.0%
Agriculture 0.5% 5.1% 11.7% 16.0%
Grains 1.6% 8.1% 15.0% 19.8%
Softs -1.9% -1.8% -0.1% 3.1%
Livestock -1.9% -2.6% 4.8% 5.7%
PERFORMANCE VERSUS BCOM SECTORS PERFORMANCE - LAST 3M
RECENT NET POSITION FLOWS IN WISDOMTREE COMMODITY ETPs1
mUS$
as of 24/02/2022
Broad
Commodities
Precious
MetalsEnergy
Industrial
MetalsAgriculture
Last Day 9 -2 -190 12 3
Last Week 97 -141 -466 28 14
Last 4 Weeks 133 -252 -543 156 10
Year to Date 344 -301 -945 195 6
Baseline AUM (Dec 21) 927 15,406 2,653 2,054 629
Source: Bloomberg, WisdomTree. All data are as of 24 February 2022 and using excess return indices unless specified otherwise.
For Professional Clients Only
Find out more about Commodities with WisdomTree here .
WisdomTree MARKET UPDATE
24 February 2022
Broad Commodity Focus
WisdomTree.com n +44 (0) 207 448 4330
YTD Stands for Year to Date. BCOM Stands for the Bloomberg Commodity Index. Data about all other indices can be found in Page 11 and 12.
1) As of Net Position Flows and Net Position AUM are calculated by multiplying the AUM/Flow in a given ETP by the leverage of that ETP.
Historical performance is not an indication of future performance and any investments may go down in value.
-500 -300 -100 100 300
Net Position Flows (mUS$)
Last Week Last Day
-20%
0%
20%
40%
60%
Pe
rfo
rma
nce
YT
D
Precious Metals EnergyIndustrial Metals AgricultureGrains SoftsLivestock Broad Commodities
-1%
1%
3%
5%
7%
Pe
rfo
rma
nce
ve
rsu
s
BC
OM
Optimised Roll - WT BCOM 3M FwdBCOM Roll Select UBS CMCIUBS CMCI (BCOM)
6
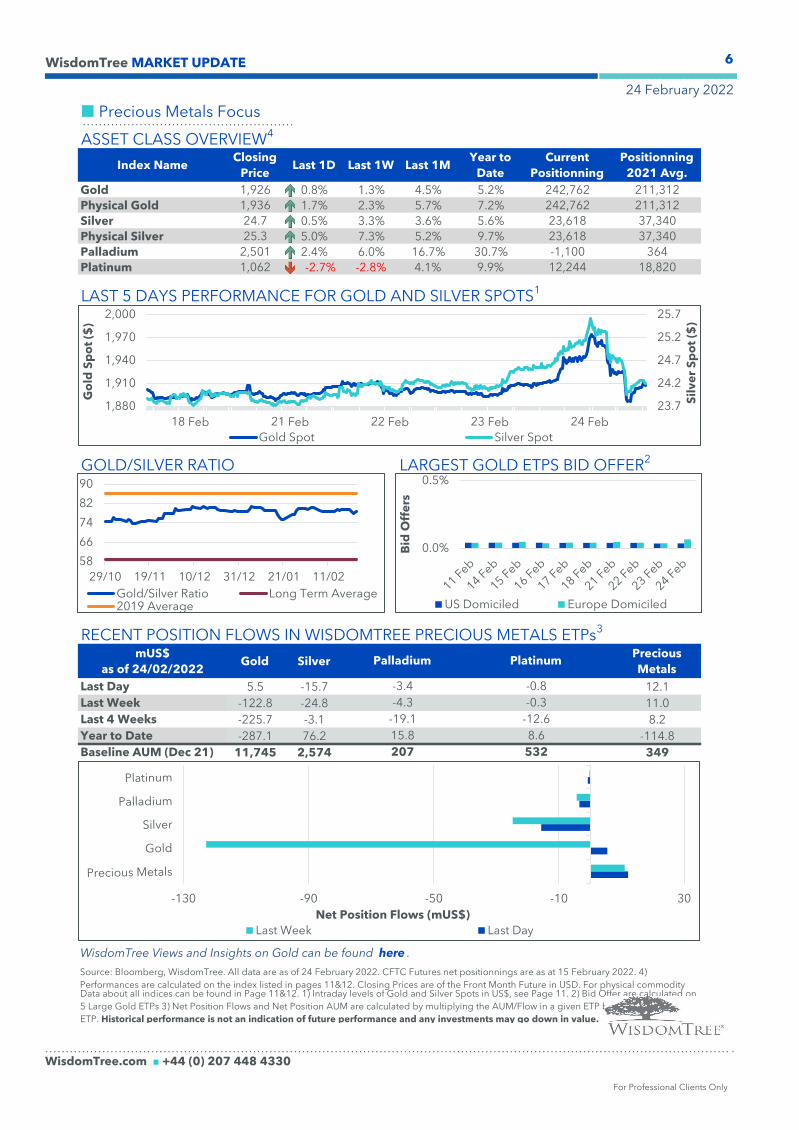
ASSET CLASS OVERVIEW4
Index NameClosing
PriceLast 1D Last 1W Last 1M
Year to
Date
Current
Positionning
Positionning
2021 Avg.
Gold 1,926 0.8% 1.3% 4.5% 5.2% 242,762 211,312
Physical Gold 1,936 1.7% 2.3% 5.7% 7.2% 242,762 211,312
Silver 24.7 0.5% 3.3% 3.6% 5.6% 23,618 37,340
Physical Silver 25.3 5.0% 7.3% 5.2% 9.7% 23,618 37,340
Palladium 2,501 2.4% 6.0% 16.7% 30.7% -1,100 364
Platinum 1,062 -2.7% -2.8% 4.1% 9.9% 12,244 18,820
LAST 5 DAYS PERFORMANCE FOR GOLD AND SILVER SPOTS1
GOLD/SILVER RATIO LARGEST GOLD ETPS BID OFFER2
RECENT POSITION FLOWS IN WISDOMTREE PRECIOUS METALS ETPs3
mUS$
as of 24/02/2022Gold Silver
Precious
Metals
Last Day 5.5 -15.7 12.1
Last Week -122.8 -24.8 11.0
Last 4 Weeks -225.7 -3.1 8.2
Year to Date -287.1 76.2 -114.8
Baseline AUM (Dec 21) 11,745 2,574 349
WisdomTree MARKET UPDATE
Precious Metals Focus
For Professional Clients Only
-4.3
24 February 2022
-19.1
15.8
Platinum
-0.8
-0.3
-12.6
8.6
Palladium
-3.4
207 532
Source: Bloomberg, WisdomTree. All data are as of 24 February 2022. CFTC Futures net positionnings are as at 15 February 2022. 4)
Performances are calculated on the index listed in pages 11&12. Closing Prices are of the Front Month Future in USD. For physical commodity Data about all indices can be found in Page 11&12. 1) Intraday levels of Gold and Silver Spots in US$, see Page 11. 2) Bid Offer are calculated on
5 Large Gold ETPs 3) Net Position Flows and Net Position AUM are calculated by multiplying the AUM/Flow in a given ETP by the leverage of that
ETP. Historical performance is not an indication of future performance and any investments may go down in value.
WisdomTree.com n +44 (0) 207 448 4330
WisdomTree Views and Insights on Gold can be found here .
23.7
24.2
24.7
25.2
25.7
1,880
1,910
1,940
1,970
2,000
Sil
ve
r S
po
t ($
)
Go
ld S
po
t ($
)
Gold Spot Silver Spot
-130 -90 -50 -10 30
Net Position Flows (mUS$)
Last Week Last Day
58
66
74
82
90
29/10 19/11 10/12 31/12 21/01 11/02
Gold/Silver Ratio Long Term Average2019 Average
0.0%
0.5%
Bid
Off
ers
US Domiciled Europe Domiciled
7
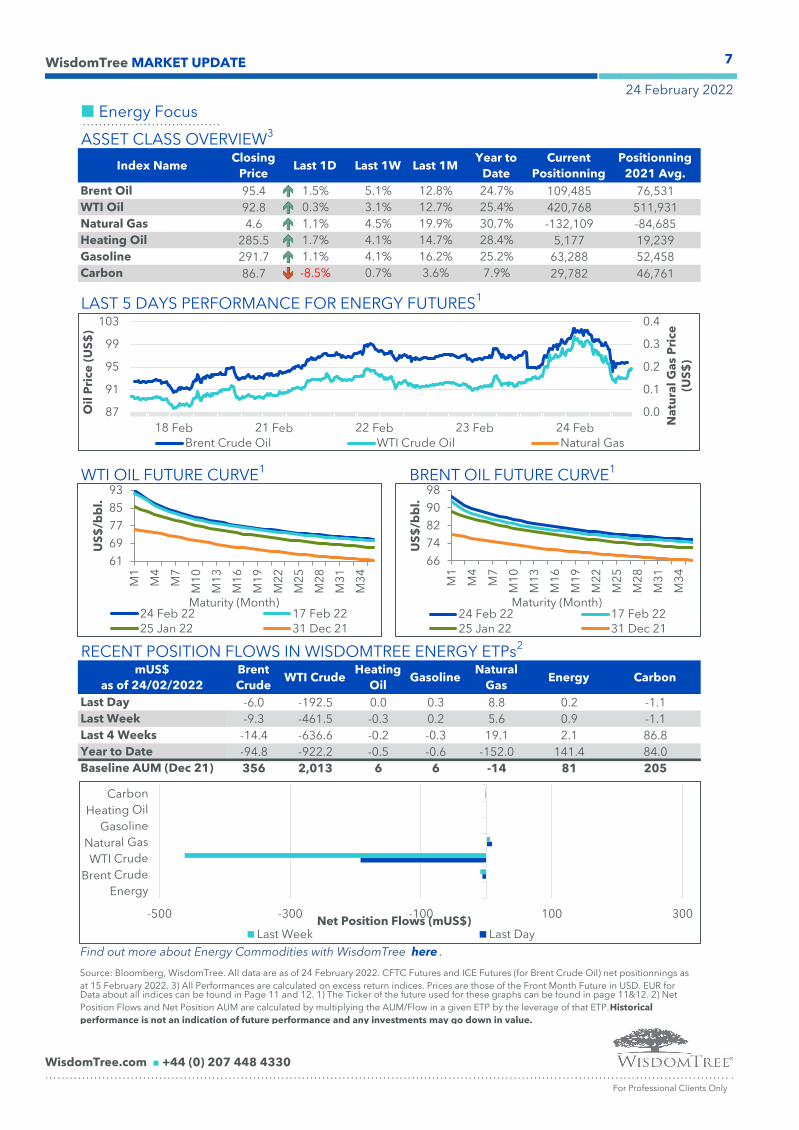
ASSET CLASS OVERVIEW3
Index NameClosing
PriceLast 1D Last 1W Last 1M
Year to
Date
Current
Positionning
Positionning
2021 Avg.
Brent Oil 95.4 1.5% 5.1% 12.8% 24.7% 109,485 76,531
WTI Oil 92.8 0.3% 3.1% 12.7% 25.4% 420,768 511,931
Natural Gas 4.6 1.1% 4.5% 19.9% 30.7% -132,109 -84,685
Heating Oil 285.5 1.7% 4.1% 14.7% 28.4% 5,177 19,239
Gasoline 291.7 1.1% 4.1% 16.2% 25.2% 63,288 52,458
Carbon 86.7 -8.5% 0.7% 3.6% 7.9% 29,782 46,761
LAST 5 DAYS PERFORMANCE FOR ENERGY FUTURES1
WTI OIL FUTURE CURVE1 BRENT OIL FUTURE CURVE1
RECENT POSITION FLOWS IN WISDOMTREE ENERGY ETPs2
mUS$
as of 24/02/2022
Brent
CrudeWTI Crude
Heating
OilGasoline
Natural
GasEnergy Carbon
Last Day -6.0 -192.5 0.0 0.3 8.8 0.2 -1.1
Last Week -9.3 -461.5 -0.3 0.2 5.6 0.9 -1.1
Last 4 Weeks -14.4 -636.6 -0.2 -0.3 19.1 2.1 86.8
Year to Date -94.8 -922.2 -0.5 -0.6 -152.0 141.4 84.0
Baseline AUM (Dec 21) 356 2,013 6 6 -14 81 205
WisdomTree MARKET UPDATE
Energy Focus
For Professional Clients Only
24 February 2022
Source: Bloomberg, WisdomTree. All data are as of 24 February 2022. CFTC Futures and ICE Futures (for Brent Crude Oil) net positionnings as
at 15 February 2022. 3) All Performances are calculated on excess return indices. Prices are those of the Front Month Future in USD. EUR for Data about all indices can be found in Page 11 and 12. 1) The Ticker of the future used for these graphs can be found in page 11&12. 2) Net
Position Flows and Net Position AUM are calculated by multiplying the AUM/Flow in a given ETP by the leverage of that ETP.Historical
performance is not an indication of future performance and any investments may go down in value.
WisdomTree.com n +44 (0) 207 448 4330
Find out more about Energy Commodities with WisdomTree here .
-500 -300 -100 100 300Net Position Flows (mUS$)
Last Week Last Day
0.0
0.1
0.2
0.3
0.4
87
91
95
99
103
Na
tura
l G
as
Pri
ce
(U
S$
)
Oil
Pri
ce
(U
S$
)
Brent Crude Oil WTI Crude Oil Natural Gas
61
69
77
85
93
M1
M4
M7
M1
0
M1
3
M1
6
M1
9
M2
2
M2
5
M2
8
M3
1
M3
4
US
$/b
bl.
Maturity (Month)24 Feb 22 17 Feb 2225 Jan 22 31 Dec 21
66
74
82
90
98
M1
M4
M7
M1
0
M1
3
M1
6
M1
9
M2
2
M2
5
M2
8
M3
1
M3
4
US
$/b
bl.
Maturity (Month)24 Feb 22 17 Feb 2225 Jan 22 31 Dec 21
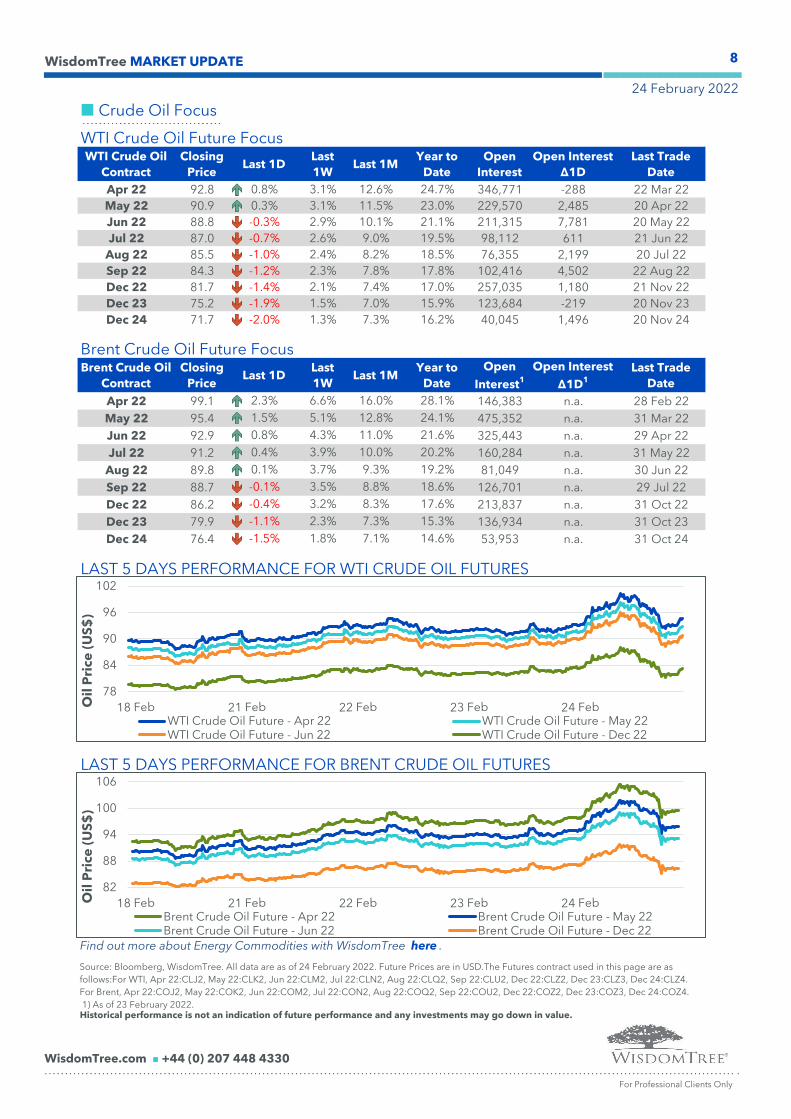
8
WTI Crude Oil Future FocusWTI Crude Oil
Contract
Closing
PriceLast 1D
Last
1WLast 1M
Year to
Date
Open
Interest
Open Interest
∆1D
Last Trade
Date
Apr 22 92.8 0.8% 3.1% 12.6% 24.7% 346,771 -288 22 Mar 22
May 22 90.9 0.3% 3.1% 11.5% 23.0% 229,570 2,485 20 Apr 22
Jun 22 88.8 -0.3% 2.9% 10.1% 21.1% 211,315 7,781 20 May 22
Jul 22 87.0 -0.7% 2.6% 9.0% 19.5% 98,112 611 21 Jun 22
Aug 22 85.5 -1.0% 2.4% 8.2% 18.5% 76,355 2,199 20 Jul 22
Sep 22 84.3 -1.2% 2.3% 7.8% 17.8% 102,416 4,502 22 Aug 22
Dec 22 81.7 -1.4% 2.1% 7.4% 17.0% 257,035 1,180 21 Nov 22
Dec 23 75.2 -1.9% 1.5% 7.0% 15.9% 123,684 -219 20 Nov 23
Dec 24 71.7 -2.0% 1.3% 7.3% 16.2% 40,045 1,496 20 Nov 24
Brent Crude Oil Future FocusBrent Crude Oil
Contract
Closing
PriceLast 1D
Last
1WLast 1M
Year to
Date
Open
Interest1
Open Interest
∆1D1
Last Trade
Date
Apr 22 99.1 2.3% 6.6% 16.0% 28.1% 146,383 n.a. 28 Feb 22
May 22 95.4 1.5% 5.1% 12.8% 24.1% 475,352 n.a. 31 Mar 22
Jun 22 92.9 0.8% 4.3% 11.0% 21.6% 325,443 n.a. 29 Apr 22
Jul 22 91.2 0.4% 3.9% 10.0% 20.2% 160,284 n.a. 31 May 22
Aug 22 89.8 0.1% 3.7% 9.3% 19.2% 81,049 n.a. 30 Jun 22
Sep 22 88.7 -0.1% 3.5% 8.8% 18.6% 126,701 n.a. 29 Jul 22
Dec 22 86.2 -0.4% 3.2% 8.3% 17.6% 213,837 n.a. 31 Oct 22
Dec 23 79.9 -1.1% 2.3% 7.3% 15.3% 136,934 n.a. 31 Oct 23
Dec 24 76.4 -1.5% 1.8% 7.1% 14.6% 53,953 n.a. 31 Oct 24
LAST 5 DAYS PERFORMANCE FOR WTI CRUDE OIL FUTURES
LAST 5 DAYS PERFORMANCE FOR BRENT CRUDE OIL FUTURES
For Professional Clients Only
Source: Bloomberg, WisdomTree. All data are as of 24 February 2022. Future Prices are in USD.The Futures contract used in this page are as
follows:For WTI, Apr 22:CLJ2, May 22:CLK2, Jun 22:CLM2, Jul 22:CLN2, Aug 22:CLQ2, Sep 22:CLU2, Dec 22:CLZ2, Dec 23:CLZ3, Dec 24:CLZ4.
For Brent, Apr 22:COJ2, May 22:COK2, Jun 22:COM2, Jul 22:CON2, Aug 22:COQ2, Sep 22:COU2, Dec 22:COZ2, Dec 23:COZ3, Dec 24:COZ4.
1) As of 23 February 2022.
Find out more about Energy Commodities with WisdomTree here .
WisdomTree MARKET UPDATE
24 February 2022
Crude Oil Focus
Historical performance is not an indication of future performance and any investments may go down in value.
WisdomTree.com n +44 (0) 207 448 4330
78
84
90
96
102
Oil
Pri
ce
(U
S$
)
WTI Crude Oil Future - Apr 22 WTI Crude Oil Future - May 22WTI Crude Oil Future - Jun 22 WTI Crude Oil Future - Dec 22
82
88
94
100
106
Oil
Pri
ce
(U
S$
)
Brent Crude Oil Future - Apr 22 Brent Crude Oil Future - May 22Brent Crude Oil Future - Jun 22 Brent Crude Oil Future - Dec 22
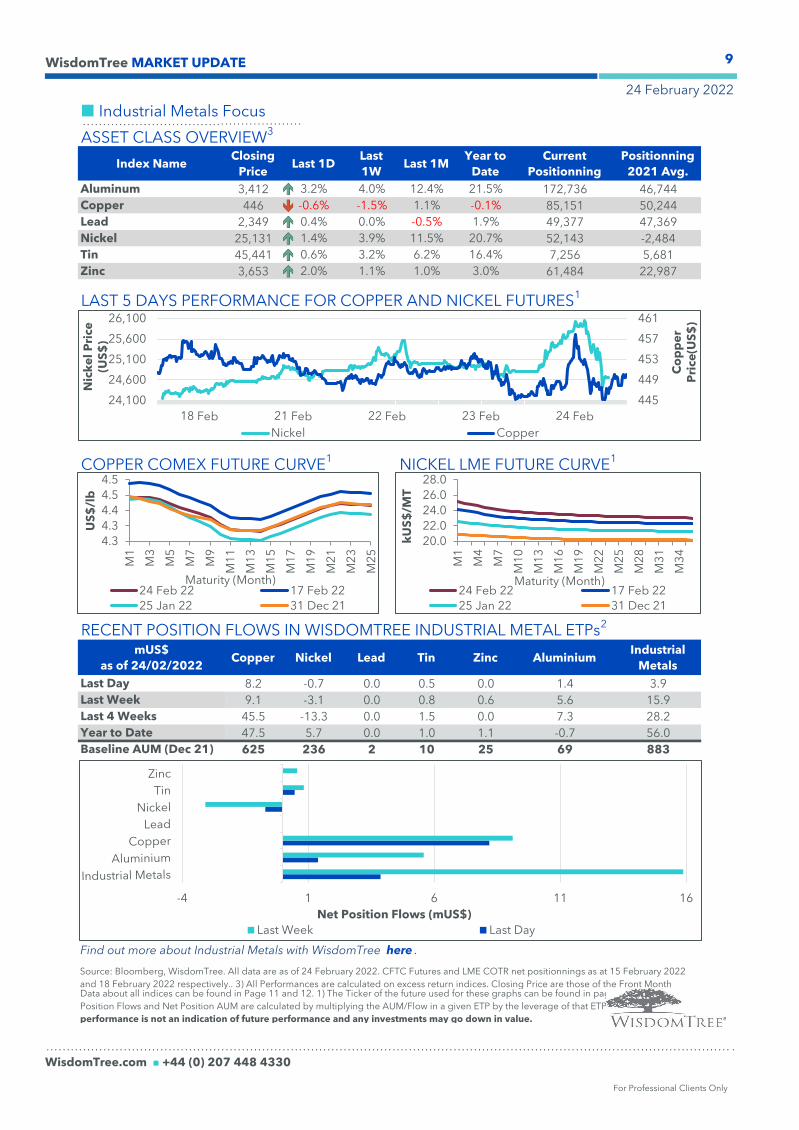
9
ASSET CLASS OVERVIEW3
Index NameClosing
PriceLast 1D
Last
1WLast 1M
Year to
Date
Current
Positionning
Positionning
2021 Avg.
Aluminum 3,412 3.2% 4.0% 12.4% 21.5% 172,736 46,744
Copper 446 -0.6% -1.5% 1.1% -0.1% 85,151 50,244
Lead 2,349 0.4% 0.0% -0.5% 1.9% 49,377 47,369
Nickel 25,131 1.4% 3.9% 11.5% 20.7% 52,143 -2,484
Tin 45,441 0.6% 3.2% 6.2% 16.4% 7,256 5,681
Zinc 3,653 2.0% 1.1% 1.0% 3.0% 61,484 22,987
LAST 5 DAYS PERFORMANCE FOR COPPER AND NICKEL FUTURES1
COPPER COMEX FUTURE CURVE1 NICKEL LME FUTURE CURVE1
RECENT POSITION FLOWS IN WISDOMTREE INDUSTRIAL METAL ETPs2
mUS$
as of 24/02/2022Copper Nickel Lead Tin Zinc Aluminium
Industrial
Metals
Last Day 8.2 -0.7 0.0 0.5 0.0 1.4 3.9
Last Week 9.1 -3.1 0.0 0.8 0.6 5.6 15.9
Last 4 Weeks 45.5 -13.3 0.0 1.5 0.0 7.3 28.2
Year to Date 47.5 5.7 0.0 1.0 1.1 -0.7 56.0
Baseline AUM (Dec 21) 625 236 2 10 25 69 883
WisdomTree MARKET UPDATE
Industrial Metals Focus
For Professional Clients Only
24 February 2022
Source: Bloomberg, WisdomTree. All data are as of 24 February 2022. CFTC Futures and LME COTR net positionnings as at 15 February 2022
and 18 February 2022 respectively.. 3) All Performances are calculated on excess return indices. Closing Price are those of the Front Month Data about all indices can be found in Page 11 and 12. 1) The Ticker of the future used for these graphs can be found in page 11&12. 2) Net
Position Flows and Net Position AUM are calculated by multiplying the AUM/Flow in a given ETP by the leverage of that ETP.Historical
performance is not an indication of future performance and any investments may go down in value.
WisdomTree.com n +44 (0) 207 448 4330
Find out more about Industrial Metals with WisdomTree here .
-4 1 6 11 16
Net Position Flows (mUS$)
Last Week Last Day
445
449
453
457
461
24,100
24,600
25,100
25,600
26,100
Co
pp
er
Pri
ce
(US
$)
Nic
ke
l P
ric
e
(US
$)
Nickel Copper
4.3
4.3
4.4
4.5
4.5
M1
M3
M5
M7
M9
M1
1
M1
3
M1
5
M1
7
M1
9
M2
1
M2
3
M2
5
US
$/l
b
Maturity (Month)24 Feb 22 17 Feb 22
25 Jan 22 31 Dec 21
20.0
22.0
24.0
26.0
28.0
M1
M4
M7
M1
0
M1
3
M1
6
M1
9
M2
2
M2
5
M2
8
M3
1
M3
4
kU
S$
/MT
Maturity (Month)24 Feb 22 17 Feb 22
25 Jan 22 31 Dec 21
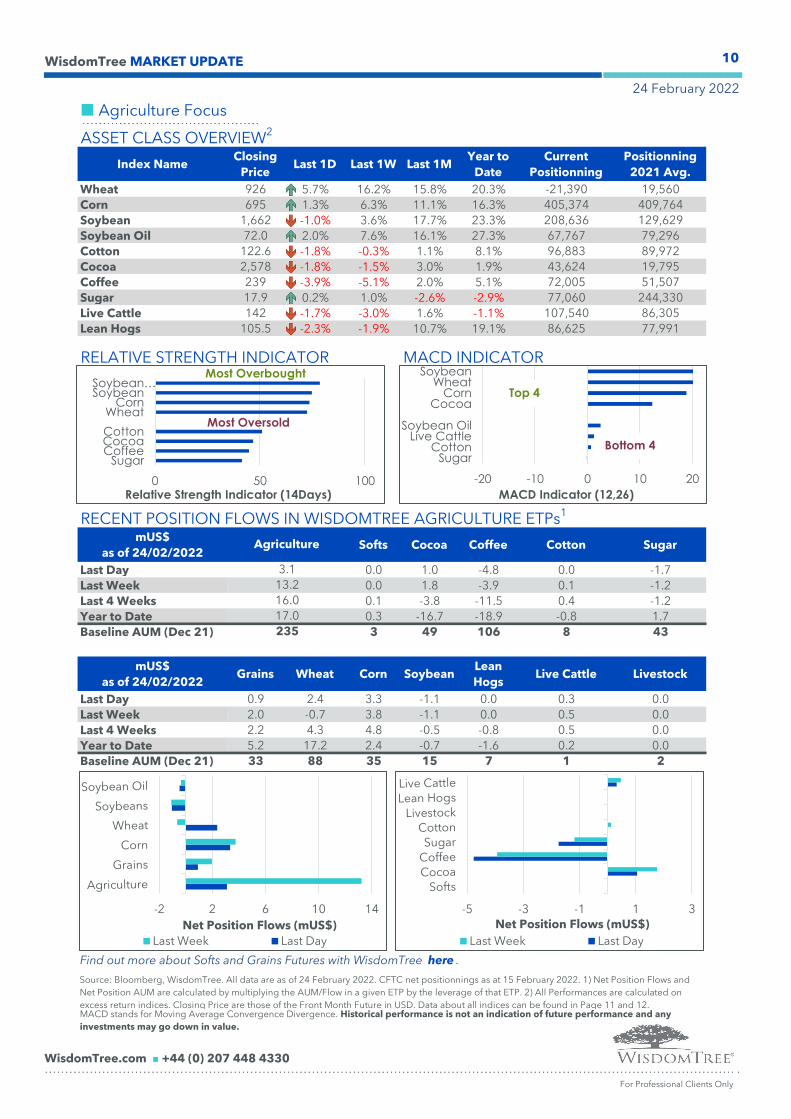
10
ASSET CLASS OVERVIEW2
Index NameClosing
PriceLast 1D Last 1W Last 1M
Year to
Date
Current
Positionning
Positionning
2021 Avg.
Wheat 926 5.7% 16.2% 15.8% 20.3% -21,390 19,560
Corn 695 1.3% 6.3% 11.1% 16.3% 405,374 409,764
Soybean 1,662 -1.0% 3.6% 17.7% 23.3% 208,636 129,629
Soybean Oil 72.0 2.0% 7.6% 16.1% 27.3% 67,767 79,296
Cotton 122.6 -1.8% -0.3% 1.1% 8.1% 96,883 89,972
Cocoa 2,578 -1.8% -1.5% 3.0% 1.9% 43,624 19,795
Coffee 239 -3.9% -5.1% 2.0% 5.1% 72,005 51,507
Sugar 17.9 0.2% 1.0% -2.6% -2.9% 77,060 244,330
Live Cattle 142 -1.7% -3.0% 1.6% -1.1% 107,540 86,305
Lean Hogs 105.5 -2.3% -1.9% 10.7% 19.1% 86,625 77,991
RELATIVE STRENGTH INDICATOR MACD INDICATOR
RECENT POSITION FLOWS IN WISDOMTREE AGRICULTURE ETPs1
mUS$
as of 24/02/2022Softs Cocoa Coffee Cotton Sugar
Last Day 0.0 1.0 -4.8 0.0 -1.7
Last Week 0.0 1.8 -3.9 0.1 -1.2
Last 4 Weeks 0.1 -3.8 -11.5 0.4 -1.2
Year to Date 0.3 -16.7 -18.9 -0.8 1.7
Baseline AUM (Dec 21) 3 49 106 8 43
mUS$
as of 24/02/2022Grains Wheat Corn Soybean
Lean
HogsLive Cattle Livestock
Last Day 0.9 2.4 3.3 -1.1 0.0 0.3 0.0
Last Week 2.0 -0.7 3.8 -1.1 0.0 0.5 0.0
Last 4 Weeks 2.2 4.3 4.8 -0.5 -0.8 0.5 0.0
Year to Date 5.2 17.2 2.4 -0.7 -1.6 0.2 0.0
Baseline AUM (Dec 21) 33 88 35 15 7 1 2
WisdomTree MARKET UPDATE
24 February 2022
Agriculture Focus
For Professional Clients Only
Agriculture
3.1
13.2
16.0
17.0
235
Source: Bloomberg, WisdomTree. All data are as of 24 February 2022. CFTC net positionnings as at 15 February 2022. 1) Net Position Flows and
Net Position AUM are calculated by multiplying the AUM/Flow in a given ETP by the leverage of that ETP. 2) All Performances are calculated on
excess return indices. Closing Price are those of the Front Month Future in USD. Data about all indices can be found in Page 11 and 12.
WisdomTree.com n +44 (0) 207 448 4330
MACD stands for Moving Average Convergence Divergence. Historical performance is not an indication of future performance and any
investments may go down in value.
Find out more about Softs and Grains Futures with WisdomTree here .
-5 -3 -1 1 3
Net Position Flows (mUS$)
Last Week Last Day
-2 2 6 10 14
Net Position Flows (mUS$)
Last Week Last Day
-20 -10 0 10 20
SugarCotton
Live CattleSoybean Oil
CocoaCorn
WheatSoybean
MACD Indicator (12,26)
Top 4
Bottom 4
0 50 100
SugarCoffeeCocoaCotton
WheatCorn
SoybeanSoybean…
Relative Strength Indicator (14Days)
Most Overbought
Most Oversold

11
INDEX MAP (1/2)
Handle Index NamePrice Return
Index Ticker
Total Return
Index Ticker
Excess Return
Index Ticker
Future
Ticker
MSCI World MSCI World Index MXWO NDDUWI Index
MSCI EM MSCI Emerging Markets Index MXEF NDUEEGF Index
S&P 500 S&P 500 Index SPX SPTR500N Index ES
Dow Jones Dow Jones Industrial Average Index INDU DJINR Index
Nasdaq 100 NASDAQ 100 Stock Index NDX XNDXNNR Index
Euro Stoxx 50 EURO STOXX 50 Index SX5E SX5T Index VG
FTSE 100 FTSE 100 Index UKX UKXNUK Index
DAX DAX Index DAX DAXNR Index
CAC 40 CAC 40 Index CAC NCAC Index
FTSE MIB FTSE MIB Index FTSEMIB FTSEMIBN Index
IBEX 35 IBEX 35 Index IBEX IBEXNR Index
Nikkei Nikkei 225 NKY NKYNTR Index
Hang Seng Hong Kong Hang Seng Index HSI HSI1N Index
CSI 300 Shanghai Shenzhen CSI 300 Index SHSZ300 CSIN0300 Index
Quality MSCI World Quality Index MXWOQU M1WOQU
Momentum MSCI World Momentum Index MXWOMOM M1WOMOM
Min Vol MSCI World Minimum Volatility Index MXWOMVOL M00IWO$O
Value MSCI World Enhanced Value Index MXWOEV M1WOEV
High Div MSCI World High Dividend Yield Index MXWDHDVD M1WDHDVD
Size MSCI World Small Cap Index MXWOSC NCUDWI
EUR Gov. Bloomberg Barclays EuroAgg Treasury Index LEATTREU
US Gov. Bloomberg Barclays US Treasury LUATTRUU
UK Gilt Bloomberg Barclays Sterling Gilts Index LSG1TRUU
EUR IG Corp.Bloomberg Barclays Euro Aggregate
Corporate IndexLECPTREU
USD IG Corp. Bloomberg Barclays US Corporate Index LUACTRUU
UK IG CorpBloomberg Barclays Sterling Corporate
IndexLC61TRGU
EUR HY/EUR
High Yield
Bloomberg Barclays Pan-European High
Yield (Euro) IndexLP02TREU
USD HY/USD
High Yield
Bloomberg Barclays US Corporate High Yield
IndexLF98TRUU
CoCos/Global
Cocos
iBoxx Contingent Convertible Liquid
Developed Europe AT1IBXXCCL1
BCOM Bloomberg Commodity Index BCOM
3M FwdBloomberg Commodity Index 3 Month
ForwardBCOMF3
Roll Select Bloomberg Roll Select Commodity Index BCOMRS
Optim Roll-WT Optimized Roll Commodity Index Index EBCIWTE
UBS CMCI UBS Bloomberg CMCI Composite Index CMCIER
UBS CMCI
(BCOM)
UBS Bloomberg BCOM Constant CMCI
Composite IndexCMDJCIER
Gold Bloomberg Gold Subindex BCOMGC GC
Physical Gold LBMA Gold Price PM USD GOLDLNPM
Platinum BCOM Palladium Subindex BCOMPL PL
Silver Bloomberg Silver Subindex BCOMSI SI
Physical Silver LBMA Silver Price - Price/USD SLVRLND
Palladium Bloomberg Platinum Subindex BCOMPA PA
Brent Oil Bloomberg Brent Crude Subindex BCOMCO CO
WTI Oil Bloomberg WTI Crude Oil Subindex BCOMCL CL
Natural Gas Bloomberg Natural Gas Subindex BCOMNG NG
Heating Oil Bloomberg Heating Oil Subindex BCOMHO HO
Gasoline Bloomberg Unleaded Gasoline Subindex BCOMRB XB
Aluminum Bloomberg Aluminum Subindex BCOMAL LA
Carbon Solactive Carbon Emission Allowances Rolling Futures Index SOLCARBF MO
For Professional Clients Only
WisdomTree MARKET UPDATE
24 February 2022
Source: Bloomberg, WisdomTree. As of 24 February 2022
Appendix
WisdomTree.com n +44 (0) 207 448 4330
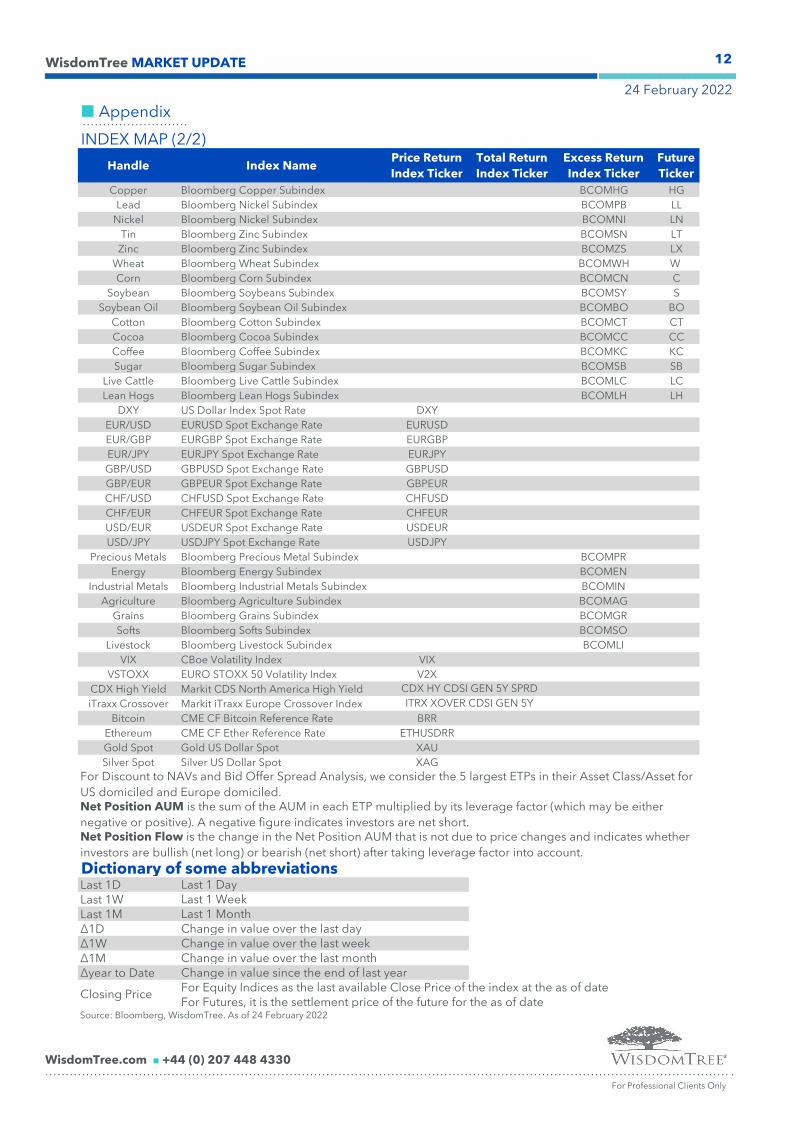
12
INDEX MAP (2/2)
Handle Index NamePrice Return
Index Ticker
Total Return
Index Ticker
Excess Return
Index Ticker
Future
Ticker
Copper Bloomberg Copper Subindex BCOMHG HG
Lead Bloomberg Nickel Subindex BCOMPB LL
Nickel Bloomberg Nickel Subindex BCOMNI LN
Tin Bloomberg Zinc Subindex BCOMSN LT
Zinc Bloomberg Zinc Subindex BCOMZS LX
Wheat Bloomberg Wheat Subindex BCOMWH W
Corn Bloomberg Corn Subindex BCOMCN C
Soybean Bloomberg Soybeans Subindex BCOMSY S
Soybean Oil Bloomberg Soybean Oil Subindex BCOMBO BO
Cotton Bloomberg Cotton Subindex BCOMCT CT
Cocoa Bloomberg Cocoa Subindex BCOMCC CC
Coffee Bloomberg Coffee Subindex BCOMKC KC
Sugar Bloomberg Sugar Subindex BCOMSB SB
Live Cattle Bloomberg Live Cattle Subindex BCOMLC LC
Lean Hogs Bloomberg Lean Hogs Subindex BCOMLH LH
DXY US Dollar Index Spot Rate DXY
EUR/USD EURUSD Spot Exchange Rate EURUSD
EUR/GBP EURGBP Spot Exchange Rate EURGBP
EUR/JPY EURJPY Spot Exchange Rate EURJPY
GBP/USD GBPUSD Spot Exchange Rate GBPUSD
GBP/EUR GBPEUR Spot Exchange Rate GBPEUR
CHF/USD CHFUSD Spot Exchange Rate CHFUSD
CHF/EUR CHFEUR Spot Exchange Rate CHFEUR
USD/EUR USDEUR Spot Exchange Rate USDEUR
USD/JPY USDJPY Spot Exchange Rate USDJPY
Precious Metals Bloomberg Precious Metal Subindex BCOMPR
Energy Bloomberg Energy Subindex BCOMEN
Industrial Metals Bloomberg Industrial Metals Subindex BCOMIN
Agriculture Bloomberg Agriculture Subindex BCOMAG
Grains Bloomberg Grains Subindex BCOMGR
Softs Bloomberg Softs Subindex BCOMSO
Livestock Bloomberg Livestock Subindex BCOMLI
VIX CBoe Volatility Index VIX
VSTOXX EURO STOXX 50 Volatility Index V2X
CDX High Yield Markit CDS North America High Yield
iTraxx Crossover Markit iTraxx Europe Crossover Index
Bitcoin CME CF Bitcoin Reference Rate BRR
Ethereum CME CF Ether Reference Rate ETHUSDRR
Gold Spot Gold US Dollar Spot XAU
Silver Spot Silver US Dollar Spot XAG
Dictionary of some abbreviationsLast 1D Last 1 DayLast 1W Last 1 WeekLast 1M Last 1 Month∆1D Change in value over the last day∆1W Change in value over the last week∆1M Change in value over the last month∆year to Date Change in value since the end of last year
For Equity Indices as the last available Close Price of the index at the as of dateFor Futures, it is the settlement price of the future for the as of date
For Professional Clients Only
WisdomTree MARKET UPDATE
24 February 2022
Source: Bloomberg, WisdomTree. As of 24 February 2022
Appendix
WisdomTree.com n +44 (0) 207 448 4330
For Discount to NAVs and Bid Offer Spread Analysis, we consider the 5 largest ETPs in their Asset Class/Asset for
US domiciled and Europe domiciled.Net Position AUM is the sum of the AUM in each ETP multiplied by its leverage factor (which may be either
negative or positive). A negative figure indicates investors are net short.Net Position Flow is the change in the Net Position AUM that is not due to price changes and indicates whether
investors are bullish (net long) or bearish (net short) after taking leverage factor into account.
CDX HY CDSI GEN 5Y SPRD
ITRX XOVER CDSI GEN 5Y
Closing Price
13
WisdomTree.com n +44 (0) 207 448 4330
For Professional Clients Only
Important Information
Communications issued in the European Economic Area (“EEA”): This document has been issued and
approved by WisdomTree Ireland Limited, which is authorised and regulated by the Central Bank of Ireland.
Communications issued in jurisdictions outside of the EEA: This document has been issued and approved by
WisdomTree UK Limited, which is authorised and regulated by the United Kingdom Financial Conduct Authority.
WisdomTree Ireland Limited and WisdomTree UK Limited are each referred to as “WisdomTree” (as applicable).
Our Conflicts of Interest Policy and Inventory are available on request.
For Professional Clients Only. The information contained in this document is for your general information
only and is neither an offer for sale nor a solicitation of an offer to buy securities or shares. This document
should not be used as the basis for any investment decision. Investments may go up or down in value and
you may lose some or all of the amount invested. Past performance is not necessarily a guide to future
performance. Any decision to invest should be based on the information contained in the appropriate
prospectus and after seeking independent investment, tax and legal advice.
This document is not, and under no circumstances is to be construed as, an advertisement or any other step in
furtherance of a public offering of shares or securities in the United States or any province or territory thereof.
Neither this document nor any copy hereof should be taken, transmitted or distributed (directly or indirectly) into
the United States.
This document may contain independent market commentary prepared by WisdomTree based on publicly
available information. Although WisdomTree endeavours to ensure the accuracy of the content in this document,
WisdomTree does not warrant or guarantee its accuracy or correctness. Any third party data providers used to
source the information in this document make no warranties or representation of any kind relating to such data.
Where WisdomTree has expressed its own opinions related to product or market activity, these views may
change. Neither WisdomTree, nor any affiliate, nor any of their respective officers, directors, partners, or
employees accepts any liability whatsoever for any direct or consequential loss arising from any use of this
document or its contents.
This document may contain forward looking statements including statements regarding current expectations or
beliefs with regards to the performance of certain assets classes and/or sectors. Forward looking statements are
subject to certain risks, uncertainties and assumptions. There can be no assurance that such statements will be
accurate and actual results could differ materially from those anticipated in such statements. WisdomTree
strongly recommends that you do not place undue reliance on these forward-looking statements.
None of the index providers of the products referred to herein nor their licensors make any warranty or
representation whatsoever either as to the results obtained from use of the relevant indices and/or the figures at
which such indices stand at any particular day or otherwise. None of the index providers shall be liable to any
person for any errors or significant delays in the relevant indices nor shall be under any obligation to advise any
person of any error or significant delay therein.
WisdomTree MARKET UPDATE
24 February 2022