Embed Size (px)
Citation preview
-R120 649 A STUDY OF THE DEFECTS PRODUCED BY THE GROMTH POST 1/1TREATMENT AND FABRICAT..(U) OKLAHOMA STATE UNIVSTILLWATER DEPT OF PHYSICS L E HALLIBURTON ET AL.
UNCLASSIFIED AUG 82 RADC-TR-82-2i3 F19628-88-C-88B6 F/G 26/6 , NLEEEE/Ill/I/iE/////I//I/I//IEI/////////II////E///I////E/I//////I////l
l////l I ,ND
17-5- =7 7
11 0 I 1.0 M
- U-2-m "I , 1.. ,,1,- I.
I* U
[25 1.25 114 1.61"511.416
MICROCOPY RESOLUTION TEST CHART
MICROCOPY RESOLUTION TEST CHART NATIONAL BUREAU OF STANDARO-1963-A
NATIONAL BUREAU OF STANDARDS-1963-A
EM8
IIn
MICROCOPY RESOLUTION TEST CHART* .5. "NATIONAL BUREAU OF STANDARO -19e3--A r....
1/ I1= 1.5 164I.,
MICROCOPY RESOLUTION TEST CHART MICROCOPY RESOLUTiON TEST C4MT
NATNAL BUREAu OF STANOAIS-Ig63-A NATIONAL BUREAU OFB-,EAUlriNlAOC-lgA
SI ml. is ----
L "
RADC-TR-82-213S interim Report
August 1962
loA STUDY OF THE DEFECTS PRODUCED BY0 THE GROWTH, POST TREATMENT, AND
FABRICATION OF OUARTZ DEVICES
Okiahoma State University
Larry I. HallburtonJoel J. MartinWilliam A. Sibley
APPRVE FOR PMEX RELEM 915 IWN US
ROME AIR DEVELOPMENT CENTERAir Force Systems Command
Griffin Air Force Base, NY 13441
82~82 10 25 051
45~
41.r
I~ Al
ZY,,
NJ 44'
,~ *,0AW. P.
lee,*S
I'AW
It~ A
V ;IwOC
InA~
*vp MV,.
tw
e44:
- -; . ,
UNCLASSIFIEDSECURITY CLASSIFI.CATION OF TMIS PAGE (Whm,D ew iEnered)_
READ INSTRUCTIONSREPORT DOCUMENTATION PAGE BEFORE COMPLETING FORM
1REPOR NUMBER .OVT ACCESSON. RECIPI ENT'S CATALOG NUMBER
RADC-TR-82-213 ______________o____._
4. TITLE (mIEaSuleie) S. TYPE OF REPORT A PERIOD COVERED
A STUDY OF THE DEFECTS PRODUCED BY THE GROWTH, Interim Report
POST TREATMENT AND FABRICATION OF QUARTZ AprIl 81 - March 82DEVICES__.__-_N/A
7c AUTHOR(s) 8. CONTRACT O GRANT NUMBIERI(s)Larry E. HalliburtonJoel J. Martin -80-C-0086F19628-0C06William A. Sibley
S. PERFORMING ORGANIZATION NAME AND ADDRESS 10. PROGRAM ELEMENT. PROJECT. TASKOklahoma State University AREA & WORK UNIT NUMBERSO h S e i s61101FDepartment of Physics 2306J135Stillwater OK 74078
I I. CONTROLLING OFFICE NAME AND AORESb 12. REPORT DATE
Rome Air Development Center (ESM) August 1982Hanscom AFB MA 01731 ,).Nu.BROF PAGES76
14. MONITORING AGENCY NAME II ADDRISS'll d/ffefl be Cuontrafilng Office) IS. SECURITY CLASS. (of this repo t)
Same UNCLASSIFIEDIS&E OCL ASS Ir CATION/ DOWN GRACING
1S. OISTRIBUTION STATEMENT (of th. R.Pw)
Approved for public release; distribution unlimited.
17. OISTRIBUTION STATEMENT (of the obestact Wtered In Stock 20. II differe No Rep0e1)
Same
II. SUPPLEMENTARY NOTES
RADC Project Engineer: Alton F. Armington (ESM)
IS. KEY WORDS (Caefive on reverse side It necessary rf ildse lr i MIV ch iwnMbW)
Quartz Aluminum VacanciesAcoustic Loss Alkali Intersitials X-RayEPR IR Absorption Luminescence
SElectrodiffusion Sweeping
1 20. ABSTRACT (Calinue an reverse 810o It necessary end lentl)? bF block e otbo)
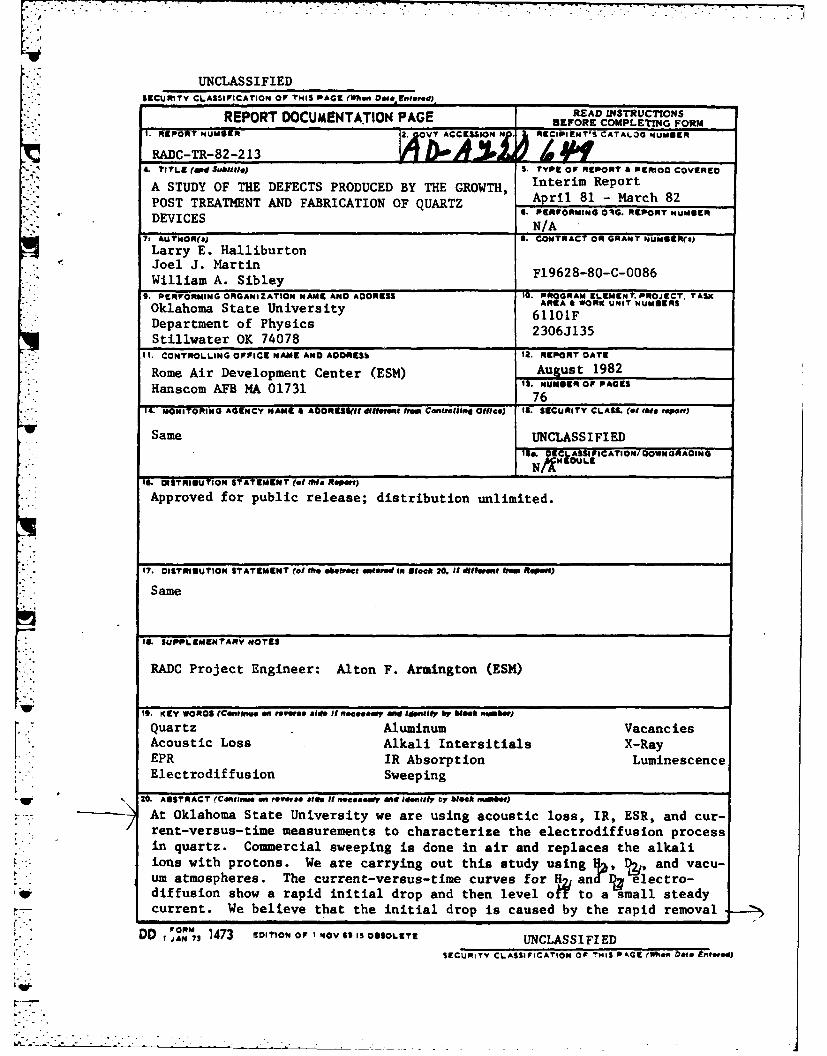
"---- At Oklahoma State University we are using acoustic loss, IR, ESR, and cur-rent-versus-time measurements to characterize the electrodiffusion processin quartz. Commercial sweeping is done in air and replaces the alkaliions with protons. We are carrying out this study using 1. D. and vacu-um atmospheres. The current-versus-time curves for H andI electro-
6* diffusion show a rapid initial drop and then level off to a small steadycurrent. We believe that the initial drop is caused by the rapid removal
r~~ool T3l-?ow or I Nov ss Is OBrSOLETErDD JAN% 1473 NsO UNCLASSIFIEDSECURITY CL-ASSIFICATION OF TNIS PAGE (Whin Dee Ente*d)
UNCLASSIFIEDSgCURItY CLAUICATION OP THI PAGC5(h 1 2800 2aaaed)
of the alkali iois.; For alkali sweeps, steady currents are observed andonly small lectricfields ara required. Acoustic loss measurements ver-ify that N d L can be readily interchanged. The results for are,
belaed long as) rpaenat this time, uncertain. An initial vacuum electrolysis run showed thatthe current stopped after a short time, and subsequent IR and ESR testsshowed that only a small amount of hydrogen was swept into the sample. Webelieve that the electrodiffusion can continue on *ly as long as replacement
ions (in this case protons) are brought into the sample. A study of theacoustic loss spectrum of a series of 5 MHz 5th overtone AT-cut resonatorblanks all fabricated from the same bar of Premium Q grade quartz as afunction of electrolysis and irradiation is nearly complete a-sweptsamples show a very large 54 K loss peak. This shows that i s-grownquartz most of the A. sites are compensated by Li+ . No loss p ks wereobserved at temperatures less than 1000C which could be attrlbut -d to theAt-Li+ or At-OH centers. Irradiation at room temperature removed he Naloss peak and produced peaks at 25 K, 100 K, and 135 K. An isochro alanneal study shows that these three peaks are caused by the At-hole nter.The work on K-swept material is not yet complete.
The x-ray induced "blue" emission from commercially available, high-qualitysynthetic quartz has been studied between 80 and 300 K. Three overlappingbands, each having a different quenching temperature, have been experiment-ally resolved in the as-grown crystals. These bands peak at 440 nm, 425nm, and 380 nm; their half-widths are 0.64 eV, 0.75 eV, and 0.92 eV; and
*they thermally quench in the 120-160 K, 170-210 K, and 220-270 K regions,respectively. An intense electron irradiation at room temperature or anelectrodiffusion (sweep) in a hydrogen atmosphere eliminates the band at380 nm. Our results suggest that the 380 nm band arises from recombina-tion of an electron with a hole trapped adjacent to an alkali-compensatedaluminum (i.e., and At-M+ center). The origins of the bands at 440 nm and425 nm remain unknown. As an application of these results, a screeningtest is described 4hich would maintain quality control during selectionof quartz bars for use in precision frequency control devices.
Electron spin resonance has been used to study three similar, but distinct,S = 1 defects (labeled E" centers) in high-quality synthetic quartz crys-tals. These centers are produced by electron irradiation and their concen-trations depend on the irradiation temperature, the nature of previous ir-radiations and thermal anneals, and whether the sample is swept or unswept.the radiation-induced mobility of interstitial alkali ions (Li+ and Na+)correlates with the production of E" centers.
A series of RADC-grown quartz stones have been run through our ESR test for
aluminum content. Pure Z-growth samples from several stones showed lessthan 1 ppm aluminum. The OH bands at 3585, 3437, and 3400 cm-1 which arepresent in as-grown quartz have been measured as a function of the growthrate for stones grown at RADC. The 3367 cm-1 At-OHhas also been measuredfor these samples after a room temperature irradiation. All of these OH-related defects increase markedly for stones grown at rates faster than0.7mm/day.
UNCLASSIFIEDS&CURIY CL.ASSIFICAYION OF W 3AGg hn DOM Ent*m*)
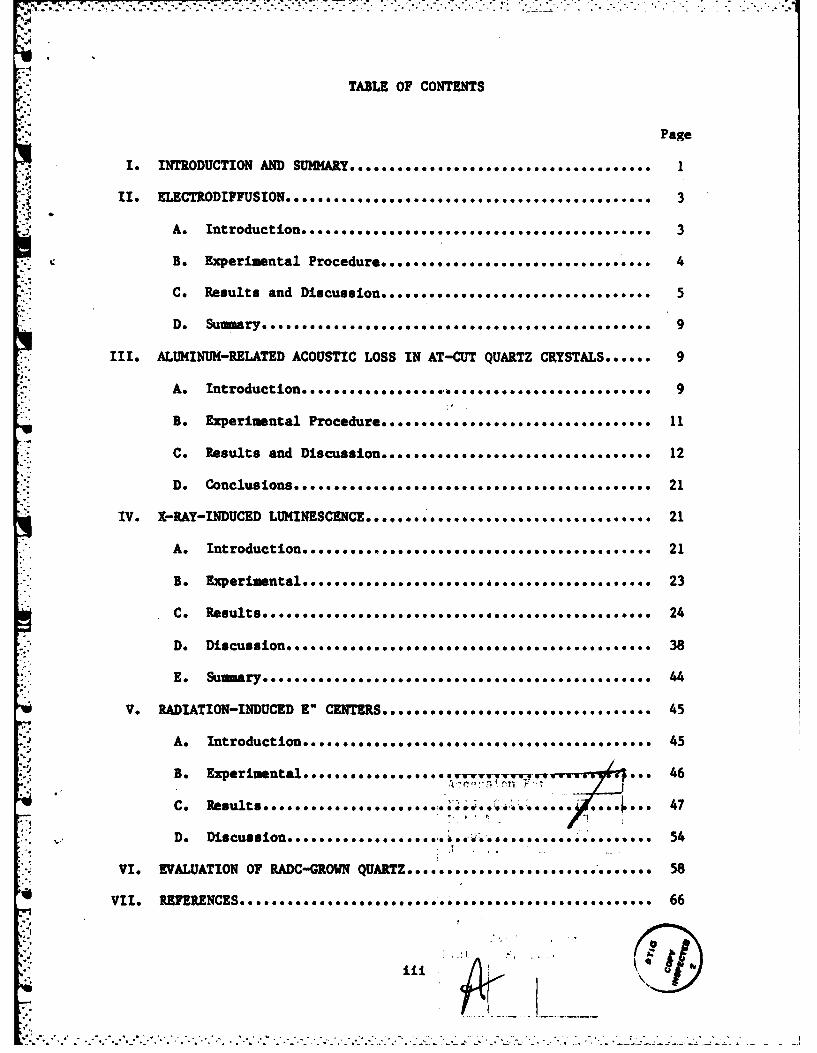
TABLE OF CONTENTS
Page
I* INTRODUCTION AND SUIQIARY. . .... .... . ....... .. *000 *****v**... 1
II. ELECTR.ODIFFUSION... .00... ................ 3.AA. Introduction .......... ................ 3
-:B. Experimental Procedure.................................. 4
C. Results and Discuss.............. .................. .... 5
III. ALUMINUM-RELATED ACOUSTIC LOSS IN AT-CUT QUARTZ CRYSTAL......* 9
A *........... Introduction.. .... ........ 9
B. Experimental Procedure.................................. 11
C.* Results and Discussion... ..................... o......... 12
IV. X-RAY-INDUCED LUMINESCENCE..*............................... 21
A..
V.RDA ............ ".CENTERS .................. ooooeoo.... .... 45
VI.* EVALUATION OF RADC-GROWN QUARTZ ........................... o.... 58
V119R~nENC~eseesosoooo~oooooeoiii6
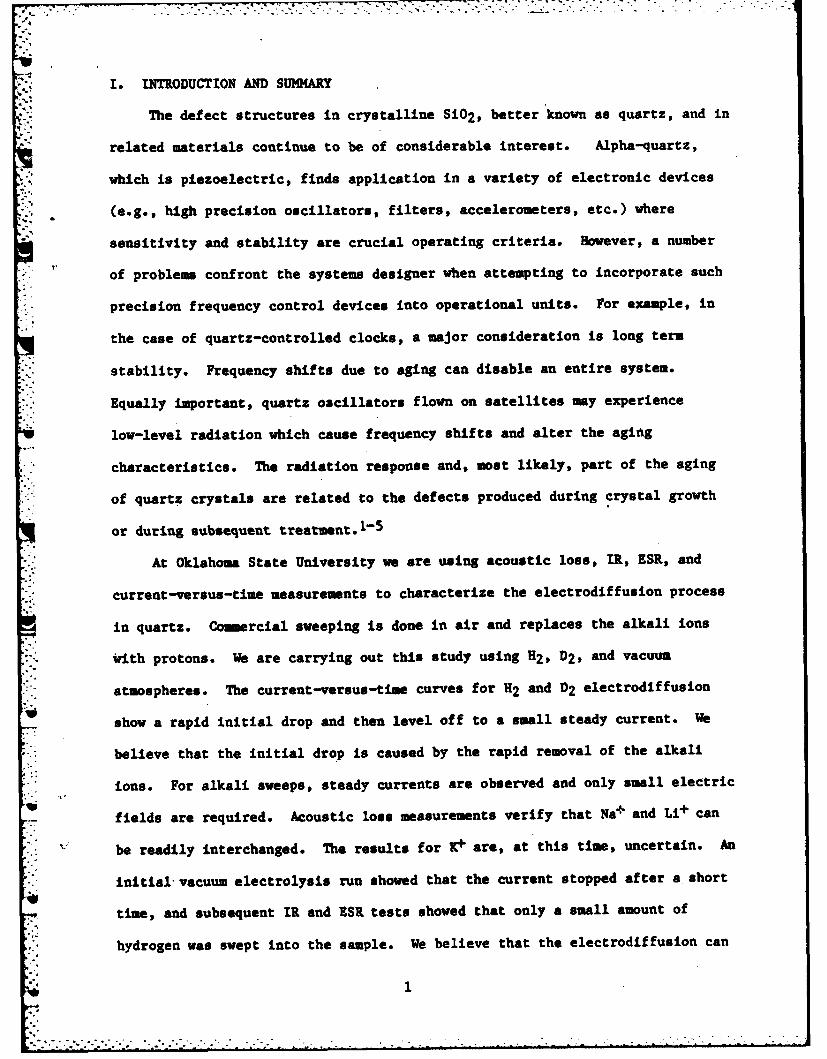
I.* INTRODUCT ION AND SUMMARY
The defect structures in crystalline SI02, better known as quartz, and in
related materials continue to be of considerable interest. Alpha-quartz,
which is piezoelectric, finds application in a variety of electronic devices
(e.g., high precision oscillators, filters, accelerometers, etc.) where
sensitivity and stability are crucial operating criteria. However, a number
of problems confront the systems designer when attempting to incorporate such
precision frequency control devices into operational units. For example, in
the case of quartz-controlled clocks, a major consideration is long term
stability. Frequency shifts due to aging can disable an entire system.
. Equally important, quartz oscillators flown on satellites may experience
low-level radiation which cause frequency shifts and alter the aging
characteristics. The radiation response and, most likely, part of the aging
of quartz crystals are related to the defects produced during crystal growth
or during subsequent treatment.1-5
At Oklahoma State University we are using acoustic loss, II, ESR, and
current-versus-time measurements to characterize the electrodiffusion process
in quartz. Commercial sweeping is done in air and replaces the alkali ions
iwith protons. We are carrying out this study using H2 , D2 , and vacuum
atmospheres. The current-versus-time curves for H2 and D2 electrodiffusion
show a rapid initial drop and then level off to a small steady current. We
believe that the initial drop is caused by the rapid removal of the alkali
ions. For alkali sweeps, steady currents are observed and only small electric
fields are required. Acoustic loss measurements verify that Na+ and Li+ can
be readily interchanged. The results for K+ are, at this time, uncertain. An
initial vacuum electrolysis run showed that the current stopped after a short
time, and subsequent IR and ESR tests showed that only a small amount of
hydrogen was swept into the sample. We believe that the electrodiffusion can
om~o1
J .P. '_
4.
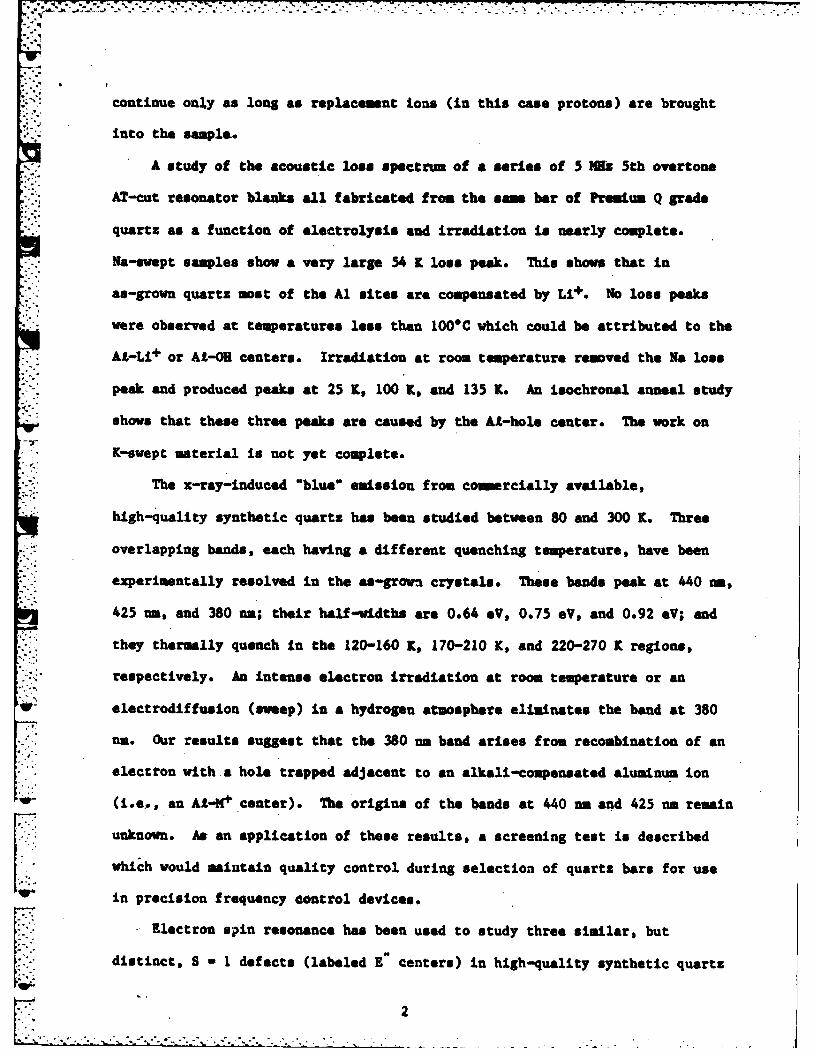
continue only as long as replacement ions (in this case protons) are brought
into the sample.
N." A study of the acoustic loss spectrum of a series of 5 IE 5th overtone
"s: AT-cut resonator blanks all fabricated from the same bar of Premium Q grade
*quartz as a function of electrolysis and irradiation is nearly complete.
Na-swept samples show a very large 54 K loss peak. This shows that in
as-grown quartz most of the Al sites are compensated by LI+. No lose peaks
were observed at temperatures less than 100"C which could be attributed to the
At-Li+ or AL-OH centers. Irradiation at room temperature removed the Na loss
peak and produced peaks at 25 K, 100 K, and 135 K. An isochronal anneal study
*shows that these three peaks are caused by the A-hole center. The work on
K-swept material is not yet complete.
The x-ray-induced "blue" emission from commercially available,
high-quality synthetic quartz has been studied between 80 and 300 K. Three
overlapping bands, each having a different quenching temperature, have been
experimentally resolved in the as-grova crystals. These bands peak at 440 n,
425 nm, and 380 na; their half-widths are 0.64 eV, 0.75 eV, and 0.92 eV; and
* . they thermally quench in the 120-160 K, 170-210 K, and 220-270 K regions,
respectively. An intense electron irradiation at room temperature or an
electrodiffusion (sweep) in a hydrogen atmosphere eliminates the band at 380
*i na. Our results suggest that the 380 nm band arises from recombination of an
electron with a hole trapped adjacent to an alkali-compensated aluminum ion
V (i.e,, an At-# center). The origins of the bands at 440 nm and 425 nm remain
unknown. As an application of these results, a screening test is described
which would maiutain quality control during selection of quartz bars for use
in precision frequency control devices.
Electron spin resonance has been used to study three similar, but
distinct, S 1 defects (labeled E" centers) in high-quality synthetic quartz
2N>. . . . . . . . . . . . -
crystals. These centers are produced by electron irradiation and their
concentrations depend on the irradiation temperature, the nature of previous
irradiations and thermal anneals, and whether the sample is swept or unswept.
The radiation-induced mobility of interstitial alkali ions (Li+ and Na+ )
correlates with the production of E centers.
A series of RADC-grown quartz stones have been run through our ESR test
for aluminum content. Pure Z-growth samples from several stones showed less
than 1 ppm aluminum. The OH bands at 3585, 3437, and 3400 cm'- which are
present in as-grown quartz have been measured as a function of the growth rate
for stones grown at RADC. The 3367 cm - AL-OH- has also been measured for
these samples after a room temperature irradiation. All of these OH-related
defects increase markedly for stones grown at rates faster than 0.7um/day.
II. ELECTRODIFFUSION
A. Introduction
Interstitial alkali ions and protons are trapped by substitutional
" aluminum ions5 and, quite possibly, by other defects in alpha-quartz. These
interstitials lie in the large c-axis channels and they can diffuse along
the channels when thermally liberated from their traps. This thermal diffusion
*must be at least partly responsible for the annealing behavior of radiation
induced defects.6 ,7 ,8 A technologically important result occurs when an
electric field applied parallel to the c axis is used to force these
interstitial ions out of the sample and replace them with others. King,9
making use of this characteristic, was among the first to develop the
electrodiffusion (sweeping) process as a method for changing the concentration
of specific interstitial cations (i.e., H+ , Li+ , Na+ , etc.) within a given
quartz crystal. The process was later used by Katz1 0 to "sweep" hydrogen and
alkali ions into and out of quartz. Fraser 11 described the basic technology
3
A..
for the selective sweeping of alkalis and Kreft 12 has shown that holes can be
swept into quartz if the process Is carried out in vacuum at temperatures
above the phase transition. Brown, O'Conner, and Armington 13 have
investigated alkali steping and the use of an inert gas atmosphere. A number
of studies have shown that the radiation hardness of oscillators is
significantly enhanced if electrodiffusion is used to replace the alkalis in
quartz with protons. 2 ,14 ,15 Recently, jain and Nowick 1 6 have investigated
ionic conductivity in both synthetic and natural quartz.
A systematic study of the electrolysis process in quartz is presently
underway. The interstitial alkali ions, which act as charge compensators for
the substitutional A1 3+ ions in as-grown quartz, are thermally released from
the aluminim traps at high temperature and then drift along the relatively
-* large c-axis channels. If an electric field is applied parallel to the c axis
*and if a source of replacement ions is present, the alkali ions originally in
*the crystal can be removed. Conventional commercial sweeping is done in air
* and the replacement ions are protons, apparently originating in the water
vapor contained in the surrounding air. On the other hand, if a salc such as
NaCl is first deposited at the positive electrode then the sample can be doped
with that particular alkali.
B. Experimental Procedure
The present sweeping system at Oklahoma State University consists of a
vitreous silica jacket evacuated with a diffusion pump. The jacket is heated
by an external clamshell furnace. This system allows us to electrolyze quartz
either in a controlled atmosphere or in a vacuum on the order of 2 x 10- to 5
k 10-6 Torr. The sample Is usually mounted between graphite clamps. We have
also assembled a copper-gasketed turbomolecular-pumped system with an internal
heater for sweeping studies at pressures on the order of 10-8 Torr. Work with
this latter system has been delayed because of a pump malfunction.
'-4
°o. o, . o, • . .. - o , . . .
-.. 7 7 -
Our present sweeping procedure begins by vapor depositing gold electrodes
on the two sample faces, which is a Z plate in the case of optical and ESR
experiments or is a plano-convex AT-cut resonator blank in the case of
acoustic loss studies. Then the electrolysis is carried out in the desired
atmosphere at a temperature between 485 and 490*C. During sweeping, the
current through the sample is recorded as a function of time. In order to
sweep Li, Na, or K into a crystal, the appropriate salt is vapor deposited
first and then the gold electrodes are deposited. The graphite clamps are
baked-out under vacuum before the alkali or vacuum electrolysis is performed.
- All such alkali sweeping is done in a vacuum of 5 x 10⁻⁶ Torr or better.
Electric fields of 15 to 30 volts/ca readily sweep the alkali ions into a
sample, whereas much higher fields of approximately 1000 to 3000 volts/cm are
used in the hydrogen and vacuum electrolysis.
C. Results and Discussion
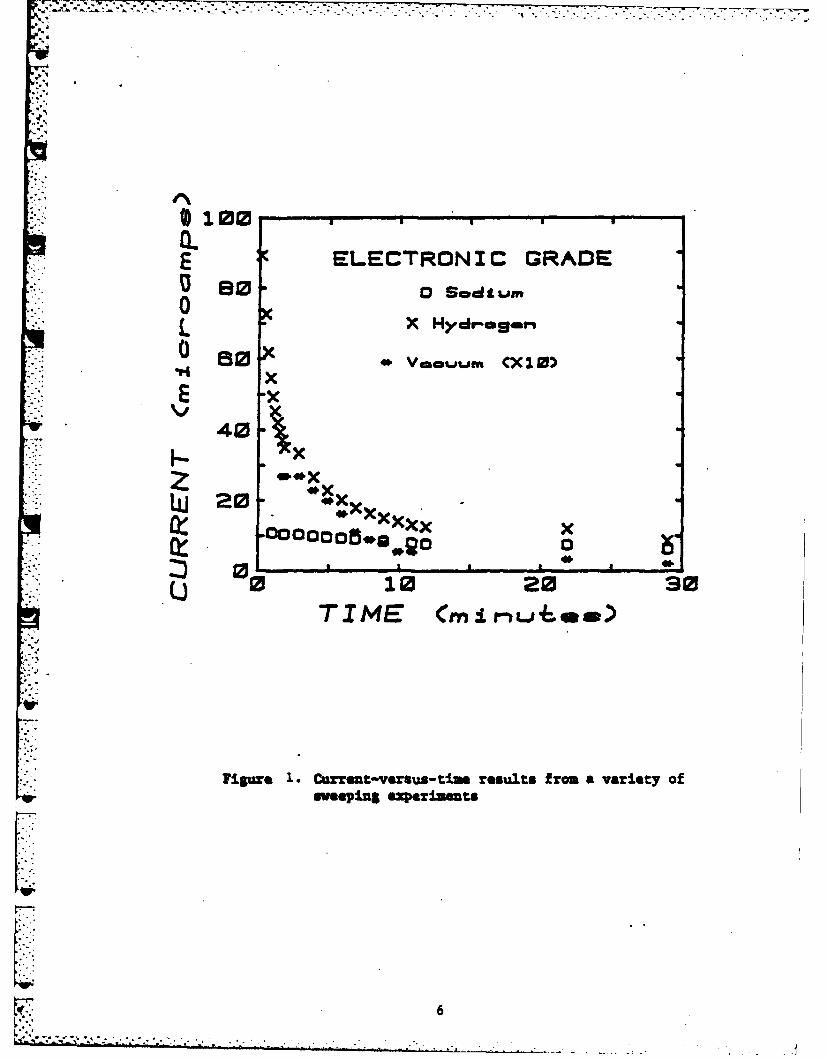
Figure 1 shows the current-versus-time curves obtained by sweeping with
Na, H2 , and in vacuum. Similar curves were found for.Li, K, and D2 . The
samples used in this study were Z-plate optical samples and were all cut from
Electronic Grade bar EG-B. The alkali sweeps were terminated after
approximately 30 minutes to prevent depletion of the salt-source film at the
positive electrode, while the H2 , D2 , and vacuum sweeps were run for 16 to 20
hours. In the case of the vacuum sweep, the current went essentially to zero
after about 20 minutes, which indicates that the electrolysis stopped at that
point. Following the sweeps, infrared absorption spectra were run on all of
the samples. Table 1 compares the height of the 3367 cm'- band (due to Al-Or
centers) for the different runs.
;'i> "S
....................... . .
a2M , • . . .. .-.
0100..
EELECTRONIC GRADES80 Sowaum
C .XX H>,u--ein..0 80 V=2-. ,.m cX10
Ix
40
zxLU 20 x
.: ?: I.- xOr. 0 5 *go 0
0I0 10 20 s
TIME C i mLJm)
i Yur 1. Cuent-ve u sUti rsults from a variety of
weeping experiments
I:726
------------------------------------.-
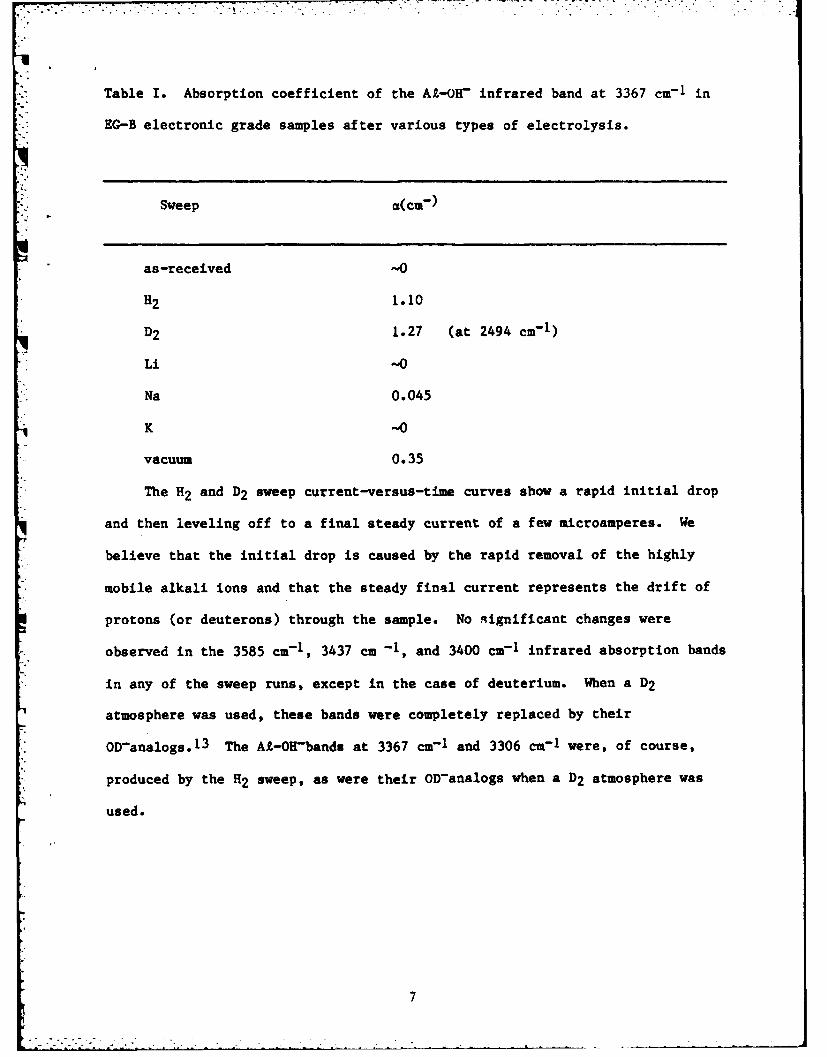
Table I. Absorption coefficient of the At-OR- infrared band at 3367 cm- 1 in
EG-B electronic grade samples after various types of electrolysis.
Sweep a( cm)
as-received -0
H2 1.10
D2 1.27 (at 2494 cm- 1)
Li -0
Na 0.045
K -
vacuum 0.35
The H2 and D2 sweep current-versus-time curves show a rapid initial drop
and then leveling off to a final steady current of a few microamperes. We
believe that the initial drop is caused by the rapid removal of the highly
mobile alkali ions and that the steady final current represents the drift of
protons (or deuterons) through the sample. No significant changes were
- observed in the 3585 cm- , 3437 cm -1, and 3400 cm-I infrared absorption bands
" in any of the sweep runs, except in the case of deuterium. When a D2
atmosphere was used, these bands were completely replaced by their
-ODanalogs.13 The At-OH-bands at 3367 cm- 1 and 3306 cm-I were, of course,
produced by the H2 sweep, as were their OD-analogs when a D2 atmosphere was
used.
7
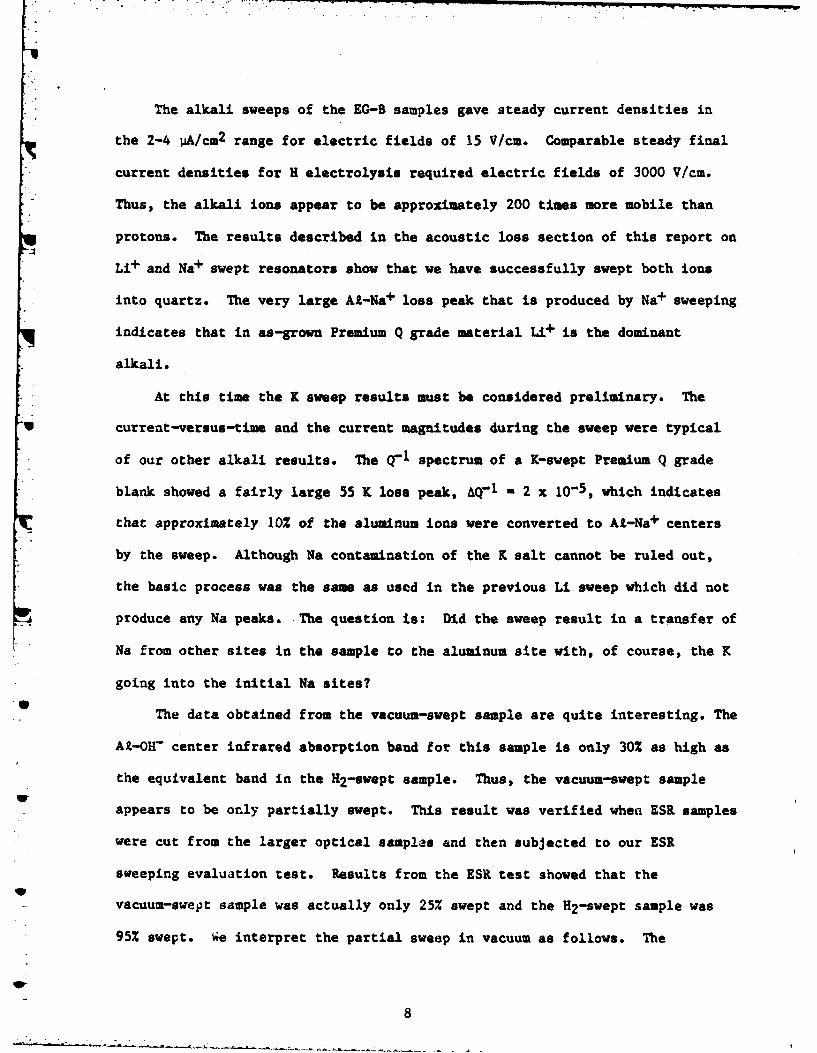
The alkali sweeps of the EG-B samples gave steady current densities in
the 2-4 pA/cm2 range for electric fields of 15 V/cm. Comparable steady final
current densities for H electrolysis required electric fields of 3000 V/cm.
Thus, the alkali ions appear to be approximately 200 times more mobile than
protons. The results described in the acoustic loss section of this report on
Li+ and Nat swept resonators show that we have successfully swept both ions
into quartz. The very large At-Na4 loss peak that is produced by Nat sweeping
indicates that in as-grown Premium Q grade material Lit is the dominant
alkali.
At this time the K sweep results must be considered preliminary. The
-U current-versus-time and the current magnitudes during the sweep were typical
of our other alkali results. The Q-1 spectrum of a K-swept Premium Q grade
blank showed a fairly large 55 K loss peak, AQ- 1 - 2 x 10- 5 , which indicates
that approximately IOZ of the aluminum ions were converted to At-Na+ centers
by the sweep. Although Na contamination of the K salt cannot be ruled out,
the basic process was the same as used in the previous Li sweep which did not
produce any Na peaks. The question is: Did the sweep result in a transfer of
Na from other sites in the sample to the aluminum site with, of course, the K
going into the initial Na sites?
The data obtained from the vacuum-swept sample are quite interesting. The
AI-OH- center infrared absorption band for this sample is only 30% as high as
the equivalent band in the H2-swept sample. Thus, the vacuum-swept sampleV
appears to be only partially swept. This result was verified when ESR samples
were cut from the larger optical samples and then subjected to our ESR
sweeping evaluation test. Results from the ESR test showed that the
vacuum-swept sample was actually only 25% swept and the H2-swept sample was
95% swept. we interpret the partial sweep in vacuum as follows. The
8
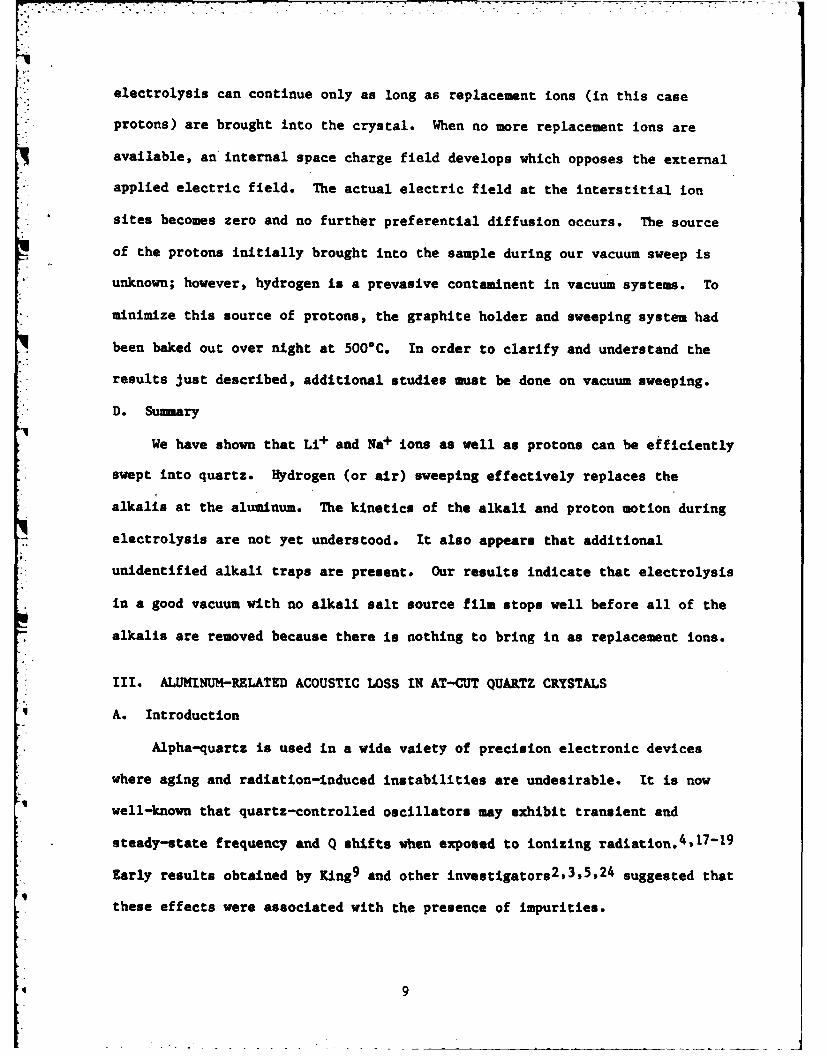
electrolysis can continue only as long as replacement ions (in this case
protons) are brought into the crystal. When no more replacement ions are
available, an internal space charge field develops which opposes the external
applied electric field. The actual electric field at the interstitial ion
*. sites becomes zero and no further preferential diffusion occurs. The source
of the protons initially brought into the sample during our vacuum sweep is
unknown; however, hydrogen is a prevasive contaminent in vacuum systems. To
minimize this source of protons, the graphite holder and sweeping system had
been baked out over night at 5000C. In order to clarify and understand the
results just described, additional studies must be done on vacuum sweeping.
D. Sumary
We have shown that Li+ and Na+ ions as well as protons can be efficiently
swept into quartz. Hydrogen (or air) sweeping effectively replaces the
alkalis at the aluminum. The kinetics of the alkali and proton motion during
-= electrolysis are not yet understood. It also appears that additional
unidentified alkali traps are present. Our results indicate that electrolysis
in a good vacuum with no alkali salt source film stops well before all of the
alkalis are removed because there is nothing to bring in as replacement ions.
III. ALUMINUM-RELATED ACOUSTIC LOSS IN AT-CUT QUARTZ CRYSTALS
q A. Introduction
Alpha-quartz is used in a wide vaiety of precision electronic devices
where aging and radiation-induced instabilities are undesirable. It is now
well-known that quartz-controlled oscillators may exhibit transient and
steady-state frequency and Q shifts when exposed to ionizing radiation.4 ,t7- 19
Early results obtained by King9 and other investigators 2 ,3 ,5 ,2 4 suggested that
these effects were associated with the presence of impurities.
4 9
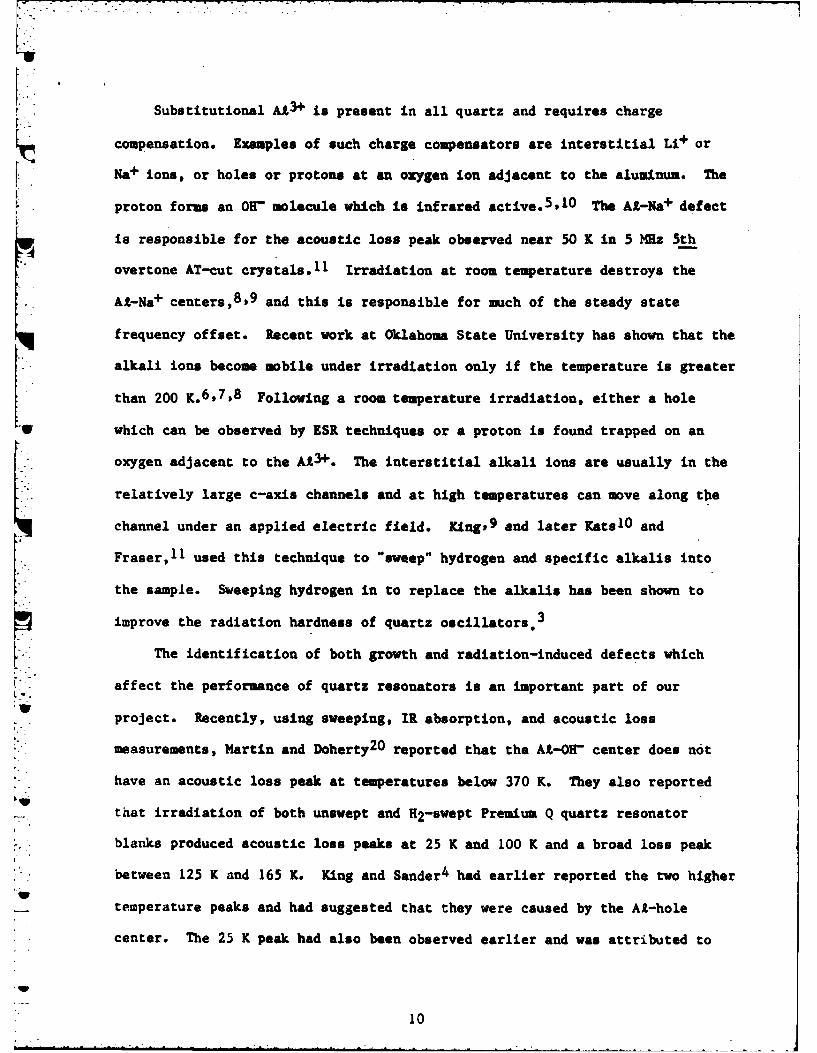
Substitutional A 3 is present in all quartz and requires charge
compensation. Examples of such charge compensators are interstitial Li+ or
Na+ ions, or holes or protons at an oxygen ion adjacent to the aluminum. The
proton forms an O- molecule which is infrared active.5 ,10 The Al-Na+ defect
is responsible for the acoustic loss peak observed near 50 K in 5 MHz 5th
overtone AT-cut crystals. 11 Irradiation at room temperature destroys the
*. AX-Na+ centers,8'9 and this is responsible for much of the steady state
frequency offset. Recent work at Oklahoma State University has shown that the
*alkali ions become mobile under irradiation only if the temperature is greater
than 200 K.6 ,7,8 Following a room temperature irradiation, either a hole
V which can be observed by ESR techniques or a proton is found trapped on an
oxygen adjacent to the A13+. The interstitial alkali ions are usually in the
*relatively large c-axis channels and at high temperatures can move along the
channel under an applied electric field. Iing, 9 and later Kats1O and
Fraser,11 used this technique to "sweep" hydrogen and specific alkalis into
the sample. Sweeping hydrogen in to replace the alkalis has been shown to
improve the radiation hardness of quartz oscillators. 3
The identification of both growth and radiation-induced defects which
affect the performance of quartz resonators is an important part of our
project. Recently, using sweeping, IR absorption, and acoustic loss
- measurements, Martin and Doherty20 reported that the At-Of" center does not
have an acoustic loss peak at temperatures below 370 K. They also reported
that irradiation of both unswept and H2-swept Premium Q quartz resonator
blanks produced acoustic loss peaks at 25 K and 100 K and a broad loss peak
between 125 K and 165 K. King and Sander4 had earlier reported the two higherw
temperature peaks and had suggested that they were caused by the AL-hole
center. The 25 K peak had also been observed earlier and was attributed to
10
changes in the interaction between the resonant vibration of the blank and the
thermal phonons. 1 We report here a comparison of the acoustic loss spectra of
as-received, Li+, Na+, and H+ swept resonators fabricated from the same bar of
Premium Q grade quartz. We also report an isochronal anneal study of the
three loss peaks induced by a room temperature irradiation which shows that
they are associated with the At-hole center.
B. Experimental Procedure
All samples for this study were cut from an unswept pure Z growth Sawyer
Premium Q bar of cultured quartz that has been given an in-house designation
* PQ-E. Samples from this bar have been extensively studied at Oklahoma State
• University using ESR,5 ,7 IR, and acoustic loss techniques. All of these
investigations show that the bar is of high quality but that it contains
somewhat more aluminum (10-15 ppm) than the average Premium Q material (5-8
ppm). Consequently, aluminum-related effects are more readily observed.
Five MHz 5th overtone AT-cut plano convex resonator blanks of the Warner
design were fabricated for this study by K&W Mfg., Prague, OK. The acoustic
loss, Q-, of the resonator blanks was measured by the log decrement method
from 5 to 300 K. The measurements were made in a variable temperature helium
* Dewar with the blanks mounted in a gap holder similar to the one described by
Fraser.1 The blank was driven for 10 me at its series resonant frequency andt
then allowed to freely decay. The decaying rf signal was detected with a
superheterodyne detector and displayed on a variable persistence storage
oscilloscope. The exponential decay times were measured using a window
detector to gate a digital timer.
Electrolysis, or sweeping, was carried out at temperatures of 470-4800C
in a controlled atmosphere system. This system allowed the use of 12, D2, or
* gettered-N2 atmospheres, or an oil-diffusion pumped vacuum of approximately
11
2 x 10⁻⁶ Torr. For the acoustic loss studies, the AT-cut resonator blanks
were directly swept. Vapor-deposited Au electrodes were used. For the Li or
Na sweeping runs, LIC or NaC was vapor deposited on the sample surface and
then an Au electrode was deposited over the salt layer. The Li and Na
* sweeps were carried out in a vacuum better than 5 x 10- 6 Torr. Infrared
absorption scans show that At-OF" centers are present in the H2-swept sample
but not in the alkali swept samples.
Irradiations were carried out at room temperature using 1.7 MeV electrons
from a Van de Graaff accelerator. Typical doses were approximately 2000
J/cm 3 (_108 rads). This dose is not expected to produce significant knock-on
damage, but it has been shown to saturate the At-related defects. The
production of At-OH- centers by the irradiation was measured by a liquid
nitrogen temperature polarized iWrared scan on the resonator blank.
C. Results and Discussion
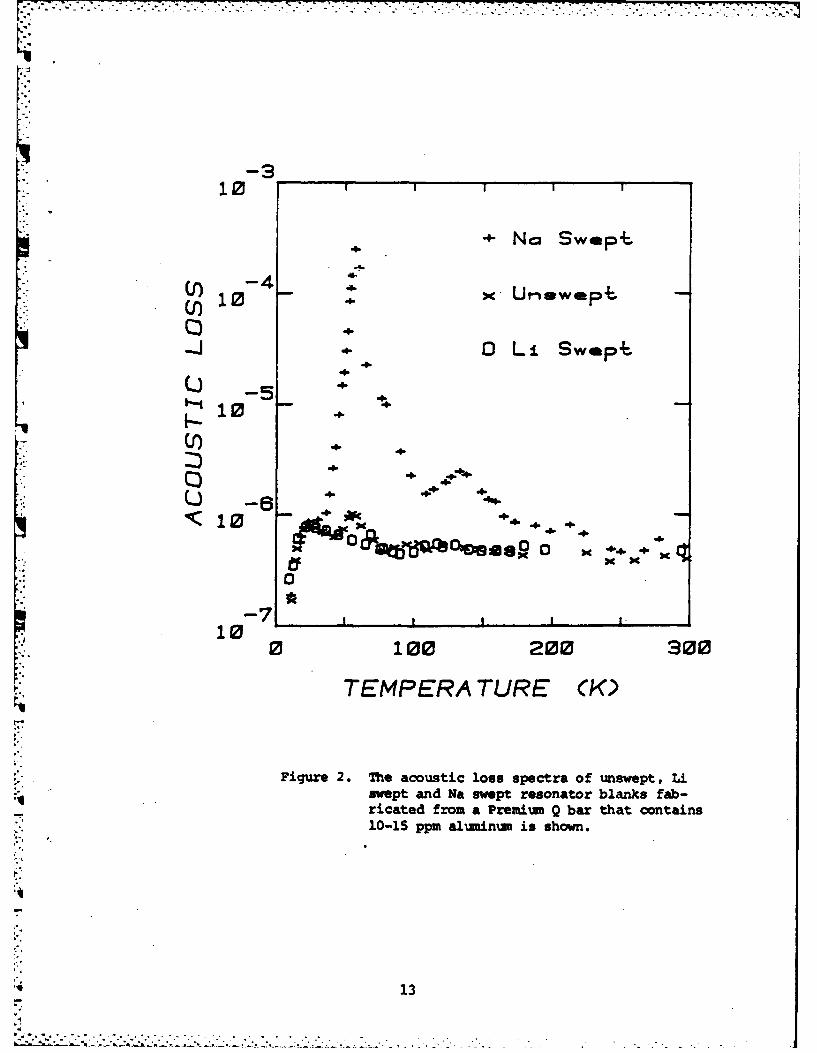
Figure 2 compares the acoustic loss, Q-l, spectra for unswept, Li-swept,
and Na-swept PQ-E series resonator blanks. The unswept blank shows a small
Al-Na+ loss peak at 55 K with a height Q"1 of approximately 0.5 x 10⁻⁶. The
Li sweep removed this peak and did not introduce any new peaks. The Na-swept
* blank showed a very large 55 K peak with Q-1 - 2 x 10 4 as shown in Figure 2.
U Since the material from which these blanks were fabricated contains 10 to 15
ppm aluminum, we conclude that the concentration, C, of At-Na+ centers is
given by
C = [5 (1 20Z) x 104 ]&Q- 1
where C is in ppm and AQ- 1 Is the height of the 55 K AL-Na+ loss peak, thus,
the unswept PQ-E blank probably contains about 0.3 ppm A-Na+ centers; the
remaining 10 to 15 pp. of aluminum must be compensated by Li+. Since the
12. . .
10
" No Swept.
10 X.,nIa +
o.'4.-j 4 0 Li Swap.
U -5:
~~~~10 - 7 n nn.* ~10 4.0.100 4.
100
0 100 200 300
TEMPERA TURE (K)
Figure 2. The acoustic loss spectra of unswept, Liswept and Na swept resonator blanks fab-ricated from a Premium Q bar that contains10-15 ppm aluminum is shown.
13
mineralizer used in growing Premium Q quartz is predominantly NaC03 , the
essentially total exclusion Of Nat from the aluminum sites by the addition of
a small amount of LC03 to the solution is remarkable.22 Since both the
-, - unswept and Li-swept blanks must contain 10-15 ppm At-Li+ centers, we believe
*i: that the AL-Li + center does not couple to the AT-cut thickness-shear mode. An
additional, much smaller, lose peak related to the AL-Na+ center was observed
at approximately 135 K in the Na-swept blank. Park and Nowick23 have also
observed two Na-related peaks in their dielectric loss measurements.
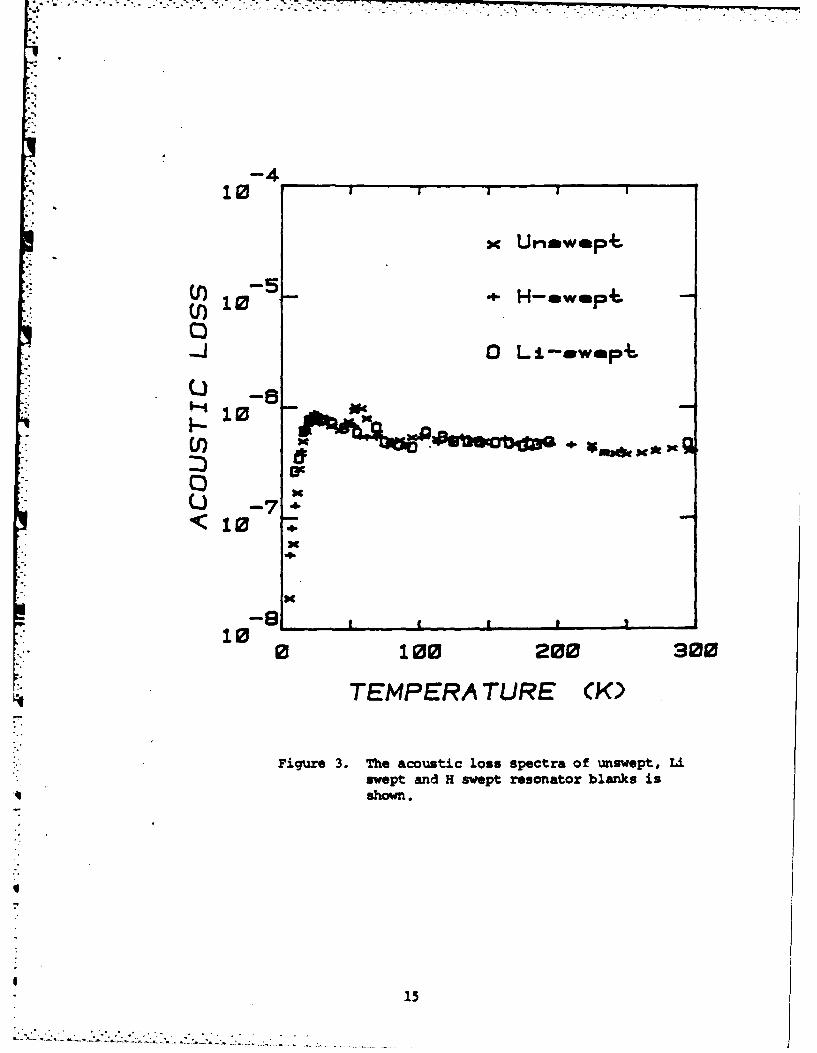
Figure 3 compares the acoustic loss spectra for the unswept, Li-swept,
and H-swept blanks. The results for the Li and H-sweeps are essentially
*identical, as were the results for a D-sweep which were omitted from Fig. 3
'- for clarity. Infrared absorption measurements made at liquid nitrogen
temperature show that the H-swept blank contains 10-15 ppm At-OH- centers.
Thus, it appears that neither the AL-OH- or the AL-OD- centers show
significant acoustical loss peaks at temperatures below about 370 K. It
should be noted that at higher temperatures, the interstitial alkali Lons
* become thermally liberated from the A13+ trapping site and diffuse along the
c -axis channels. This diffusion causes an acoustic loss which increases
exponentially with temperature.1 Upson et &1.24 and Koehler25 have shown
that this high temperature loss is not present in H-swept quartz which
contains no alkali ions, and therefore, must be caused by the alkali
diffusion.
Recently, Martin and Doherty20 reported that irradiation of unswept and
H2 -swept PQ-E resonator blanks at room temperature produced loss peaks at 25 K
and 100 K and a broad loss between 125 and 165 K. The peaks were much larger
in the unswept material thav in the H2-swept blank. The room temperature
*' irradiation also removed the AL-Na loss peak which was present initially in
14
10
x Umftwetp+
10 *H-mwmp+.
0
-8
0C.)
"bQ
74.
!N
-0
"SC
100 100 200 S00
TEMPERA TURE (K)
Figure 3. The acoustic loss spectra of unswept, Liswept and H swept resonator blanks isshown..2
the unswept blank. King and Sander 4 have previously observed the peak at 100
K and the broad loss between 125 K and 165 K. They attributed these loss
peaks to the At-hole center. Martin and Doherty suggested that the 25 K peak
is also due to the At-hole center. Martin et al.26 were able to describe the
. broad loss as a single peak centered at about 135 K.
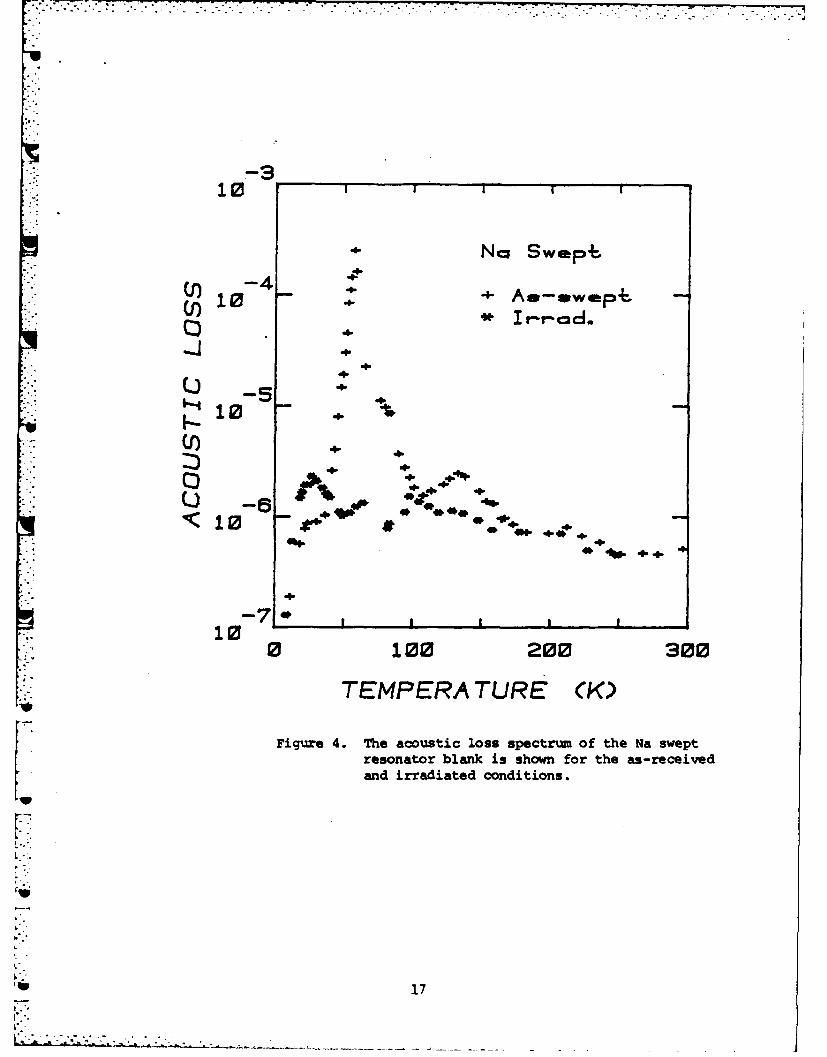
Figure 4 shows the acoustic loss, Q-1, versus temperature spectrum for,
* the Na-swept blank in the as-swept condition and after a room temperature
- irradiation. The irradiation has removed the large 55 K At-Na+ loss peak,
while introducing the 25 K, 100 K, and 135 K peaks. The acoustic loss
*( spectrum for the Li-swept sample after a room temperature irradiation is
*essentially the same as for the Na-swept sample. These three loss peaks are
,* also observed in !.rradiated H-swept resonators fabricated from this same bar.
f. However, their strength is reduced by approximately a factor of five. An
inspection of the results reported by Doherty et al.8 for the acoustic loss of
their Na-swept resonator D14-45DC shows that the 25 K peak is small but
present in their results. D14-45 series quartz has an aluminum content less
than 1 ppm, so we would expect aluminum related loss peaks to be much smaller.
Their Na loss peak is about 0.035 times that of our Na swept PQ-E resonator
- blank. It should also be noted that their resonator was partially H-swept.
V Thus, it appears that these three peaks, and the Na peak as well, scale with
* the aluminum content.
The thermal anneal behavior of the At-hole and AL-OH- centers in unswept
quartz has been studied by Harkes and Halliburton7 and by Sibley et al., 6
respectively. The At-hole centers, as observed by ESR techniques, anneal out
slightly below 300C while the At-OH" center anneals out between 350"C and
q 400*C. These results strongly suggest that the alkali does not return to the
aluminum site until the 3500C to 4000C range is reached. If the three
radiation-induced loss peaks are due to the At-hole center, they should show
16
10
No, Swap...,..
-4 _ 4.• I - . 4- Aml-alwmp+
:.10 -
4.
4.
4441 0 4
0%0. 1-40-
0 100 200 300
TEMPERATURE (K)
Figure 4. The acoustic loss spectrum of the Na sweptresonator blank is shown for the as-receivedand irradiated conditions.
"IP
to 17
'....,....... ... •..,..
'the same annealing pattern as the Al-hole center ESR spectrum. We have
carried out anl isochronal anneal study on the unsvept blank and on the
Li-swept blank. The results for the unswept blank show that the 25 K, 100 K,
and 135 K loss peaks all anneal out at 2700C, as shown in Figure 4. Thus, all
three loss peaks are most likely caused by the At-hole center. When the
anneal is continued to higher temperatures, the AL-Na+ center loss peak
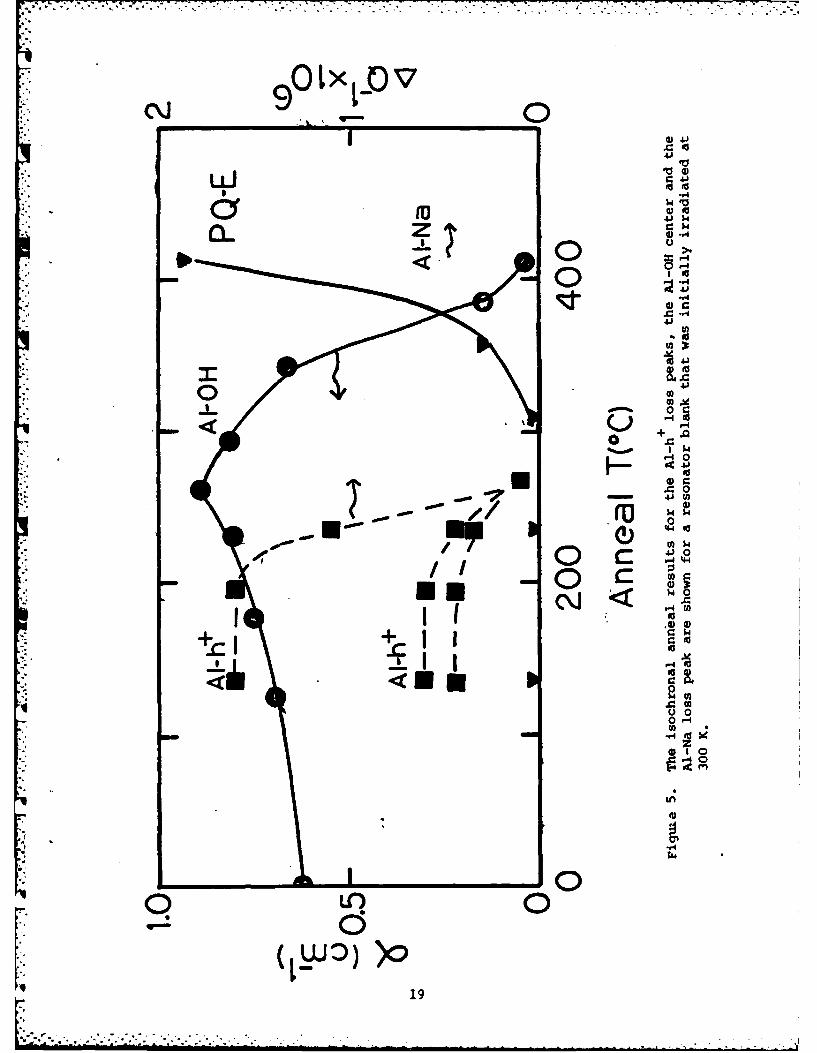
recovers between 350"C and 4000C as shown in Figure 5. The thermal anneal of
*the AL-OH- center, as measured by infrared absorption, in a room
temperature-irradiated unswept optical sample taken from the PQ-E bar is also
. shown in Figure 5. The AL-Of" strength grows slightly when the AL-hole
centers decay and then goes out when the Na+ ions return to the AL sites.
The isochronal anneal study also showed that after a room temperature
irradiation and subsequent 400*C anneal, the 55 K At-Na+ peak in the unswept
blank increased by approximately a factor of four (from 0.5 x 10⁻⁶ to 2.2 x
10-6). The AL-Na+ peak also appeared in the Li-swept sample as a result of
annealing although it was absent in the as-L-svept sample. These latter
results suggest that Na is trapped at sites other than aluminum during the
growth. The irradiation and anneal treatment just described evidently
rearranged the alkalis within the sample. It is conceivable that this process
would take place at the 50 to 80C operating temperature of a crystal
oscillator (although very slowly) and contribute to the long term aging of the
crystal.
Often defect-related acoustic loss pe.,s can be described by
AQ 1 - Dw /(1 + w2 T2 )
where AQ- 1 is the loss above the intrinsic background, D is the strength
factor, w is the angular frequency, and T is the relaxation time for
reorientation of the defect. The relaxation is usually thermally activiated
i18
C\.J0 9054Qq14
.4JS.
0 j-
$4
4.1
41r.C-0
4J M
4J
4 0
-4"-'
'4
-U0 0
00
wo~))o
191
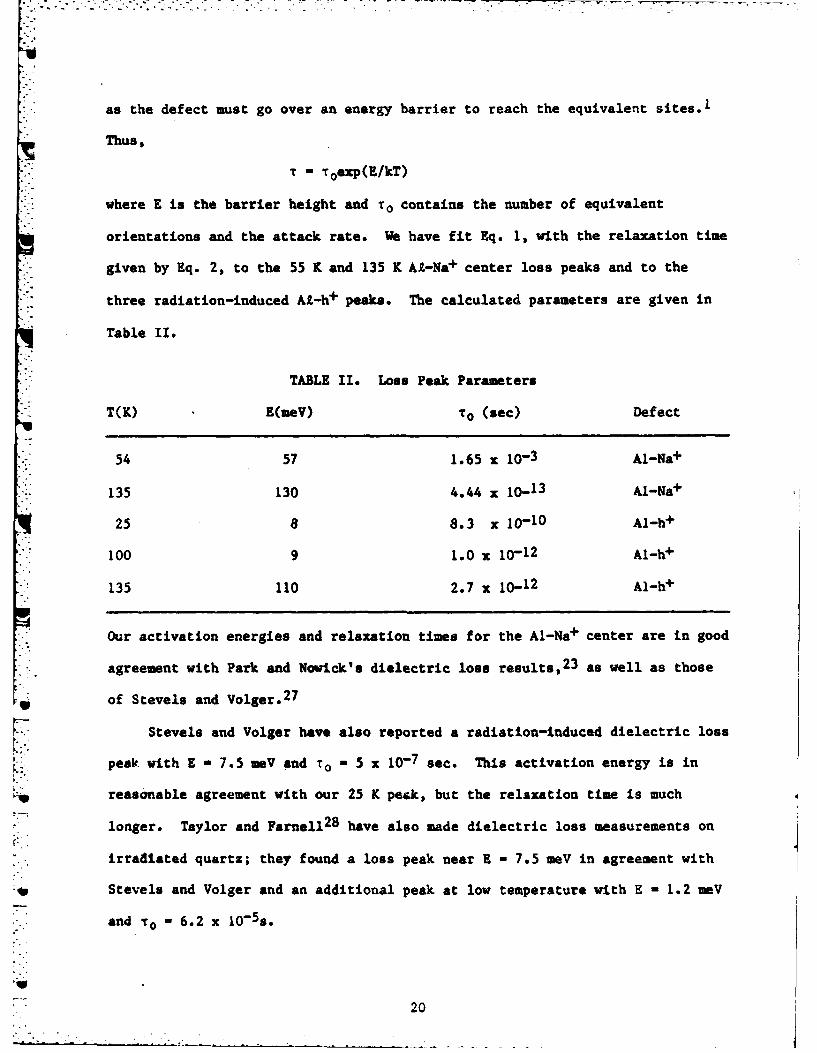
as the defect must go over an energy barrier to reach the equivalent sites. 1
Thus,
T Toexp(E/kT)
where E is the barrier height and To contains the number of equivalent
orientations and the attack rate. We have fit Eq. 1, with the relaxation time
given by Eq. 2, to the 55 K and 135 K At-Na+ center loss peaks and to the
three radiation-induced At-h+ peaks. The calculated parameters are given in
Table II.
TABLE II. Loss Peak Parameters
T(K) E(meV) To (sec) Defect
54 57 1.65 x 10³Al-Na+
135 130 4.44 x 10- 1 3 AI-Na+
25 8 8.3 x 10- 10 Al-h+
100 9 1.0 x 10⁻¹² Al-h +
135 110 2.7 x 10⁻¹² Al-h+
- Our activation energies and relaxation times for the A1-Na+ center are in good
agreement with Park and Novick's dielectric loss results, 23 as well as those
of Stevels and Volger.27
IStevels and Volger have also reported a radiation-induced dielectric loss
peak with E - 7.5 meV and To - 5 x 10- 7 sec. This activation energy is in
reasonable agreement with our 25 K peak, but the relaxation time is much
longer. Taylor and Farnell2 8 have also made dielectric loss measurements on
irradiated quartz; they found a loss peak near E - 7.5 meV in agreement with
Stevels and Volger and an additional peak at low temperature with E - 1.2 MeV
,*. and o = 6.2 x 10⁻⁵.
20
D. CONCLUSIONS
Sweeping Li+ , H+ , or D+ into high-aluminum-content Premium Q grade quartz
AT-cut resonators removes the small Al-Na+ loss peak at 55 K but does not
introduce any new loss peaks at temperatures below 370 K. Therefore, we
conclude that the Al-Li+ and AI-OH- centers do not couple to the AT thickness
shear mode. Na-swept samples show a very large 55 K loss peak. This shows
that in as-grown quartz most of the Al sites are compensated by Li+.
IV. X-RAY-INDUCED LUMINESCENCE
A. Introduction
Because of its multiple applications in electronic instrumentation,
ci-quartz has been widely studied in recent years. Much of this work has been
directed toward understanding the effects of ionizing radiation.1 ,5,19'20
In the present section, we focus attention on the "blue" luminescence
produced when quartz is exposed to ionizing radiation at low temperatures.
Several tentative explanations of this emission have been proposed, but no
definitive interpretation has yet emerged. Mattern et al. 31 studied the
spectral distribution and the intensity of this "blue" emission as a function
of temperature during 60Co gamma-ray irradiation. The peak position was found
to shift from L.8 eV (440 nm) at 85 K to 3.2 eV (387 nm) at 210 K. To explain
this large temperature effect, they suggested that the emission spectrum is
actually composed of several bands with different thermal quenching
properties. These authors numerically decomposed the emission spectrum at 85
K into four Gaussian-shaped curves and then tentatively proposed that the
emission was due to the recombination of electrons with holes trapped at
various aluminum sites.
Sigel 3 2 observed the "blue" luminescence during a study of transient
optical absorption and emission effects in glassy and crystalline SiO2.
21
During excitation of ritartz at 4.2 K with a pulsed 500 key electron source, he
found an emission centered near 2.7 eV (460 am). Also, this same electron
excitation produced a transient optical absorption peaking at 215 a. A
similar steady-state ultraviolet absorption band had previously been assigned
to oxygen vacancy defects33 in the form of E' centers. Following an
excitation pulse, the transient emission and absorption exhibit nearly the
same time decay. This similarity prompted Sigel to suggest the "blue"
luminescence arises from the radiative recombination of holes with electrons
at E' center sites.
Trukhin and Plaudis34 used vacuum-ultraviolet radiation, x-rays, and
pulsed electrons to produce emission at 2.6 eV (477 a) from quartz crystals
*maintained at 77 K. Through the use of polarization analyzers, they found
-. that the luminescing centers are anisotropic in quartz. Their pulsed-electron
*experiments gave decay times at 77 K for the emission which are similar to the
earlier results of Sigel.32 Also, a rise time for the luminescence followirv
a 20 nanosecond pulse was reported. These investigators proposed that !;.4
luminescence in quartz is intrinsic, i.e., excitons produced by the radiation
break an Si-O bond and, thus, become self-localized excitons whnse decay
results in the luminesence. An additional study of the lunimescence produced
by nanosecond pulses of electrons has been reported by Gritsenko et al. 35
Griscom,33 in a major review paper, states that the origin of the "blue"
luminescence must still be regarded as an open question. In light of recent
work in silica, 36 Griscom also introduces the possibility that this emission2-
could arise at sites of 0 peroxy linkages. 332
With the goal of obtaining additional information about the responsible
mechanisms, a systematic study of the spectral and temperature dependence of
this "blue" emission from commercially available high-quality quartz crystals
22
is reported in this section. Different sample treatments including intense
electron irradiation at room temperature, annealing to near the a-6 phase
T-- transition, and electrodiffusion (sweeping) have been used to modify the
luminescence characteristics. Our results show that the x-ray-induced
luminescence consists of three overlapping bands, one which is suggested to
result from electron recombination with holes trapped adjacent to At-M+
centers (where M+ represents either Li+ or Na+ ) and two others which appear
not to be associated with recombination near aluminum impurities.
B. Experimental
Quartz samples used in this investigation were obtained from two sources:
Premium Q material purchased from Sawyer Research Products, Eastlake, Ohio and
Supreme Q material provided by the Toyo Communication Equipment Company of
Japan. Our study was restricted to Z-growth material because of its increased
purity, and the sample labeling scheme introduced by Markes and Halliburton 7
has been followed. A Toyo sample from bar SQ-A was swept in a hydrogen
atmosphere at Oklahoma State University. All irradiations, exclusive of the
luminescence excitations, were with electrons from a Van de Graaff accelerator
(1.7 MeV and 0.2 uA on the sample).
Luminescence in the quartz was excited with x-rays from a Machlett OEG-
60 tube (a tungsten target and a 1.5 , thick beryllium exit window) operating
at 50 KV and 30 mA. The sample was attached by a copper clamp to the cold
finger of a home-built cryostat. Emitted light was dispersed by a 0.25 m Spex
monochromator with grating blazed at 300 nm and was detected by an RCA C31034
photomultiplier tube. No instrumental spectral response corrections have been
made to the data presented in this paper. For measurements of the temperature
dependence of the emitted-light intensity, the sample was heated at a linear
rate of 10 K/min. Both the total light output and the light emitted at
specific wavelengths were detected as a function of temperature.
23
U
C. Results
The spectral dependence of the x-ray-induced "blue" emission from
s-quartz depends on previous sample treament. We illustrate this first by
describing results from unswept sample PQO-E18 in considerable detail, and
then by presenting later In this section results from unswept sample SQO-A3
and swept sample SQ-A4. The behavior reported for these particular samples is
believed to be characteristic of all high-quality synthetic quartz
comercially available today.
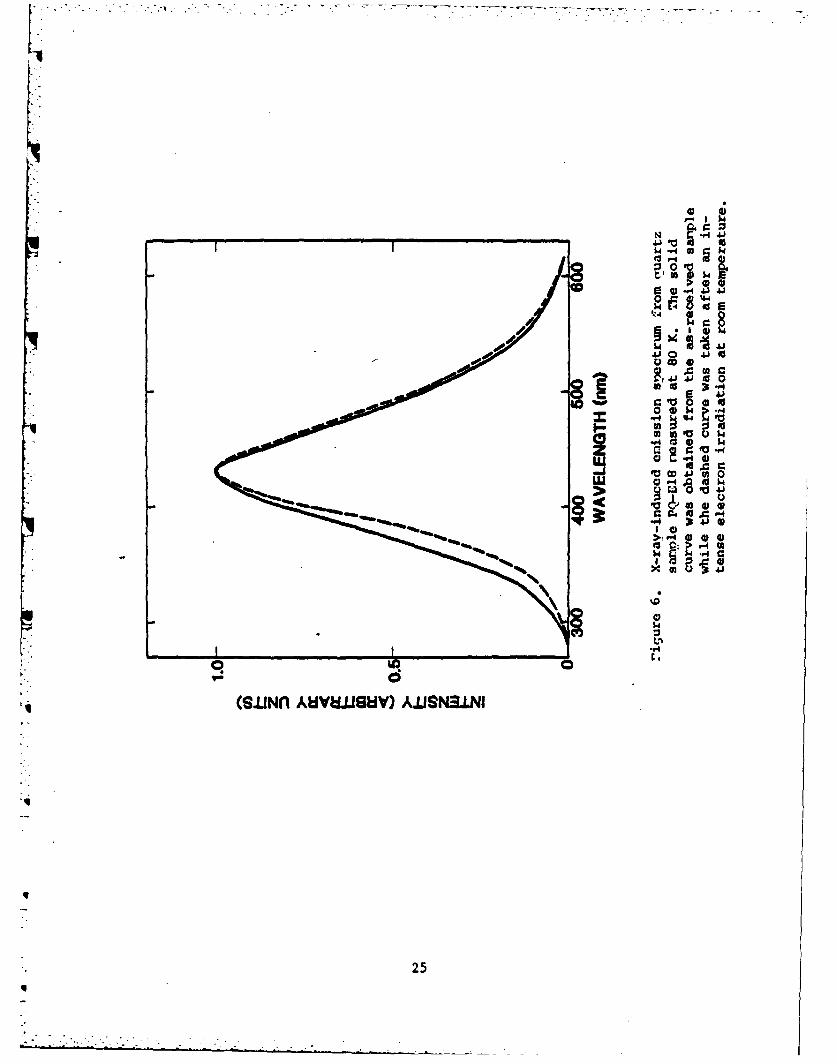
At 80 K, an unswept sample with no prior irradiation (i.e., as-grown)
emits a broad band centered at about 430 nm with a half-width of 0.77 eV.
This band is shown by the solid curve in Fig. 6. If the same sample has been
heavily electron irradiated (to a dose of approximately 107 rad) at room
temperature, the subsequent x-ray-induced emission spectrum at 80 K is also a
band peaked at 430 nm but with a half-width of 0.69 eV. This latter emission,
normalized to the same intensity, is shown by the dashed curve in Fig. 6. The
main change in the shape of the emission band after the room-temperature
electron irradiation takes place in the high energy wing and, although not
great, is easily observable.
An unswept sample that has been electron irradiated at room temperature
but then annealed at temperatures near 750 K show the same emission band at 80
K as a sample with no previous irradiation. More generally, we have found
that an unswept sample can be repeatedly cycled from emitting the 0.77 eV
half-width band to emitting the 0.69 eV half-width band by sequentially
annealing at 750 K and electron irradiating at room temperature. In the
remainder of the section, we will refer to these two states, or conditions, of
the quartz crystal as "annealed" and "room-temperature-irradiated".
Although x-rays cause significant visible emission from quartz at 80 K,
no emission is observed during similar excitation at room temperature. In
24
$4 -.4 U
k"4
Q co 4.10oi 1 A 0 0
$q 4 4 .0
'U U2'D C) M 0
ci 0 0204> La 0' to
1 P4
0 .
(MUM~f Auvt.Legv) A.LsN3.LNi
25
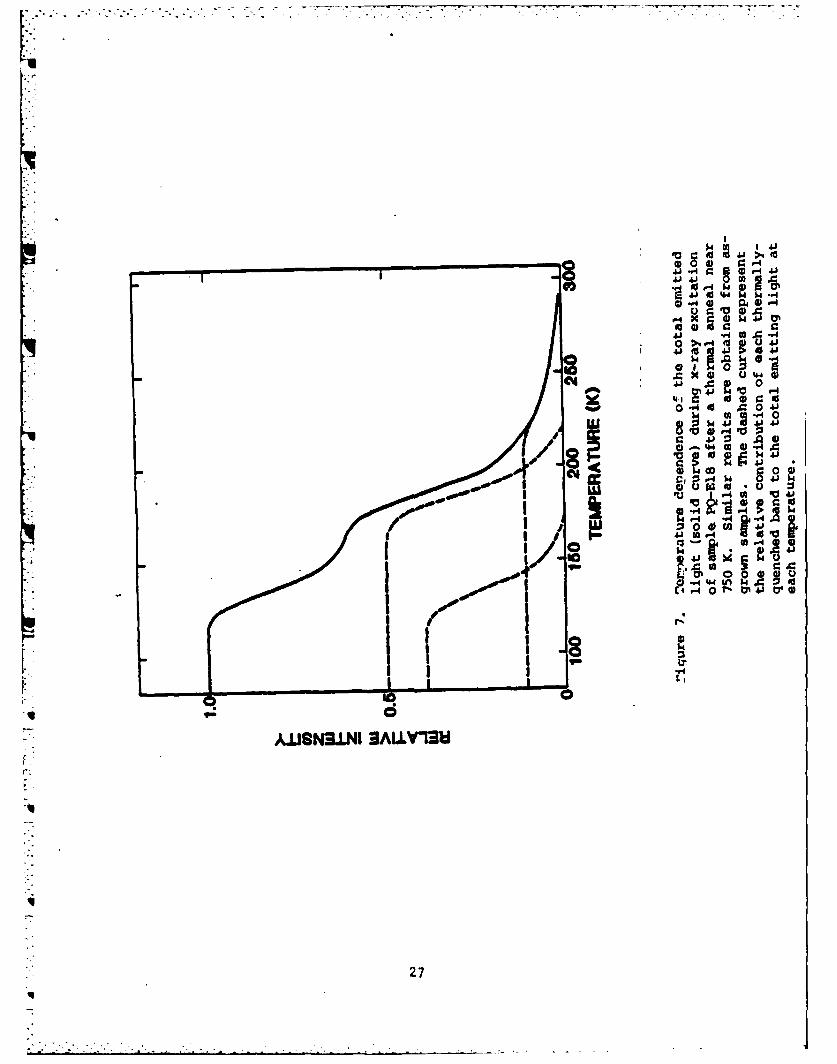
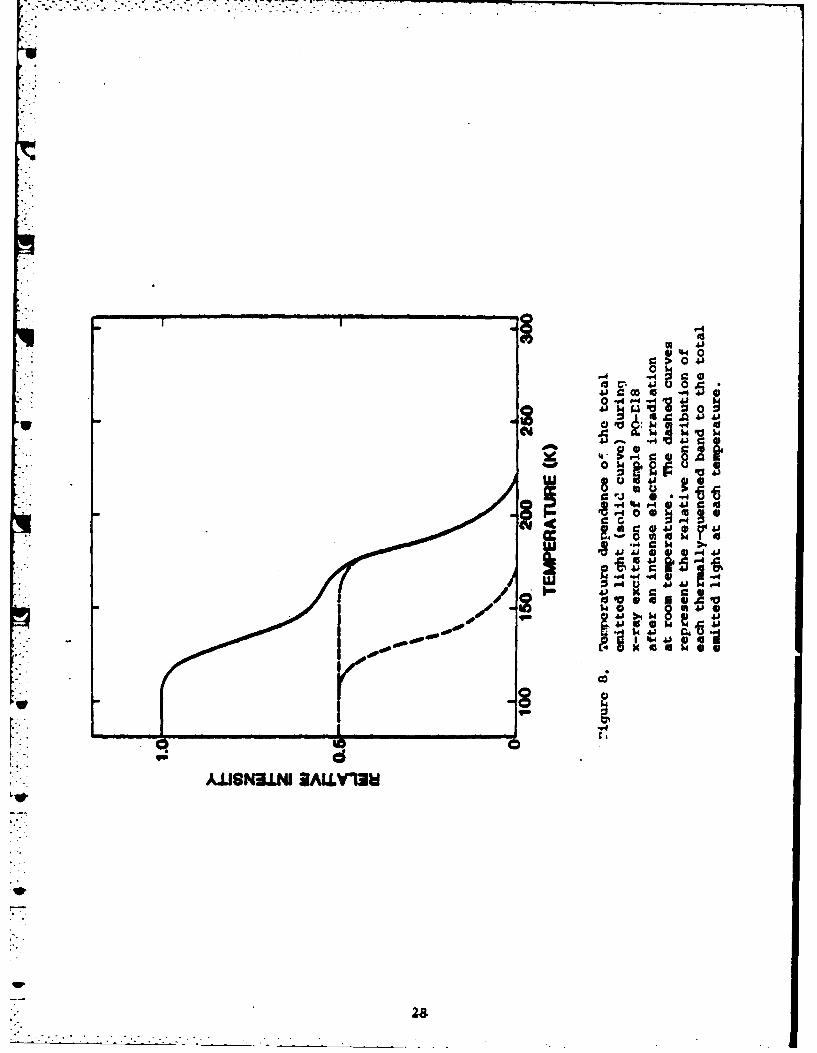
order to characterize this thermal quenching in more detail, the total emitted
light was recorded as a function of temperature in the 80-295 K range. These
results are plotted in Fig. 7 for an annealed sample (0.77 eV half-width
emission band) and in Fig. 8 for a room-temperature-irradiated sample (0.69 eV
half-width emission band). In the case of the annealed sample, the thermalI
quenching takes place in three stages. These are labeled Stage I (120-160 K),
Stage II (170-210 K), and Stage II (220-270 K). For the
room-temperature-irradiated sample, Stage III is missing but Stage I and Stage
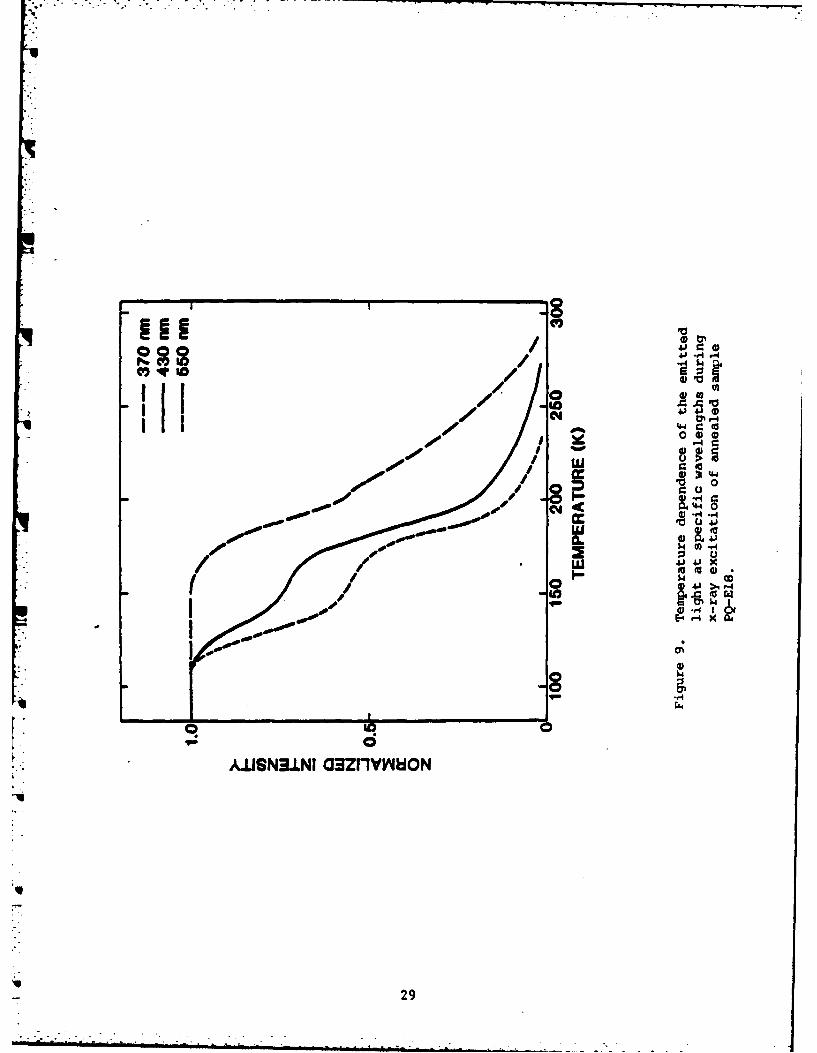
II are present. The temperature dependence of the emitted light at selected
wavelengths is shown in Fig. 9 for an annealed sample. These curves show the
same three stages as Fig. 7 but the relative contribution to each stage is
seen to depend strongly on the wavelength.
An analysis of the temperature dependence of the emission intensity
reveals that each quenching stage can be fit to an equation of the form
"1
1 + a a -E/kTb
This equation describes the competition between radiative and non-radiative
decay and corresponds to the classical expression for the emission quantum
U yield.3 1 In Eq. (3), s is the "attempt" frequency and R is the activation
energy for the thermally activated non-radiative decay while b is the
transition rate for the radiative decay. The sets of data illustrated by the
* dashed curves in Figs. 7 and 8 were used to make graphs of Ln~r/(1-n)I versus
l/T. Although not shown, this resulted in a series of linear plots from which
values of s/b and E corresponding to each thermal quenching stage were
obtained. These parameters are given in Table III. Stages I and 1I gave the
same values in the annealed and the room-temperature-irradiated samples.
iq~26
r . I
00
0 r4
0 , >1 -40 41 a
41 .p ~ 4j
.41
41
al Vo - 4~ 0 .
~ 41kWqIO 0
0 M
-4 0I, - t
I U,
A±ISN3.LNI 3ALLY13H
27
1714
t 0
4010
6 4)
cc FAb~ SE
VV
A.LISNW4I VALLYI&I
aS
0 t-g $
0l 0 4). 4 0
If 0
Moo C4 4
CL 14 "4J4
$4U0
o4
A.USN3±LNI (33ZflY4ON
29
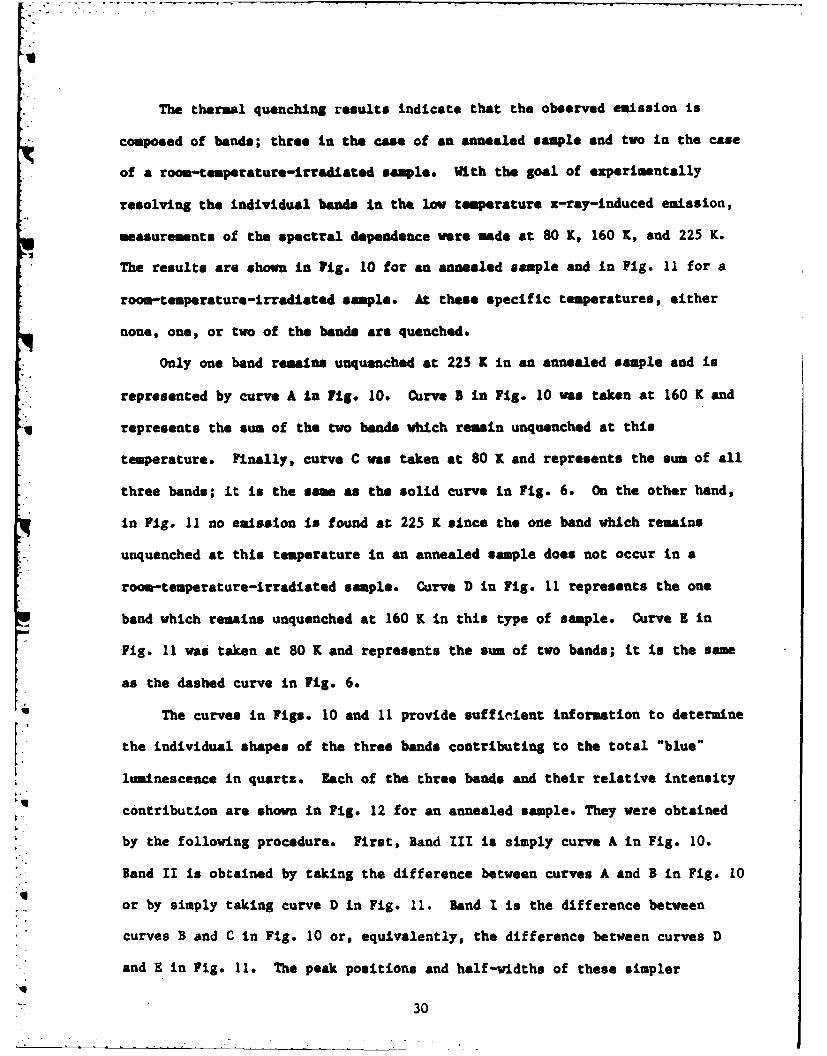
The thermal quenching results indicate that the observed emission is
composed of bands; three in the case of an annealed sample and two in the case
of a room-temperature-irradiated sample. With the goal of experimentally
resolving the individual bands in the low temperature x-ray-induced emission,
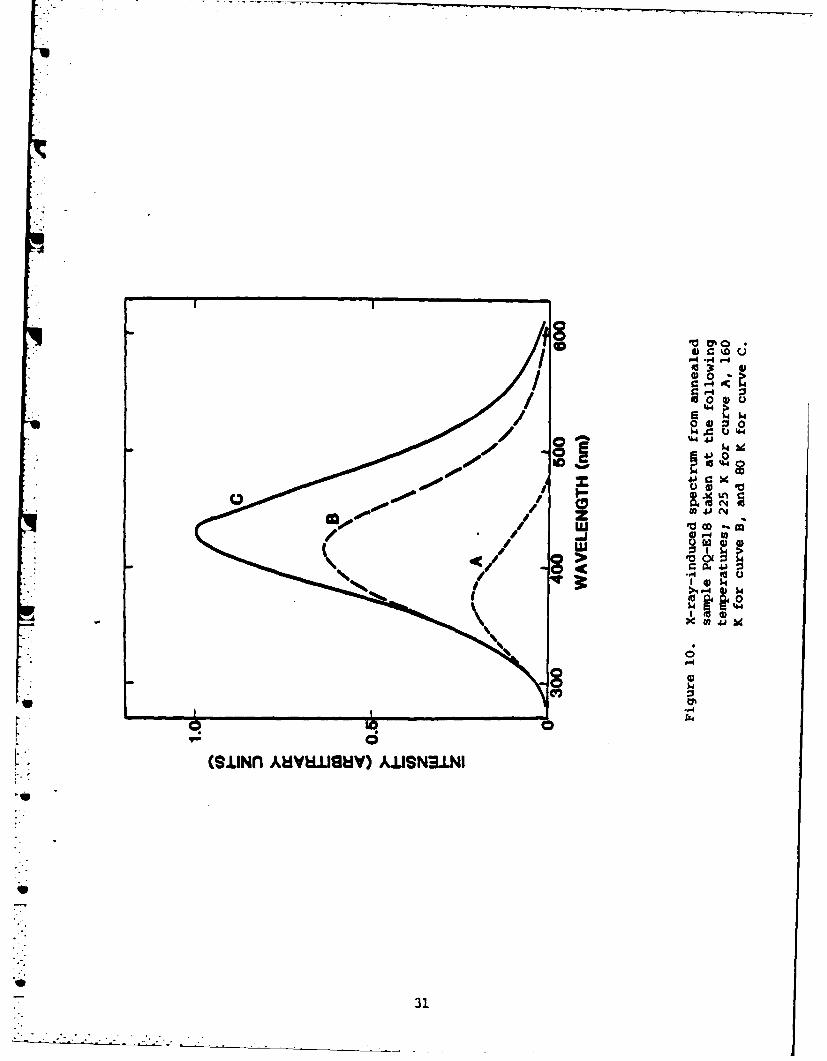
measurements of the spectral dependence were made at 80 K, 160 K, and 225 K.
The results are shown in Fig. 10 for an annealed sample and in Fig. 11 for a
room-teperature-irrediated sample. At these specific temperatures, either
none, one, or two of the bands are quenched.
Only one band remains unquenched at 225 K in an annealed sample and is
represented by curve A in Fig. 10. Curve B In Fig. 10 was taken at 160 K and
represents the sum of the two bands which remain unquenched at this
temperature. Finally, curve C was taken at 80 K and represents the sum of all
three bands; it is the same as the solid curve in Fig. 6. On the other hand,
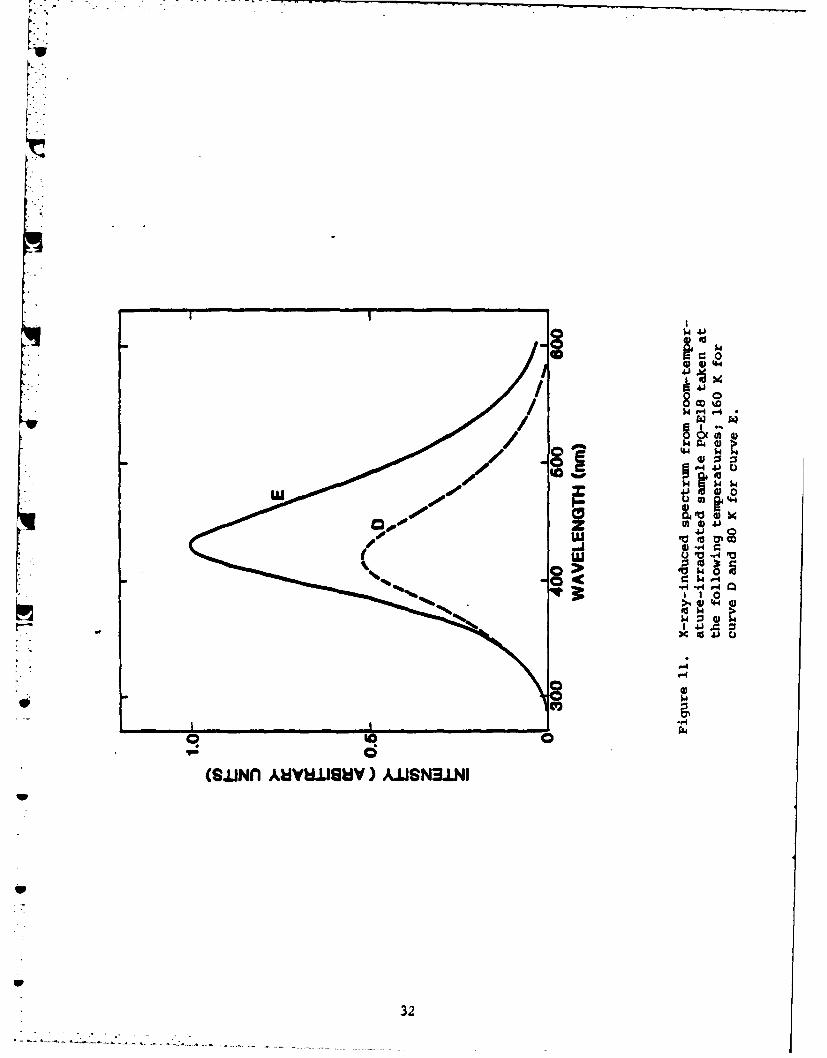
in Fig. 11 no emission Is found at 225 K since the one band which remains
unquenched at this temperature in an annealed sample does not occur in a
room-teperature-irradiated sample. Curve D in Fig. 11 represents the one
band which remains unquenched at 160 K in this type of sample. Curve E in
Fig. 11 was taken at 80 K and represents the sum of two bands; it is the same
as the dashed curve in Fig. 6.
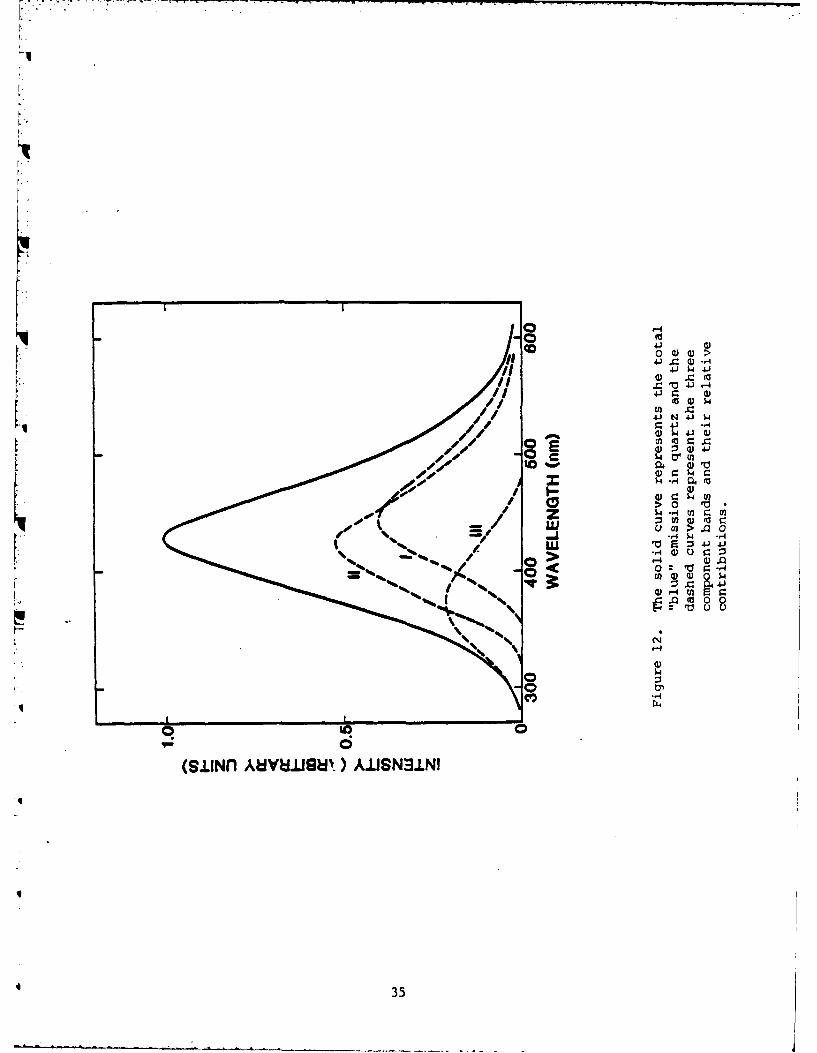
The curves in Figs. 10 and 11 provide suffinient information to determine
the individual shapes of the three bands contributing to the total "blue"
luminescence in quartz. lach of the three bands and their relative intensity
contribution are shown In Fig. 12 for an annealed sample. They were obtained
by the following procedure. First, Band III is simply curve A in Fig. 10.
Band II is obtained by taking the difference between curves A and B in Fig. 10
or by simply taking curve D in Fig. 11. Band I is the difference between
curves B and C in Fig. 10 or, equivalently, the difference between curves D
and E in Fig. 11. The peak positions and half-widths of these simpler
30
-4.--
/00 O4J $4
.100, 41
/ 0
> V
C 14 U 4J
0
44
MSUMf AuYW.ismY) A.USN3.LNI
31
/ 4
w00, Il
V9-
lCl
32
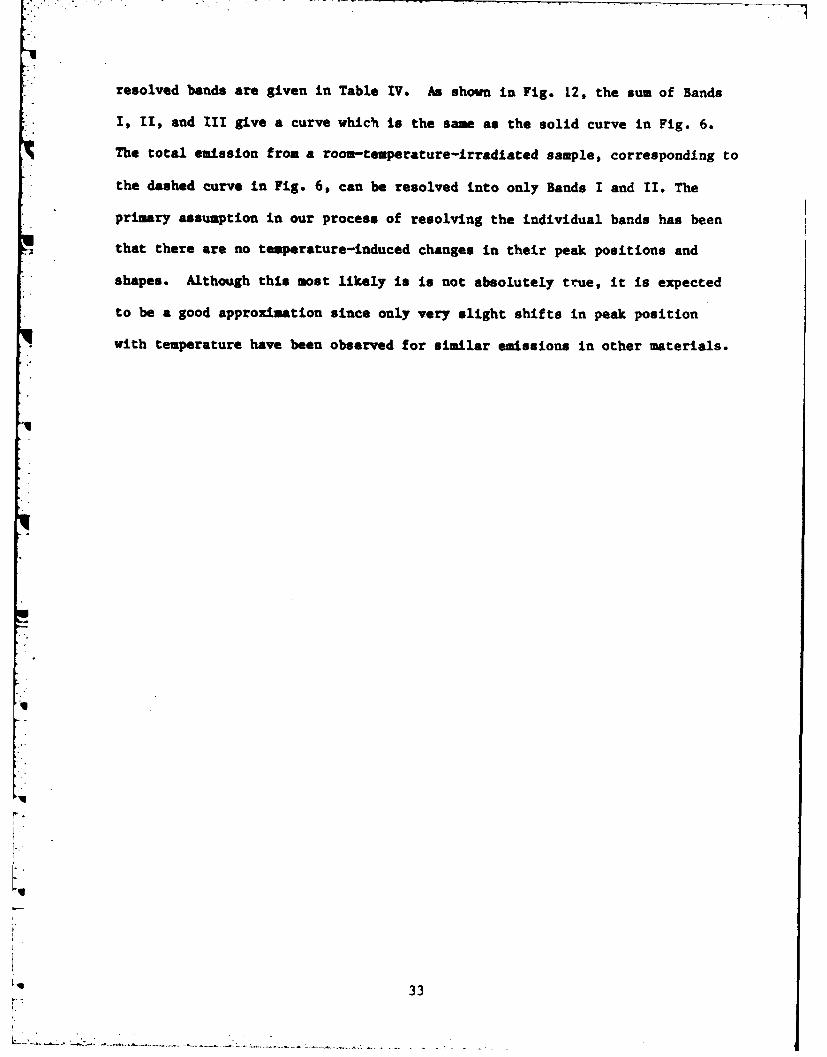
*resolved bands are given in Table IV. As shown in Fig. 12, the sum of Bands
I, II, and III give a curve which is the same as the solid curve in Fig. 6.
The total emission from a room-temperature-irradiated sample, corresponding to
*the dashed curve in Fig. 6, can be resolved into only Bands I and II. The
primary assumption in our process of resolving the individual bands has been
that there are no temperature-induced changes in their peak positions and
shapes. Although this most likely is is not absolutely true, it is expected
to be a good approximation since only very slight shifts in peak position
* with temperature have been observed for similar emissions in other materials.
33
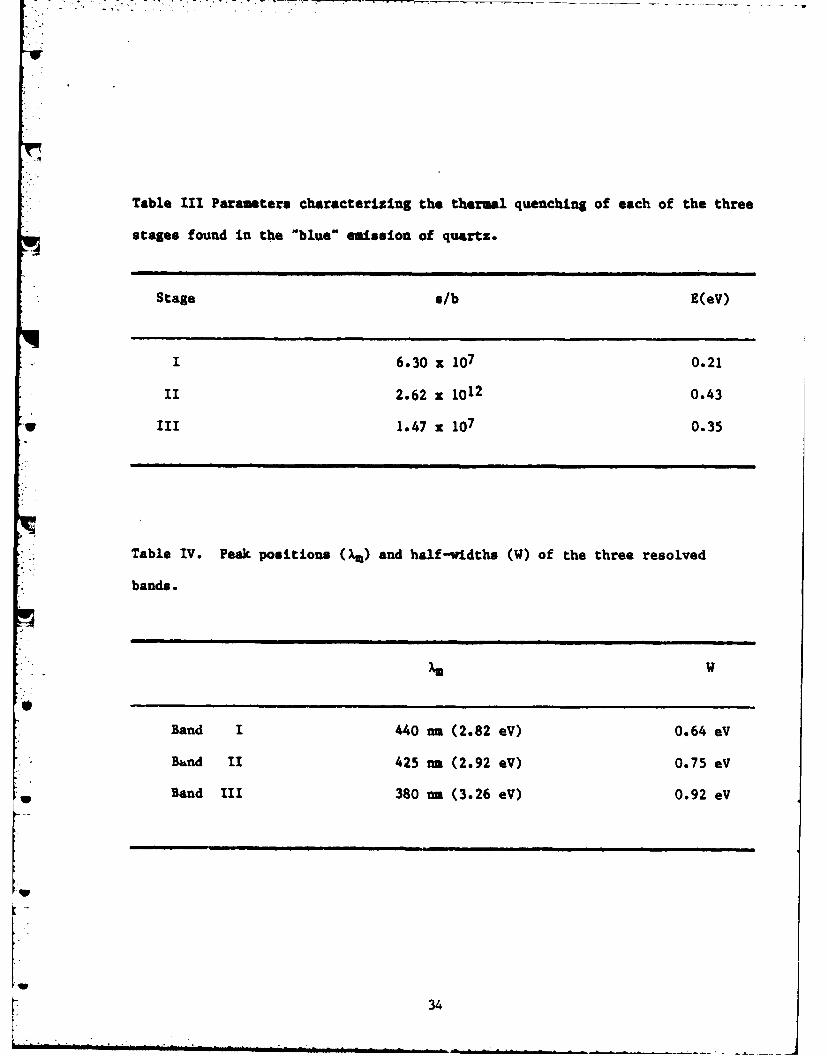
Table III Parameters characterizing the thermal quenching of each of the three
stages found in the "blue" emission of quartz.
Stage s/b E(eV)
I 6.30 x 10⁷ 0.21
rI 2.62 x 10¹² 0.43
* III 1.47 x 10⁷ 0.35
Table IV. Peak positions (Xm ) and half-widths (W) of the three resolved
bands.
Band I 440 na (2.82 eV) 0.64 eV
Band II 425 na (2.92 eV) 0.75 eV
W Band II 380 na (3.26 eV) 0.92 eV
F1
L 34
0
J 4.
II .~4J -
En r.ip wQ 41)
03 fd c
LLI4 a 04 .0
> ~ 4 (Dfl
0 00I r4 -4 u) U
% C4
C4)4
(S.lINfl AhfVU.1gt A~ISN31NI
4 35
-U
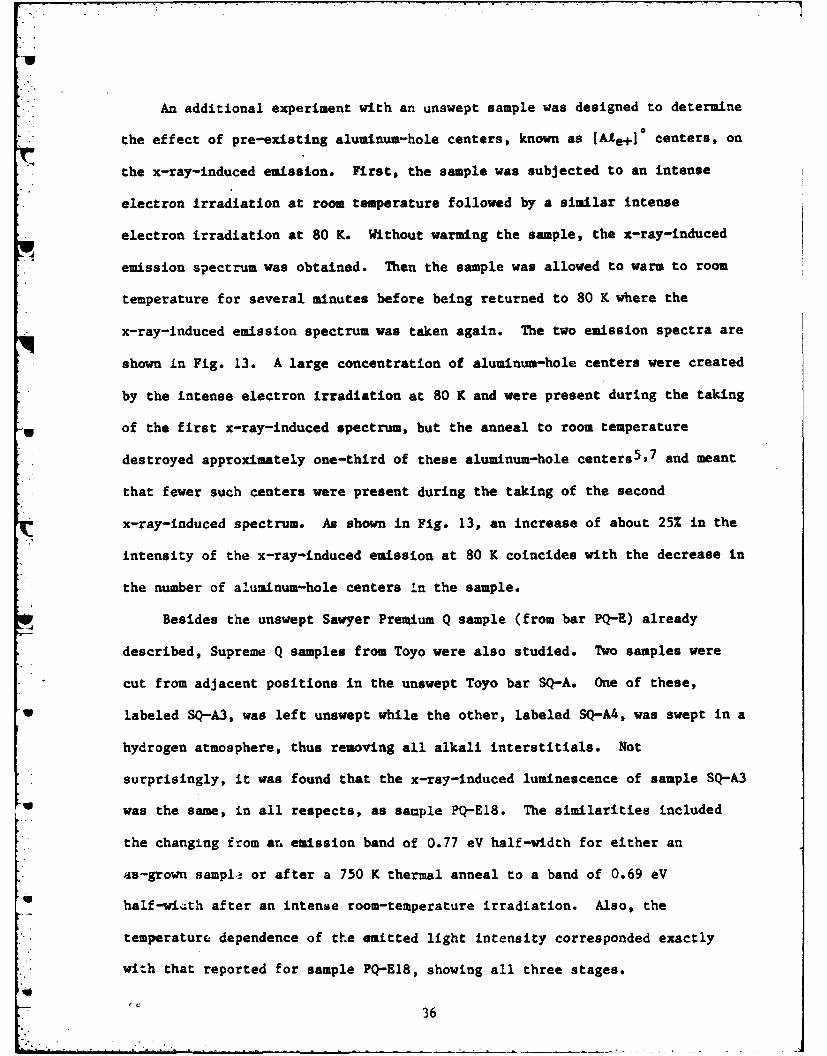
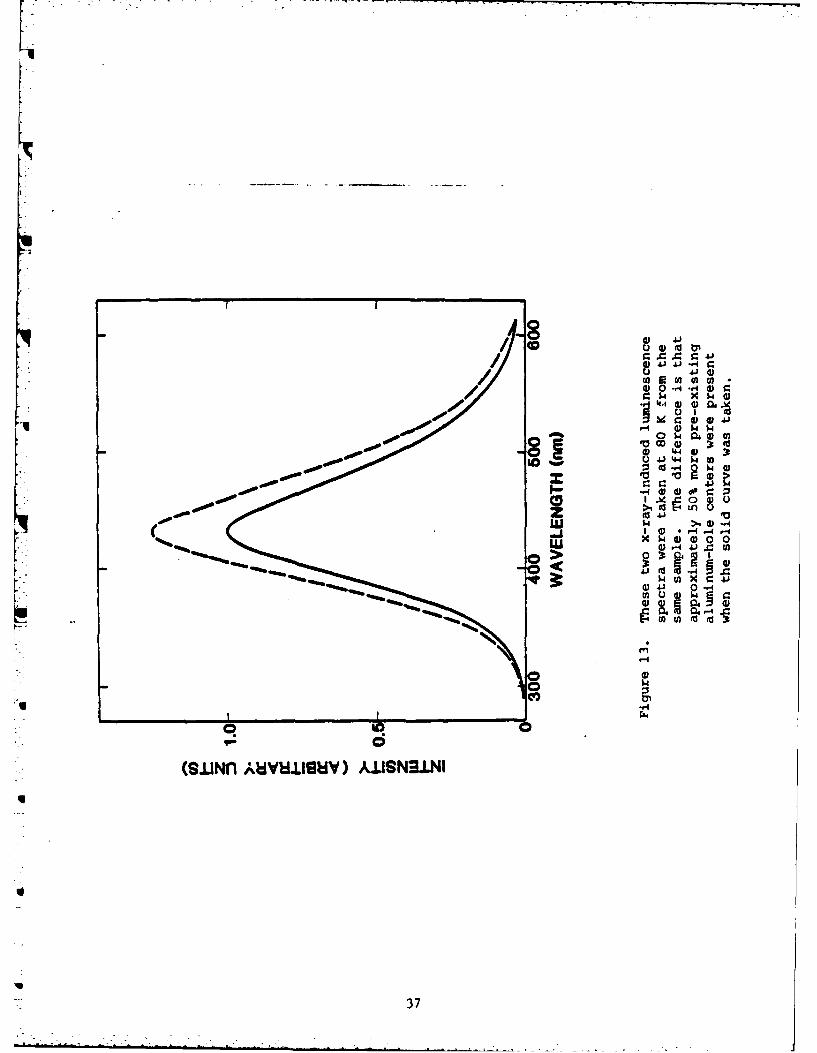
An additional experiment with an unswept sample was designed to determine
the effect of pre-existing aluminum-hole centers, known as [Ale+]0 centers, on
the x-ray-induced emission. First, the sample was subjected to an intense
electron irradiation at room temperature followed by a similar intense
electron irradiation at 80 K. Without warming the sample, the x-ray-induced
emission spectrum was obtained. Then the sample was allowed to warm to room
temperature for several minutes before being returned to 80 K where the
*x-ray-induced emission spectrum was taken again. The two emission spectra are
shown in Fig. 13. A large concentration of aluminum-hole centers were created
by the intense electron irradiation at 80 K and were present during the taking
of the first x-ray-induced spectrum, but the anneal to room temperature
destroyed approximately one-third of these aluminum-hole centers5'7 and meant
that fewer such centers were present during the taking of the second
x-ray-induced spectrum. As shown in Fig. 13, an increase of about 25% in the
intensity of the x-ray-induced emission at 80 K coincides with the decrease in
*the number of aluminum-hole centers In the sample.
Besides the unswept Sawyer Premium Q sample (from bar PQ-E) already
described, Supreme Q samples from Toyo were also studied. Two samples were
*cut from adjacent positions in the unswept Toyo bar SQ-A. One of these,
* labeled SQ-A3, was left unswept while the other, labeled SQ-A4, was swept in a
hydrogen atmosphere, thus removing all alkali interstitials. Not
surprisingly, it was found that the x-ray-induced luminescence of sample SQ-A3
was the same, in all respects, as sample PQ-E18. The similarities included
the changing from an emission band of 0.77 eV half-width for either an
. ~ as-grown sampl3 or after a 750 K thermal anneal to a band of 0.69 eV
U half-width after an intense room-temperature irradiation. Also, the
temperature dependence of the emitted light intensity corresponded exactly
• with that reported for sample PQ-E18, showing all three stages.
36
0) 41-4
4Ja ) 4.l ) a)
4) 0 4 .4 0 )
-4 0 4.
E 4 )d0 4f
&*lo 41~
z AA 1.4 -4 ,4
(U 54 q 0 04-f-
(Dr4 4J C U)
-I
r.4
C4
(SJNfl AuVtw.9idv) AIISN31LNI
33
The hydrogen-swept sample SQ-A4, however, behaved in a manner somewhat
different from the unswept samples. The half-width of the x-ray-induced
luminescence band from the swept sample was always 0.69 eV. This was the case
whether the sample had been annealed near 750 K or heavily electron irradiated
at room temperature. It was found that the temperature dependence of the
emitted light from the swept sample showed only the Stages I and II, never
Stage III.
D. Discussion
In our present investigation, the x-ray-induced "blue" luminescence from
quartz has been experimentally resolved into three overlapping bands, each
having a different quenching temperature. These results (1) correlate well
with data from a previous thermoluminescence study; (2) lead to a possible
model for the origin of one of the three emission bands; and (3) form the
basis of an optical test for measuring the effectivness of sweeping of quartz
crystals.
In the thermoluminescence (TSL) study of high-quality quartz by Malik et
al.,37 three regions of glow peak interest were identified below room
temperature, occuring as follows: Region 1 (115-145 K), Region II (145-185),
and Region II (185-270 K). Definite similarities are found between their TSL,
data and the present x-ray-induced lunminescence data. Region I in the TSL
contains a single, sharp peak at 128 K with the maximum in the spectral
emission being near 450 nm. This is similar to our Band I whose emission peak
is at 440 a and whose thermal quenching begins at about 120 K. Although the
significance is not yet understood, it is very interesting nonetheless that
the TSL peak in Region I, the onset of thermal quenching of Band I, and the
thermal decay of radiation-induced hydrogen atom defects7 all occur in the
120-130 K range.
38
Region III in the TSL study by Malik et al. 3 7 contains a single peak near
225-230 K which has a spectral emission maximum near 380 nm. Our Band III
emission peaks at 380 nm and its thermal quenching begins at about 220 K.
However, the most striking correlation between the Region III TSL peak and our
Band III is that neither occurs in swept quartz or in unswept quartz heavily
irradiated at room temperature and not subsequently annealed. In other words,
this TSL peak and Band III are observed only when interstitial alkali ions are
in the crystal and located adjacent to substitutional aluminum ions.
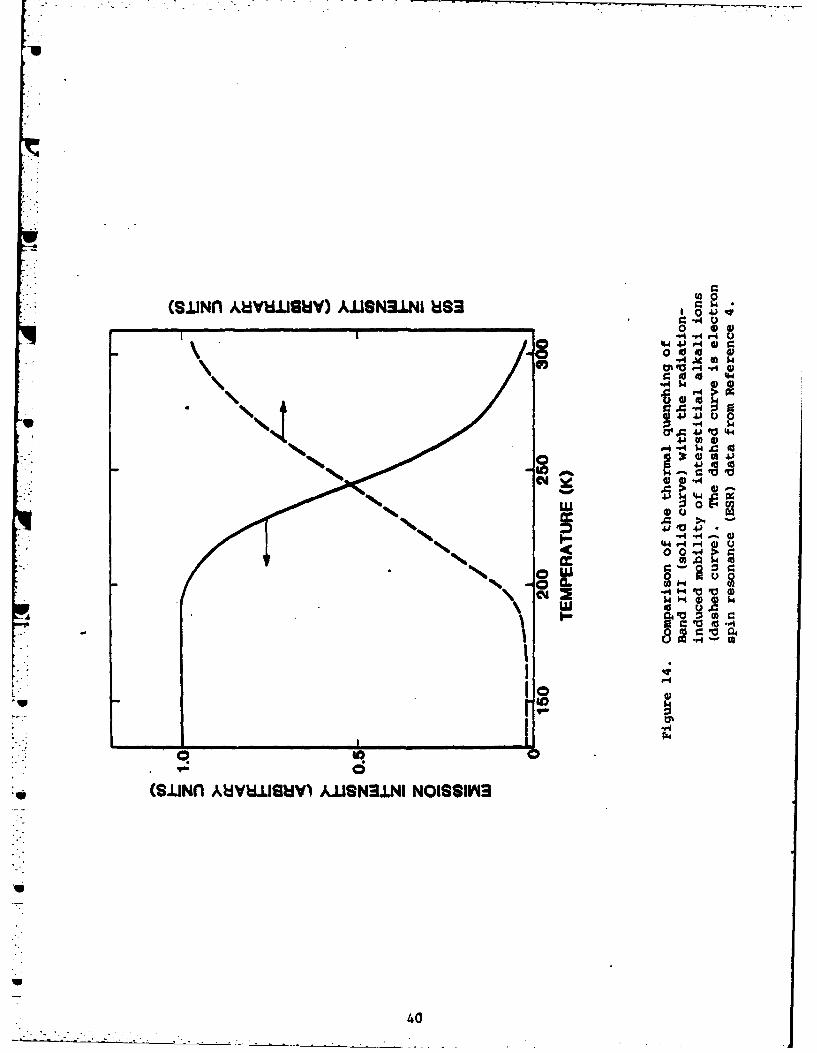
In order to explain the origin of Band III, two additional observations
must be considered. First, the temperature dependence of the intensity of
Band III (i.e., the thermal quenching) in an annealed unswept sample
correlates well with previous data relating to the temperature dependence of
the radiation-induced mobility of interstitial alkali ions, as shown in Fig.
14. Markes and Halliburton7 and Halliburton et al.5 have shown that the
sample temperature must be about 200 K before ionizing radiation can begin to
free interstitial alkalis from their trapping site adjacent to alunminum ions.
The dashed curve in Fig. 14 represents the production of aluminum-hole (At-h+ )
centers as the interstitial alkali ions are removed from the aluminum sites by
radiation.5
The other important evidence comes from Ge-doped quartz where Mackey38U
has directly observed the thermal dissociation of the h+-AX-M+ center (also
known as the [Ale+/M+] center where the symbol M+ represents Li+ or Na+ ) into
a separate AL-h+ center and an M+ ion. The Ge4+ ions act as electron trapsU
below 200 K and allow stable h+-A£-M+ centers to be formed by radiation, which
3
" 39
(SJJNnA A8Y8.L1S) A.48N3.LNI USB 13
O0 0
.. 4414V- 0
43 u
a4~i) 0 4
o1o
0 04
W4 OC.) _44)
CL j 1-4~4 V 6
4~ I-
P.4
(S.UNA A~VtUISHV) A.LISN3.LNI NOISSIV4'3
40
then begin to dissociate upon warming above 200 K. The M+ ion leaves the
A£-h+ center behind and thermally migrates to the Ge3+ ions. In the undoped
quartz used in the present investigtion, there are no electron traps known
which play the analogous role of the Ge4+ ions and, as a result, no
significant number of stable h+A£-M+ centers are observed by electron spin
resonance (ESR) after electron irradiation at 77 K.
These three observations, namely (1) the emission band only occurs when
alkalis are adjacent to aluminum ions, (2) thermal quenching of the band
correlates with the radiation-induced mobility of alkalis, and (3) h+-AX-M+
centers thermally dissociate above 200 K in Ce-doped quartz, suggest the
following model for the origin of Band III in our samples. Radiation produces1
large numbers of uncorrelated electron-hole pairs in quartz and some of the
holes become temporarily trapped on oxygen ions adjacent to At-M+ centers.
This formation of h+-X-M+ centers is followed by one of two possible events,
depending on the temperature. Below 200 K, the electron finds no stable
trapping site and hence returns and recombines with the hole at the h+-AX-M+
center to give a luminescence. Above 200 K, the thermal energy becomes
sufficient to allow the alkali ion (i.e., the m+ ion) to "hop" away from the
remaining At-h+ center before the return of the electron. This latter
happening leaves no h+-X-M+ center at which recombination can occur, and noI
comparable emission is observed.
Thus, we are proposing that the Band III emission arises fromK recombination of an electron with a hole trapped adjacent to an At-M+ center,
and the thermal quenching of the band reflects the thermal destruction of the
h+-AI-M+ center before the electron can return and recombine. The lack of
alkali ions in the swept samples eliminates this source of emission and agrees
with our failure to observe a contribution from Band III in such samples.
41F _ _" * "
Besides providing a more fundamental understanding of the radiation
response of a-quartz, the present investigation also has practical application
with regard to testing of sweeping effectiveness. As shown earlier, Band III
is related to the presence of alkali-compensated aluminum ions (i.e., A1-&
centers), and a measurement of the emitted light intensity in the 220-270 K
. temperature range provides Information about the concentration of these
* :alkali-compensated aluminum ions. Similar information also can be obtained
* from measuring the intensity of the Region III thermoluminescence, as
described by Malik et al.37
A test for sweeping effectiveness would be to monitor the x-ray-induced
luminescence at 370 ms and at approximately 250 K from a sample before and
after sweeping. The choice of 370 nm for the monitoring wavelength optimizes
the observance of Band III emission as opposed to the contributions from Bands
I and II. If the intensity of the x-ray excitation beam is sufficiently
great, the ratio of the luminescence intensity found after the sweep to that
* found before the sweep would give the percentage of alkali ions remaining in
the sample after sweeping. If all the alkalis are removed by the sweep then
the luminescence intensity at 250 K is zero after the sweep and the sample is
said to be 100% swept. An example of data supporting our proposed
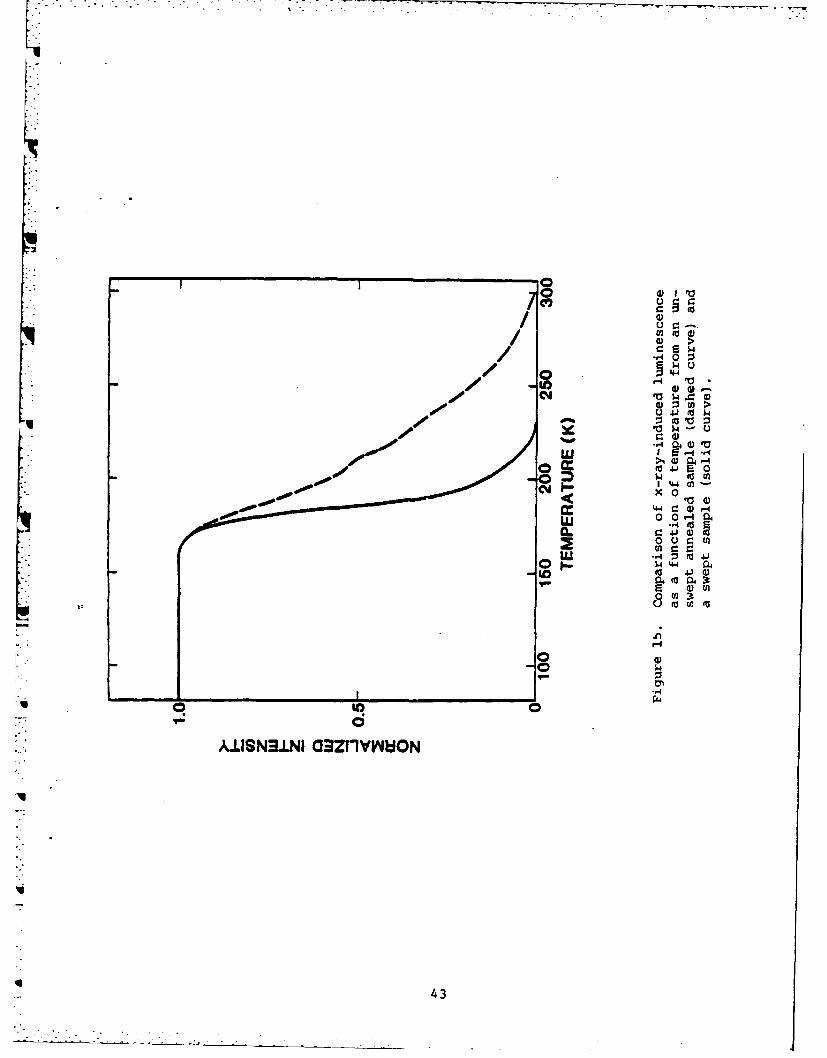
luminescence test procedure is given in Fig. 15 where the x-ray-induced
luminescence measured at 370 am from unswept annealed sample SQ-A3 (dashed
curve) is compared to that from swept sample SQ-A4 (solid curve.) The
emission intensity from the unswept sample is much larger at 250 K than that
from the swept sample at this temperature, which indicates the latter sample
is well-swept and haa no Band III.
With regard to selecting quartz for use in precision frequency control
applications, a single luminescence measurement of the type described above,
42
h- -' - - -... .. ... ".
70 C ts
00:w a,
/ 440
'M to 0M $4
1 4-4 01
0.0
~44- C D -so rU4JG
W 44to 41o 4U
_____ __ I.14
dUISN3.LNI a33ZfIVIUON
43
if done on as-grown material, could be used as an initial screening test since
it would provide a value for the At-M+ center concentration. Only those bars
having At-M+ concentrations below a pre-set acceptable value should be
subjected to sweeping or other processing. A screening test for material
already swept could also consist of making a single measurement of the type
described above. In this case, quartz exhibiting a luminescence intensity
above a pre-set value would either not be well swept or would contain a large
concentration of aluminun (the single measurement could not distinguish
between the two explanations), and, in either case, should be rejected from
further processing.
E. Summary
Our experimental studies have provided considerable information about the
x-ray-induced "blue" emission from synthetic quartz. The major results are
sunmmarized by the following statements. (1) In as-grown crystals the
emission obtained by excitation at 80 K is peaked near 430 nm with a
half-width of 0.77 eV. It is thermally quenched in three stages and has been
experimentally resolved into three simpler overlapping bands peaking at 440
nm, 425 nim, and 380 nm. (2) If the crystal has received a previous intense
electron irradiation at room temperature, the emission produced by excitation
at 80 K appears narrower (half-width of 0.69 eV) and it is thermally quenched
* in only two stages. This Itter emission is resolved into two simpler bands
*w peaking at 440 nm and 425 am. (3) If a room-temperature-irradiated sample has
been annealed at temperatures above 750 K, it shows the same behavior as an
as-grown sample. (4) If a sample has been swept in a hydrogen (or air)
*W atmosphere, the emission does not change with sample treatment and always
coincides with that of the unswept sample after room temperature irradiation.
44
From these results, we conclude that the band which peaks at 380 nm
probably arises from recombination of an electron with a hole trapped adjacent
to an At-M+ center. This particular band is only observed when interstitial
alkali ions are in the crystal and are trapped next to the substitutional
aluminum ions. The origins of the other two bands at 440 nm and 425 nm are
not revealed in this study, although data suggests they do not arise from
electron-hole recombination near aluminum ions. Finally, the behavior of the
380 mn band is proposed as the basis of a test for use in screening quartz
bars prior to fabrication of resonators designated for precision frequency
- applications.
I V. RADIATION-INDUCED r" CENTERS
A. Introduction
In quartz, an important class of radiation-induced paramagnetic defects
* have g values slightly less than 2.0023 and have very long
*; spin-lattice-relaxation times. The best known of these defects is the E'1
center. first reported by Weeks 39 and further characterized by Silsbee 40.
Theoretical investigations by Feigl et al. 41 and Yip and Fowler 42 have ledt
to the presently accepted model of the El center; namely, an oxygen vacancy
*with an associated unpaired electron. This unpaired electron is localized in
an sp3 hybrid orbital extending into the vacancy from the adjacent silicon ion
on the short-bond side of the vacancy. The precursor of the E1 center has not
been identified.
Similar oxygen-vacancy-associated defects involving hydrogen are known as
E2 and and E4 centers. 43-47 An extensive analysis of the El center by Isoya
et al. 48 has resulted in a model simply described as an H- ion in an oxygen
45
vacancy along with an unpaired electron which is shared unequally by the two
neighboring silicon ions. In the case of the El center, no definitive model
has been proposed.
In the present section, we describe three radiation-induced S - 1 centers
in quartz which we have labeled El, E2 , and E3. These centers are very,
similar to the El center, and we use a notation consistent with that of the El
wherein the number of primes donotes how many unpaired electrons a center
possesses. 49 Weeks and Abraham 50,51 first reported these S - I centers and
they were briefly described by Solntsev et al. 52 We have extended these
initial observations by using electron spin resonance (ESR) to examine both
* unswept and hydrogen-swept samples of commercially available high-quality
synthetic quartz. This work provides a more detailed description of the
production and thermal decay properties of these E" centers.
* B. Experimental
Synthetic quartz was obtained from Sawyer Research Products, Eastlake,
Ohio, USA and from Toyo Communications Equipment Company, Japan. These were
lumbered bars of pure Z-growth material from which Y plates (8x3x12 3m) were
cut for use in the ESR studies. A van de Graaff accelerator (1.7 MeV
electrons) was used for all irradiations; the samples were immersed in liquid
nitrogen for the irradiations at 77 K while nitrogen gas of the desired
temperature flowed by the sample during the irradiations between 77 K and 300
K. All of the ESR spectra described in this paper were taken at room
temperature.
The homodyne ESR spectrometer utilize a microwave bridge of our own
design operating at X-band and containing a detector bias arm. A Narda
N6244S-37 mcrowave solid-state amplifier was added to the bridge to increase
sensitivity especially at lower microwave power. The static magnetic field
46
modulation frequency was 100 kHz. A variable-temperature nitrogen gas flow
. permitted thermal anneal studies up to 2000C within the microwave cavity.
Magnetic field positions and g values were measured with a Varian E-500
digital gaussmeter and an HP-5340A microwave frequency counter.
C. Results
The Three E centers are easily produced in unswept synthetic quartz by
an electron irradiation at 77 K, provided the sample has been previously
*irradiated at room temperature and not subsequently annealed at high
temperatures (i.e., above 600-750 K). In contrast, a single 77 K electron
irradiation of a previously unirradiated unswept sample does not produce
appreciable numbers of E centers. Because of long spin-lattice-relaxation
times, the ESE spectra of the E" centers are most readily observed at room
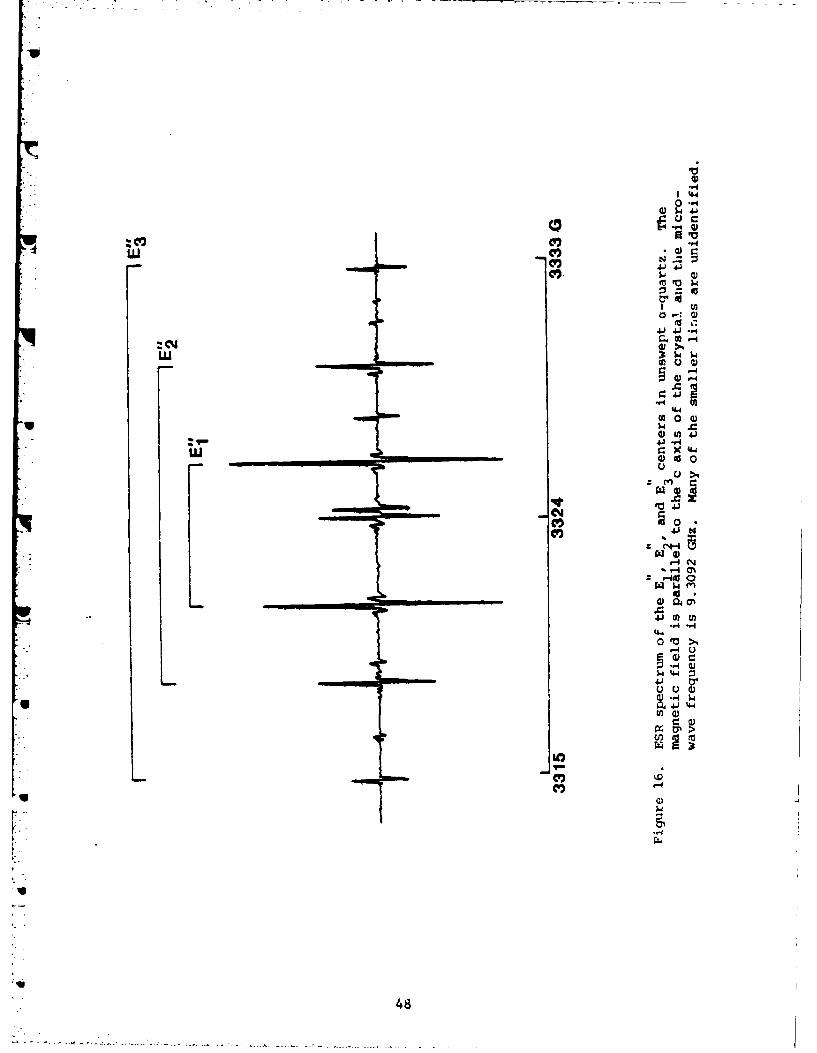
temperature. The ESR spectrum showing the El, E2 , and E3 centers when the
magnetic field is oriented along the crystal's c axis is given in Fig. 16. In
all cases, the intensities of the three E centers are found to be in the
ratio 4.5:2:1 following a 77 K irradiation.
At room temperature, the centers are found to power saturate easily, even
at microwave levels less than 0.2 milliwatts. This allows complex passage
effects to occur within the E" spin systems and required that the ESR
spectrometer's 100 kHz phase-sensitive detector be adjusted "out-of-phase" in
order to optimize the intensity of the ESR signals. Since the ESR
linewidths for these centers are extremely narrow, less than 0.05 gauss, this
phase setting also prevents modulation "sidebands" from appearing and giving
distorted ESR lineshapes.
As seen in Fig. 16, each of the three E" centers exhibits a pair of
intense ESR lines. These doublets are, in turn, surrounded by smaller29 Si
47
1"4
m o
CM,
0 4)
CC'Jw o
Cf) 41 N4
* _ 4 -'.4
I. 0
48.
hyperfine lines having splittings of less than a gauss. Not shown in Fig. 16
but also observed to be centered on each E" primary doublet are eight
hyperfine lines, four at higher magnetic field and four at lower magnetic
field, due to strong hyperfine interactions with two slightly inequivalent
29Si nuclei. These latter hyperfine splittings are approximately 200 gauss
and, thus, are about one-half of the equivalent 29Si hyperfine splitting for
the El center. Table V lists the c-axis magnetic field positions of the
primary doublet and eight strong 29 Si hyperfine lines for each of the three
E centers. The gc values obtained from the primary doublets are 2.0012,
2.0010, 2.0020 for the E", E2 , and E3 centers, respectively. As the magnetic
field is rotated in the plane perpendicular to the X axis of the crystal
(i.e., the crystallographic al axis), each of the c-axis doublets is observed
to split into three less-intense doublets. The doublet separations change
significantly with angle whereas the center field for each of the doublets
depends only slightly on angle. The maximum primary doublet separation
*i approaches 192 gauss for the El center, 64 gauss for the E2 center, .. and 51
gauss for the E3 center. Such a large angular dependence of the doublet
separations suggests that these centers are S - 1 spin systems. The other
alternative would be S - 1/2, I - 1/2 (100% abundant) spin systems, but our
observation of the "half-field" AMs - ± 2 transitions has eliminated this
latter possibility and confirmed the S - 1 nature of the E centers.
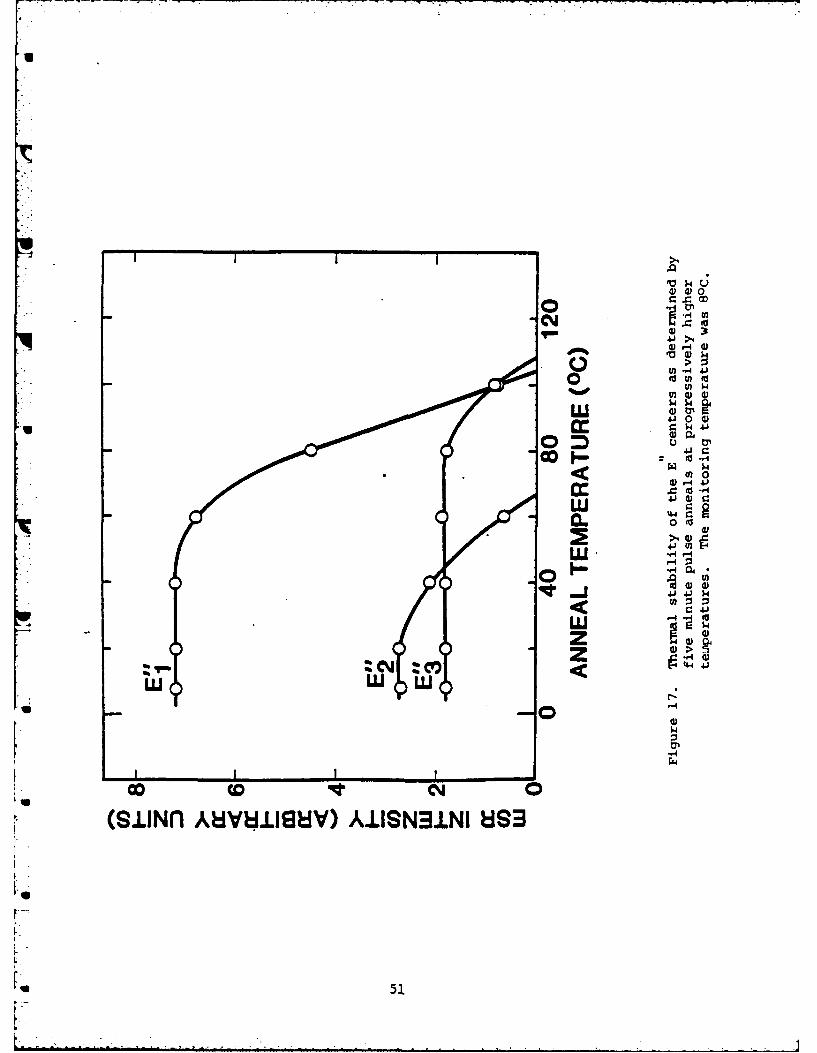
An isochronal pulse-anneal of the three E" centers was performed in the
temperature range from 8°C to 1000 C. The ESR spectra were recorded at 8°C
after a five minute anneal at each elevated temperature. The results, given
in Fig. 17 show that the E2 centers anneal near 50*C while the El and E3
centers are more sta,'Le and anneal near 85°C and 95°C, respectively. If a
sample containing E centers is maintained at room temperature, the E2 centers
anneal out in a few hours while the El and E3 centers anneal more slowly and
49
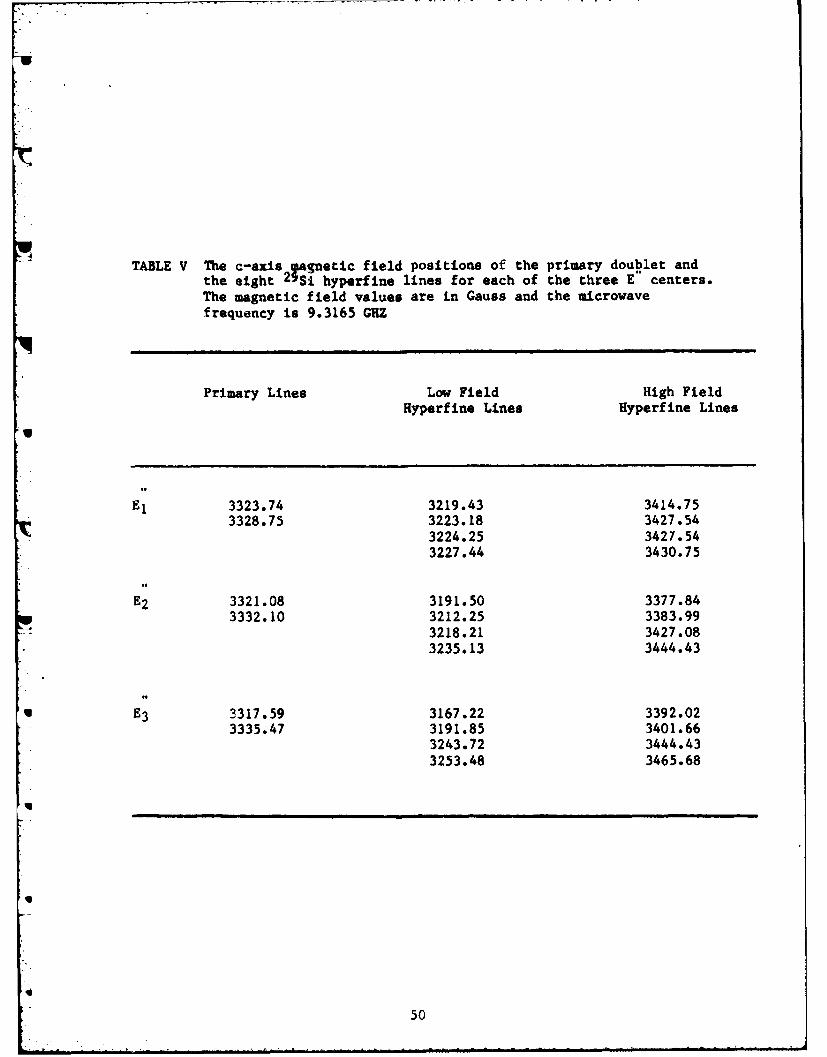
TABLE V The c-axis gnetic field positions of the primary doublet andthe eight 29Si hyperfine lines for each of the three E centers.The magnetic field values are in Gauss and the microwavefrequency is 9.3165 GUZ
Primary Lines Low Field High Field
Hyperfine Lines Hyperfine Lines
El 3323.74 3219.43 3414.753328.75 3223.18 3427.54
3224.25 3427.543227.44 3430.75
E2 3321.08 3191.50 3377.843332.10 3212.25 3383.99
3218.21 3427.083235.13 3444.43
E E3 3317.59 3167.22 3392.023335.47 3191.85 3401.66
3243.72 3444.433253.48 3465.68
50
040
0
(1)
4)1
4I
U) 0Or4 41
4J 0E
w -4&
4
(S.LI~~~fl AQ).g~V 04IS~Uq~b C>
51
are gone only after several days. After being destroyed by thermal annealing
(below 120*C), the E" centers can be brought back to their initial
concentrations by a short irradiation at 77 K.
The production of E centers in quartz is strongly dependent on previous
sample treatment. As described earlier, irradiation at 77 K of an as-grown
sample produces very few E" centers, whereas irradiating the same sample at
room temperature and then irradiating at 77 K causes nearly a factor of 100
increase in the E" center concentration. This indicates that the production
of the E centers is a two-step process, i.e., the initial room-temperature
irradiation changes "precursor" defects into intermediate configurations which
3" are then converted into E" centers by the subsequent 77 K irradiation.
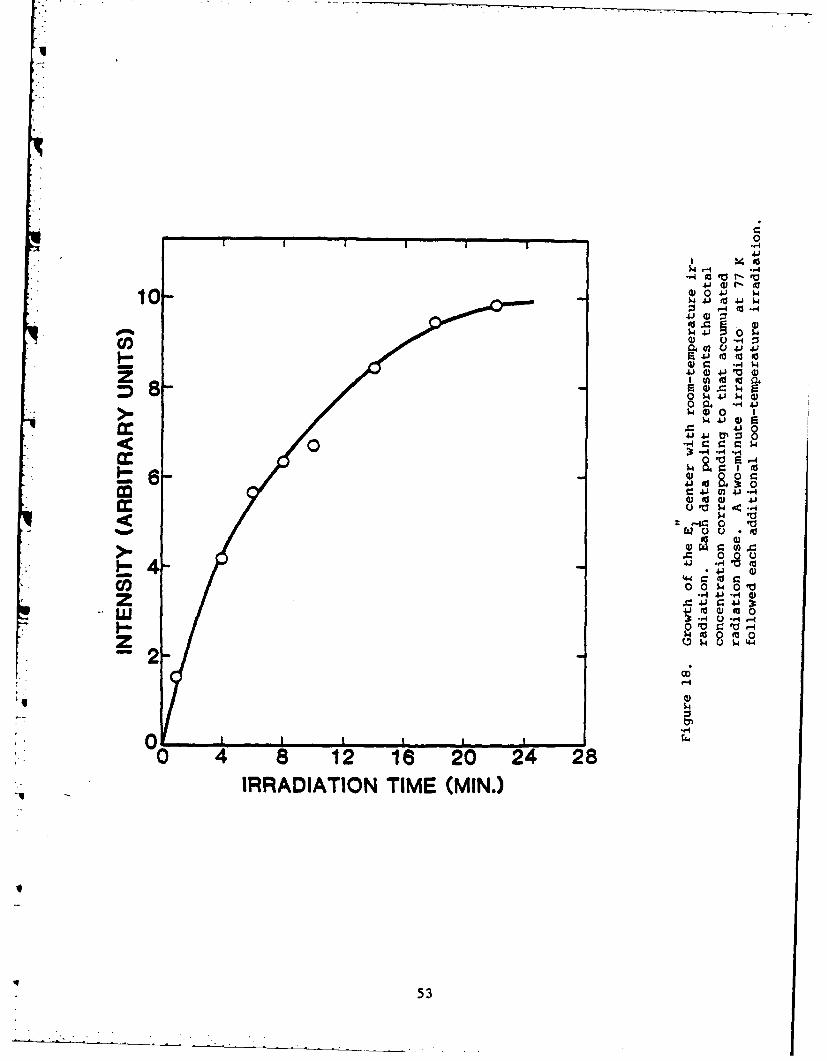
The growth of the E l center concentration with room-temperature
irradiation is illustrated in Fig. 18. Similar results are found for the E2
and E3 centers. Each room-temperature irradiation in this study was followed
by a short two-minute irradiation at 77 K. This latter irradiation was
necessary to convert into E centers all the intermediate configurations
formed by the room-temperature irradiation. The approximate room temperature
dose on the sample after 20 minutes of irradiation time is 2 x 10¹⁵
electrons/cm2 . The slow growth with room-temperature irradiation indicates
that the process which transforms the "precursor" defect may involve the
displacement of ions within the lattice. Interstitial protons (H+ ) and
alkalis (Li+ and Na+) known to be present in all quartz as charge compensators
are possible candidates for the ions being moved by the room-temperature
irradiation.
A variable-temperature irradiation study of an as-grown quartz sample wasV
performed where each irradiation at an intermediate temperature was followed
by a short 77 K irradiation (again to populate all potential E" centers). The
52
I 0
4J4..) 0 4J1 $4
10 O 4J ,4 $4:1 -~4U
S- 0 4 4
D- 8 - -,-$4 ,-
404.ai'0
4 4) 0
'.' 4 8 12-14 20424 2
-4 C 0
r. 4.1 U) 41) *-44 I41 O 41)
0V
MU
5#a
)I. 0
4.)0 0.w 0
-..4 41 .,4 4)
zJ 8
w-V C:a-
2--
0 4 8 12 18 20 24 28IRRADIATION TIME (MIN.)
53
results, plotted in Fig. 19, show that a 77 K irradiation will not produce the
E" centers unless the sample has been previously irradiated above 200 K.
Although the magnetic resonance signals for all of the E centers
disappeared after a thermal anneal at 1200C, they could be re-created by a
short 77 K irradition. This indicates that the anneal has converted the
centers to an unidentified non-paramagnetic form, but not back to the initial
"precursor" defect. If they had returned to the initial "precursor" form as a
result of the anneal to 1200C, a room temperature irradiation would be
required before the 77 K irradiation in order to re-create the E" centers. A
series of thermal anneals above 120C was performed on a quartz sample
containing E" centers to determine at what temperature the initial "precursor"
defect is restored so that the E" centers can not be re-created by just a 77 K
irradiation. The results of this high-temperature-anneal sequence are shown
in Fig. 20, where each anneal lasted 15 minutes and was followed by a short 77
K irradiation. After the anneal at 600 K, the number of El centers formed by
the 77 K irradiation is seen to decrease. An anneal above 750 K converts all
the E centers back into their "precursor" form and returns the quartz sample
to its as-grown state.
The E" centers have been produced in all unswept quartz samples at our
disposal, and the most intense ESR spectra were observed in samples with the
highest concentration of alumninum impurities, as detected by the presence of
[Ake+10 centers. On the other hand, the E" centers could be produced only in
very small numbers in quartz samples that had been completely swept in an air
or hydrogen atmosphere. Such sweeping removes all of the alkali interstitial
ins and replaces them with protons.
D. Discussion
In previous studies of point defects in a-quartz, the radiation-induced
* mobility of interstitial alkali ions (Li+ and Na+) has proved to be of
54
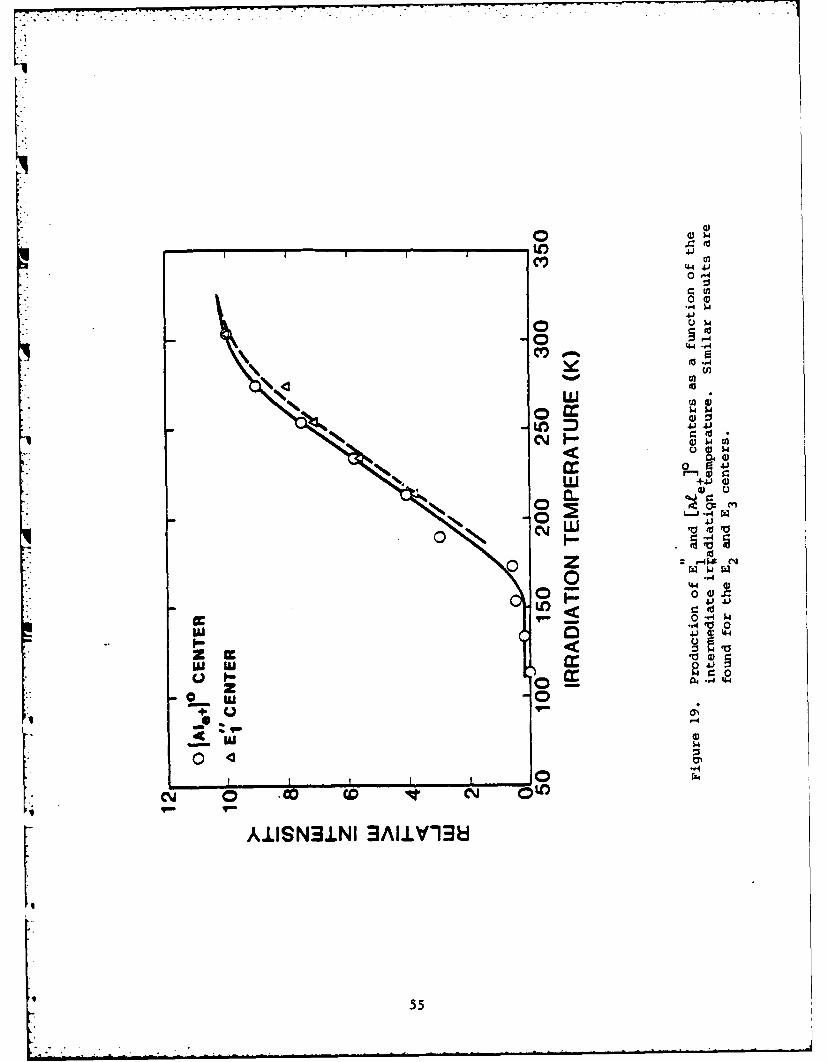
0 -
00
0 r-4
C..4
0 x0
4 )
+'40)00 0
0-4W
3-~ 4.4.
+006 - 4 1
.4 0 0 i[~ AUINj.N cc~V1
55
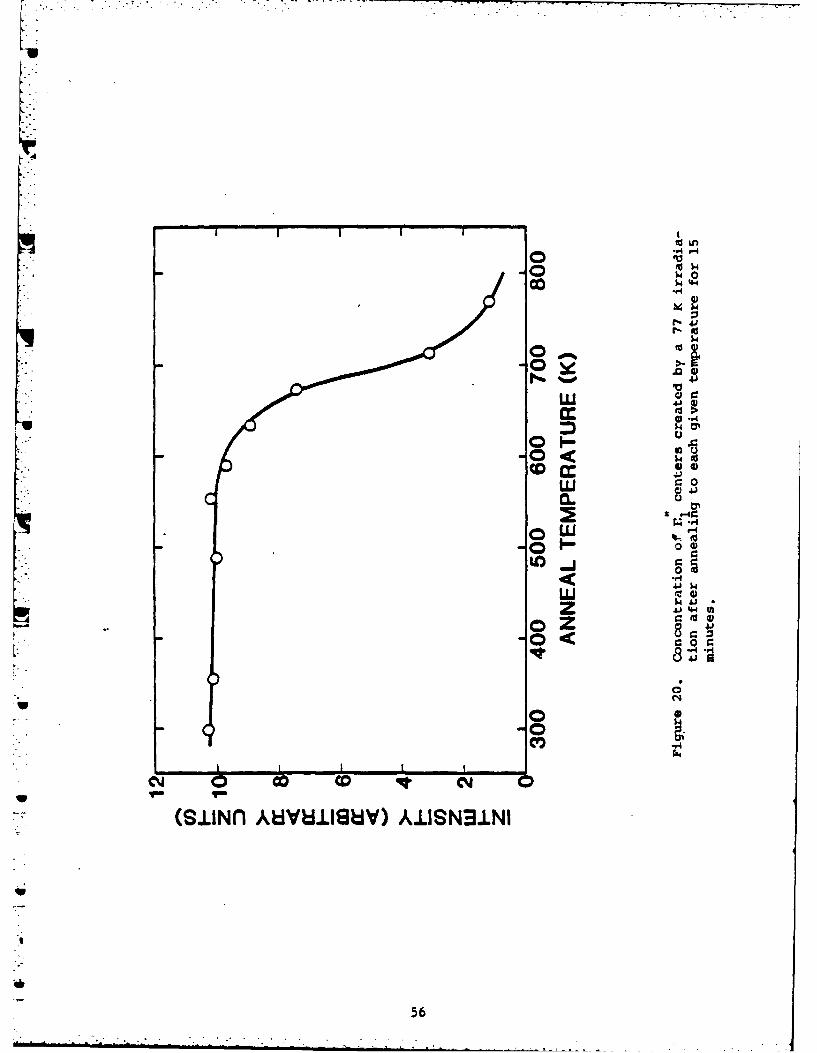
-.4 -4o 4
w4,
r4J41.
41)
wU 41
o %i.@0
U J
L41owz 4J1.44V
00c
0
co a4
77(S.LINf AbivYwishm AE.LISN3ULNI
56
fundamental importance. These interstitials are present in all as-grown
quartz and are initially located adjacent to the ubiquitous A13+
substitutional ions, where they act as charge compensators. In ESR studies,
* bMarkes and Halliburton 7 have shown that the interstitial alkali ions become
mobile under irradiation at temperatures above 200 K (see also data in Fig.
19). Acoustic loss measurements by Doherty et al.8 also support this result.
Once the interstitial alkali ions are released by the radiation, they diffuse
* along the c-axis channels and become stably trapped at unidentified sites
within the crystal. Heating above 750 K frees the interstitial alkalis from
these traps and allows them to return to the AL3+ sites, thus restoring the
crystal to its as-grown condition.
Many similarities are found when comparing the production and thermal
annealing characteristics of the E" centers, which are described in the
present section, with the previously reported 5,7 behavior of the interstitial
• alkali ions. The most important observation is that E centers are found in
-large concentrations only in unswept quartz or in partially swept quartz;
i.e., E centers are only produced when interstitial alkali ions are present
- in the crystal. Also, E centers can not be created in an as-grown sample
unless it has been irradiated above 200 K; similarly, interstitial alkali ions
can not be removed from AL3+ sites unless the irradiation temperature is above
200 K. Annealing a previously-irradiated sample above 750 K restores the
* precursor state of the E" center, and the same anneal returns the interstitial
alkali ions to the A13+ sites.
These results indicate that movement of the interstitial alkali ions away
from the AL3 + sites (by radiation at suitable temperatures) accompanies the
production of the E centers. There is, however, no evidence that the alkali
* ions are a direct part of the E" centers. Both lithium and sodium have a
57
- . ... . . • . . .
high-abundance isotope (7Li and 23Na) with nuclear spin of 3/2. Since the ESR
linewidths of the E" centers are extremely narrow (less than 0.05 gauss), a
* hyperfine interaction with either of these two nuclei would result in
observable splittings in the ESR spectra if the alkali ion were near the
unpaired electron spin system. No such splittings are found in the ESR
spectra of the E" centers.
Until complete sets of spin-Hamiltonian parameters are determined for the
E centers, specific models can not be developed. However, some general
properties the models will undoubtedly possess can be outlined. The narrow
ESR liaewidths, long spin-lattice-relaxaton times, and small negative g shifts
indicate that the E" centers must involve electrons associated with oxygen
vacancies, in direct analogy to the El, E2, and E4 centers in quartz. The
S - 1 nature of the E" centers suggests a model involving two nearby oxygen
vacancies, each with a single unpaired electron. To a first approximation,I
this would be equivalent to two neighboring E1 centers. This view is
supported by the two slightly inequivalent strong 2 9Si hyperfine interactions
observed for each E center. Using the maximum fine-structure splitting of
the El center (195) gauss), and assuming a dipole-dipole interaction, the
separation of the two electrons can be estmated. The separation value arrived
at by this procedure is. approximately 5 A for the Ej center and is even
larger for the other two centers.
VI . EVALUATION OF RADC-GROWN QUARTZ
Several years ago the Air Force established the Hydrothermal Growth
Facliity at RADC, Hanscom AFB. As part of our contract we performed several
evaluatit cests on the Air Force grown material. Aluminum is a pervasive and
active impurity in quartz. We are using the ESR test developed by Markes and
Halliburton7 to measure the aluminum content in RADC-grown quartz. Table VI
58
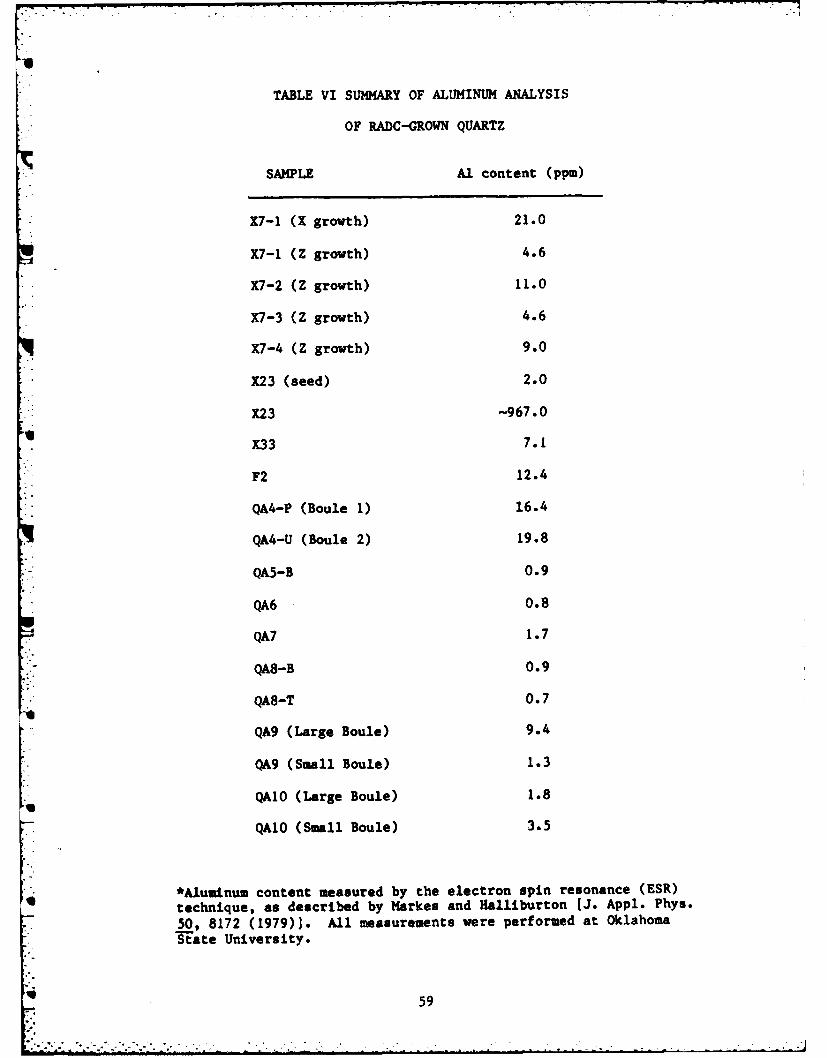
TABLE VI SUMMARY OF ALUMINUM ANALYSIS
OF RADC-GROWN QUARTZ
SAMPLE Al content (ppm)
X7-1 (X growth) 21.0
X7-1 (Z growth) 4.6
X7-2 (Z growth) 11.0
X7-3 (Z growth) 4.6
X7-4 (Z growth) 9.0
X23 (seed) 2.0
X23 -967.0
X33 7.1
F2 12.4
QA4-P (Boule 1) 16.4
QA4-U (Boule 2) 19.8
QA5-B 0.9
QA6 0.8
QA7 1.7
QA8-B 0.9
QA8-T 0.7
QA9 (Large Boule) 9.4
QA9 (Small Boule) 1.3
QA10 (Large Boule) 1.8
QA10 (Small Boule) 3.5
*Aluminum content measured by the electron spin resonance (ESR)
technique, as described by Markes and Halliburton [J. Appl. Phys.
50, 8172 (1979)]. All measurements were performed at Oklahoma
State University.
59
presents the results of this investigation.
"As-grown" synthetic alpha-quartz also contains OH-related defects, which
cause infrared bands at 3585cm -7, 3437c-1, and 3400cm -', as shown in Fig. 21.
Dodd and Fraser53 and later Sawyer54 have shown that the mechanical Q of a
crystal is related to the OH content of the quartz. This result has led to
the routine use of room temperature infrared absorption as a method of
predicting the Q of a quartz stone. This optical Q is usually determined by
measuring the room temperature absorption coefficient at 3500cmi.
Basically, this measurement picks up the temperature broadened 3437cm- l and
3400cm - l OH bands. Early internal friction studies by Jones and Brown55
showed that both the Na loss peak and the room temperature acoustic loss of 5
MHz 5th overtone AT-cut crystals increased with the rate at which the original
stone was grown. As a joint project with Dr. A. F. Armington of RADC we are
investigating the relation betwen the strength of these Oi- related absorption
bands and the crystal growth rate.
Pure Z-growth Z-plates were pi~pared for this study from stones grown at
the Air Force Hydrothermal Facility. The growth rate for quartz is defined as
the increase in thickness of the stone, including both sides, per unit time in
the direction perpendicular to the seed plate. All infrared absorption
measurements were taken with the sample at liquid nitrogen temperature.
In order to check for the presence of aluminum, a second absorption scan was
zcade after the sample was irradiated at room temperature. A room temperature
irradiation converts the Al-alkali center which is present in as-grown quartz
into AI-OH- and Al-hole centers. The Al-OH- center is responsible for the
3367cm-1 and 3306cm-1 bands. Fig. 21 shows a typical absorption spectrum
for a sample grown at a relatively fast rate. Figure 22 shows the absorption
coefficients of the 3585cm -l and the 3400cm - l bands as a function of growth
60
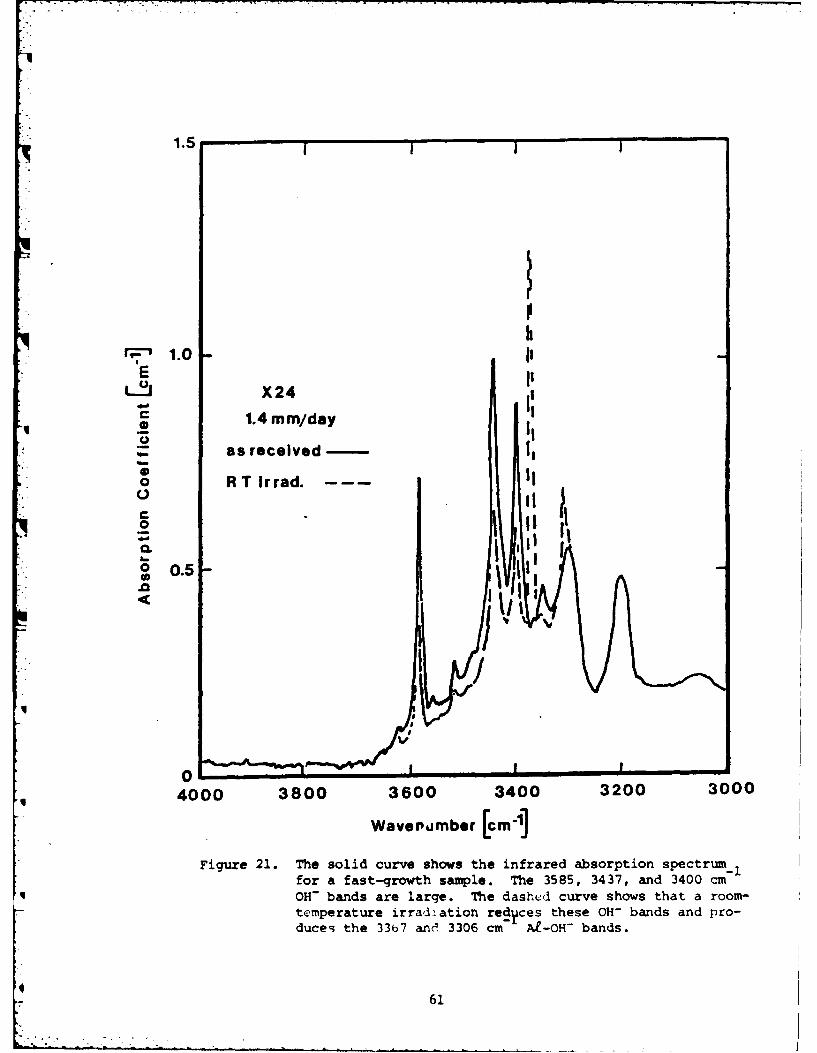
1.5
r' 1.0
L.JX24
C 1.4 mm/day
as received - I,
0CL0.g
0.5,
04000 3800 3600 3400 3200 3000
['W
u [cm-i]Wavepumber [m1
Figure 21. The solid curve shows the infrared absorption spectrum 1for a fast-growth sample. The 3585, 3437, and 3400 cm
OH- bands are large. The dashed curve shows that a room-temperature irradiation red ces these OH- bands and pro-duces the 33b7 anO 3306 cm At-OH- bands.
6i[: 61
rate. Both bands increase in essentially the same manner. Figure 23 shows
that the 3437cm-1 band also increases at the same rate as the 3585cm -I band.
All three bands are due to OR- related defects since when the sample is swept
in a D2 atmosphere as described earlier in this report they are replaced by
their OD analogs.5 6 However, the proton trap or traps are unknown.
When quartz is irr-Jlated at room temperature the interstitial alkali
ions at the aluminum site are replaced by either protons or holes on a
non-bonding orbital of an adjacent oxygen. The protons come from the
OH-related defects described above. To a good approximation the resulting
decreases in the 3585, 3437, and 3400cm- I bands acounts for the size of the
3367 and 3306cm- I AI-OH-bands. 6 Since the Al-hole center is also produced by
a room temperature irradiation the height of the 3367 and 3306cm-1 bands does
not give the total aluminum content. However, their presence does indicate
the relative aluminum concentration. Figure 24 shows the 3367cm AI-OH-and
3585cm- 1 OH band absorption coefficients versus growth rate. The Al-OH-band
increases somewhat faster than the 3585cm "1 band. The heights of the 3367 and
3306cm -I bands in the samples grown at 1.27 ur/day and 0.3 nm/day indicate
approximately 6 and 0.5 ppm Al-Ol-centers, respectively. The ESR test for
aluminum was performed and showed 12.4 and 0.9 ppm Al, respectively, for the
UW two samples.
The defects responsible for the Of- related bands at 3585, 3437, and 3400
cm -1 increase rapidly for crystal growth rates greater than 0.7 mm/day. All
*g three bands grow together. The aluminum content also increases with growth
rate.
62
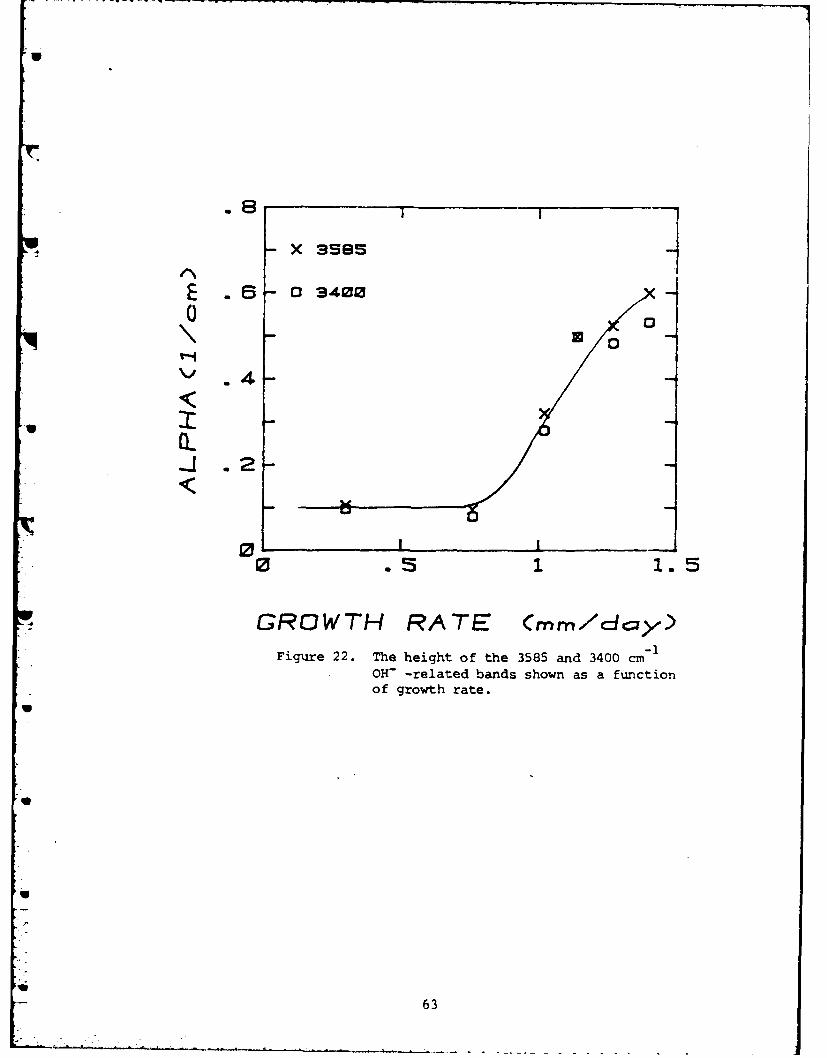
U
E. 34000
.4-
0LJ .2-
0S0O .5 1 1.5
GROWTH RATE (mm1d>-)Figure 22. The height of the 3585 and 3400 cm-
OH- -related bands shown as a functionof growth rate.
63
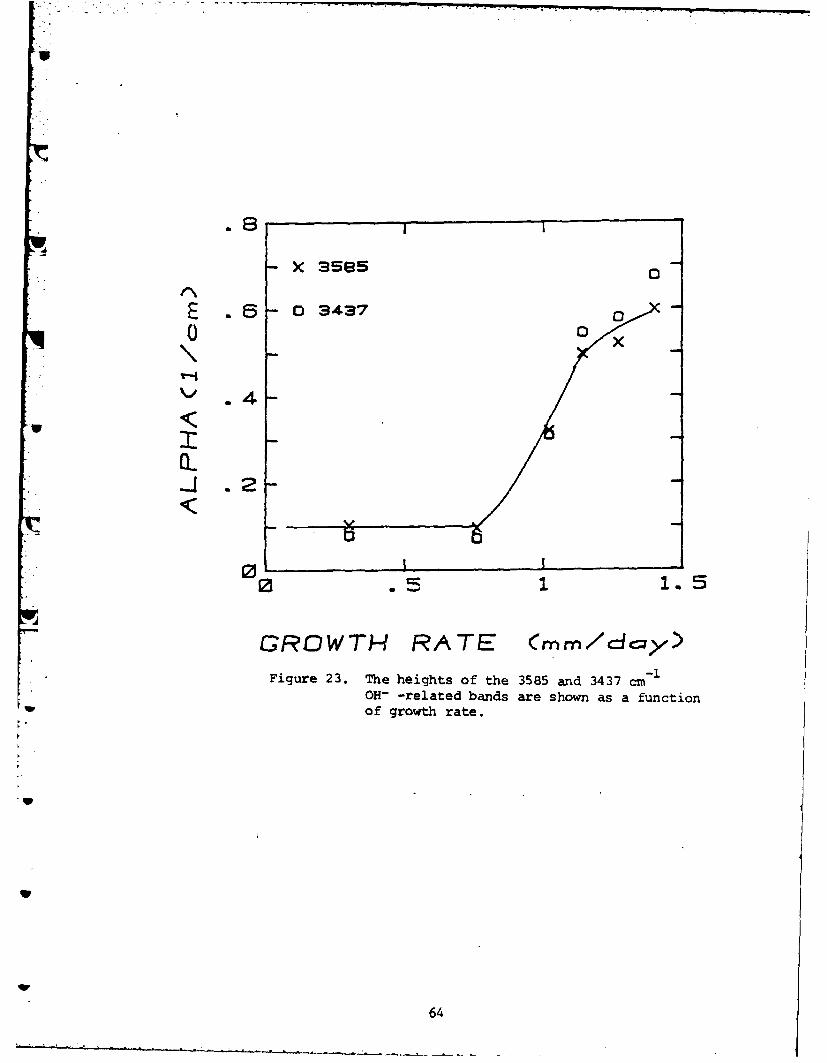
V
X 0ses
E . 0 o34370 00 94a00
V 1
tt11.2
GROWTH RATE (mm/dc~y)Figure 23. The heights of the 3585 and 3437 cm -1
OH- -related bands are shown as a functionof growth~ rate.
q \
6
" :64
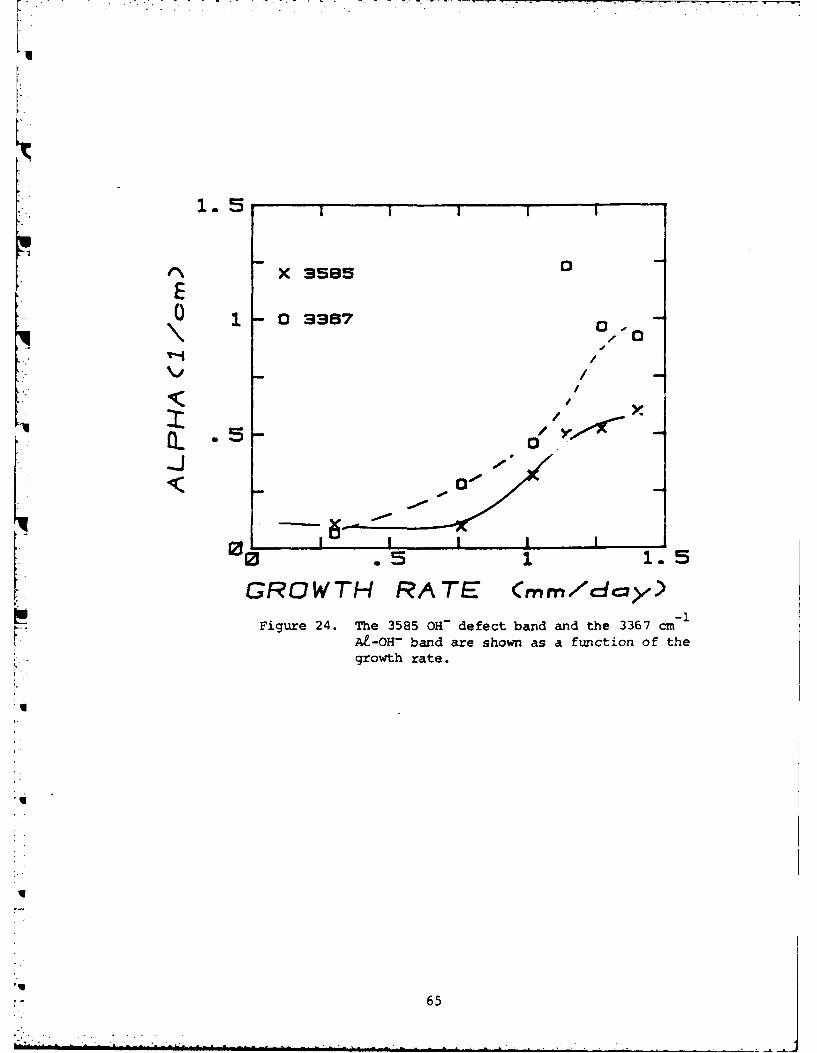
| '-"
/
I/I I I .
0 0 . 5 1 1 . 5
GROWTH RA TE mm/dcy)Figure 24. The 3585 0H defect band
and the 3367 cm
' A-O- band are shown as a function of the
L.. gro wh rate.
IL
65
r- 65
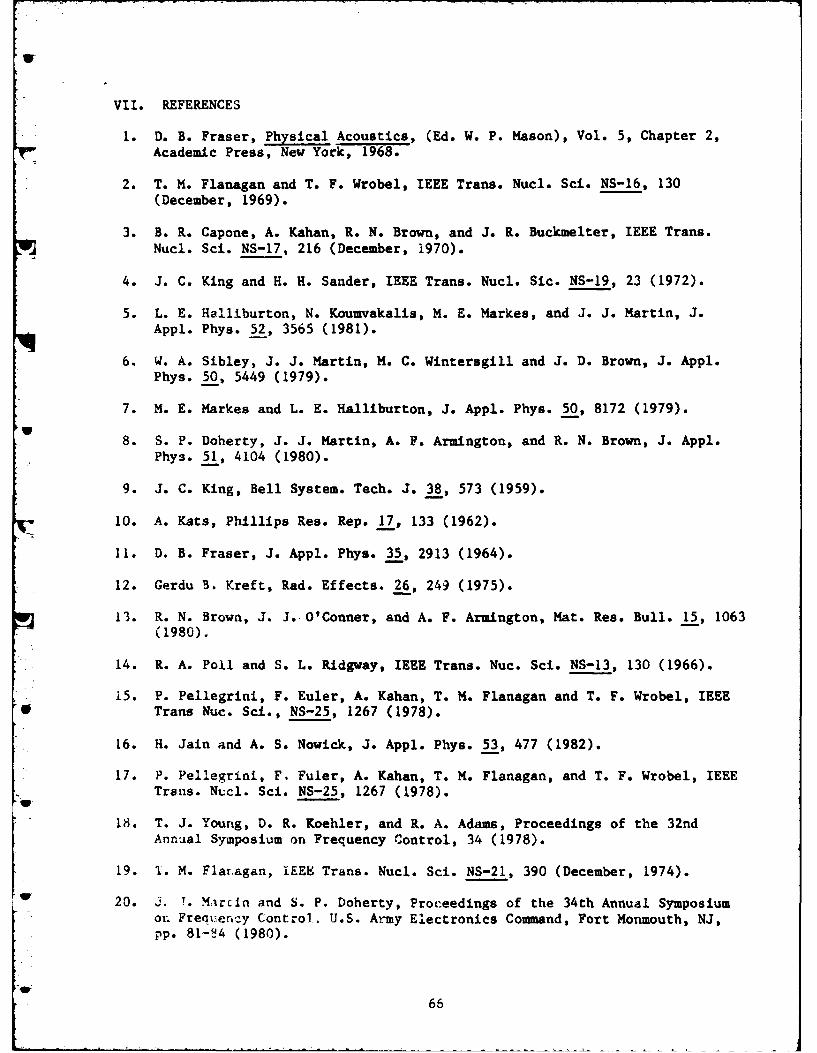
VII. REFERENCES
1. D. B. Fraser, Physical Acoustics, (Ed. W. P. Mason), Vol. 5, Chapter 2,Academic Press, New York, 1968.
2. T. M. Flanagan and T. F. Wrobel, IEEE Trans. Nuci. Sci. NS-16, 130(December, 1969).
3. B. R. Capone, A. Kahan, R. N. Brown, and J. R. Buckmelter, IEEE Trans.Nucl. Sci. NS-17, 216 (December, 1970).
4. J. C. King and H. H. Sander, IEEE Trans. Nucl. Sic. NS-19, 23 (1972).
5. L. E. Halliburton, N. Koumvakalis, M. E. Markes, and J. J. Martin, J.Appl. Phys. 52, 3565 (1981).
6. W. A. Sibley, J. J. Martin, M. C. Wintersgill and J. D. Brown, J. Appl.Phys. 50, 5449 (1979).
7. M. E. Markes and L. E. Halliburton, J. Appl. Phys. 50, 8172 (1979).
8. S. P. Doherty, J. J. Martin, A. F. Armington, and R. N. Brown, J. Appl.Phys. 51, 4104 (1980).
9. J. C. King, Bell System. Tech. J. 38, 573 (1959).
10. A. Kats, Phillips Res. Rep. 17, 133 (1962).
11. D. B. Fraser, J. Appl. Phys. 35, 2913 (1964).
12. Gerdu 3. Kreft, Rad. Effects. 26, 249 (1975).
13. R. N. Brown, J. J..O'Conner, and A. F. Armington, Mat. Res. Bull. 15, 1063(1980).
14. R. A. Poll and S. L. Ridgway, IEEE Trans. Nuc. Sci. NS-13, 130 (1966).
15. P. Pellegrini, F. Euler, A. Kahan, T. M. Flanagan and T. F. Wrobel, IEEE* Trans Nuc. Sci., NS-25, 1267 (1978).
16. H. Jain and A. S. Nowick, J. Appl. Phys. 53, 477 (1982).
17. P. Pellegrini, F, Fuler, A. Kahan, T. M. Flanagan, and T. F. Wrobel, IEEETrans. Nucl. Sci. NS-25, 1267 (1978).
18. T. J. Young, D. R. Koehler, and R. A. Adams, Proceedings of the 32ndAnnual Symposium on Frequency Control, 34 (1978).
19. 1. M. Flar agan, LEEE Trans. Nud1. Sci. NS-21, 390 (December, 1974).
20. J. T. M;arcin and S. P. Doherty, Proceedings of the 34th Annual Symposiumor. Frequency Control. U.S. Army Electronics Command, Fort Monmouth, NJ,pp. 81- 4 (1980).
66
21. A. W. Warner, Bell System Technical J. 40, 1193 (1960).
22. J. C. King, A. A. Ballman and R. A. Laudise, J. Phys. Chem. Solids. 23,1019 (1962).
23. D. S. Park and A. S. Nowick, Phys. Stat. Sol (a) 26, 617 (1979).
24. H. G. Lipson, A. Kahan, R. N. Brown and F. Euler, Proceedings of the 35thAnnual Symposium on Frequency Control, U.S. Army Electronics Command, FortMonmouth, NJ pp. 329-334 (1981).
25. D. R. Koehler. Proceedings of the 35th Annual Symposium on FrequencyControl, U.S. Army Electronics Command, Fort Monmouth, NJ pp 327-328(1981).
26. J. J. Martin, L. E. Halliburton, and R. B. Bossoli, Proceedings of the35th Annual Symposium on Frequency Control, U.S. Army Electronics Command,Fort Monmouth, NJ pp 317-320 (1981).
27. J. M. Stevels and J. Volger, Philips Res. Repts. 17, 284 (1962).
28. A. L. Taylor and G. W. Farnell, Can. J. Phys. 42, 595 (1964).
29. J. C. King and H. R. Sander, Radiat. Eff. 26, 203 (1975).
30. J. A. Weil, Radiat. Eff. 26 261 (1975).
31. P. L. Mattern, K. Lengweiler, and P. W. Levy, Radiat. Eff. 26, 237 (1975).
32. G. H. Sigel, J. Non-Cryst. Solids 13, 372 (1973/74).
33. D. L. Griscom, Proceedings of the Thirty-Third Annual Symposium onFrequency Control, 98 (1979).
34. A. N. Trukhin and A. E. Plaudis, Soy. Phys. Solid State 21, 644 (1979).
35. B. P. Gritsenko, V. M. Lisitsyn, and V. N. Stepanchuk, Sov. Phys. SolidState 23, 222 (1981).
36. E. J. Friebele, D. L. Griscom, M. Stapelbroek, and R. A. Weeks, Phys. Rev.Lett. 42, 1346 (1979).
37. D. M. Malik, E. E. Kohnke, and W. A. Sibley, J. Appl. Phys. 52, 3600(1981).
38. J. H. Mackey, J. Chem. Phys. 39, 74 (1963).
39. R. A. Weeks, J. Appl. Phys. 27, 1376 (1956).
40. R. H. Silsbee, J. Appl. Phys. 32, 1459 (1961).
41. F. J. Feigl, W. B. Fowler, and K. L. Yip, Solid State Comun. 14, 225(1974).
67
U
42. K. L. yip and W. B. Fowler, Phys. Rev. B 11, 2327 (1975).
43. R. A. Weeks and C. M. Nelson, J. Am. Ceram. Soc. 43, 399 (1960).
44. R. A. Weeks, Phys. Rev. 130, 570 (1963).
45. J. G. Castle, D. W. Feldman, P. G. Klemens, and R. A. Weeks, Phys. Rev.
130, 577 (1963).
46. L. E. Halliburton, B. D. Perlson, R. A. Weeks, J. A. Weil, and N. C.
Wintersgill, Solid State Commun. 30, 575 (1979).
47. B. M. Moiseev, P. 0. Okulevich, and L. T. Rakov, Sov. Phys. Crystallogr.
25, 370 (1980). Translated from Kristollografiya 25, 640 (1980).
48. J. Isoya, J. A. Weil, and L. E. lialliburton, J. Chem. Phys. 74, 5436(1981).
49. Weeks and Nelson, in reference 43, have previously used the E" notation torefer to an oxygen vacancy that contains two electrons in an S - 0configuration.
50. R. A. Weeks and M. M. Abraham, Solid State Division Annual ProgressReport, Oak Ridge National Laboratory, USA, p. 36 (1964).
51. R. A. Weeks and M. M. Abraham, Bull; Am. Phys. Soc. 10, 374 (1965).
52. V. P. Solntsev, R. I. Hashkovtsev, and M. Ya. Shcherbakova, J. Struct,Chem. 18, 578 (1977). Translated from Zhurnal Strukturnoi Khimii, 18, 729(1977).
53. D. M. Dodd and D. B. Fraser, J. Phys. Chem. Solids. 26, 673 (1965).
54. B. Sawyer, IEEE Trans. Sonics and Utrasonics, SU-19, 411 (1972).
55. C. K. Jones and C. S. Brown, Proc. Phys. Soc. 79, 930 (1962).
56. Nicholas Koumvakalis and Mark arkes, J. Appl. Phys. 51, 3431 (1980).
r
K 6
3tjS11; J11 1t ~ 4
MISSION
Rome Air Develpment CenterRam ptaft and ez*wu l~a~c~. devom tea and
Cmwi~~tvdand I enu tLt a Couw. dm&CAt
1pkowvi to UP wgu 0 ji* (PRe) a1W O~Aa Em
~!,UUW(AL &P4 xCL~omESeA& gudwAu and ecomsot, '&4k-vem oj flo~ and etopce objwct4., UftU~ieme datwetevcaton h am"# n, o'wi-t#oA-g Ap l tedcuwotogy,okM~AA pIpgto,0 tt Aeesimsdv
Fka n ~c1*e4U'~~,s~ia.u~t n
Priote byUsited Uem"e Air PorceNm..... AFB, Mass. 01731
'I...[4
U
U
I'
Is
4 N~,>
p
I
IU