Embed Size (px)
Citation preview

tab
11.1 AXIAL STRAIN
• When an axial load is applied to a bar, normal
stresses are produced on a cross section
perpendicular to the axis of the bar.
– In addition, the bar increases in length, as shown:

tab
11.1 AXIAL STRAIN
• Change in length, represented by the Greek
lowercase letter δ (delta), is called deformation.
– The change in length δ is for a bar of length L.
Strain is usually expressed dimensionally
as inches per inch or meters per meter,
though it is a dimensionless quantity.
Strain is
defined by:
This equation gives average strain over a length L.
To obtain strain at a point, let length L approach zero.
• Change in length, per unit of length, represented
by Greek lowercase letterε(epsilon), is strain.

tab
11.1 AXIAL STRAIN
• For an axial load, stress in the direction of the
load is called axial stress.
– Strain in the direction of the load is called axial strain.
Examples and problems start on textbook page 42.
• With axial strain, comes a smaller normal or
lateral strain, perpendicular to the load.
– When the axial stress is tensile, the axial strain is
associated with an increase in length.
– Lateral strain is associated with a decrease in width.
• Tensile strain is called positive strain, and
compressive strain is called negative strain.

tab
11.2 TENSION TEST ANDSTRESS–STRAIN DIAGRAM
• A common material test is the tension test.
– If a large enough piece is available, and can be
machined, a round cross section could be used.
– For thin plate, a rectangular or square section.
• Deformation or change in length of the specimen
is measured for a specified distance known as
the gauge length.
– Strain is the deformation divided by the gauge length.
The profile for
a typical round
test specimen:
Fillets reduce stress
concentration caused
by the abrupt change
in section.

tab
11.2 TENSION TEST ANDSTRESS–STRAIN DIAGRAM
• The tension specimen
is placed in a testing
machine such as the
one shown.
Strain can be measured by sensors built
into the testing machine or by separate
gauges attached directly to the specimen.

tab
11.2 TENSION TEST ANDSTRESS–STRAIN DIAGRAM
• The electrical resistance strain gauge consists of
a length of metallic foil or fine-diameter wire that
is generally formed into a looped configuration.
The gauge is epoxied to the surface
of a test specimen and connected
via lead wires to a sensitive electrical
circuit that measures the resistance
of the foil or wire used in the gauge.

tab
11.2 TENSION TEST ANDSTRESS–STRAIN DIAGRAM
• With no load applied, the electrical resistance has
a certain value.
• When a load is applied, the foil or wire deforms,
producing a measurable change in resistance.
– That can be directly correlated to specimen strain.

tab
11.2 TENSION TEST ANDSTRESS–STRAIN DIAGRAM
• Values of stress are found by dividing the load
by the original cross-sectional area.
– And the corresponding value of strain by dividing
the deformation by the gauge length.
• Values obtained can be plotted in a stress–strain
curve, the shape of which will depend on the kind
of material tested.
– Temperature and speed at which the test is performed
also affect the results.

tab
11.2 TENSION TEST ANDSTRESS–STRAIN DIAGRAM
Stress–strain curves for
three different kinds of material.
Low-carbon steel,
a ductile material
with a yield point.
A ductile material,
such as aluminum
alloy, which doesn’t
have a yield point.
A brittle material,
such as cast iron
or concrete, in
compression.

tab
11.2 TENSION TEST ANDSTRESS–STRAIN DIAGRAM
• Proportional limit: maximum stress for which
stress is proportional to strain.
– Stress at point P.

tab
11.2 TENSION TEST ANDSTRESS–STRAIN DIAGRAM
• Yield point: stress for which the strain increases without an increase in stress.– Horizontal portion of the curve ab. Stress at point Y.
tab
11.2 TENSION TEST ANDSTRESS–STRAIN DIAGRAM
• Yield strength: the stress that will cause the
material to undergo a certain specified amount
of permanent strain after unloading.
– Usual permanent strain percent. Stress at point YS.

tab
11.2 TENSION TEST ANDSTRESS–STRAIN DIAGRAM
• Breaking strength: stress in material based on
original cross-sectional area at the time it breaks.
– Fracture or rupture strength. Stress at point B.

tab
11.2 TENSION TEST ANDSTRESS–STRAIN DIAGRAM
• Compression tests are made in a manner similar
to tension tests.
– Specimen cross section is preferably of a uniform
circular shape, although a rectangular or square
shape is often used.
• Recommended ratio of length to major cross-
sectional specimen dimension (diameter/side
length) is 2:1.
– This ratio allows a uniform state of stress to develop
on the cross section, while reducing the tendency of
the specimen to buckle sideways.

tab
11.2 TENSION TEST ANDSTRESS–STRAIN DIAGRAM
• The right-hand sample
(a nominal 4 x 4) is 8”
long & exhibits a typical
compressive failure.

tab
11.2 TENSION TEST ANDSTRESS–STRAIN DIAGRAM
• The left-hand specimen,
12” in length, failed by a
combination of compression
and buckling.

tab
11.2 TENSION TEST ANDSTRESS–STRAIN DIAGRAM
• For ductile materials, values of yield-point stress
are commonly used as the allowable stress for in-
service applications.
A good example of this
is metal used in structural
members, most of which
are made of A36 steel, an
industry designation based
on the material’s yield point
strength of 36,000 psi (~250
MPa).

tab
11.2 TENSION TEST ANDSTRESS–STRAIN DIAGRAM
• The steel tensile specimens, below left, exhibit
the typical elongation and necking that precedes
an unmistakable point of fracture.
The copper (bottom right)
and aluminum (top right)
compression specimens
deformed under load, with
no clear signs of failure.
Due to this behavior, ductile
materials are not generally
tested in compression.

tab
TENSION AND COMPRESSION TEST
Copyright © 2011 Pearson Education South Asia Pte Ltd

tab
APPLICATIONS
Copyright © 2011 Pearson Education South Asia Pte Ltd

tab
APPLICATIONS (cont)
Copyright © 2011 Pearson Education South Asia Pte Ltd

tab
STRESS STRAIN DIAGRAM
Copyright © 2011 Pearson Education South Asia Pte Ltd
• Note the critical status for strength specification
� proportional limit
� elastic limit
� yield stress
� ultimate stress
� fracture stress

tab
11.2 TENSION TEST ANDSTRESS–STRAIN DIAGRAM
• Brittle materials, such as cast iron or concrete,
often have little or no strength in tension.
– They are used primarily for compressive loads
– Allowable stresses for these materials are generally
set at some percentage of the material’s ultimate
strength.

tab
11.3 HOOKE’S LAW
Figs. (a) & (b) and to a lesser degree, (c), show stress is directly
proportional to strain (the curve is a straight line) on the lower end
of the stress–strain curve.
• Based on tests of various materials and on the
idealized behavior of those materials…
– Hooke’s law states that stress is proportional to strain.

tab
11.3 HOOKE’S LAW
• Shown here is a stress–strain curve for a material
that follows Hooke’s law.
The slope of the stress–strain curve
is the elastic modulus or modulus of
elasticity, E.
The elastic modulus, E, is equal to
the slope of the stress–strain curve.
Hooke’s law only applies
up to the proportional
limit of the material.

tab
11.3 HOOKE’S LAW
• Because strain is dimensionless, the elastic
modulus, E, has the same units as stress.
– The modulus is a measure of the stiffness or
resistance of a material to loads.
• Except for brittle materials, high values of E
generally correspond to stiffer materials
– Low values are consistent with more elastic materials.

tab
11.4 AXIALLY LOADED MEMBERS
• From Hooke’s law:
• When the stress and strain are caused by axial
loads, we have:

tab
11.5 STATICALLY INDETERMINATEAXIALLY LOADED MEMBERS
• If a machine or structure is made up of one or
more axially loaded members, the equations of
statics may not be sufficient to find the internal
reactions in the members.
• The problem is said to be statically indeterminate,
and equations for the geometric fit of the
members are required.
To write the equations:

tab
11.6 POISSON’S RATIO
• When a load is applied along the axis of a bar,
axial strain is produced.
– At the same time, a lateral strain, perpendicular to
the axis, is also produced.
• If the axial force is in tension, the length of the
bar increases.
– The cross section contracts or decreases.
• A positive axial stress produces a positive axial
strain and a negative lateral strain.
– For negative axial stress, axial strain is negative,
and the lateral strain is positive.

tab
11.6 POISSON’S RATIO
• The ratio of lateral strain to axial strain is called
Poisson’s ratio.
• It is constant for a given material provided:
– The material is not stressed above the proportional limit.
– The material is homogeneous.
– The material has the same physical properties in all
directions.

tab
11.6 POISSON’S RATIO
• Poisson’s ratio, represented by Greek lowercase
letter ν(nu), is defined by the equation:
The negative sign ensures that
Poisson’s ratio is a positive number.
• The value of Poisson’s ratio,ν, varies from 0.25 to
0.35 for different metals.
– For concrete, it may be as low as ν= 0.1, and for
rubber, as high asν= 0.5.

tab
11.8 ADDITIONAL MECHANICALPROPERTIES OF MATERIALS
• Elastic Limit: The highest stress that can be
applied without permanent strain when the
stress is removed.
– To determine elastic limit would require application
of larger & larger loadings and unloadings of the
material until permanent strain is detected.

tab
11.8 ADDITIONAL MECHANICALPROPERTIES OF MATERIALS
• Elastic Range: Response of the material as
shown on the stress–strain curve from the origin
up to the proportional limit P.

tab
11.8 ADDITIONAL MECHANICALPROPERTIES OF MATERIALS
• Plastic Range: Response of the material as
shown on the stress–strain curve from the
proportional limit P to the breaking strength B.

tab
11.8 ADDITIONAL MECHANICALPROPERTIES OF MATERIALS
• Necking Range: Response of the material
as shown on the stress–strain curve from the
ultimate strength U to the breaking strength B.
Beyond the ultimate strength,
the cross-sectional area of a
localized part of the specimen
decreases rapidly until rupture
occurs.
Referred to as necking, it is a
characteristic of low-carbon
steel—brittle materials do not
exhibit it at usual temperatures.
It is part of the plastic range.

tab
11.8 ADDITIONAL MECHANICALPROPERTIES OF MATERIALS
• Percentage Reduction in Area: When a ductile
material is stretched beyond its ultimate strength,
the cross section “necks down,” and the area
reduces appreciably.
Defined by:
…where Ao is the original, and Af the
final minimum cross-sectional area.
It is a measure of ductility.

tab
11.8 ADDITIONAL MECHANICALPROPERTIES OF MATERIALS
• Percentage Elongation: a comparison of the
increase in the length of the gauge length to the
original gauge length.
It is also a measure of ductility.
Defined by:
…where Lo is the original, and Lf
the final gauge length..

tab
11.8 ADDITIONAL MECHANICALPROPERTIES OF MATERIALS
• Modulus of Resilience: The work done on a unit
volume of material from a zero force up to the
force at the proportional limit.
This is equal to the area under
the stress–strain curve from
zero to the proportional limit.
At right, Area A1.
Units of in.-lb/in.3 or N ( m/m3.)

tab
11.8 ADDITIONAL MECHANICALPROPERTIES OF MATERIALS
• Modulus of Toughness: The work done on a
unit volume of material from a zero force up to
the force at the breaking point.
This is equal to the area under
the stress–strain curve from
zero to the breaking strength.
At right, Areas A1 and A2.
Units of in.-lb/in.3 or N ( m/m3.)

tab
11.8 ADDITIONAL MECHANICAL PROPERTIESRecent Developments in Materials Technology
• Research in development &applications of new
materials is a continual process.
– Today, much work takes place at the microscopic
level and involves nanotechnology.
• The strongest material ever tested is a carbon
material called graphene.
– Said to be 200 times stronger than structural steel,
it consists of a single layer of graphite atoms that
may be rolled into tiny tubes (called nanotubes).
– The tubes can be used as the basis of graphite fibers
found in products requiring high strength & light weight.

tab
11.8 ADDITIONAL MECHANICAL PROPERTIESRecent Developments in Materials Technology
• A process has been developed in which ceramic
particles are added to molten aluminum, and a
gas is blown into the mixture.
– When solidified, a honeycombed cellular aluminum
material is formed that is lightweight yet strong.
• The use of nano-sized additives has been found
to double the effective life of concrete.
– By preventing penetration of chloride and sulfate ions
from sources such as road salt, seawater, and soils.

tab
11.8 ADDITIONAL MECHANICAL PROPERTIESRecent Developments in Materials Technology
• A new structural material similar to concrete has
been developed that uses a mixture of fly ash
and organic materials.
– This new material has good insulating properties &
fire resistance, as well as high & light weight.
• Several forms of enhanced steels have recently
been developed.
– Sometimes referred to as “super steels,” they are
stronger than traditional counterparts, can withstand
extreme levels of heat and radiation, and generally
have much higher resistance to corrosion.

tab
11.8 ADDITIONAL MECHANICAL PROPERTIESRecent Developments in Materials Technology
• A structural coating has been developed using
a combination of carbon nanotubes & polymers.
– When applied to a bridge, the coating can detect
internal cracks long before they become visible.
• The U.S. Environmental Protection Agency
recently approved public health claims that
copper, brass, and bronze are capable of killing
potentially deadly bacteria, including methicillin-
resistant Staphylococcus aureus (MRSA).

tab
11.9 STRAIN AND STRESS DISTRIBUTIONS: SAINT-VENANT’S PRINCIPLE
• In our discussion of the uniform axially loaded
bar, we have assumed a uniform distribution of
normal stress on any plane section near the
middle of the bar away from the load.
– We ask here what effect a concentrated compressive
load has on the stresses and strains near the load.
tab
11.9 STRAIN AND STRESS DISTRIBUTIONS: SAINT-VENANT’S PRINCIPLE
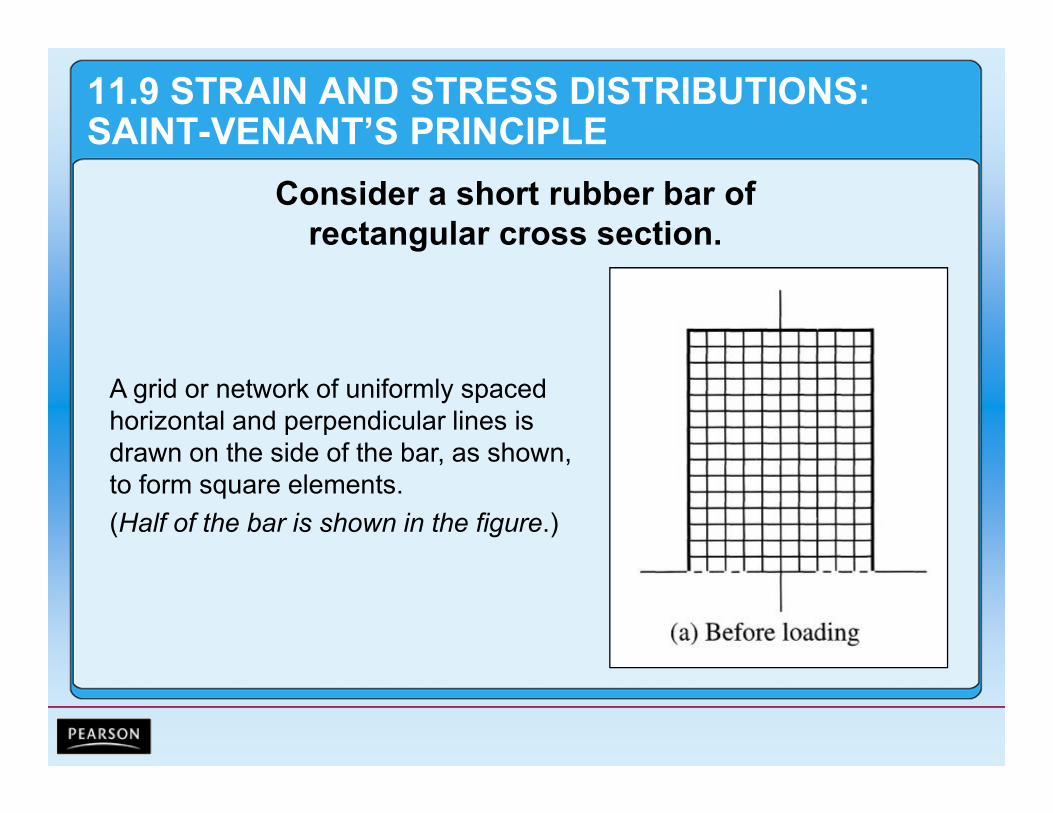
Consider a short rubber bar of
rectangular cross section.
A grid or network of uniformly spaced
horizontal and perpendicular lines is
drawn on the side of the bar, as shown,
to form square elements.
(Half of the bar is shown in the figure.)

tab
11.9 STRAIN AND STRESS DISTRIBUTIONS: SAINT-VENANT’S PRINCIPLE
• Compressive loads are applied to the bar.
Close to the load, the elements are
subjected to large deformations or
strain, while other elements on the
end of the bar, away from the load,
remain virtually free of deformations.
Moving axially away from the load,
we see a gradual smoothing of the
deformations of the elements, and
thus a uniform distribution of strain
and the resulting stress along a
cross section of the bar.

tab
11.9 STRAIN AND STRESS DISTRIBUTIONS: SAINT-VENANT’S PRINCIPLE
• Observations are verified by results from the
theory of elasticity.
Showing distribution
of stress for various
cross sections of an
axially loaded short
compression member.

tab
11.9 STRAIN AND STRESS DISTRIBUTIONS: SAINT-VENANT’S PRINCIPLE
• Sections are taken at distances of b/4, b/2, and b
from the load where b is the width of the member.
It appears the
concentrated load
produces a highly
nonuniform stress
distribution & large
local stresses near
the load.

tab
11.9 STRAIN AND STRESS DISTRIBUTIONS: SAINT-VENANT’S PRINCIPLE
• Sections are taken at distances of b/4, b/2, and b
from the load where b is the width of the member.
Notice how quickly the
stress smoothes out to
a nearly uniform
distribution.
Away from the load at
a distance equal to the
width of the bar, the
maximum stress differs
from the average stress
by only 2.7 percent.

tab
11.9 STRAIN AND STRESS DISTRIBUTIONS: SAINT-VENANT’S PRINCIPLE
• The smoothing out of the stress distribution is
an illustration of Saint-Venant’s principle.
Barre de Saint-Venant, a French engineer and
mathematician, observed that near loads, high
localized stresses may occur, but away from the
load at a distance equal to the width or depth of
the member, the localized effect disappears and
the value of the stress can be determined from
an elementary formula.
Such as:

tab
11.9 STRAIN AND STRESS DISTRIBUTIONS: SAINT-VENANT’S PRINCIPLE
• This principle applies to almost every other type
of member and load as well.
– It permits us to develop simple relationships between
loads and stresses and loads and deformations.

tab
11.10 STRESS CONCENTRATIONS
• Stress near a concentrated load is several times
larger than the average stress in the member.
– Similar conditions exist at discontinuities in a member.
Shown here is stress distribution in flat bars under an axial
load, with a circular hole, semicircular notches, and quarter-
circular fillets.

tab
11.10 STRESS CONCENTRATIONS
• Whether stress concentrations are important in
design depends on the nature of the loads and
the material used for the member.
– If the loads are applied statically on a ductile material,
stress concentrations are usually not significant.
– For impact or repeated loads on ductile material, or
static loading on brittle material, it cannot be ignored.
• Stress concentrations are usually not important in
conventional building design.
– They may be important in the design of supports for
machinery and equipment and for crane runways.

tab
11.10 STRESS CONCENTRATIONS
• Stress concentrations should always be
considered in the design of machines.
– In most machine part failures, cracks form at points
of high stress.
– The cracks continue to grow under repeated loading
until the section can no longer support the loads.
• The failure is usually sudden and dangerous.

tab
11.11 REPEATED LOADING, FATIGUE
• Many structural and most machine members are
subjected to repeated loading and the resulting
variations of the stresses in the members.
– These stresses may be significantly less than
the static breaking strength of the member, but
if repeated enough times, failure due to fatigue
can occur.
• The mechanism of a fatigue failure is progressive
cracking that leads to fracture.
– If a crack forms from repeated loads, the crack
usually forms at a point of maximum stress.

tab
11.11 REPEATED LOADING, FATIGUE
• In a fatigue test, a specimen of the material is
loaded and unloaded until failure occurs.
– The repeated loading produces stress reversals or
large stress changes in either tension or compression.
• The lower the stress level the greater the number
of cycles before failure.
– In the test, the stress level is lowered in steps until
a level is reached where failure does not occur.
– That stress level is the fatigue strength/endurance limit.

tab
11.11 REPEATED LOADING, FATIGUE
• Nonferrous metals such as aluminum and
magnesium do not exhibit a fatigue strength.
– They must be tested until the number of cycles
(service life) the metal will be subjected to is reached.
For example, if an aluminum
member has a service life of
10^7 cycles, the maximum
stress would be 17.5 ksi
(121 MPa) without stress
concentrations.

tab
11.11 REPEATED LOADING, FATIGUE
• If handbook data are not available and stress
concentrations are not present, the fatigue
strength for ferrous materials may be taken
at approximately 50% of the tensile strength.
– For nonferrous metals, it must be lowered to
approximately 35%


![CMats Lect1-Axial Stress and Strain [Compatibility Mode]](https://img.pdfslide.net/doc/110x75/577d232a1a28ab4e1e992723/cmats-lect1-axial-stress-and-strain-compatibility-mode.jpg)