Embed Size (px)
Citation preview
1/11 Miscellaneous Sources 13.2.1-1
13.2.1 Paved Roads
13.2.1.1 General
Particulate emissions occur whenever vehicles travel over a paved surface such as a road
or parking lot. Particulate emissions from paved roads are due to direct emissions from vehicles
in the form of exhaust, brake wear and tire wear emissions and resuspension of loose material on
the road surface. In general terms, resuspended particulate emissions from paved roads originate
from, and result in the depletion of, the loose material present on the surface (i.e., the sur face
loading). In turn, that surface loading is continuously replenished by other sources. At industrial
sites, surface loading is replenished by spillage of material and trackout from unpaved roads and
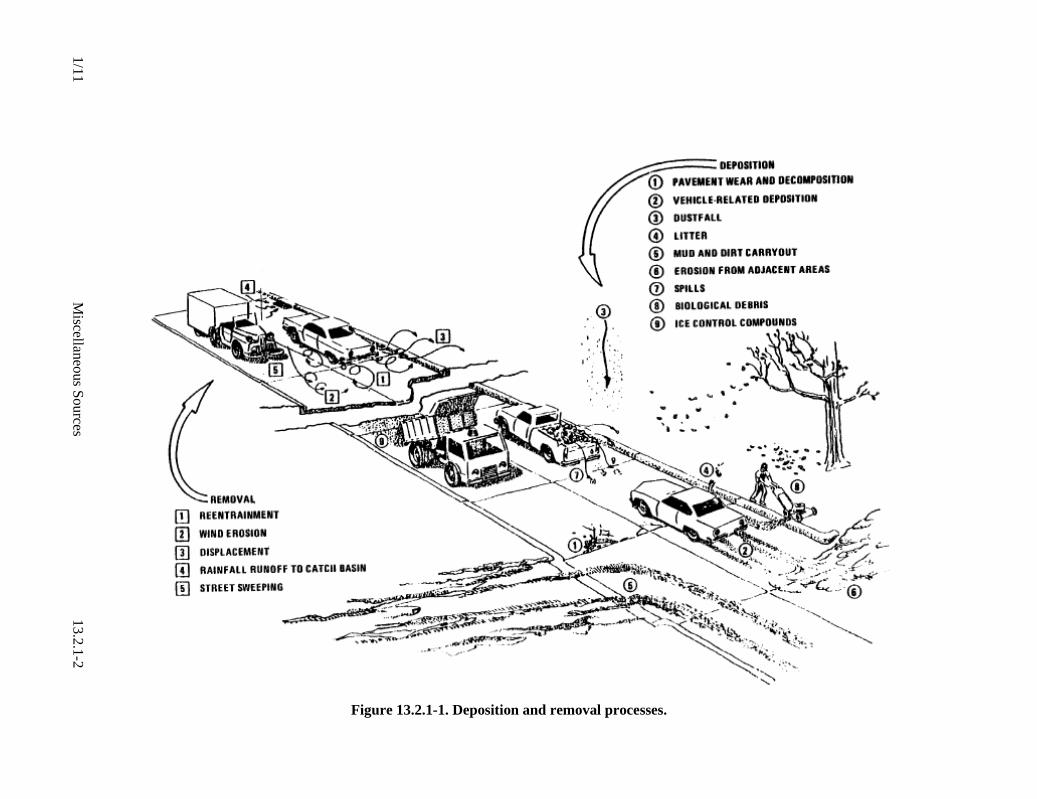
staging areas. Figure 13.2.1-1 illustrates several transfer processes occurring on public streets.
Various field studies have found that public streets and highways, as well as roadways at
industrial facilities, can be major sources of the atmospheric particulate matter within an area. 1-9
Of particular interest in many parts of the United States are the increased levels of emissions
from public paved roads when the equilibrium between deposition and removal processes is
upset. This situation can occur for various reasons, including application of granular materials
for snow and ice control, mud/dirt carryout from construction activities in the area, and
deposition from wind and/or water erosion of surrounding unstabilized areas. In the absence of
continuous addition of fresh material (through localized track out or application of antiskid
material), paved road surface loading should reach an equilibrium value in which the amount of
material resuspended matches the amount replenished. The equilibrium surface loading value
depends upon numerous factors. It is believed that the most important factors are: mean speed of
vehicles traveling the road; the average daily traffic (ADT); the number of lanes and ADT per lane;
the fraction of heavy vehicles (buses and trucks); and the presence/absence of curbs, storm
sewers and parking lanes.10
The particulate emission factors presented in a previous version of this section of AP-42,
dated October 2002, implicitly included the emissions from vehicles in the form of exhaust, brake
wear, and tire wear as well as resuspended road surface material. EPA included these sources in
the emission factor equation for paved roads since the field testing data used to develop the
equation included both the direct emissions from vehicles and emissions from resuspension of
road dust.
This version of the paved road emission factor equation only estimates particulate
emissions from resuspended road surface material28. The particulate emissions from vehicle
exhaust, brake wear, and tire wear are now estimated separately using EPA's MOVES 29 model.
This approach eliminates the possibility of double counting emissions. Double counting results
when employing the previous version of the emission factor equation in this section and MOVES
to estimate particulate emissions from vehicle traffic on paved roads. It also incorporates the
decrease in exhaust emissions that has occurred since the paved road emission factor equation was
developed. Earlier versions of the paved road emission factor equation includes estimates of
emissions from exhaust, brake wear, and tire wear based on emission rates for vehicles in the 1980
calendar year fleet. The amount of PM released from vehicle exhaust has decreased since 1980
due to lower new vehicle emission standards and changes in fuel characteristics.
13.2.1-2 EMISSION FACTORS 1/11
13.2.1.2 Emissions And Correction Parameters
Dust emissions from paved roads have been found to vary with what is termed the "silt
loading" present on the road surface. In addition, the average weight and speed of vehicles
traveling the road influence road dust emissions. The term silt loading (sL) refers to the mass of
silt-size material (equal to or less than 75 micrometers [µm] in physical diameter) per unit area of
the travel surface. The total road surface dust loading consists of loose material that can be
collected by broom sweeping and vacuuming of the traveled portion of the paved road. The silt
fraction is determined by measuring the proportion of the loose dry surface dust that passes through
a 200-mesh screen, using the ASTM-C-136 method. Silt loading is the product of the silt fraction
and the total loading, and is abbreviated "sL". Additional details on the sampling and analysis of
such material are provided in AP-42 Appendices C.1 and C.2.
The surface sL provides a reasonable means of characterizing seasonal variability in a paved
road emission inventory. In many areas of the country, road surface loadings 11-21 are heaviest
during the late winter and early spring months when the residual loading from snow/ice controls is
greatest. As noted earlier, once replenishment of fresh material is eliminated, the road surface
loading can be expected to reach an equilibrium value, which is substantially lower than the late
winter/early spring values.
1/1
1 M
iscellaneo
us S
ources 1
3.2
.1-2
Figure 13.2.1-1. Deposition and removal processes.
13.2.1-4 EMISSION FACTORS 1/11
13.2.1.3 Predictive Emission Factor Equations10,29
The quantity of particulate emissions from resuspension of loose material on the road surface
due to vehicle travel on a dry paved road may be estimated using the following empirical
expression:
E = k (sL)0.91 x (W)1.02 (1)
where: E = particulate emission factor (having units matching the units of k),
k = particle size multiplier for particle size range and units of interest (see below),
sL = road surface silt loading (grams per square meter) (g/m2), and
W = average weight (tons) of the vehicles traveling the road.
It is important to note that Equation 1 calls for the average weight of all vehicles traveling
the road. For example, if 99 percent of traffic on the road are 2 ton cars/trucks while the
remaining 1 percent consists of 20 ton trucks, then the mean weight "W" is 2.2 tons. More
specifically, Equation 1 is not intended to be used to calculate a separate emission factor for each
vehicle weight class. Instead, only one emission factor should be calculated to represent the
"fleet" average weight of all vehicles traveling the road.
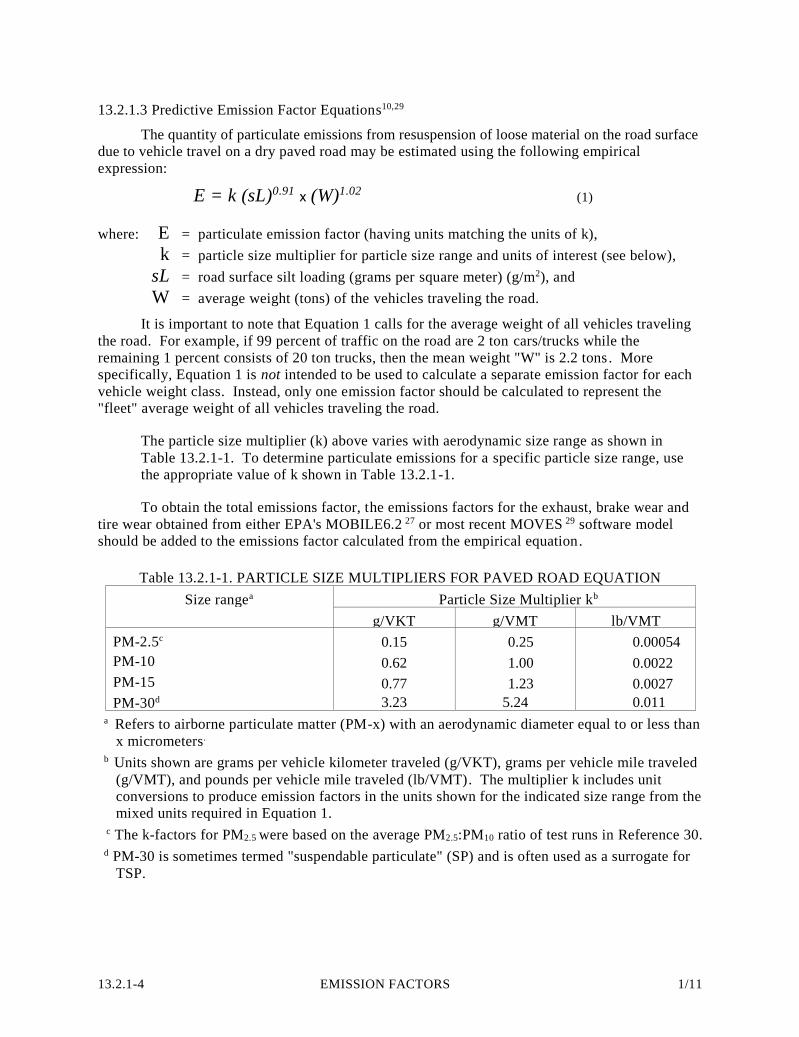
The particle size multiplier (k) above varies with aerodynamic size range as shown in
Table 13.2.1-1. To determine particulate emissions for a specific particle size range, use
the appropriate value of k shown in Table 13.2.1-1.
To obtain the total emissions factor, the emissions factors for the exhaust, brake wear and
tire wear obtained from either EPA's MOBILE6.2 27 or most recent MOVES 29 software model
should be added to the emissions factor calculated from the empirical equation.
Table 13.2.1-1. PARTICLE SIZE MULTIPLIERS FOR PAVED ROAD EQUATION
Size rangea Particle Size Multiplier kb
g/VKT g/VMT lb/VMT
PM-2.5c 0.15 0.25 0.00054
PM-10 0.62 1.00 0.0022
PM-15 0.77 1.23 0.0027
PM-30d 3.23 5.24 0.011 a Refers to airborne particulate matter (PM-x) with an aerodynamic diameter equal to or less than
x micrometers.
b Units shown are grams per vehicle kilometer traveled (g/VKT), grams per vehicle mile traveled
(g/VMT), and pounds per vehicle mile traveled (lb/VMT). The multiplier k includes unit
conversions to produce emission factors in the units shown for the indicated size range from the
mixed units required in Equation 1. c The k-factors for PM2.5 were based on the average PM2.5:PM10 ratio of test runs in Reference 30.
d PM-30 is sometimes termed "suspendable particulate" (SP) and is often used as a surrogate for
TSP.
1/11 Miscellaneous Sources 13.2.1-5
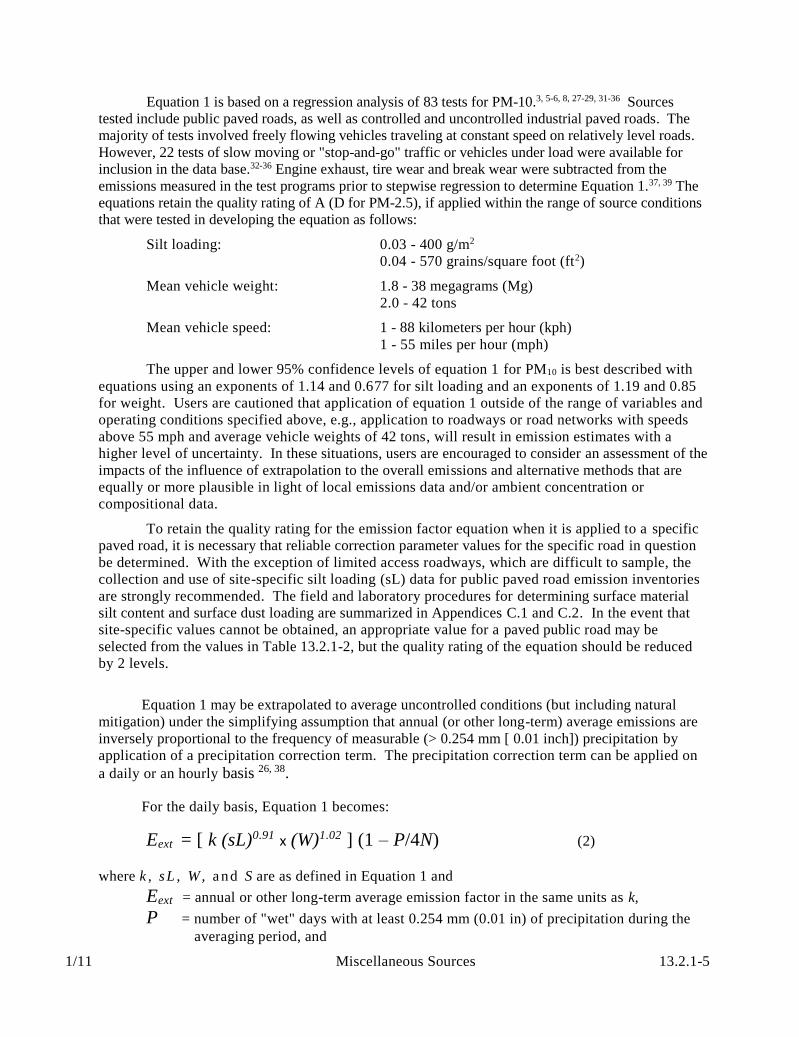
Equation 1 is based on a regression analysis of 83 tests for PM-10.3, 5-6, 8, 27-29, 31-36 Sources
tested include public paved roads, as well as controlled and uncontrolled industrial paved roads. The
majority of tests involved freely flowing vehicles traveling at constant speed on relatively level roads.
However, 22 tests of slow moving or "stop-and-go" traffic or vehicles under load were available for
inclusion in the data base.32-36 Engine exhaust, tire wear and break wear were subtracted from the
emissions measured in the test programs prior to stepwise regression to determine Equation 1.37, 39 The
equations retain the quality rating of A (D for PM-2.5), if applied within the range of source conditions
that were tested in developing the equation as follows:
Silt loading: 0.03 - 400 g/m2
0.04 - 570 grains/square foot (ft2)
Mean vehicle weight: 1.8 - 38 megagrams (Mg)
2.0 - 42 tons
Mean vehicle speed: 1 - 88 kilometers per hour (kph)
1 - 55 miles per hour (mph)
The upper and lower 95% confidence levels of equation 1 for PM10 is best described with
equations using an exponents of 1.14 and 0.677 for silt loading and an exponents of 1.19 and 0.85
for weight. Users are cautioned that application of equation 1 outside of the range of variables and
operating conditions specified above, e.g., application to roadways or road networks with speeds
above 55 mph and average vehicle weights of 42 tons, will result in emission estimates with a
higher level of uncertainty. In these situations, users are encouraged to consider an assessment of the
impacts of the influence of extrapolation to the overall emissions and alternative methods that are
equally or more plausible in light of local emissions data and/or ambient concentration or
compositional data.
To retain the quality rating for the emission factor equation when it is applied to a specific
paved road, it is necessary that reliable correction parameter values for the specific road in question
be determined. With the exception of limited access roadways, which are difficult to sample, the
collection and use of site-specific silt loading (sL) data for public paved road emission inventories
are strongly recommended. The field and laboratory procedures for determining surface material
silt content and surface dust loading are summarized in Appendices C.1 and C.2. In the event that
site-specific values cannot be obtained, an appropriate value for a paved public road may be
selected from the values in Table 13.2.1-2, but the quality rating of the equation should be reduced
by 2 levels.
Equation 1 may be extrapolated to average uncontrolled conditions (but including natural
mitigation) under the simplifying assumption that annual (or other long-term) average emissions are
inversely proportional to the frequency of measurable (> 0.254 mm [ 0.01 inch]) precipitation by
application of a precipitation correction term. The precipitation correction term can be applied on
a daily or an hourly basis 26, 38.
For the daily basis, Equation 1 becomes:
Eext = [ k (sL)0.91 x (W)1.02 ] (1 – P/4N) (2)
where k , sL , W, a nd S are as defined in Equation 1 and
Eext = annual or other long-term average emission factor in the same units as k,
P = number of "wet" days with at least 0.254 mm (0.01 in) of precipitation during the
averaging period, and
13.2.1-6 EMISSION FACTORS 1/11
N = number of days in the averaging period (e.g., 365 for annual, 91 for seasonal, 30
for monthly).
Note that the assumption leading to Equation 2 is based on analogy with the approach used to
develop long-term average unpaved road emission factors in Section 13.2.2. However, Equation 2
above incorporates an additional factor of "4" in the denominator to account for the fact that paved
roads dry more quickly than unpaved roads and that the precipitation may not occur over the
complete 24-hour day.
For the hourly basis, equation 1 becomes:
Eext = [ k (sL)0.91 x (W)1.02 ] (1 –1.2P/N) (3)
where k , sL , W, a nd S are as defined in Equation 1 and
E ext = annual or other long-term average emission factor in the same units as k,
P = number of hours with at least 0.254 mm (0.01 in) of precipitation during the
averaging period, and
N = number of hours in the averaging period (e.g., 8760 for annual, 2124 for
season 720 for monthly)
Note: In the hourly moisture correction term (1-1.2P/N) for equation 3, the 1.2 multiplier is
applied to account for the residual mitigative effect of moisture. For most applications, this
equation will produce satisfactory results. Users should select a time interval to include
sufficient "dry" hours such that a reasonable emissions averaging period is evaluated. For the
special case where this equation is used to calculate emissions on an hour by hour basis, such as
would be done in some emissions modeling situations, the moisture correction term should be
modified so that the moisture correction "credit" is applied to the first hours following cessation
of precipitation. In this special case, it is suggested that this 20% "credit" be applied on a basis of
one hour credit for each hour of precipitation up to a maximum of 12 hours.
Note that the assumption leading to Equation 3 is based on analogy with the approach
used to develop long-term average unpaved road emission factors in Section 13.2.2.
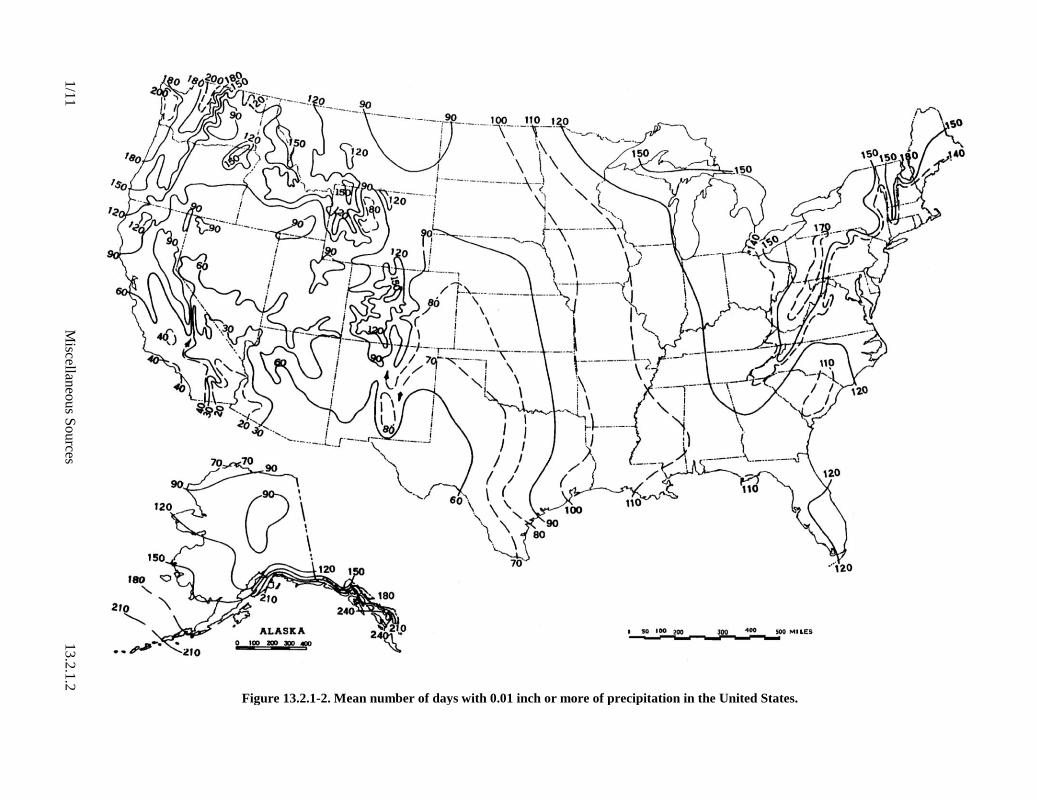
Figure 13.2.1-2 presents the geographical distribution of "wet" days on an annual basis for
the United States. Maps showing this information on a monthly basis are available in the Climatic
Atlas of the United States23 . Alternative sources include other Department of Commerce
publications (such as local climatological data summaries). The National Climatic Data Center
(NCDC) offers several products that provide hourly precipitation data. In particular, NCDC offers
Solar and Meteorological Surface Observation Network 1961-1990 (SAMSON) CD-ROM, which
contains 30 years worth of hourly meteorological data for first-order National Weather Service
locations. Whatever meteorological data are used, the source of that data and the averaging period
should be clearly specified.
It is emphasized that the simple assumption underlying Equations 2 and 3 has not been
verified in any rigorous manner. For that reason, the quality ratings for Equations 2 and 3 should
be downgraded one letter from the rating that would be applied to Equation 1.
1/1
1 M
iscellaneo
us S
ources 1
3.2
.1.2
Figure 13.2.1-2. Mean number of days with 0.01 inch or more of precipitation in the United States.
13.2.1-8 EMISSION FACTORS 1/11
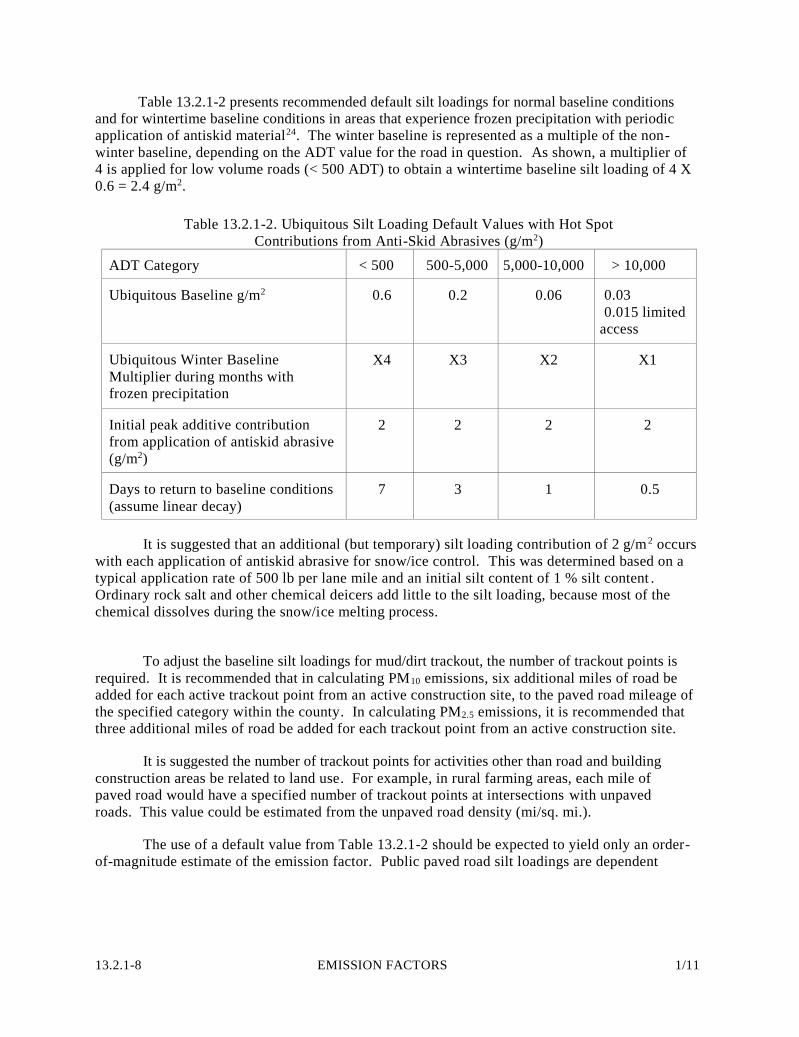
Table 13.2.1-2 presents recommended default silt loadings for normal baseline conditions
and for wintertime baseline conditions in areas that experience frozen precipitation with periodic
application of antiskid material24. The winter baseline is represented as a multiple of the non-
winter baseline, depending on the ADT value for the road in question. As shown, a multiplier of
4 is applied for low volume roads (< 500 ADT) to obtain a wintertime baseline silt loading of 4 X
0.6 = 2.4 g/m2.
Table 13.2.1-2. Ubiquitous Silt Loading Default Values with Hot Spot
Contributions from Anti-Skid Abrasives (g/m2)
ADT Category < 500 500-5,000 5,000-10,000 > 10,000
Ubiquitous Baseline g/m2 0.6 0.2 0.06 0.03
0.015 limited
access
Ubiquitous Winter Baseline
Multiplier during months with
frozen precipitation
X4 X3 X2 X1
Initial peak additive contribution
from application of antiskid abrasive
(g/m2)
2 2 2 2
Days to return to baseline conditions
(assume linear decay)
7 3 1 0.5
It is suggested that an additional (but temporary) silt loading contribution of 2 g/m 2 occurs
with each application of antiskid abrasive for snow/ice control. This was determined based on a
typical application rate of 500 lb per lane mile and an initial silt content of 1 % silt content .
Ordinary rock salt and other chemical deicers add little to the silt loading, because most of the
chemical dissolves during the snow/ice melting process.
To adjust the baseline silt loadings for mud/dirt trackout, the number of trackout points is
required. It is recommended that in calculating PM10 emissions, six additional miles of road be
added for each active trackout point from an active construction site, to the paved road mileage of
the specified category within the county. In calculating PM2.5 emissions, it is recommended that
three additional miles of road be added for each trackout point from an active construction site.
It is suggested the number of trackout points for activities other than road and building
construction areas be related to land use. For example, in rural farming areas, each mile of
paved road would have a specified number of trackout points at intersections with unpaved
roads. This value could be estimated from the unpaved road density (mi/sq. mi.).
The use of a default value from Table 13.2.1-2 should be expected to yield only an order-
of-magnitude estimate of the emission factor. Public paved road silt loadings are dependent
1/11 Miscellaneous Sources 13.2.1-9
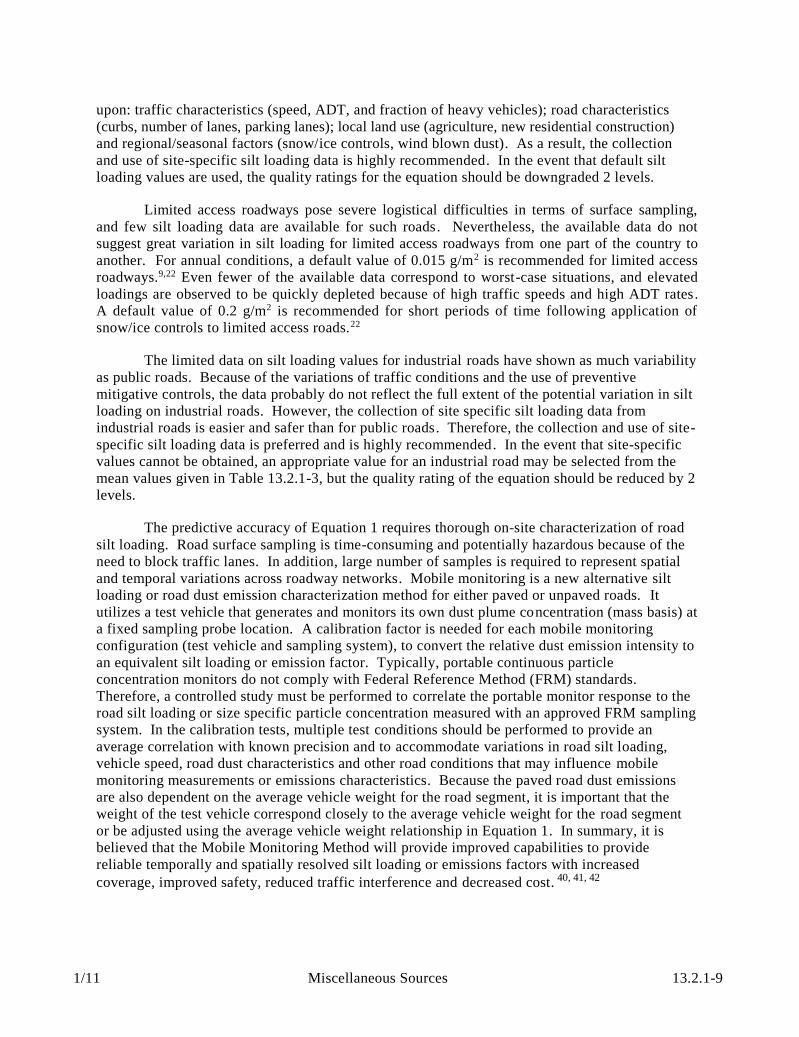
upon: traffic characteristics (speed, ADT, and fraction of heavy vehicles); road characteristics
(curbs, number of lanes, parking lanes); local land use (agriculture, new residential construction)
and regional/seasonal factors (snow/ice controls, wind blown dust). As a result, the collection
and use of site-specific silt loading data is highly recommended. In the event that default silt
loading values are used, the quality ratings for the equation should be downgraded 2 levels.
Limited access roadways pose severe logistical difficulties in terms of surface sampling,
and few silt loading data are available for such roads. Nevertheless, the available data do not
suggest great variation in silt loading for limited access roadways from one part of the country to
another. For annual conditions, a default value of 0.015 g/m2 is recommended for limited access
roadways.9,22 Even fewer of the available data correspond to worst-case situations, and elevated
loadings are observed to be quickly depleted because of high traffic speeds and high ADT rates.
A default value of 0.2 g/m2 is recommended for short periods of time following application of
snow/ice controls to limited access roads.22
The limited data on silt loading values for industrial roads have shown as much variability
as public roads. Because of the variations of traffic conditions and the use of preventive
mitigative controls, the data probably do not reflect the full extent of the potential variation in silt
loading on industrial roads. However, the collection of site specific silt loading data from
industrial roads is easier and safer than for public roads. Therefore, the collection and use of site-
specific silt loading data is preferred and is highly recommended. In the event that site-specific
values cannot be obtained, an appropriate value for an industrial road may be selected from the
mean values given in Table 13.2.1-3, but the quality rating of the equation should be reduced by 2
levels.
The predictive accuracy of Equation 1 requires thorough on-site characterization of road
silt loading. Road surface sampling is time-consuming and potentially hazardous because of the
need to block traffic lanes. In addition, large number of samples is required to represent spatial
and temporal variations across roadway networks. Mobile monitoring is a new alternative silt
loading or road dust emission characterization method for either paved or unpaved roads. It
utilizes a test vehicle that generates and monitors its own dust plume concentration (mass basis) at
a fixed sampling probe location. A calibration factor is needed for each mobile monitoring
configuration (test vehicle and sampling system), to convert the relative dust emission intensity to
an equivalent silt loading or emission factor. Typically, portable continuous particle
concentration monitors do not comply with Federal Reference Method (FRM) standards.
Therefore, a controlled study must be performed to correlate the portable monitor response to the
road silt loading or size specific particle concentration measured with an approved FRM sampling
system. In the calibration tests, multiple test conditions should be performed to provide an
average correlation with known precision and to accommodate variations in road silt loading,
vehicle speed, road dust characteristics and other road conditions that may influence mobile
monitoring measurements or emissions characteristics. Because the paved road dust emissions
are also dependent on the average vehicle weight for the road segment, it is important that the
weight of the test vehicle correspond closely to the average vehicle weight for the road segment
or be adjusted using the average vehicle weight relationship in Equation 1. In summary, it is
believed that the Mobile Monitoring Method will provide improved capabilities to provide
reliable temporally and spatially resolved silt loading or emissions factors with increased
coverage, improved safety, reduced traffic interference and decreased cost. 40, 41, 42
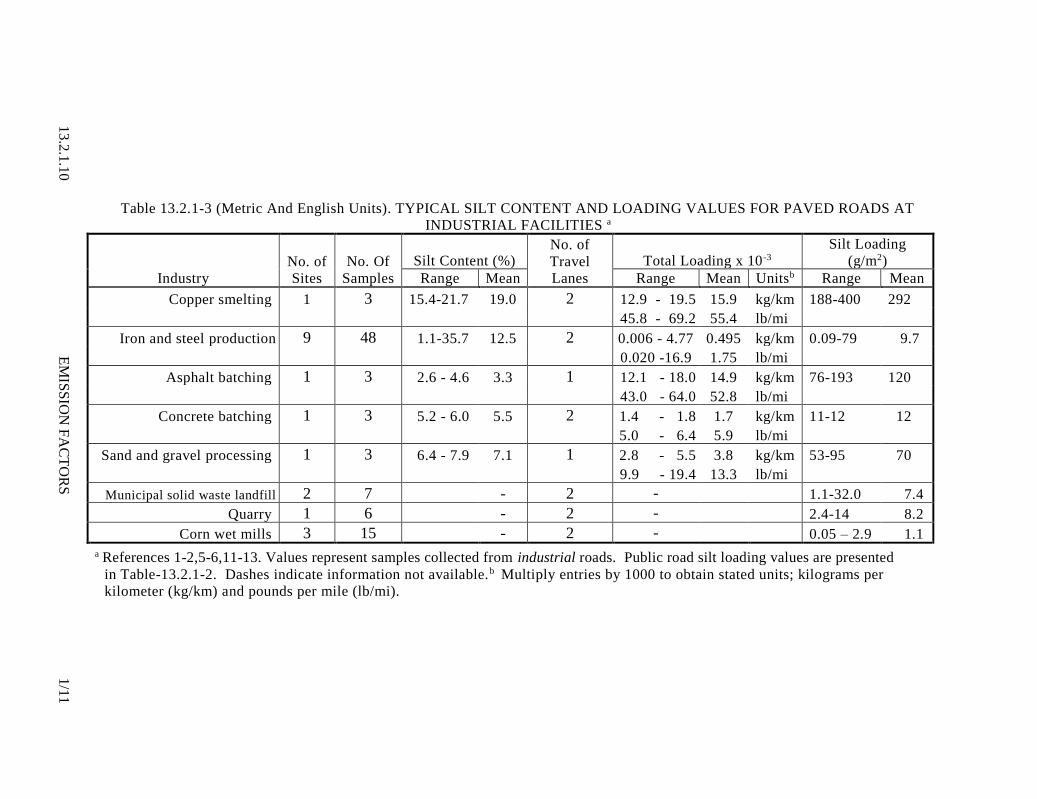
Table 13.2.1-3 (Metric And English Units). TYPICAL SILT CONTENT AND LOADING VALUES FOR PAVED ROADS AT
INDUSTRIAL FACILITIES a
Industry No. of
Sites No. Of
Samples Silt Content (%)
No. of
Travel
Lanes Total Loading x 10-3
Silt Loading
(g/m2) Range Mean Range Mean Unitsb Range Mean
Copper smelting 1 3 15.4-21.7 19.0 2 12.9 - 19.5 15.9 kg/km 188-400 292
45.8 - 69.2 55.4 lb/mi
Iron and steel production 9 48 1.1-35.7 12.5 2 0.006 - 4.77 0.495 kg/km 0.09-79 9.7
0.020 -16.9 1.75 lb/mi
Asphalt batching 1 3 2.6 - 4.6 3.3 1 12.1 - 18.0 14.9 kg/km 76-193 120
43.0 - 64.0 52.8 lb/mi
Concrete batching 1 3 5.2 - 6.0 5.5 2 1.4 - 1.8 1.7 kg/km 11-12 12 5.0 - 6.4 5.9 lb/mi
Sand and gravel processing 1 3 6.4 - 7.9 7.1 1 2.8 - 5.5 3.8 kg/km 53-95 70 9.9 - 19.4 13.3 lb/mi
Municipal solid waste landfill 2 7 - 2 - 1.1-32.0 7.4
Quarry 1 6 - 2 - 2.4-14 8.2
Corn wet mills 3 15 - 2 - 0.05 – 2.9 1.1 a References 1-2,5-6,11-13. Values represent samples collected from industrial roads. Public road silt loading values are presented
in Table-13.2.1-2. Dashes indicate information not available.b Multiply entries by 1000 to obtain stated units; kilograms per
kilometer (kg/km) and pounds per mile (lb/mi).
13.2
.1.1
0 E
MIS
SIO
N F
AC
TO
RS
1/1
1
1/11 Miscellaneous Sources 13.2.1-11
13.2.1.4 Controls6,25
Because of the importance of the silt loading, control techniques for paved roads attempt
either to prevent material from being deposited onto the surface (preventive controls) or to
remove from the travel lanes any material that has been deposited (mitigative controls). Covering
of loads in trucks, and the paving of access areas to unpaved lots or construction sites, are examples
of preventive measures. Examples of mitigative controls include vacuum sweeping, water
flushing, and broom sweeping and flushing. Actual control efficiencies for any - of these
techniques can be highly variable. Locally measured silt loadings before and after the application
of controls is the preferred method to evaluate controls. It is particularly important to note that
street sweeping of gutters and curb areas may actually increase the silt loading on the traveled
portion of the road. Redistribution of loose material onto the travel lanes will actually produce a
short-term increase in the emissions.
In general, preventive controls are usually more cost effective than mitigative controls .
The cost-effectiveness of mitigative controls falls off dramatically as the size of an area to be
treated increases. The cost-effectiveness of mitigative measures is also unfavorable if only a
short period of time is required for the road to return to equilibrium silt loading condition . That is
to say, the number and length of public roads within most areas of interest preclude any
widespread and routine use of mitigative controls. On the other hand, because of the more
limited scope of roads at an industrial site, mitigative measures may be used quite successfully
(especially in situations where truck spillage occurs). Note, however, that public agencies could
make effective use of mitigative controls to remove sand/salt from roads after the winter ends.
Because available controls will affect the silt loading, controlled emission factors may be
obtained by substituting controlled silt loading values into the equation. (Emission factors from
controlled industrial roads were used in the development of the equation.) The collection of
surface loading samples from treated, as well as baseline (untreated), roads provides a means to
track effectiveness of the controls over time. The use of Mobile Monitoring Methodologies
provide an improved means to track progress in controlling silt loading values.
13.2.1.5 Changes since Fifth Edition
The following changes were made since the publication of the Fifth Edition of AP-42:
October 2002
1) The particle size multiplier for PM2.5 was revised to 25% of PM10. The approximately
55% reduction was a result of emission testing using FRM monitors. The monitoring
was specifically intended to evaluate the PM-2.5 component of the emissions.
2) Default silt loading values were included in Table 13.2.1-2 replacing the Tables
and Figures containing silt loading statistical information.
3) Editorial changes within the text were made indicating the possible causes of
variations in the silt loading between roads within and among different locations.
The uncertainty of using the default silt loading value was discussed.
13.2.1-12 EMISSION FACTORS 1/11
4) Section 13.2.1.1 was revised to clarify the role of dust loading in
resuspension. Additional minor text changes were made.
5) Equations 2 and 3, Figure 13.2.1-2, and text were added to incorporate natural
mitigation into annual or other long-term average emission factors.
December 2003
1) The emission factor equation was adjusted to remove the component of particulate
emissions- from exhaust, brake wear, and tire wear. A parameter C representing these
emissions was included in the predictive equation. The parameter C varied with
aerodynamic size range of the particulate matter. Table 13.2.1-2 was added to
present the new coefficients.
2) The default silt loading values in Table 13.2.1-3 were revised to incorporate the
results from a recent analysis of silt loading data.
November 2006
1) The PM2.5 particle size multiplier was revised to 15% of PM10 as the result of
wind tunnel studies of a variety of dust emitting surface materials.
2) References were rearranged and renumbered.
January 2011
1) The empirical predictive equation was revised. The revision is based upon stepwise
regression of 83 profile emissions tests and an adjustment of individual test data for
the exhaust; break wear and tire wear emissions prior to regression of the data.
2) The C term is removed from the empirical predictive equation and Table 13.2.1-2
with the C term values is removed since the exhaust; break wear and tire wear
emissions were no longer part of the regressed data.
3) The PM2.5 particle size multiplier was revised to 25% of PM10 since the PM10 test
data used to develop the equation did not meet the necessary PM10 concentrations for
a ratio of 15%.
4) The lower speed of the vehicle speed range supported by the empirical predictive
equation was revised to 1 mph.
5) Information was added on an improved methodology to develop spatially and
temporally resolved silt loadings or emissions factors by Mobile Monitoring
Methodologies.
References For Section 13.2.1
1. D. R. Dunbar, Resuspension Of Particulate Matter, EPA-450/2-76-031, U. S.
Environmental Protection Agency, Research Triangle Park, NC, March 1976.
2. R. Bohn, et al., Fugitive Emissions From Integrated Iron And Steel Plants, EPA-600/2-78-
050, U. S. Environmental Protection Agency, Cincinnati, OH, March 1978.
1/11 Miscellaneous Sources 13.2.1.13
3. C. Cowherd, Jr., et al., Iron And Steel Plant Open Dust Source Fugitive Emission
Evaluation, EPA-600/2-79-103, U. S. Environmental Protection Agency, Cincinnati, OH,
May 1979.
4. C. Cowherd, Jr., et al., Quantification Of Dust Entrainment From Paved Roadways, EPA-
450/3-77-027, U. S. Environmental Protection Agency, Research Triangle Park, NC, July
1977.
5. Size Specific Particulate Emission Factors For Uncontrolled Industrial And Rural Roads,
EPA Contract No. 68-02-3158, Midwest Research Institute, Kansas City, MO, September
1983.
6. T. Cuscino, Jr., et al., Iron And Steel Plant Open Source Fugitive Emission Control
Evaluation, EPA-600/2-83-110, U. S. Environmental Protection Agency, Cincinnati, OH,
October 1983.
7. J. P. Reider, Size-specific Particulate Emission Factors For Uncontrolled Industrial And
Rural Roads, EPA Contract 68-02-3158, Midwest Research Institute, Kansas City, MO,
September 1983.
8. C. Cowherd, Jr., and P. J. Englehart, Paved Road Particulate Emissions, EPA-600/7-84-
077, U. S. Environmental Protection Agency, Cincinnati, OH, July 1984.
9. C. Cowherd, Jr., and P. J. Englehart, Size Specific Particulate Emission Factors For
Industrial And Rural Roads, EPA-600/7-85-051, U. S. Environmental Protection Agency,
Cincinnati, OH, October 1985.
10. Emission Factor Documentation For AP-42, Sections 11.2.5 and 11.2.6 — Paved Roads,
EPA Contract No. 68-D0-0123, Midwest Research Institute, Kansas City, MO, March 1993.
11. Evaluation Of Open Dust Sources In The Vicinity Of Buffalo, New York, EPA Contract
No. 68-02-2545, Midwest Research Institute, Kansas City, MO, March 1979.
12. PM-10 Emission Inventory Of Landfills In The Lake Calumet Area, EPA Contract
No. 68-02-3891, Midwest Research Institute, Kansas City, MO, September 1987.
13. Chicago Area Particulate Matter Emission Inventory — Sampling And Analysis, Contract
No. 68-02-4395, Midwest Research Institute, Kansas City, MO, May 1988.
14. Montana Street Sampling Data, Montana Department Of Health And Environmental
Sciences, Helena, MT, July 1992.
15. Street Sanding Emissions And Control Study, PEI Associates, Inc., Cincinnati, OH,
October 1989.
16. Evaluation Of PM-10 Emission Factors For Paved Streets, Harding Lawson Associates,
Denver, CO, October 1991.
17. Street Sanding Emissions And Control Study, RTP Environmental Associates, Inc., Denver,
CO, July 1990.
13.2.1-14 EMISSION FACTORS 1/11
18. Post-storm Measurement Results — Salt Lake County Road Dust Silt Loading Winter
1991/92 Measurement Program, Aerovironment, Inc., Monrovia, CA, June 1992.
19. Written communication from Harold Glasser, Department of Health, Clark County (NV).
20. PM-10 Emissions Inventory Data For The Maricopa And Pima Planning Areas, EPA
Contract No. 68-02-3888, Engineering-Science, Pasadena, CA, January 1987.
21. Characterization Of PM-10 Emissions From Antiskid Materials Applied To Ice- And Snow-
Covered Roadways, EPA Contract No. 68-D0-0137, Midwest Research Institute, Kansas
City, MO, October 1992.
22. C. Cowherd, Background Document for Revisions to Fine Fraction Ratios Used for AP-42
Fugitive Dust Emission Factors. Prepared by Midwest Research Institute for Western
Governors Association, Western Regional Air Partnership, Denver, CO, February 1, 2006.
23. Climatic Atlas Of The United States, U.S. Department of Commerce, Washington, D.C.,
June 1968.
24. C. Cowherd, Jr., et al., Improved Activity Levels for National Emission Inventories of
Fugitive Dust from Paved and Unpaved Roads, Presented at the 11th International Emission
Inventory Conference, Atlanta, Georgia, April 2002.
25. C. Cowherd, Jr., et al., Control Of Open Fugitive Dust Sources, EPA-450/3-88-008, U.
S. Environmental Protection Agency, Research Triangle Park, NC, September 1988.
26. Written communication (Technical Memorandum) from G. Muleski, Midwest Research
Institute, Kansas City, MO, to B. Kuykendal, U. S. Environmental Protection Agency,
Research Triangle Park, NC, September 27, 2001.
27. EPA, 2002b. MOBILE6 User Guide, United States Environmental Protection Agency,
Office of Transportation and Air Quality. EPA420-R-02-028, October 2002.
28. Written communication (Technical Memorandum) from P. Hemmer, E.H. Pechan &
Associates, Inc., Durham, NC to B. Kuykendal, U. S. Environmental Protection Agency,
Research Triangle Park, NC, August, 21, 2003.
29. EPA, 2009, MOVES2010 User Guide, United States Environmental Protection Agency,
Office of Transportation and Air Quality. EPA420B-09-041, December 2009.
30. Fugitive Particulate Matter Emissions, U.S. Environmental Protection Agency,
Research Triangle Park, NC, Midwest Research Institute Project No. 4604-06, April 15,
1997.
31. Midwest Research Institute, Roadway Emissions Field Tests at U.S. Steel’s Fairless
Works, U.S. Steel Corporation, Fairless Hills, PA, USX Purchase Order No. 146-
0001191-0068, May 1990.
1/11 Miscellaneous Sources 13.2.1.15
32. Paved Road Modifications to AP-42, Background Documentation For Corn Refiners
Association, Inc. Washington, DC 20006, Midwest Research Institute Project No.
310842, May 20, 2008.
33. Emission Tests of Paved Road Traffic at Minnesota Corn Processors Marshall,
Minnesota Facility, McVehil-Monnett Associates, Midwest Research Institute Project
No. 310212.1.001, July 6, 2001.
34. Emission Tests of Paved Road Traffic at Minnesota Corn Processors Columbus,
Nebraska Facility, McVehil-Monnett Associates, Midwest Research Institute Project
No. 310212.1.002. July 13, 2001.
35. Emission Tests of Paved Road Traffic at Cargill Sweeteners North America Blair,
Nebraska Facility, McVehil-Monnett Associates, Midwest Research Institute Project
No. 310395.1.001. November 27, 2002.
36. Emission Tests of Paved Road Traffic at ADM’s Marshall, Minnesota Facility,
McVehil-Monnett Associates, Midwest Research Institute Project No. 310479.1.001.
December 5, 2003.
37. E-mail communication between Ron Myers of EPA/OAQPS/SPPD/MPG, RTP, NC and
Prashanth Gururaja and Ed Glover of EPA/OTAQ/ASD/HDOC re. Diesel exhaust, tire
and brake wear for low speed stop and go traffic; January 2009 through May 2009.
38. Technical Memorandum from William B. Kuykendal to File, Subject: Decisions on
Final AP-42 Section 13.2.1 “Paved Roads”, October 10, 2002.
39. E-mail communication between Ron Myers of EPA/OAQPS/SPPD/MPG, RTP, NC and
Gary Dolce and Rudolph Kapichak of EPA/OTAQ/ASD/HDOC re. Paved Road Test
Data; October 12, 2010 through December 16, 2010.
40. C. Cowherd, Mobile Monitoring Method Specifications, Prepared by Midwest Research
Institute for Clark County Department of Air Quality and Environmental Management,
Las Vegas, NV, February 6, 2009.
41. C. Cowherd, Technical Support Document for Mobile Monitoring Technologies,
Prepared by Midwest Research Institute for Clark County Department of Air Quality
and Environmental Management, Las Vegas, NV, January 9, 2009.
42. R. Langston, R. S. Merle Jr., et al.,Clark County (Nevada) Paved Road Dust Emission
Studies in Support of Mobile Monitoring Technologies, Clark County Department of
Air Quality and Environmental Management, Las Vegas, NV, December 22, 2008.
43. Midwest Research Institute; Analysis of the Fine Fraction of Particulate Matter in
Fugitive Dust; Western Governors’ Association - Western Regional Air Partnership
(WRAP); October 12, 2005.