Embed Size (px)
Citation preview

11/28/2017
1
MET 4532
Lecture 37Final Exam Review6‐8 December 2017
Cyclone Tracy• Formed on 20DEC74, 500
km NE of Darwin• Became visible on Darwin
Radar on the 22nd as a 50 m/s cyclone
• Slowed and tracked around Bathurst Is
• Moved over shallow warm water
• Intensified and turned toward Darwin late on the 23rd and 24th
• Landfall Christmas morning
David & Frederic in 1979• David passed by Miami as a CAT 1
• First real threat since Betsy
• Last direct experience before Andrew
• Killed 12 in the US and did $1.5B (1979) in damage
• Killed ~2000 on Hispaniola
• Frederic struck Mobile AL 13SEP79 as a CAT 3
• Killed only 5 in the US, but did $2.3 B (1979) in damage
Hurricane Hugo in 1989• Cape Verde Hurricane
• Intensified in the Atlantic
• N42RF nearly lost in Caribbean
• Struck Guadeloupe, Leeward Is., St. Croix, & eastern Puerto Rico
• Weakened, but then intensified rapidly before landfall N. of Charleston SC. – $7B in US damage ($10B
total)
– ~50 deaths

11/28/2017
2
Last Sweep of the Miami WSR-57 Impacts• Damage in S. Florida $25 B• Homes
– 25,524 destroyed– 101,241 damaged
• Damage in Louisiana: $1B• Deaths
– Bahamas: 3 direct, 1 indirect (4)– Florida: 15 direct, 26 indirect (41)– Louisiana: 8 direct, 9 indirect (17)– Total 26 direct, 36 indirect (62)
• Closure of Homestead AFB
9
Memorable Hurricanes of 2004
Hurricane Dates Damage (US) Deaths (US)
Charlie (4) 9-14 AUG $14B 10
Ivan (4) 2-24 SEP $13B 25
Frances (2)25 AUG-10
SEP$9B 7
Jeanne (3) 13-28SEP $8-11B 6
10
Memorable Hurricanes of 2005
Hurricane Dates Damage Deaths
Dennis (4) 4-13 JUL $5-9B 32
Katrina (5) 23-31AUG $70-130B ~1500
Rita (5) 17-26SEP $8-11B 6
Wilma (5) 15-25OCT $12-20B 5
11
Role of the Loop CurrentAfter 2005
Year TS HH MH Comments
2006 10 5 2 Zeta in Dec & Jan, Weak El Niño
2007 15 5 2 Dean & Felix CAT 5 in Caribbean
2008 16 8 5Gustav and Ike hit the US Gulf Coast . All TCs affected land
2009 9 3 2Most TCs stayed at sea. Weak El Niño
2010 19 12 5 No US landfalls
2011 18 7 3Irene affected NE US. Active season
2012 20 10 1 Isaac & Sandy
All seasons (except 2013 and 2014) were active by historical standards, but with relatively few US landfalls

11/28/2017
3
2013-2015 Seasons• Worldwide, 2013 was inactive and then became
very active.• Typhoon Haiyan, Extreme CAT 5, LF in Southern Philippines, >
2500 dead
• Atlantic 2014 season was near normal (8,6,2)– All storms affected land– ACE = 67 compared with 1980-2010 median of 92– Deaths 17, Damage U$ 233M
• The 2015 Atlantic season was also near normal (11, 3, 2 as of 19 NOV 15)– El Niño. ACE 55% of normal on 19 NOV 15– Hurricane Joaquin (Cat 4) sank MV El Faro – 33 mariners lost in CAT 4 conditions
• Eastern-Pacific Hurricane Patricia intensified rapidly before landfall in Mexico– Set a record for the lowest Western Hemisphere
sea-level pressure 890 hPa. – EASTPAC ACE 184% of normal before Patricia
13
El Faro
14
2016 Season• La Niña (sort of)• Predicted to have
above-average activity• Produced:
– 15 Named storms– 8 Hurricanes– 3 Major hurricanes– US landfalls by
Hermine and Matthew• Killed 1739, mostly in
Haiti • US impacts ~$7B, 53
deaths• Total $11B, 1365,
mostly in Haiti• Late season Otto in W
Caribbean
15 16
17 18

11/28/2017
4
Emanuel Cycle
20
North Atlantic Tropical Cyclones
North Atlantic TCs by Year
21
Great Ocean Conveyor Belt
Currents in the Atlantic account for¼ - 1/3 of the Northern-Hemispherepoleward heat transport
Deaths 1900‐2005
Respite 1970-2003
Deaths 1900-2008
Drowning in fresh water floods accounted for 60%of hurricane related deaths 1970‐2004
Inflation‐Adjusted Damage 1900‐2005
Doubling times1900‐2000: 17.5 yr1900‐2005: 14.2 yr
11/28/2017
5
Everybody wants a view like thisNormalized Damage 1900‐2005
1900-2000 ½ x time: 126 yr1900-2005 2 x time: 217 yrMeans1900-2000: $5225M1900-2005: $7351M
Human Impact
• Injury and death, of course• Immediate destruction of property and
homes• Institutions and businesses already
under stress relocate or close (Homestead AFB)
• Impacts fall disproportionately on people made vulnerable by:
– Health– Gender– Economic status
• Examples – Manufactured or “legacy” housing– Aged and infirm– Retirees on fixed incomes– Single women with children– Minimum wage, temporary, or seasonal
workers– Immigrants– Poorly trained or uneducated
Breaching the Building Envelope Adds Internal Pressure to External Suction
Structural Failure(s)
• Shingles or roof tiles fail
• Rainwater enters
• Windows, entryway doors & garage doors
• Soffits blow upward
• Interior walls collapse
• Roof sheathing blows off
• More rainwater enters
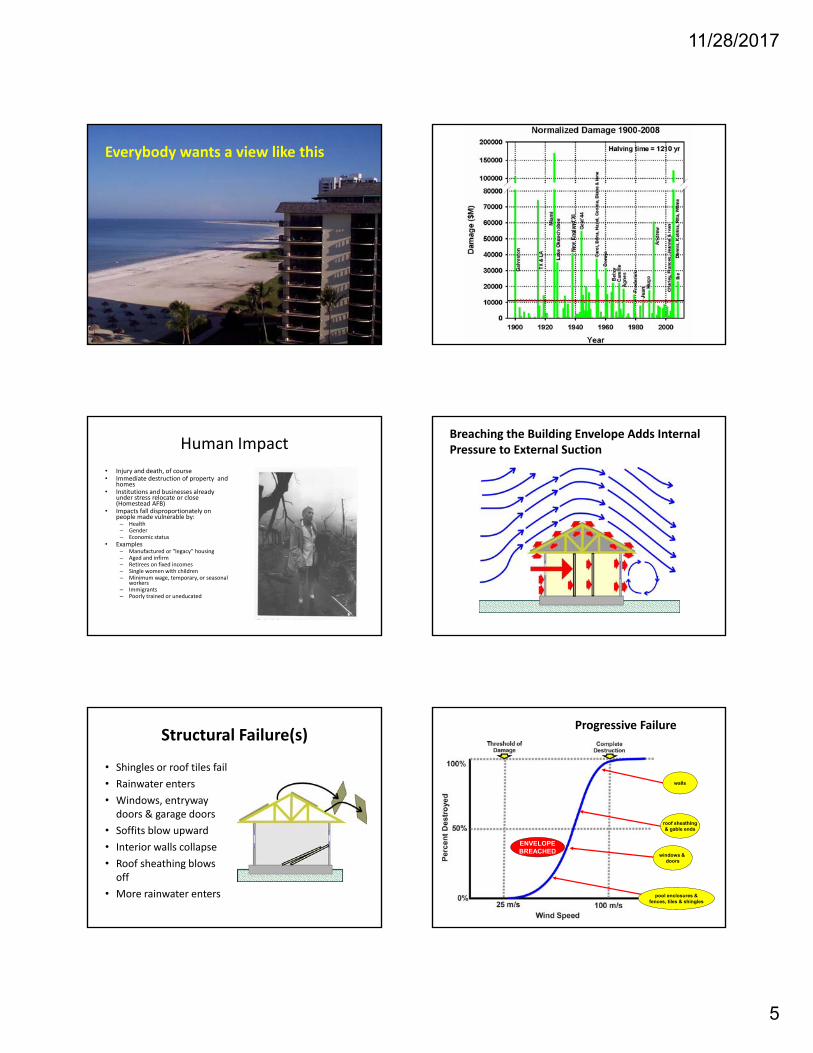
Progressive Failure
windows & doors
pool enclosures &fences, tiles & shingles
roof sheathing& gable ends
walls
ENVELOPEBREACHED

11/28/2017
6
Structure of a Catastrophe (CAT) Model
Reinsurance is Used to Transfer Risk
1%-0.5%
33